Embed Size (px)
Citation preview
1
Investigation 11A Plate Tectonics
11A Plate TectonicsWhat is plate tectonics?
A Setting upPart 1: Reading a bathymetric map
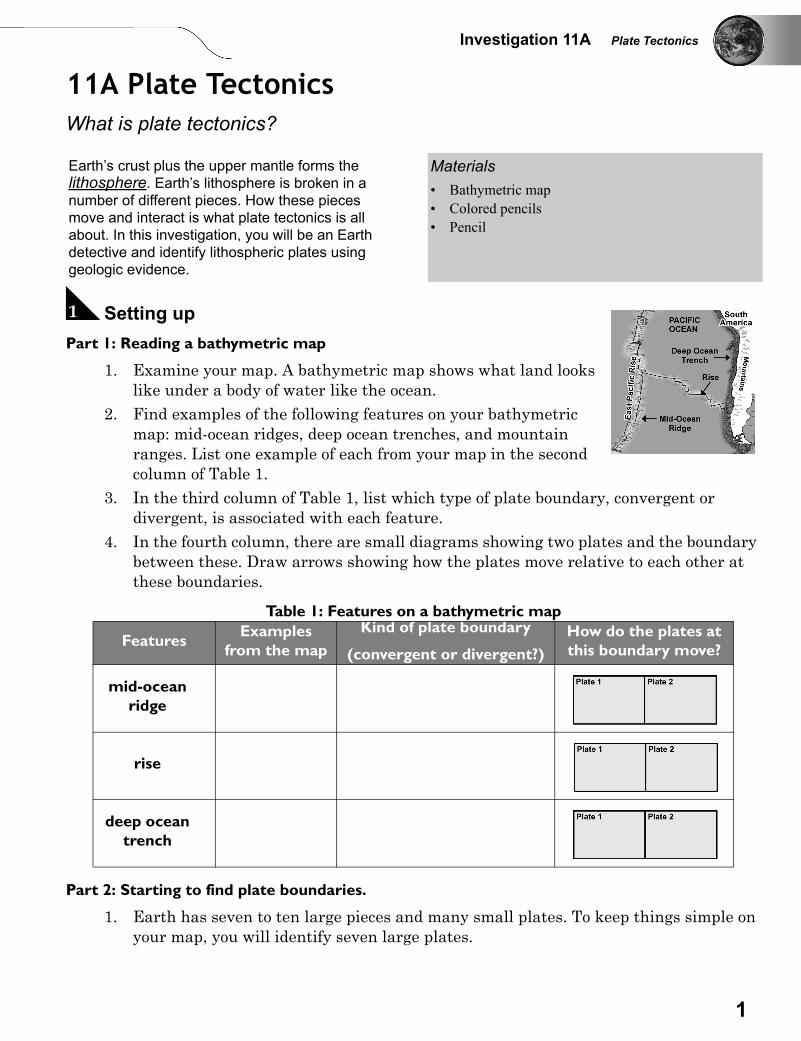
1. Examine your map. A bathymetric map shows what land looks like under a body of water like the ocean.
2. Find examples of the following features on your bathymetric map: mid-ocean ridges, deep ocean trenches, and mountain ranges. List one example of each from your map in the second column of Table 1.
3. In the third column of Table 1, list which type of plate boundary, convergent or divergent, is associated with each feature.
4. In the fourth column, there are small diagrams showing two plates and the boundary between these. Draw arrows showing how the plates move relative to each other at these boundaries.
Part 2: Starting to find plate boundaries.
1. Earth has seven to ten large pieces and many small plates. To keep things simple on your map, you will identify seven large plates.
Earth’s crust plus the upper mantle forms the lithosphere. Earth’s lithosphere is broken in a number of different pieces. How these pieces move and interact is what plate tectonics is all about. In this investigation, you will be an Earth detective and identify lithospheric plates using geologic evidence.
Materials• Bathymetric map• Colored pencils• Pencil
Table 1: Features on a bathymetric map
Features Examples from the map
Kind of plate boundary
(convergent or divergent?)How do the plates at this boundary move?
mid-ocean ridge
rise
deep ocean trench
2
2. Keep in mind that mid-ocean ridges, deep ocean trenches, and mountain ranges are all geologic features that are formed at tectonic plate boundaries.
3. With your pencil, draw a single line along the mid-ocean ridges, deep ocean trenches, rises, and mountain ranges. Draw your lines along the center of each of these features. Your lines represent the boundaries between tectonic plates.
Part 3: Using earthquake activity to find plate boundaries
1. Once you have identified all of the mid-ocean ridges, deep ocean trenches, and mountain ranges, you may notice that many of your lines may not connect. Complete the following steps to help fill in some of the missing parts of your plate boundaries.
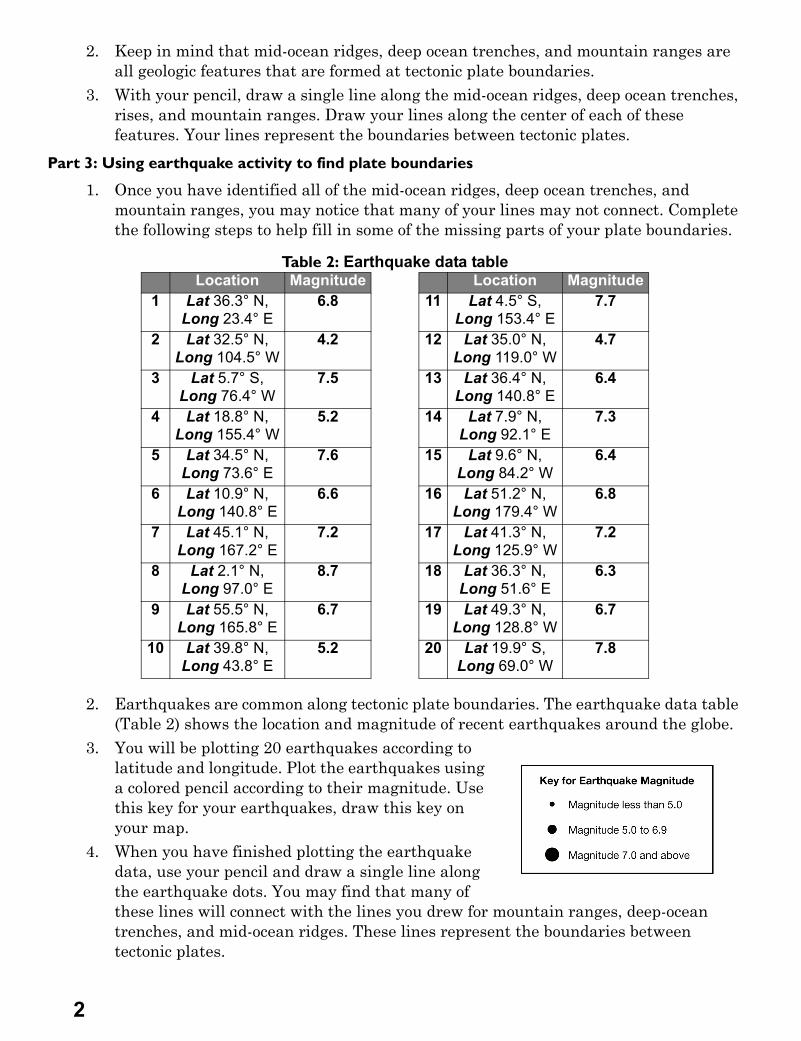
2. Earthquakes are common along tectonic plate boundaries. The earthquake data table (Table 2) shows the location and magnitude of recent earthquakes around the globe.
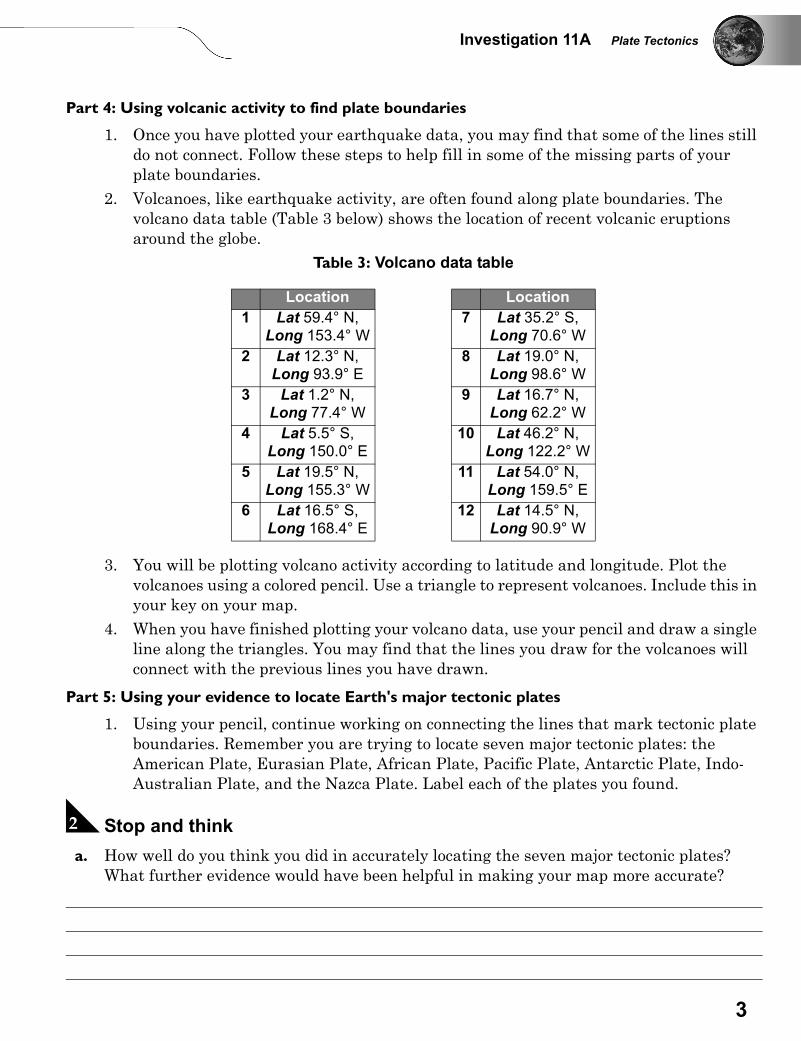
3. You will be plotting 20 earthquakes according to latitude and longitude. Plot the earthquakes using a colored pencil according to their magnitude. Use this key for your earthquakes, draw this key on your map.
4. When you have finished plotting the earthquake data, use your pencil and draw a single line along the earthquake dots. You may find that many of these lines will connect with the lines you drew for mountain ranges, deep-ocean trenches, and mid-ocean ridges. These lines represent the boundaries between tectonic plates.
Table 2: Earthquake data tableLocation Magnitude Location Magnitude
1 Lat 36.3° N, Long 23.4° E
6.8 11 Lat 4.5° S, Long 153.4° E
7.7
2 Lat 32.5° N, Long 104.5° W
4.2 12 Lat 35.0° N, Long 119.0° W
4.7
3 Lat 5.7° S, Long 76.4° W
7.5 13 Lat 36.4° N, Long 140.8° E
6.4
4 Lat 18.8° N, Long 155.4° W
5.2 14 Lat 7.9° N, Long 92.1° E
7.3
5 Lat 34.5° N, Long 73.6° E
7.6 15 Lat 9.6° N, Long 84.2° W
6.4
6 Lat 10.9° N, Long 140.8° E
6.6 16 Lat 51.2° N, Long 179.4° W
6.8
7 Lat 45.1° N, Long 167.2° E
7.2 17 Lat 41.3° N, Long 125.9° W
7.2
8 Lat 2.1° N, Long 97.0° E
8.7 18 Lat 36.3° N, Long 51.6° E
6.3
9 Lat 55.5° N, Long 165.8° E
6.7 19 Lat 49.3° N, Long 128.8° W
6.7
10 Lat 39.8° N, Long 43.8° E
5.2 20 Lat 19.9° S, Long 69.0° W
7.8
3
Investigation 11A Plate Tectonics
Part 4: Using volcanic activity to find plate boundaries
1. Once you have plotted your earthquake data, you may find that some of the lines still do not connect. Follow these steps to help fill in some of the missing parts of your plate boundaries.
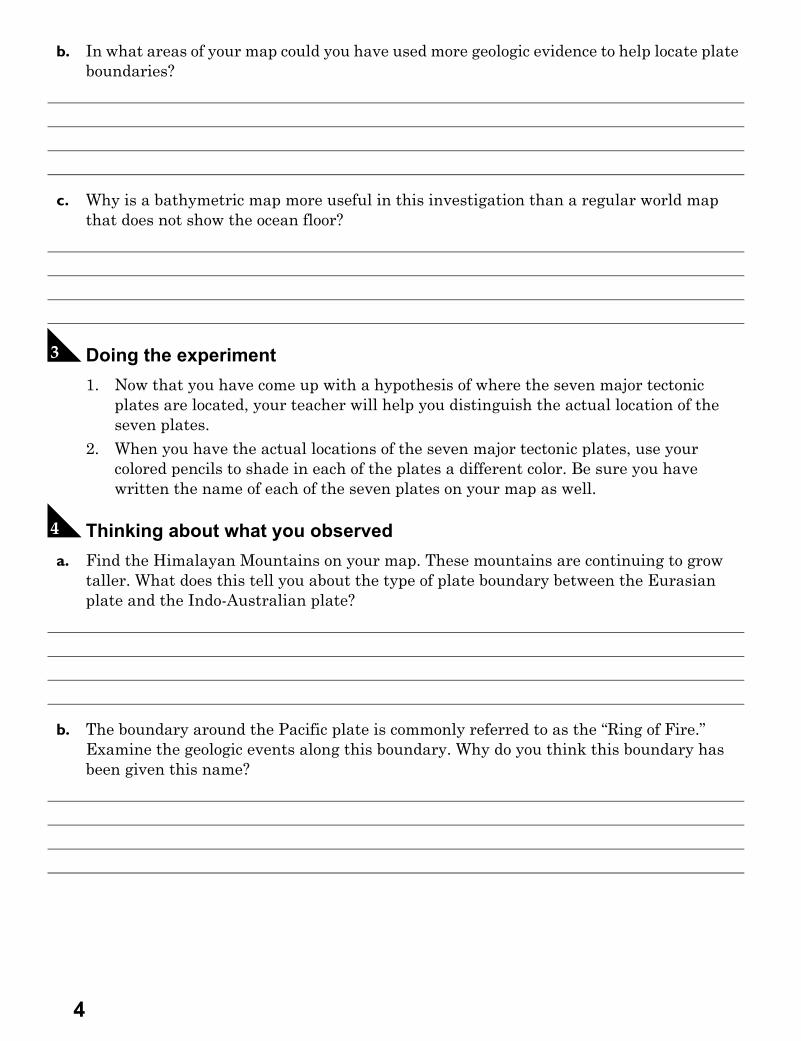
2. Volcanoes, like earthquake activity, are often found along plate boundaries. The volcano data table (Table 3 below) shows the location of recent volcanic eruptions around the globe.
Table 3: Volcano data table
3. You will be plotting volcano activity according to latitude and longitude. Plot the volcanoes using a colored pencil. Use a triangle to represent volcanoes. Include this in your key on your map.
4. When you have finished plotting your volcano data, use your pencil and draw a single line along the triangles. You may find that the lines you draw for the volcanoes will connect with the previous lines you have drawn.
Part 5: Using your evidence to locate Earth's major tectonic plates
1. Using your pencil, continue working on connecting the lines that mark tectonic plate boundaries. Remember you are trying to locate seven major tectonic plates: the American Plate, Eurasian Plate, African Plate, Pacific Plate, Antarctic Plate, Indo-Australian Plate, and the Nazca Plate. Label each of the plates you found.
B Stop and think a. How well do you think you did in accurately locating the seven major tectonic plates?
What further evidence would have been helpful in making your map more accurate?
Location Location1 Lat 59.4° N,
Long 153.4° W7 Lat 35.2° S,
Long 70.6° W2 Lat 12.3° N,
Long 93.9° E8 Lat 19.0° N,
Long 98.6° W3 Lat 1.2° N,
Long 77.4° W9 Lat 16.7° N,
Long 62.2° W4 Lat 5.5° S,
Long 150.0° E10 Lat 46.2° N,
Long 122.2° W5 Lat 19.5° N,
Long 155.3° W11 Lat 54.0° N,
Long 159.5° E6 Lat 16.5° S,
Long 168.4° E12 Lat 14.5° N,
Long 90.9° W
4
b. In what areas of your map could you have used more geologic evidence to help locate plate boundaries?
c. Why is a bathymetric map more useful in this investigation than a regular world map that does not show the ocean floor?
C Doing the experiment1. Now that you have come up with a hypothesis of where the seven major tectonic
plates are located, your teacher will help you distinguish the actual location of the seven plates.
2. When you have the actual locations of the seven major tectonic plates, use your colored pencils to shade in each of the plates a different color. Be sure you have written the name of each of the seven plates on your map as well.
D Thinking about what you observed a. Find the Himalayan Mountains on your map. These mountains are continuing to grow
taller. What does this tell you about the type of plate boundary between the Eurasian plate and the Indo-Australian plate?
b. The boundary around the Pacific plate is commonly referred to as the “Ring of Fire.” Examine the geologic events along this boundary. Why do you think this boundary has been given this name?
5
Investigation 11A Plate Tectonics
c. Find the Mid-Atlantic Ridge on your map. The Atlantic Ocean was once much smaller millions of years ago and has been growing in size to present day. What does this tell you about the type of plate boundary that exists at the Mid-Atlantic Ridge?
d. The boundary between the African Plate and the Eurasian Plate in the Mediterranean Sea is a convergent boundary. Africa is slowly pushing northward towards Europe. What will eventually become of the Mediterranean Sea in the future? Why?
e. The boundaries between the Eurasian Plate and the Indo-Australian Plate as well as the Nazca Plate and the South American plate are convergent boundaries. What is a major difference in the geologic features and events at these two plate boundaries?
f. Lithospheric plates move about as fast as your fingernails grow—2.5 cm/year! Your teacher will help you figure out the main directions to move the plates on your map. Using this information and the rate of movement, figure out what Earth will look like in 50 million years!
1
Investigation 11B Evidence for Plate Tectonics
11B Evidence for Plate TectonicsHow are fossils useful evidence for continental drift?
A Setting up
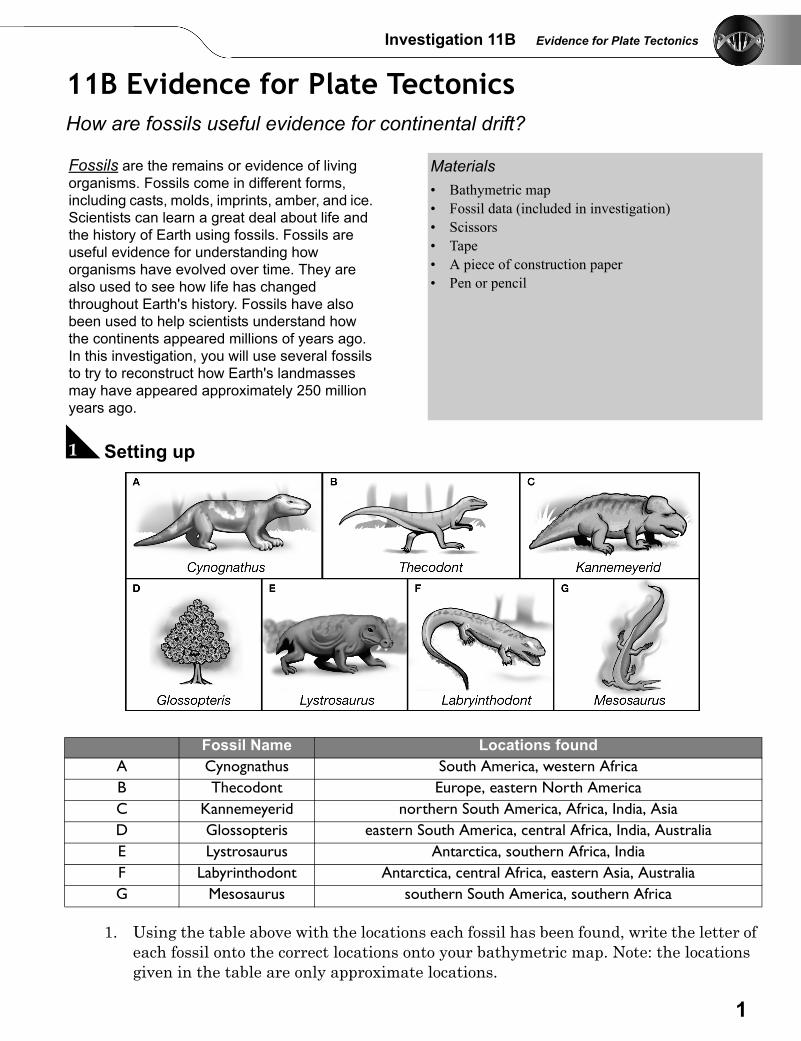
1. Using the table above with the locations each fossil has been found, write the letter of each fossil onto the correct locations onto your bathymetric map. Note: the locations given in the table are only approximate locations.
Fossils are the remains or evidence of living organisms. Fossils come in different forms, including casts, molds, imprints, amber, and ice. Scientists can learn a great deal about life and the history of Earth using fossils. Fossils are useful evidence for understanding how organisms have evolved over time. They are also used to see how life has changed throughout Earth's history. Fossils have also been used to help scientists understand how the continents appeared millions of years ago. In this investigation, you will use several fossils to try to reconstruct how Earth's landmasses may have appeared approximately 250 million years ago.
Materials• Bathymetric map• Fossil data (included in investigation)• Scissors• Tape• A piece of construction paper• Pen or pencil
Fossil Name Locations foundA Cynognathus South America, western AfricaB Thecodont Europe, eastern North AmericaC Kannemeyerid northern South America, Africa, India, AsiaD Glossopteris eastern South America, central Africa, India, AustraliaE Lystrosaurus Antarctica, southern Africa, IndiaF Labyrinthodont Antarctica, central Africa, eastern Asia, AustraliaG Mesosaurus southern South America, southern Africa
2
B Stop and think a. Which of the fossils from the table were found in Antarctica? Why might this seem
strange or unexpected?
b. Which of the fossils from the table were found both in North America and Asia?
c. What are some possible ways these organisms could have traveled from continent to continent when they were living?
d. If these animals and plants were not able to swim across large bodies of water such as oceans or sea, explain how else the pattern of fossil distribution can be explained.
C Doing the experiment1. Cut out each of the following continents and landforms from your map: North
America, South America, Antarctica, Africa, Europe, Australia, and Asia.2. Place these continents onto your piece of construction paper.3. Using the shape of the continents’ coastlines and the locations where each type of
fossil has been found, reconstruct the world so that all the continents are connected to form a large “supercontinent.”
4. When you have completed the previous step tape down the continents to your piece of construction paper in the same positions you arranged them in step 3.
D Thinking about what you observed a. Glossopteris is an extinct type of plant referred to as a seed fern. These plants most likely
thrived in tropical climates. Do any of the locations where the fossils of the glossopteris have been found seem strange? Explain your answer.
b. Thecodont was a small dinosaur. Where have fossils of this dinosaur been uncovered? Does it seem likely that this animal could have traveled between these two locations? Explain your answer.
c. How did the fossils of Cynognathus help you construct your map?
d. Where on your new map is Australia? To which continents is it connected? Which fossils did you use to help place Australia? How were they useful?
e. What other evidence might be useful for connecting the continents together into one giant landmass?
E Exploring on your ownPick two of the organisms from the fossil list you used in this investigation. Using your schoollibrary or the internet research this organism. Write a one paragraph summary of what youfound about each of these organisms. Your research should include but is not limited to - whenit lived, what it ate, how it behaved, its size, and the habitat in which it lived. Include a sketchof your organisms as well.
1
Investigation 12A Earthquakes
12A EarthquakesWhat conditions affect the timing, duration, and intensity of an earthquake?
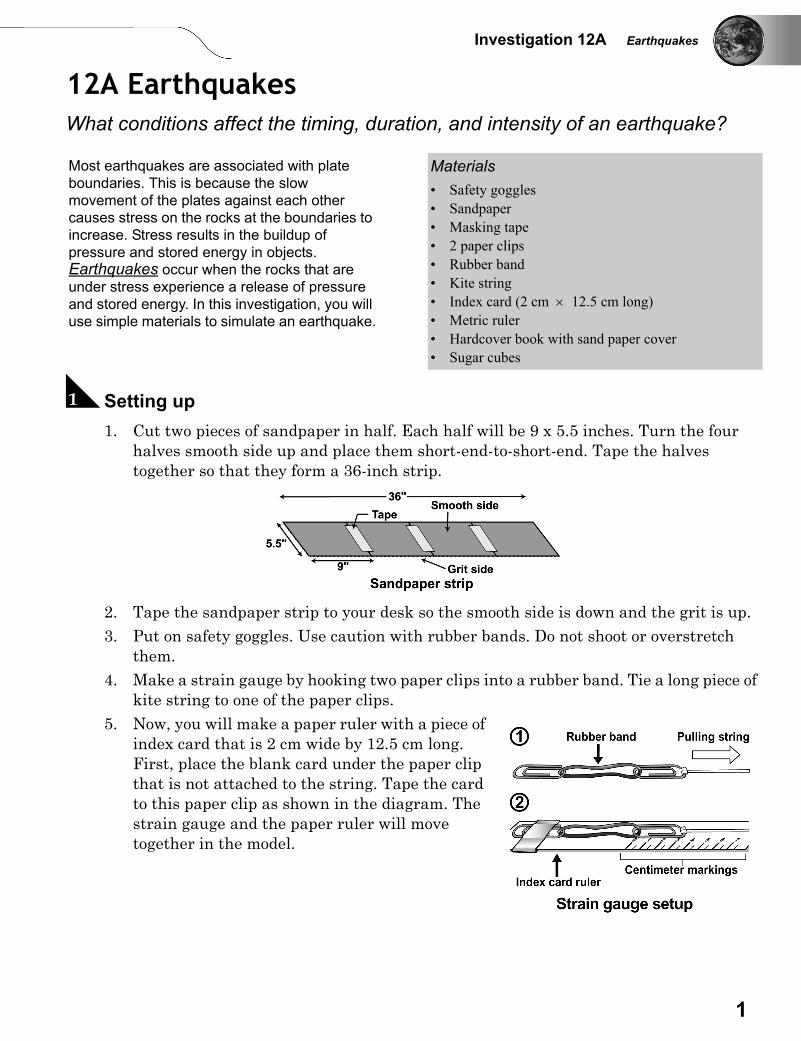
A Setting up1. Cut two pieces of sandpaper in half. Each half will be 9 x 5.5 inches. Turn the four
halves smooth side up and place them short-end-to-short-end. Tape the halves together so that they form a 36-inch strip.
2. Tape the sandpaper strip to your desk so the smooth side is down and the grit is up.3. Put on safety goggles. Use caution with rubber bands. Do not shoot or overstretch
them.4. Make a strain gauge by hooking two paper clips into a rubber band. Tie a long piece of
kite string to one of the paper clips.5. Now, you will make a paper ruler with a piece of
index card that is 2 cm wide by 12.5 cm long. First, place the blank card under the paper clip that is not attached to the string. Tape the card to this paper clip as shown in the diagram. The strain gauge and the paper ruler will move together in the model.
Most earthquakes are associated with plate boundaries. This is because the slow movement of the plates against each other causes stress on the rocks at the boundaries to increase. Stress results in the buildup of pressure and stored energy in objects. Earthquakes occur when the rocks that are under stress experience a release of pressure and stored energy. In this investigation, you will use simple materials to simulate an earthquake.
Materials• Safety goggles• Sandpaper• Masking tape• 2 paper clips• Rubber band• Kite string• Index card (2 cm × 12.5 cm long)• Metric ruler• Hardcover book with sand paper cover• Sugar cubes
2
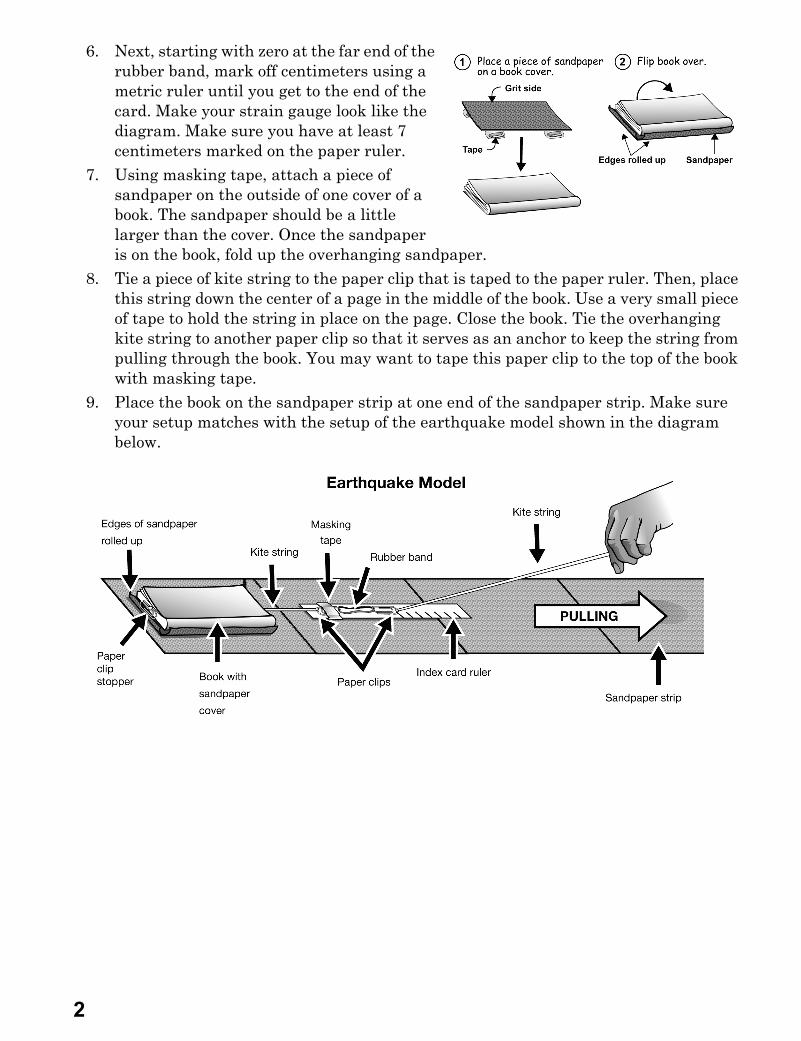
6. Next, starting with zero at the far end of the rubber band, mark off centimeters using a metric ruler until you get to the end of the card. Make your strain gauge look like the diagram. Make sure you have at least 7 centimeters marked on the paper ruler.
7. Using masking tape, attach a piece of sandpaper on the outside of one cover of a book. The sandpaper should be a little larger than the cover. Once the sandpaper is on the book, fold up the overhanging sandpaper.
8. Tie a piece of kite string to the paper clip that is taped to the paper ruler. Then, place this string down the center of a page in the middle of the book. Use a very small piece of tape to hold the string in place on the page. Close the book. Tie the overhanging kite string to another paper clip so that it serves as an anchor to keep the string from pulling through the book. You may want to tape this paper clip to the top of the book with masking tape.
9. Place the book on the sandpaper strip at one end of the sandpaper strip. Make sure your setup matches with the setup of the earthquake model shown in the diagram below.
3
Investigation 12A Earthquakes
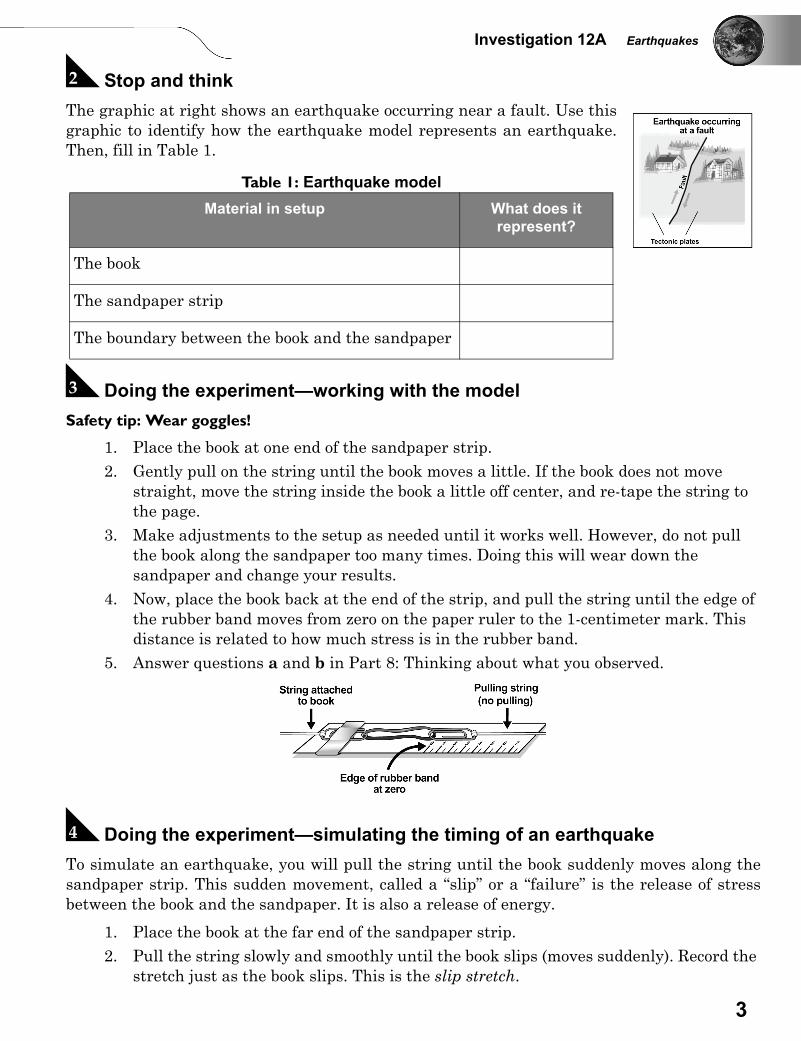
B Stop and thinkThe graphic at right shows an earthquake occurring near a fault. Use thisgraphic to identify how the earthquake model represents an earthquake.Then, fill in Table 1.
C Doing the experiment—working with the model Safety tip: Wear goggles!
1. Place the book at one end of the sandpaper strip.2. Gently pull on the string until the book moves a little. If the book does not move
straight, move the string inside the book a little off center, and re-tape the string to the page.
3. Make adjustments to the setup as needed until it works well. However, do not pull the book along the sandpaper too many times. Doing this will wear down the sandpaper and change your results.
4. Now, place the book back at the end of the strip, and pull the string until the edge of the rubber band moves from zero on the paper ruler to the 1-centimeter mark. This distance is related to how much stress is in the rubber band.
5. Answer questions a and b in Part 8: Thinking about what you observed.
D Doing the experiment—simulating the timing of an earthquakeTo simulate an earthquake, you will pull the string until the book suddenly moves along thesandpaper strip. This sudden movement, called a “slip” or a “failure” is the release of stressbetween the book and the sandpaper. It is also a release of energy.
1. Place the book at the far end of the sandpaper strip.2. Pull the string slowly and smoothly until the book slips (moves suddenly). Record the
stretch just as the book slips. This is the slip stretch.
Table 1: Earthquake modelMaterial in setup What does it
represent?
The book
The sandpaper strip
The boundary between the book and the sandpaper
4
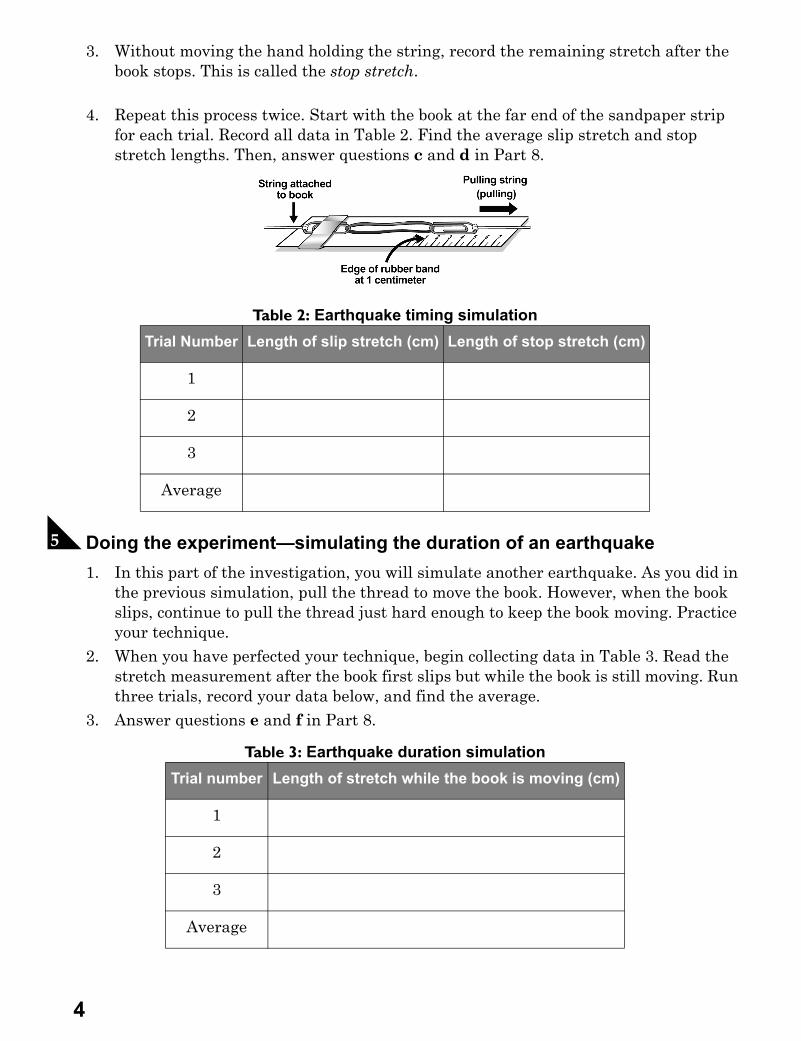
3. Without moving the hand holding the string, record the remaining stretch after the book stops. This is called the stop stretch.
4. Repeat this process twice. Start with the book at the far end of the sandpaper strip for each trial. Record all data in Table 2. Find the average slip stretch and stop stretch lengths. Then, answer questions c and d in Part 8.
E Doing the experiment—simulating the duration of an earthquake1. In this part of the investigation, you will simulate another earthquake. As you did in
the previous simulation, pull the thread to move the book. However, when the book slips, continue to pull the thread just hard enough to keep the book moving. Practice your technique.
2. When you have perfected your technique, begin collecting data in Table 3. Read the stretch measurement after the book first slips but while the book is still moving. Run three trials, record your data below, and find the average.
3. Answer questions e and f in Part 8.
Table 2: Earthquake timing simulationTrial Number Length of slip stretch (cm) Length of stop stretch (cm)
1
2
3
Average
Table 3: Earthquake duration simulationTrial number Length of stretch while the book is moving (cm)
1
2
3
Average
5
Investigation 12A Earthquakes
F Doing the experiment—simulating the intensity of an earthquake1. You and your group will simulate another earthquake by having team members drum
on the tabletop with their fists. Each person should drum on the table with gentle to medium force.
2. While drumming is taking place, simulate an earthquake with your model.3. Depending on what you observe in this experiment, record slip and stop stretches or
stretches while the book is moving. Record your data in Table 4 and then average your data.
4. Answer questions g-i in Part 8.
G Doing the experiment—simulating the damage caused by an earthquake1. Perform each of the experiments with sugar cubes stacked on the book. Place one
sugar cube alone, then have stacks of two, three, and four cubes. These stacked sugar cubes represent one-, two-, three-, and four-story building,
2. In the spaces of Table 5, record whether the cubes moved or the stacks fell during each simulation.
3. Answer questions j-l in Part 8.
H Thinking about what you observed a. Did the book move when the stretch was 1 centimeter? _______________________________
Table 4: Earthquake intensity simulationTrial
numberLength of
slip stretch(cm)
Length of stop stretch
(cm)
Length of stretch while book is moving
(cm)
1
2
3
Average
Table 5: Earthquake damage simulationEarthquake experiment One cube Two cubes Three cubes Four cubes
Timing simulation
Duration simulation
Intensity simulation
6
b. What does the movement of the book on the sandpaper strip represent in this investigation?
c. The movement of tectonic plates occurs all the time, but earthquakes do not. Why doesn't plate movement cause continual small earthquakes? Why do earthquakes occur every once in a while? Explain your answer.
d. Did all of the energy stored in the rubber band release when the book slipped? Do you think an earthquake releases all of the stored energy when it occurs?
e. How does the data from “timing of an earthquake” compare with the data from “duration of an earthquake”? Why do you think this is?
f. Earthquakes last longer than a few seconds. They do not simply start and quickly stop. Explain the relatively long duration of earthquakes based on the results of the experiment.
g. How does the data from “timing of an earthquake” or “duration of an earthquake” compare with the data from “intensity of an earthquake”? Why do you think this is so?
7
Investigation 12A Earthquakes
h. How did the drumming affect the intensity of the “earthquake” in the model?
i. Do you think one earthquake can cause another earthquake? Explain your answer.
j. Which sugar-cube building experienced the most damage? Why do you think this happened?
k. Which experiment resulted in the most damage? Why do you think this happened?
l. Given the results, suggest one safety tip that would reduce damage to buildings during an earthquake.
I Exploring on your own a. Find out what areas in the United States have the highest seismic risk.
b. In terms of plate tectonics, what is happening at the San Andreas Fault?
c. How fast is the plate movement at the San Andreas Fault? ____________________________
1
Investigation 12B Volcanoes
12B VolcanoesHow are volcanoes and plate boundaries related?
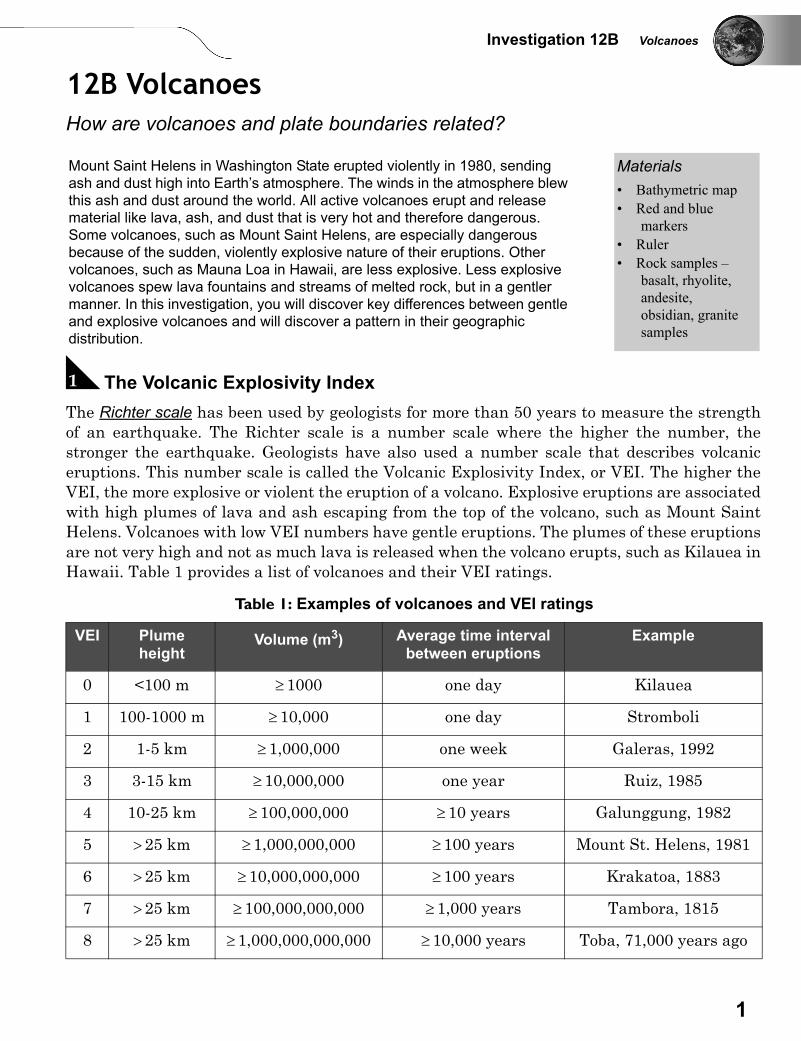
A The Volcanic Explosivity IndexThe Richter scale has been used by geologists for more than 50 years to measure the strengthof an earthquake. The Richter scale is a number scale where the higher the number, thestronger the earthquake. Geologists have also used a number scale that describes volcaniceruptions. This number scale is called the Volcanic Explosivity Index, or VEI. The higher theVEI, the more explosive or violent the eruption of a volcano. Explosive eruptions are associatedwith high plumes of lava and ash escaping from the top of the volcano, such as Mount SaintHelens. Volcanoes with low VEI numbers have gentle eruptions. The plumes of these eruptionsare not very high and not as much lava is released when the volcano erupts, such as Kilauea inHawaii. Table 1 provides a list of volcanoes and their VEI ratings.
Mount Saint Helens in Washington State erupted violently in 1980, sending ash and dust high into Earth’s atmosphere. The winds in the atmosphere blew this ash and dust around the world. All active volcanoes erupt and release material like lava, ash, and dust that is very hot and therefore dangerous. Some volcanoes, such as Mount Saint Helens, are especially dangerous because of the sudden, violently explosive nature of their eruptions. Other volcanoes, such as Mauna Loa in Hawaii, are less explosive. Less explosive volcanoes spew lava fountains and streams of melted rock, but in a gentler manner. In this investigation, you will discover key differences between gentle and explosive volcanoes and will discover a pattern in their geographic distribution.
Materials• Bathymetric map• Red and blue
markers• Ruler• Rock samples –
basalt, rhyolite, andesite, obsidian, granite samples
Table 1: Examples of volcanoes and VEI ratings
VEI Plume height
Volume (m3) Average time interval between eruptions
Example
0 <100 m ≥ 1000 one day Kilauea
1 100-1000 m ≥ 10,000 one day Stromboli
2 1-5 km ≥ 1,000,000 one week Galeras, 1992
3 3-15 km ≥ 10,000,000 one year Ruiz, 1985
4 10-25 km ≥ 100,000,000 ≥ 10 years Galunggung, 1982
5 > 25 km ≥ 1,000,000,000 ≥100 years Mount St. Helens, 1981
6 > 25 km ≥ 10,000,000,000 ≥100 years Krakatoa, 1883
7 > 25 km ≥ 100,000,000,000 ≥ 1,000 years Tambora, 1815
8 > 25 km ≥ 1,000,000,000,000 ≥ 10,000 years Toba, 71,000 years ago
2
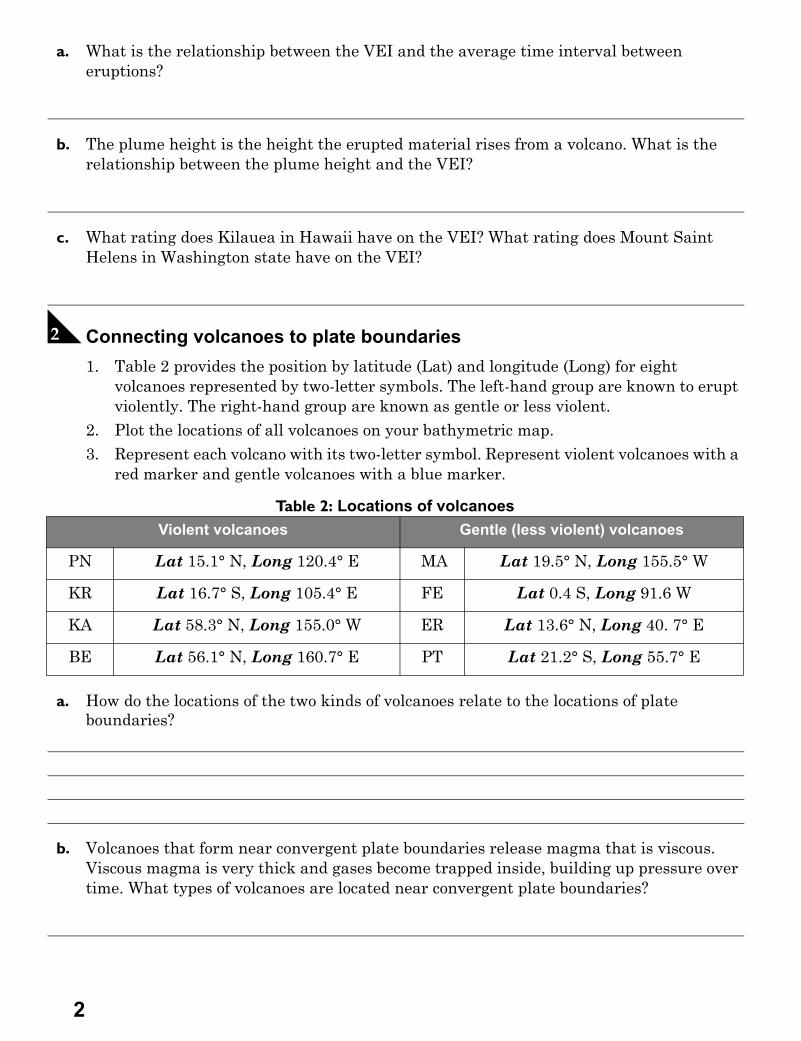
a. What is the relationship between the VEI and the average time interval between eruptions?
b. The plume height is the height the erupted material rises from a volcano. What is the relationship between the plume height and the VEI?
c. What rating does Kilauea in Hawaii have on the VEI? What rating does Mount Saint Helens in Washington state have on the VEI?
B Connecting volcanoes to plate boundaries1. Table 2 provides the position by latitude (Lat) and longitude (Long) for eight
volcanoes represented by two-letter symbols. The left-hand group are known to erupt violently. The right-hand group are known as gentle or less violent.
2. Plot the locations of all volcanoes on your bathymetric map.3. Represent each volcano with its two-letter symbol. Represent violent volcanoes with a
red marker and gentle volcanoes with a blue marker.
a. How do the locations of the two kinds of volcanoes relate to the locations of plate boundaries?
b. Volcanoes that form near convergent plate boundaries release magma that is viscous. Viscous magma is very thick and gases become trapped inside, building up pressure over time. What types of volcanoes are located near convergent plate boundaries?
Table 2: Locations of volcanoesViolent volcanoes Gentle (less violent) volcanoes
PN Lat 15.1° N, Long 120.4° E MA Lat 19.5° N, Long 155.5° W
KR Lat 16.7° S, Long 105.4° E FE Lat 0.4 S, Long 91.6 W
KA Lat 58.3° N, Long 155.0° W ER Lat 13.6° N, Long 40. 7° E
BE Lat 56.1° N, Long 160.7° E PT Lat 21.2° S, Long 55.7° E
3
Investigation 12B Volcanoes
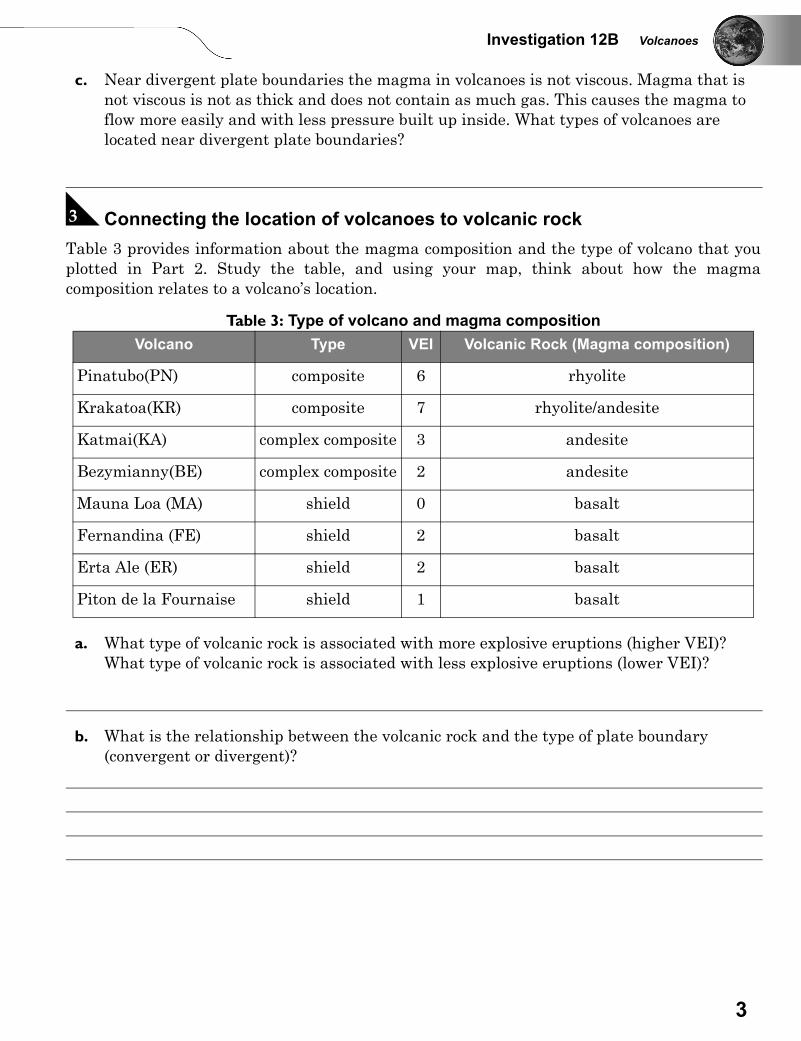
c. Near divergent plate boundaries the magma in volcanoes is not viscous. Magma that is not viscous is not as thick and does not contain as much gas. This causes the magma to flow more easily and with less pressure built up inside. What types of volcanoes are located near divergent plate boundaries?
C Connecting the location of volcanoes to volcanic rockTable 3 provides information about the magma composition and the type of volcano that youplotted in Part 2. Study the table, and using your map, think about how the magmacomposition relates to a volcano’s location.
a. What type of volcanic rock is associated with more explosive eruptions (higher VEI)? What type of volcanic rock is associated with less explosive eruptions (lower VEI)?
b. What is the relationship between the volcanic rock and the type of plate boundary (convergent or divergent)?
Table 3: Type of volcano and magma compositionVolcano Type VEI Volcanic Rock (Magma composition)
Pinatubo(PN) composite 6 rhyolite
Krakatoa(KR) composite 7 rhyolite/andesite
Katmai(KA) complex composite 3 andesite
Bezymianny(BE) complex composite 2 andesite
Mauna Loa (MA) shield 0 basalt
Fernandina (FE) shield 2 basalt
Erta Ale (ER) shield 2 basalt
Piton de la Fournaise shield 1 basalt
4
c. Using your bathymetric map, where do you typically find volcanoes that contain basalt? Where do you typically find volcanoes that contain rhyolite or andesite?
d. Imagine you are asked to investigate a newly discovered volcano to find out whether it will produce a gentle or violent eruption. Develop a research plan for studying the volcano. What evidence will you need to be able to identify the nature of the eruption? Assume that you can use any resources you need.
1
Investigation 13A Mineral Identification
13A Mineral IdentificationHow are minerals identified?
A Setting up1. Collect a bin full of supplies put together by the teacher. 2. The mineral samples you will be identifying are labeled by letter. For example, you
will get mineral A from its place in the classroom, bring it back to your table, and use your supplies to identify its real name.
B Doing the activity1. First, identify the color of each sample. Put the information in the appropriate
column in Table 2. You will notice that depending on the sample you picked up, others of the same mineral type may be a very different color.
2. Streak each mineral on the streak plate. The streak is the color of a mineral in its powdered form. Note the color of this powder, if any. Not all minerals have streaks. Put a dash in the table if no streak is present.
3. Mohs hardness - The Mohs scale (Table 1) is an important indicator of hardness. Hardness is the measure of resistance of a mineral to being scratched. The mineral to be identified is rubbed against another mineral of known hardness or a material of known hardness. The scale starts at one and goes to ten. Talc is the softest mineral and is rated at one. Diamond is the hardest mineral and is rated at 10. There are eight other mineral markers in between. Other materials, like glass are also used to identify hardness. Glass has a hardness of 5.5. Use the edge of a mineral. Place the glass flat on the table. Scratch the glass hard with the mineral. Wipe away any powder. If there is a line etched in the glass, then the mineral is harder than 5.5. If there is no lined etched in the glass, then the mineral has a hardness less than 5.5. Other indicators are noted below. The goal is to narrow the hardness down to the smallest range possible. For example, the hardness is 2.5-3.5.
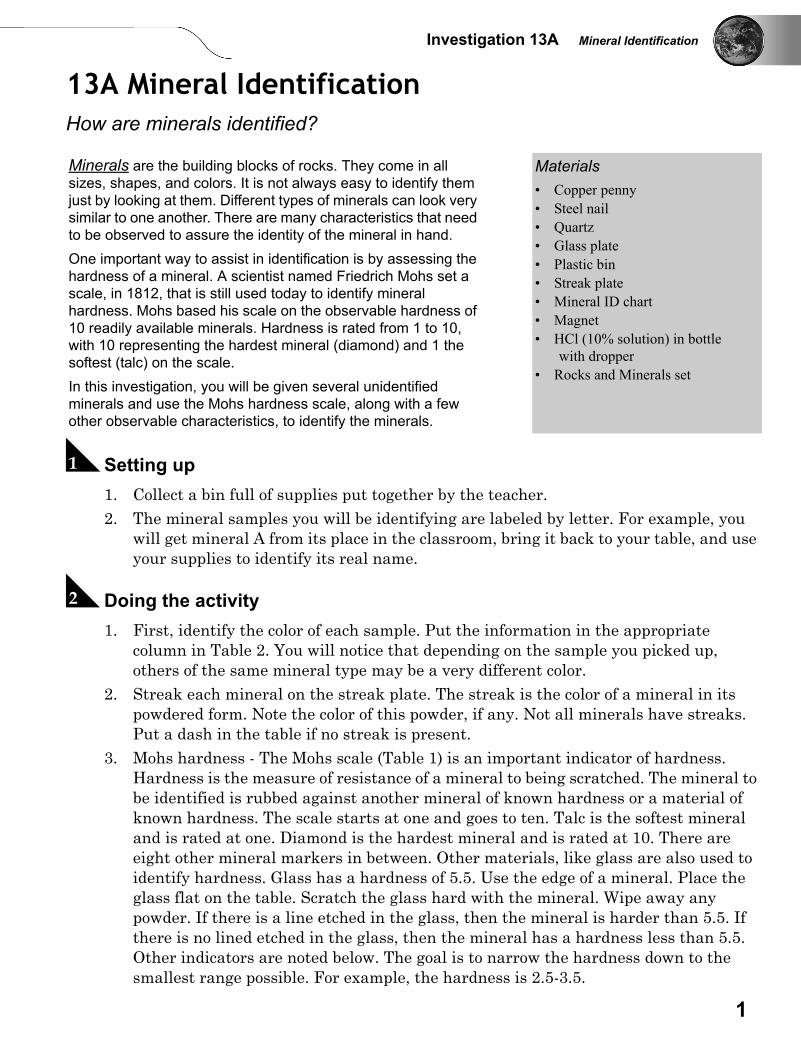
Minerals are the building blocks of rocks. They come in all sizes, shapes, and colors. It is not always easy to identify them just by looking at them. Different types of minerals can look very similar to one another. There are many characteristics that need to be observed to assure the identity of the mineral in hand. One important way to assist in identification is by assessing the hardness of a mineral. A scientist named Friedrich Mohs set a scale, in 1812, that is still used today to identify mineral hardness. Mohs based his scale on the observable hardness of 10 readily available minerals. Hardness is rated from 1 to 10, with 10 representing the hardest mineral (diamond) and 1 the softest (talc) on the scale. In this investigation, you will be given several unidentified minerals and use the Mohs hardness scale, along with a few other observable characteristics, to identify the minerals.
Materials• Copper penny• Steel nail• Quartz• Glass plate• Plastic bin• Streak plate• Mineral ID chart• Magnet• HCl (10% solution) in bottle
with dropper• Rocks and Minerals set
2
1. Luster is the appearance of light reflected from the surface of the mineral. A mineral with metallic luster has the appearance of a metal, whereas a non-metallic mineral does not.
2. Cleavage/Fracture - Cleavage is the tendency of a mineral to break along planes of weakness. Some minerals cleave into plates. A mineral has fracture when it does not exhibit this quality.
3. Other Properties - smell (some mineral powders smell when streaked), taste (a mineral such as halite tastes salty), reactivity with a dilute HCl solution (when a mineral reacts with HCl, it contains calcite), magnetic (only some minerals are magnetic), feel/touch - some minerals are known for their greasy or powdery feel.
4. Once you have identified the properties of the minerals, use the mineral ID chart to figure out the names of the minerals. Take your time. It is easy to make a mistake.
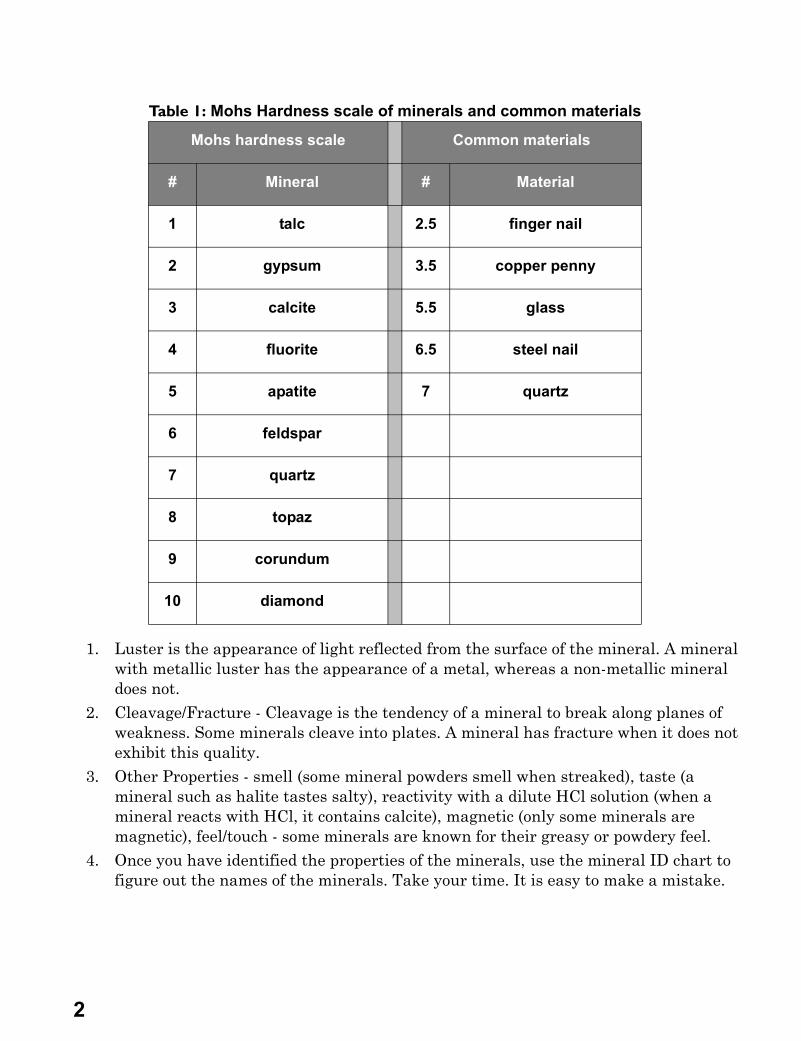
Table 1: Mohs Hardness scale of minerals and common materials
Mohs hardness scale Common materials
# Mineral # Material
1 talc 2.5 finger nail
2 gypsum 3.5 copper penny
3 calcite 5.5 glass
4 fluorite 6.5 steel nail
5 apatite 7 quartz
6 feldspar
7 quartz
8 topaz
9 corundum
10 diamond
3
Investigation 13A Mineral Identification
.
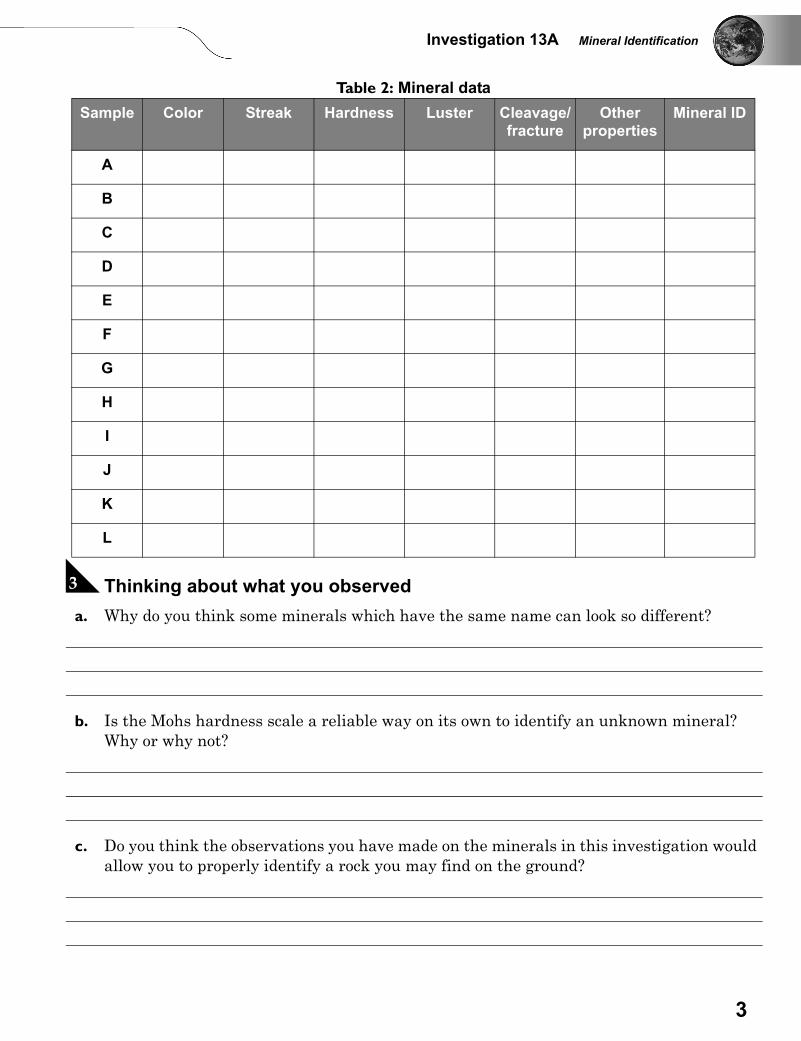
C Thinking about what you observed a. Why do you think some minerals which have the same name can look so different?
b. Is the Mohs hardness scale a reliable way on its own to identify an unknown mineral? Why or why not?
c. Do you think the observations you have made on the minerals in this investigation would allow you to properly identify a rock you may find on the ground?
Table 2: Mineral dataSample Color Streak Hardness Luster Cleavage/
fractureOther
propertiesMineral ID
A
B
C
D
E
F
G
H
I
J
K
L
1
Investigation 13B Igneous Rocks
13B Igneous RocksHow are igneous rocks classified?
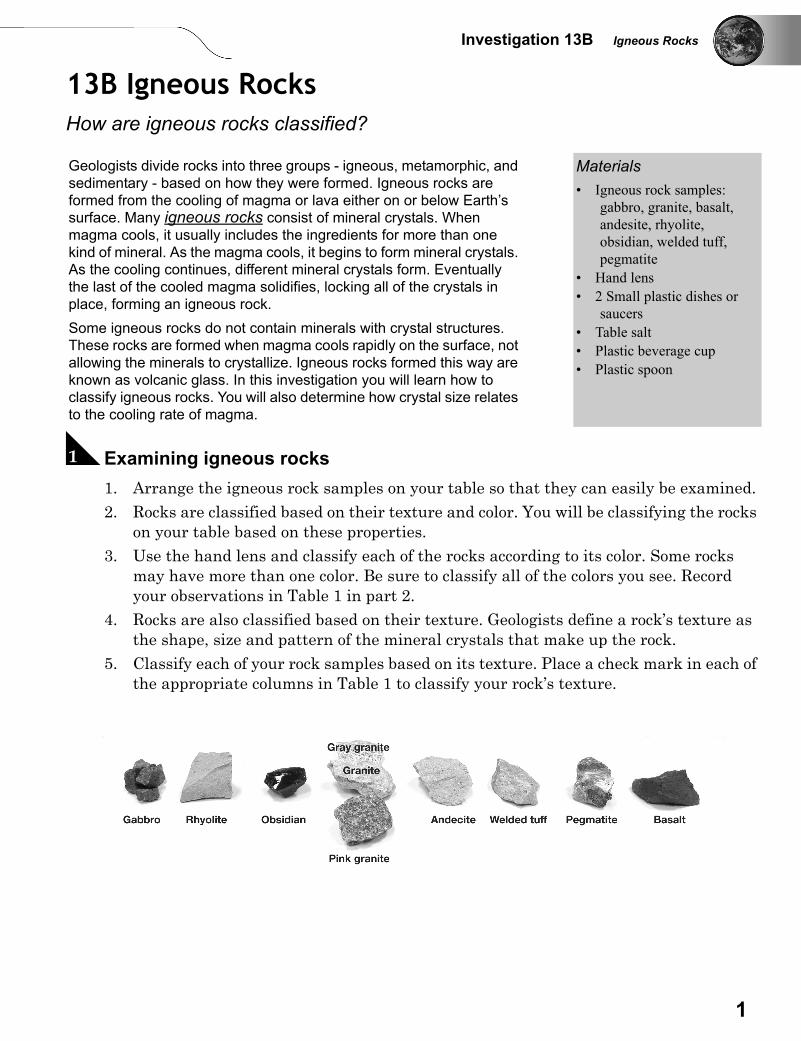
A Examining igneous rocks1. Arrange the igneous rock samples on your table so that they can easily be examined. 2. Rocks are classified based on their texture and color. You will be classifying the rocks
on your table based on these properties. 3. Use the hand lens and classify each of the rocks according to its color. Some rocks
may have more than one color. Be sure to classify all of the colors you see. Record your observations in Table 1 in part 2.
4. Rocks are also classified based on their texture. Geologists define a rock’s texture as the shape, size and pattern of the mineral crystals that make up the rock.
5. Classify each of your rock samples based on its texture. Place a check mark in each of the appropriate columns in Table 1 to classify your rock’s texture.
Geologists divide rocks into three groups - igneous, metamorphic, and sedimentary - based on how they were formed. Igneous rocks are formed from the cooling of magma or lava either on or below Earth’s surface. Many igneous rocks consist of mineral crystals. When magma cools, it usually includes the ingredients for more than one kind of mineral. As the magma cools, it begins to form mineral crystals. As the cooling continues, different mineral crystals form. Eventually the last of the cooled magma solidifies, locking all of the crystals in place, forming an igneous rock. Some igneous rocks do not contain minerals with crystal structures. These rocks are formed when magma cools rapidly on the surface, not allowing the minerals to crystallize. Igneous rocks formed this way are known as volcanic glass. In this investigation you will learn how to classify igneous rocks. You will also determine how crystal size relates to the cooling rate of magma.
Materials• Igneous rock samples:
gabbro, granite, basalt, andesite, rhyolite, obsidian, welded tuff, pegmatite
• Hand lens• 2 Small plastic dishes or
saucers• Table salt• Plastic beverage cup• Plastic spoon
2
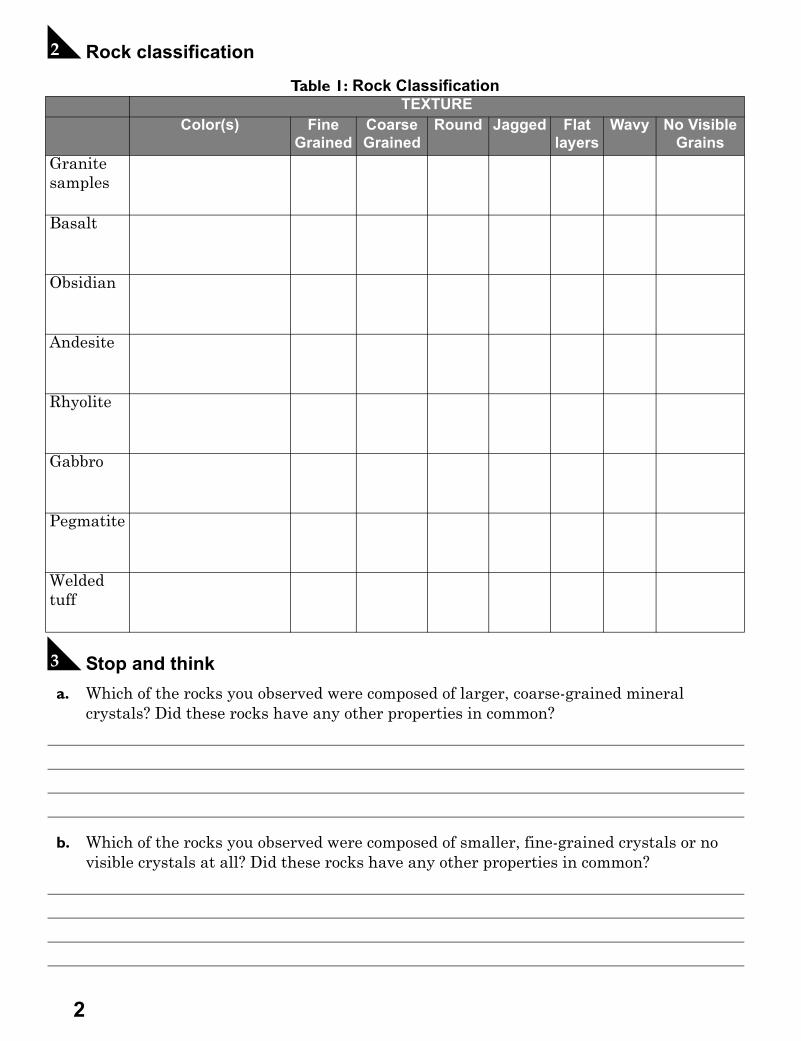
B Rock classification
C Stop and think a. Which of the rocks you observed were composed of larger, coarse-grained mineral
crystals? Did these rocks have any other properties in common?
b. Which of the rocks you observed were composed of smaller, fine-grained crystals or no visible crystals at all? Did these rocks have any other properties in common?
Table 1: Rock ClassificationTEXTURE
Color(s) FineGrained
Coarse Grained
Round Jagged Flatlayers
Wavy No VisibleGrains
Granite samples
Basalt
Obsidian
Andesite
Rhyolite
Gabbro
Pegmatite
Welded tuff
3
Investigation 13B Igneous Rocks
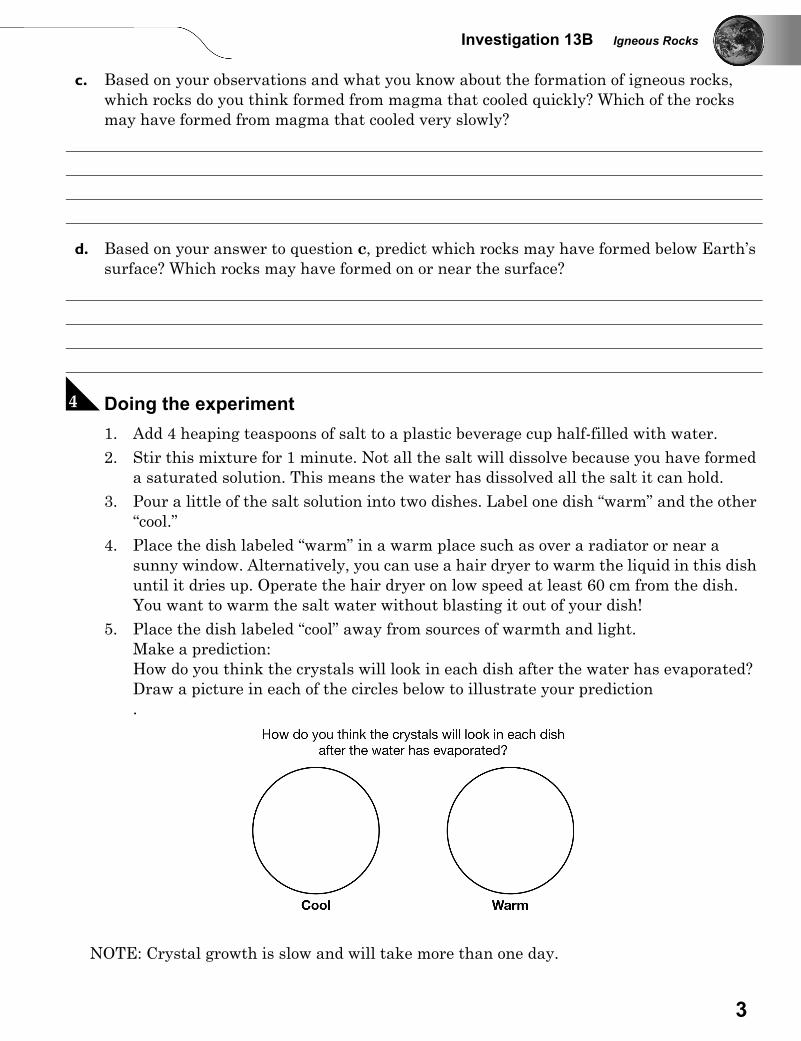
c. Based on your observations and what you know about the formation of igneous rocks, which rocks do you think formed from magma that cooled quickly? Which of the rocks may have formed from magma that cooled very slowly?
d. Based on your answer to question c, predict which rocks may have formed below Earth’s surface? Which rocks may have formed on or near the surface?
D Doing the experiment 1. Add 4 heaping teaspoons of salt to a plastic beverage cup half-filled with water.2. Stir this mixture for 1 minute. Not all the salt will dissolve because you have formed
a saturated solution. This means the water has dissolved all the salt it can hold.3. Pour a little of the salt solution into two dishes. Label one dish “warm” and the other
“cool.”4. Place the dish labeled “warm” in a warm place such as over a radiator or near a
sunny window. Alternatively, you can use a hair dryer to warm the liquid in this dish until it dries up. Operate the hair dryer on low speed at least 60 cm from the dish. You want to warm the salt water without blasting it out of your dish!
5. Place the dish labeled “cool” away from sources of warmth and light.Make a prediction: How do you think the crystals will look in each dish after the water has evaporated? Draw a picture in each of the circles below to illustrate your prediction.
NOTE: Crystal growth is slow and will take more than one day.
4
6. Examine both dishes from time to time for the next few days until all the water has evaporated. You may want to record the temperature at each dish’s location.
7. Make a table to record your observations.8. Record the date, time, and the amount of water left in each dish at each observation.
Describe the crystals in each dish. Use relative terms such as slightly, more, and most to record these observations. Measure and record the size of the largest crystal in each dish.
9. When the water has evaporated from one of the dishes, make a final inspection of both dishes. Both dishes will have large and small crystals, but one will have the largest crystals. Usually these largest crystals will form near the edges of the dish.
10. Record your final observations in the table you made in step 7 and 8.
E Thinking about what you observedPart 1
a. Which dish had more time to grow crystals? Which dish contained bigger crystals?
b. Write a conclusion sentence about the time available for crystals to form and the size of the crystals that form.
Part 2
The size of rock crystals depends on the amount of interaction among the materials in themagma that forms the rock. More time allows more interaction. As a result, slow-growingcrystals tend to be bigger than fast-growing crystals. Anything that might slow the cooling ofmagma will provide that time. a. List two natural events or conditions on Earth (other than the methods you used in this
investigation) that might slow the cooling of magma.
b. List two natural events or conditions on Earth that might speed up the cooling of magma.
5
Investigation 13B Igneous Rocks
F Exploring on your own a. Go back to the rock samples you classified earlier in this investigation. Compare the
appearance of each sample and look at the observations you made about each rock’s texture in Table 1. Based on your work in this part of the investigation, which rocks formed slowly and which rocks formed quickly? Explain your answer to this investigation based on what you learned about crystal growth.
b. Igneous rocks that form on Earth’s surface are extrusive and those that form underground are called intrusive. Based on your observations of the igneous rocks, which of the rocks are likely to be extrusive? Which are likely to be intrusive? Explain your answer.
1
Investigation 14A Water Systems
14A Water SystemsHow does running water shape rivers and the landscape?
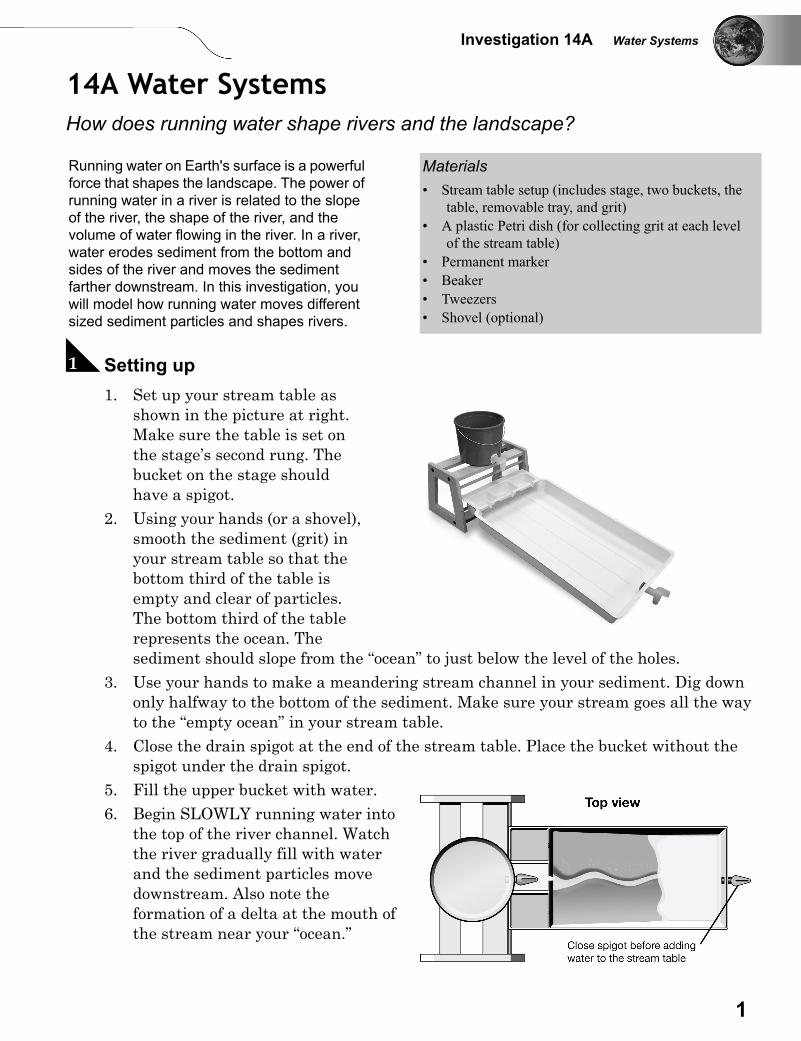
A Setting up1. Set up your stream table as
shown in the picture at right. Make sure the table is set on the stage’s second rung. The bucket on the stage should have a spigot.
2. Using your hands (or a shovel), smooth the sediment (grit) in your stream table so that the bottom third of the table is empty and clear of particles. The bottom third of the table represents the ocean. The sediment should slope from the “ocean” to just below the level of the holes.
3. Use your hands to make a meandering stream channel in your sediment. Dig down only halfway to the bottom of the sediment. Make sure your stream goes all the way to the “empty ocean” in your stream table.
4. Close the drain spigot at the end of the stream table. Place the bucket without the spigot under the drain spigot.
5. Fill the upper bucket with water.6. Begin SLOWLY running water into
the top of the river channel. Watch the river gradually fill with water and the sediment particles move downstream. Also note the formation of a delta at the mouth of the stream near your “ocean.”
Running water on Earth's surface is a powerful force that shapes the landscape. The power of running water in a river is related to the slope of the river, the shape of the river, and the volume of water flowing in the river. In a river, water erodes sediment from the bottom and sides of the river and moves the sediment farther downstream. In this investigation, you will model how running water moves different sized sediment particles and shapes rivers.
Materials• Stream table setup (includes stage, two buckets, the
table, removable tray, and grit)• A plastic Petri dish (for collecting grit at each level
of the stream table)• Permanent marker• Beaker • Tweezers • Shovel (optional)
2
7. Stop the flow of water when your delta has grown into about half of your ocean, or when the water level in the ocean rises too close to the top of the stream table wall.
8. Make sure the lower bucket is lined up with the drainage hole. Open the drain spigot and allow the water to drain from the table into the lower bucket. Observe the general sizes of the particles remaining near the source of the river, the middle, and at the delta.
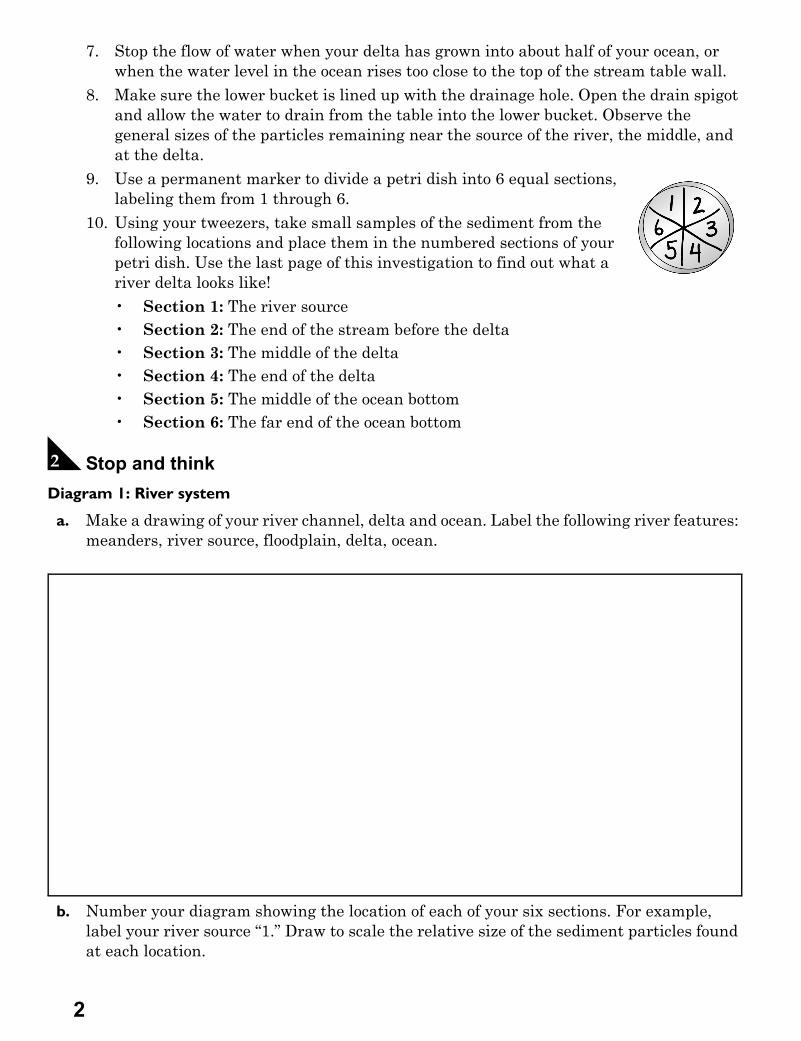
9. Use a permanent marker to divide a petri dish into 6 equal sections, labeling them from 1 through 6.
10. Using your tweezers, take small samples of the sediment from the following locations and place them in the numbered sections of your petri dish. Use the last page of this investigation to find out what a river delta looks like!• Section 1: The river source• Section 2: The end of the stream before the delta• Section 3: The middle of the delta• Section 4: The end of the delta• Section 5: The middle of the ocean bottom• Section 6: The far end of the ocean bottom
B Stop and think Diagram 1: River system
a. Make a drawing of your river channel, delta and ocean. Label the following river features: meanders, river source, floodplain, delta, ocean.
.
.
b. Number your diagram showing the location of each of your six sections. For example, label your river source “1.” Draw to scale the relative size of the sediment particles found at each location.
3
Investigation 14A Water Systems
c. How does the size of the particles change as you go from the river source to the far end of the ocean? Why do you think the sediment is sorted this way?
d. Where was the speed of the water fastest? Where was it the slowest? How can you explain this?
C Doing the experiment 1. Repeat steps 1 through 10 in the procedure. But this time, change the slope of the
stream table so that it is steeper than your first trial. 2. Repeat steps 1 through 10 in the procedure. This time, change the slope of the stream
table so that it is not as steep as the first trial.
D Thinking about what you observed a. How does increasing the slope of a river affect the rate of erosion by running water?
b. How does decreasing the slope of a river affect the rate of erosion by running water?
c. How do you think the width of the river channel affects the erosion of sediment in a river?
d. Based on your knowledge of sedimentary rocks, where would you likely find samples of conglomerate, sandstone, and shale in a river system?
4
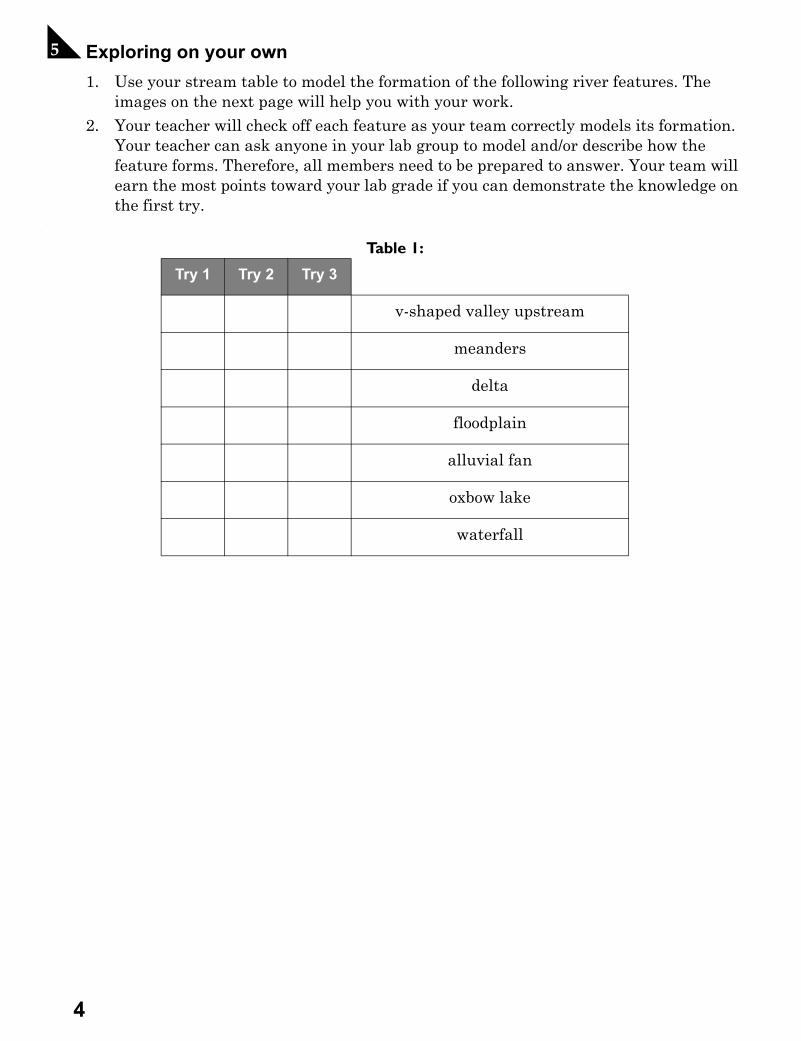
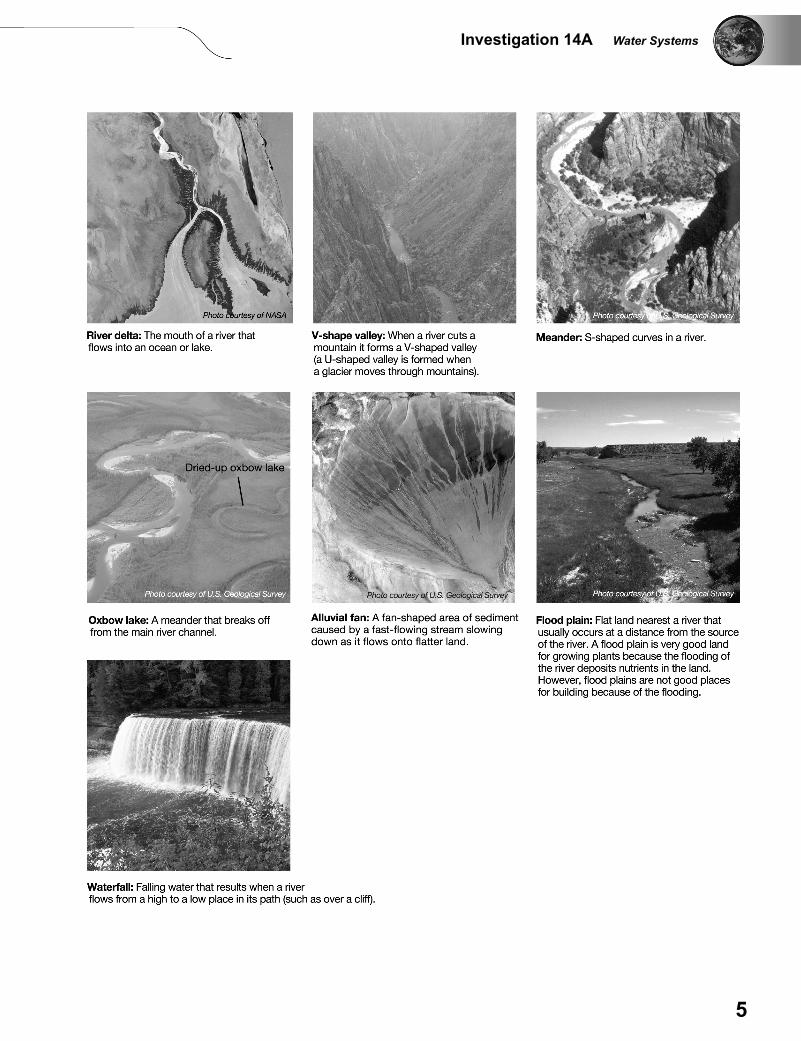
E Exploring on your own 1. Use your stream table to model the formation of the following river features. The
images on the next page will help you with your work.2. Your teacher will check off each feature as your team correctly models its formation.
Your teacher can ask anyone in your lab group to model and/or describe how the feature forms. Therefore, all members need to be prepared to answer. Your team will earn the most points toward your lab grade if you can demonstrate the knowledge on the first try.
.
Table 1:
Try 1 Try 2 Try 3
v-shaped valley upstream
meanders
delta
floodplain
alluvial fan
oxbow lake
waterfall
5
Investigation 14A Water Systems
1
Investigation 14B Human Impacts on Coastal Erosion
14B Human Impacts on Coastal ErosionHow do people living and working in coastal areas affect erosion?
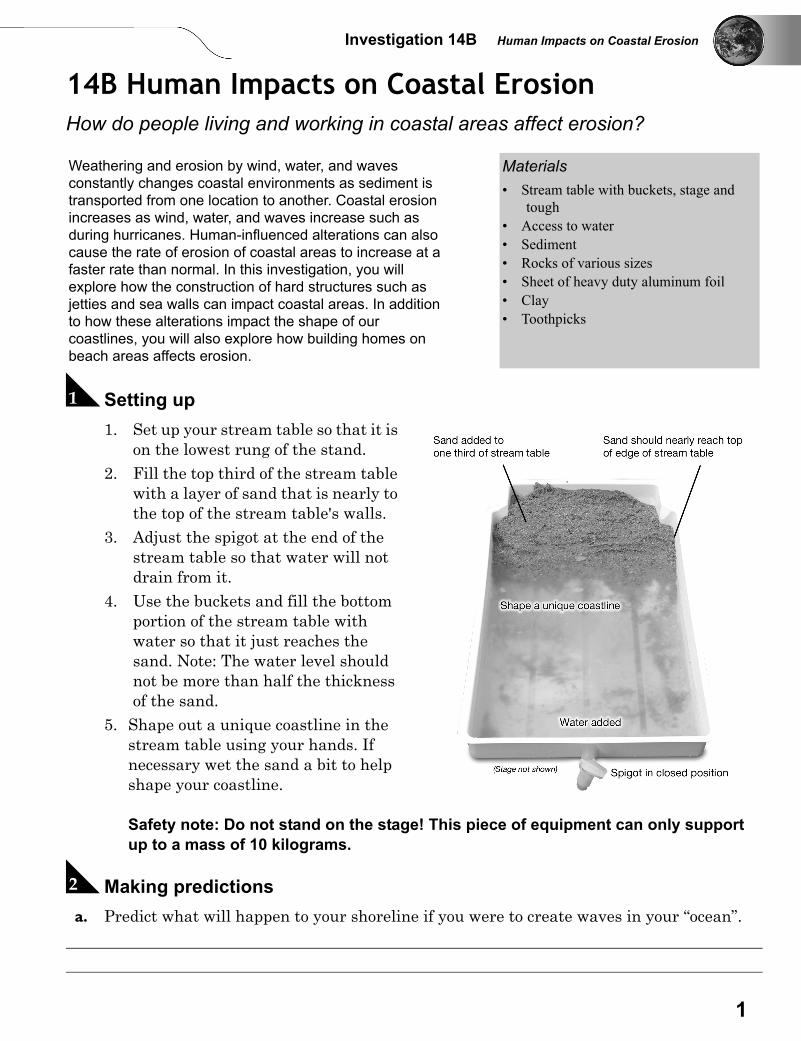
A Setting up1. Set up your stream table so that it is
on the lowest rung of the stand.2. Fill the top third of the stream table
with a layer of sand that is nearly to the top of the stream table's walls.
3. Adjust the spigot at the end of the stream table so that water will not drain from it.
4. Use the buckets and fill the bottom portion of the stream table with water so that it just reaches the sand. Note: The water level should not be more than half the thickness of the sand.
5. Shape out a unique coastline in the stream table using your hands. If necessary wet the sand a bit to help shape your coastline.
Safety note: Do not stand on the stage! This piece of equipment can only support up to a mass of 10 kilograms.
B Making predictions a. Predict what will happen to your shoreline if you were to create waves in your “ocean”.
Weathering and erosion by wind, water, and waves constantly changes coastal environments as sediment is transported from one location to another. Coastal erosion increases as wind, water, and waves increase such as during hurricanes. Human-influenced alterations can also cause the rate of erosion of coastal areas to increase at a faster rate than normal. In this investigation, you will explore how the construction of hard structures such as jetties and sea walls can impact coastal areas. In addition to how these alterations impact the shape of our coastlines, you will also explore how building homes on beach areas affects erosion.
Materials• Stream table with buckets, stage and
tough• Access to water• Sediment• Rocks of various sizes• Sheet of heavy duty aluminum foil• Clay• Toothpicks
2
b. How do you think the rate of erosion will change as the amount and size of waves increases?
C Getting started1. Draw the shape of your original coastline in Table 1.2. Use the plastic trough and generate waves in the stream table. Observe and draw the
resulting eroded coastline in Table 1.Table 1: Coastal erosion observations
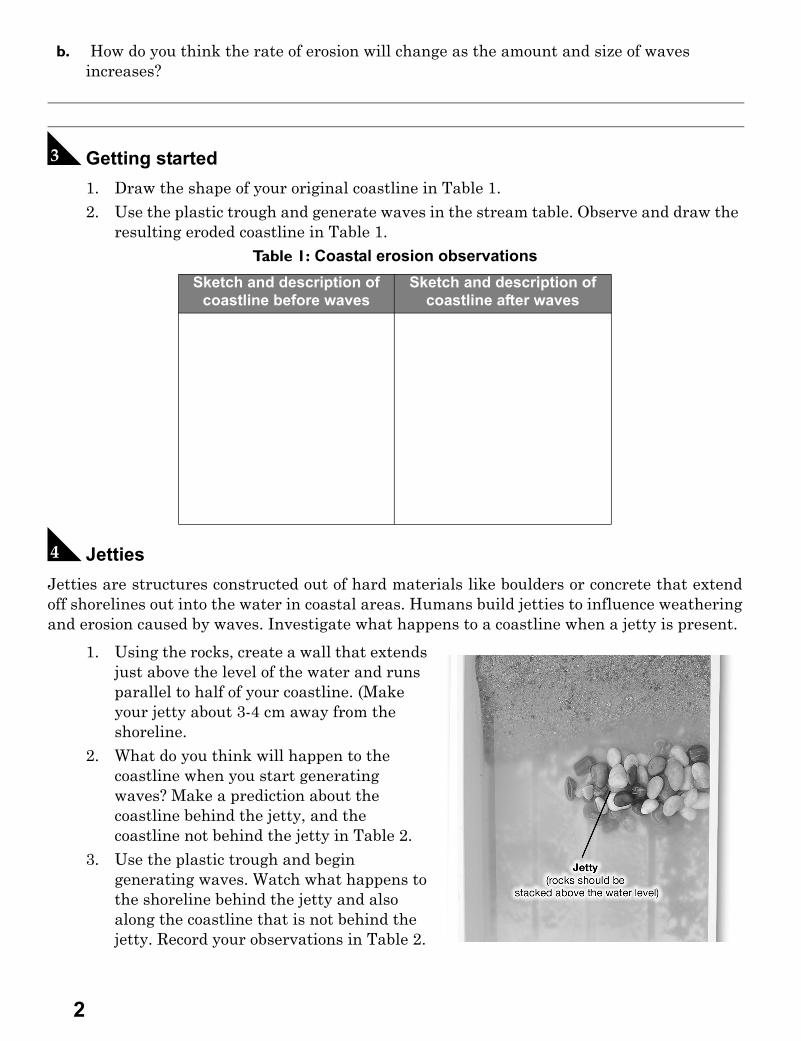
D JettiesJetties are structures constructed out of hard materials like boulders or concrete that extendoff shorelines out into the water in coastal areas. Humans build jetties to influence weatheringand erosion caused by waves. Investigate what happens to a coastline when a jetty is present.
1. Using the rocks, create a wall that extends just above the level of the water and runs parallel to half of your coastline. (Make your jetty about 3-4 cm away from the shoreline.
2. What do you think will happen to the coastline when you start generating waves? Make a prediction about the coastline behind the jetty, and the coastline not behind the jetty in Table 2.
3. Use the plastic trough and begin generating waves. Watch what happens to the shoreline behind the jetty and also along the coastline that is not behind the jetty. Record your observations in Table 2.
Sketch and description of coastline before waves
Sketch and description of coastline after waves
3
Investigation 14B Human Impacts on Coastal Erosion
4. Sketch the new eroded shape of the coastline with the model jetty in your stream table in Table 2.
Table 2: Coastal erosion observations with jetty
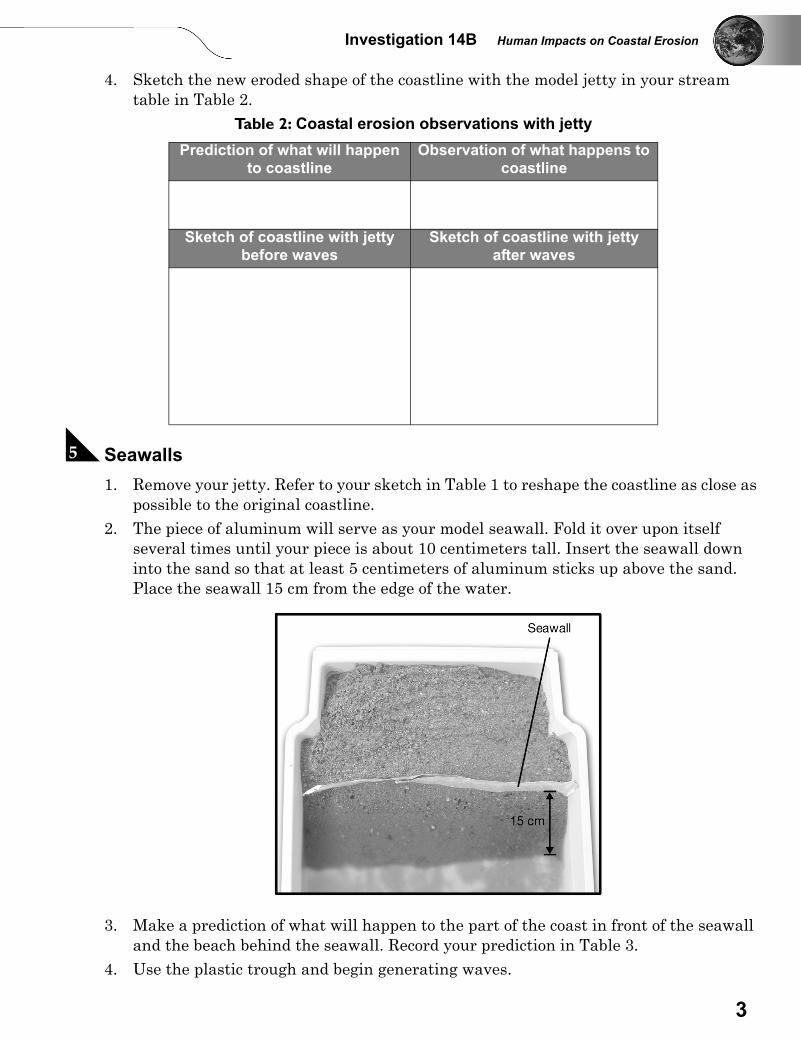
E Seawalls 1. Remove your jetty. Refer to your sketch in Table 1 to reshape the coastline as close as
possible to the original coastline.2. The piece of aluminum will serve as your model seawall. Fold it over upon itself
several times until your piece is about 10 centimeters tall. Insert the seawall down into the sand so that at least 5 centimeters of aluminum sticks up above the sand. Place the seawall 15 cm from the edge of the water.
3. Make a prediction of what will happen to the part of the coast in front of the seawall and the beach behind the seawall. Record your prediction in Table 3.
4. Use the plastic trough and begin generating waves.
Prediction of what will happen to coastline
Observation of what happens to coastline
Sketch of coastline with jetty before waves
Sketch of coastline with jetty after waves
4
5. Observe and record what happens to the coast in front of the seawall and the beach behind the seawall in Table 3.
6. Sketch the new eroded shape of the coastline with the seawall in your stream table in Table 3.
Table 3: Coastal erosion observations with seawall
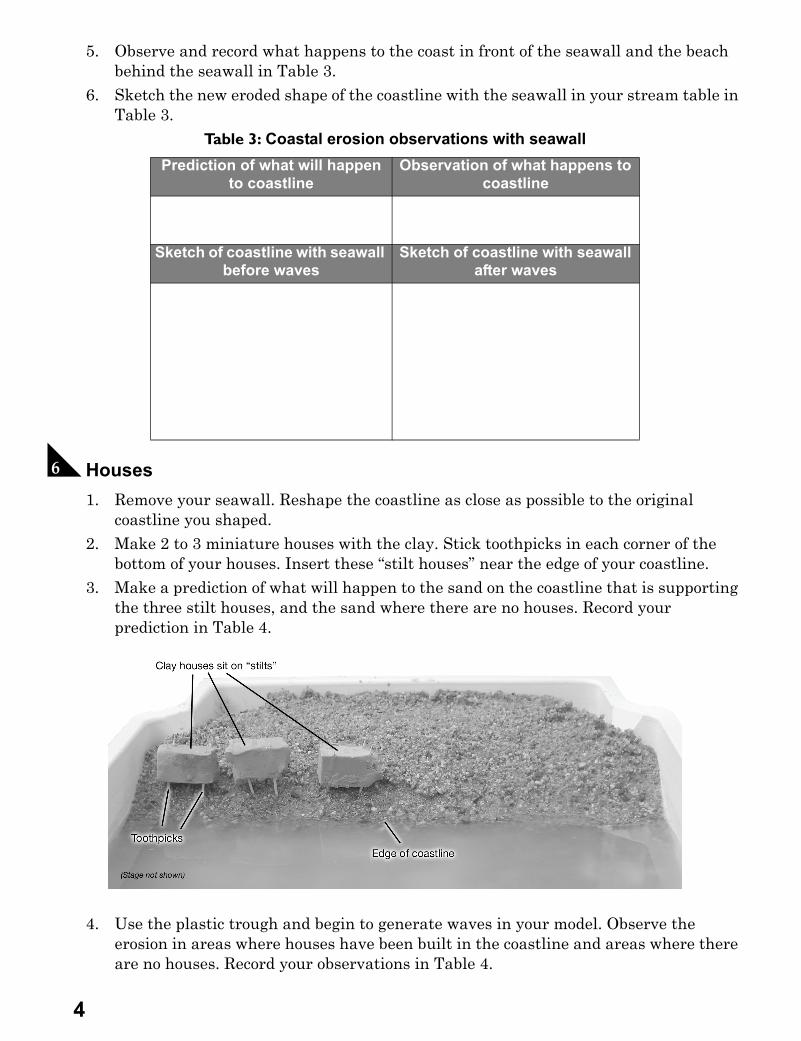
F Houses1. Remove your seawall. Reshape the coastline as close as possible to the original
coastline you shaped.2. Make 2 to 3 miniature houses with the clay. Stick toothpicks in each corner of the
bottom of your houses. Insert these “stilt houses” near the edge of your coastline.3. Make a prediction of what will happen to the sand on the coastline that is supporting
the three stilt houses, and the sand where there are no houses. Record your prediction in Table 4.
4. Use the plastic trough and begin to generate waves in your model. Observe the erosion in areas where houses have been built in the coastline and areas where there are no houses. Record your observations in Table 4.
Prediction of what will happen to coastline
Observation of what happens to coastline
Sketch of coastline with seawall before waves
Sketch of coastline with seawall after waves
5
Investigation 14B Human Impacts on Coastal Erosion
5. Sketch the new eroded shape of the coastline with houses in your stream table in Table 4.
Table 4: Coastal erosion observation with houses
G Thinking about what you observed a. How does the rate of erosion of coastal areas change when the size and frequency of
waves increases?
b. What natural causes can create large and more frequent waves?
c. How did the erosion of the coastline differ behind the jetty compared to the part of the coastline without the jetty in front of it? Explain the reasoning behind any differences.
d. Explain the effects on the coastal areas between the seawall and the water. How would this process impact the sea life that lives in this area? How would it effect the way this land may be used by people?
Prediction of what will happen to coastline
Observation of what happens to coastline
Sketch of coastline with houses before waves
Sketch of coastline with houses after waves
6
e. What do you think happens to the density of the sand and other sediments near the coast where houses are built? How would this effect the houses?
f. Summarize how the building of hard structures such as seawalls, jetties, and houses can impact the natural erosion of coastal areas due to waves.