Embed Size (px)
Citation preview
Investec Asset Management (becoming Ninety One)Global asset manager with an emerging market heritage
Capital Markets Day3 December, 2019
2
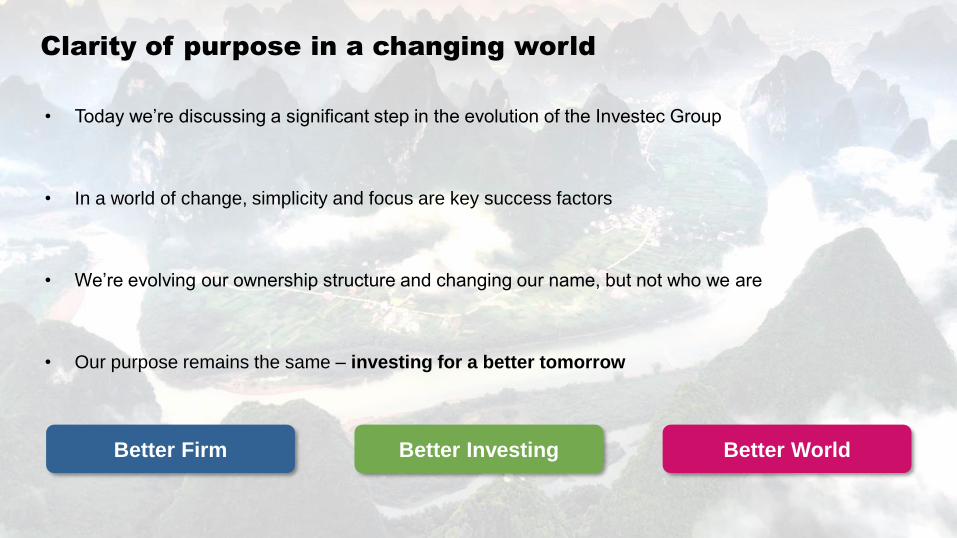
Clarity of purpose in a changing world
• Today we’re discussing a significant step in the evolution of the Investec Group
• In a world of change, simplicity and focus are key success factors
• We’re evolving our ownership structure and changing our name, but not who we are
• Our purpose remains the same – investing for a better tomorrow
Better Firm Better Investing Better World
3
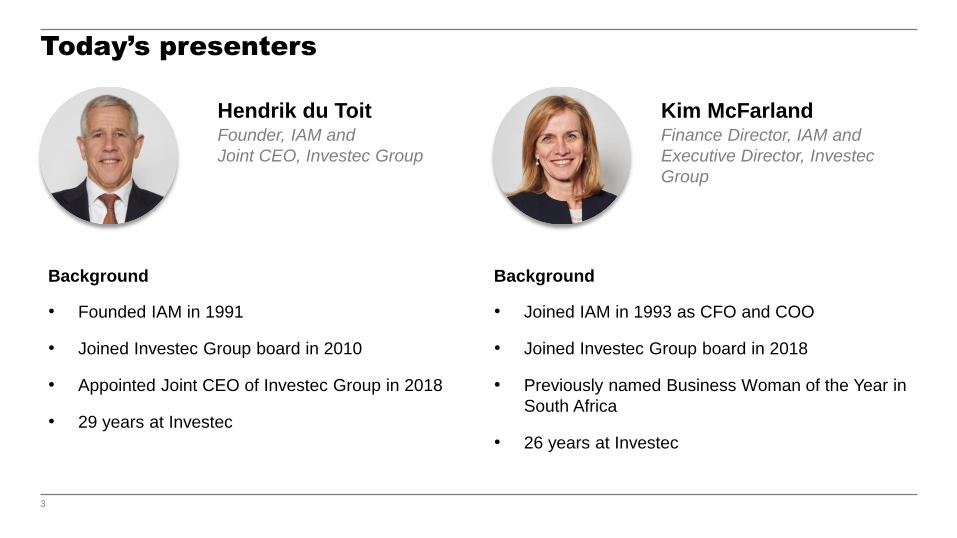
Today’s presenters
Hendrik du ToitFounder, IAM and
Joint CEO, Investec Group
Background
Kim McFarlandFinance Director, IAM and
Executive Director, Investec
Group
Background
• Founded IAM in 1991
• Joined Investec Group board in 2010
• Appointed Joint CEO of Investec Group in 2018
• 29 years at Investec
• Joined IAM in 1993 as CFO and COO
• Joined Investec Group board in 2018
• Previously named Business Woman of the Year in
South Africa
• 26 years at Investec
4
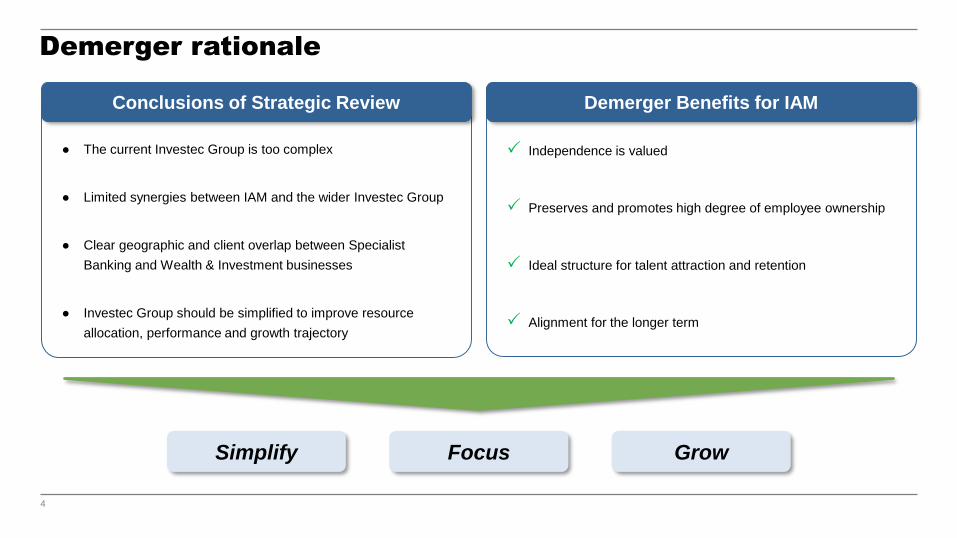
Demerger rationale
● The current Investec Group is too complex
● Limited synergies between IAM and the wider Investec Group
● Clear geographic and client overlap between Specialist
Banking and Wealth & Investment businesses
● Investec Group should be simplified to improve resource
allocation, performance and growth trajectory
Independence is valued
Preserves and promotes high degree of employee ownership
Ideal structure for talent attraction and retention
Alignment for the longer term
Conclusions of Strategic Review Demerger Benefits for IAM
Simplify Focus Grow
5
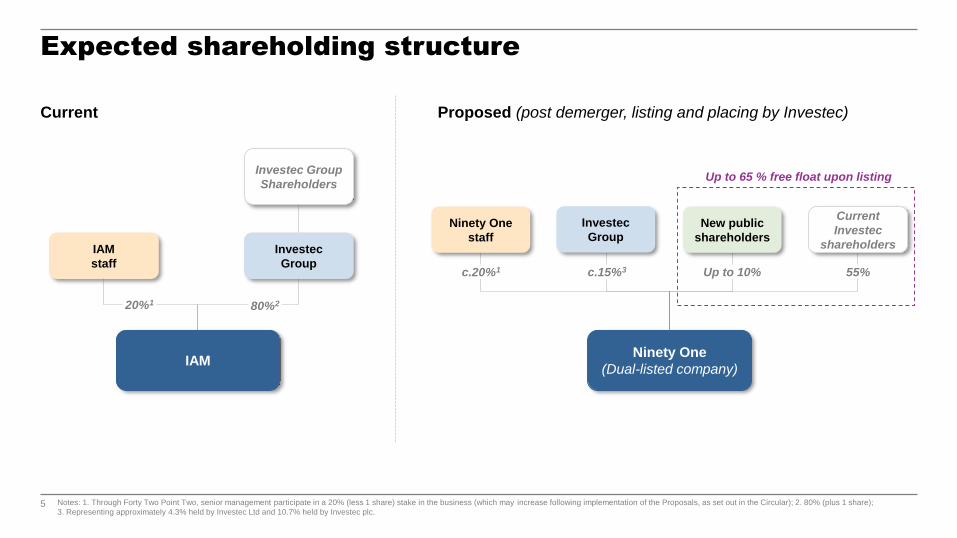
Expected shareholding structure
Current
IAM
IAM
staff
Investec
Group
Investec Group
Shareholders
Proposed (post demerger, listing and placing by Investec)
Ninety One
(Dual-listed company)
80%220%1
c.15%3
Ninety One
staff
c.20%1
Current
Investec
shareholders
55%
New public
shareholders
Up to 10%
Notes: 1. Through Forty Two Point Two, senior management participate in a 20% (less 1 share) stake in the business (which may increase following implementation of the Proposals, as set out in the Circular); 2. 80% (plus 1 share);
3. Representing approximately 4.3% held by Investec Ltd and 10.7% held by Investec plc.
Investec
Group
Up to 65 % free float upon listing

6
Retaining our dual-listed structure
Aligned with regulatory requirements
Ninety One plc to be premium listed on LSE with a secondary inward listing on JSE
Enables us to remain connected to our roots
Ninety One Limited to be listed on JSE
All shareholders will have equivalent economic and voting rights
7
We are changing our name, but not who we are
8
Hendrik du ToitChief Executive Officer
Kim McFarlandFinance Director
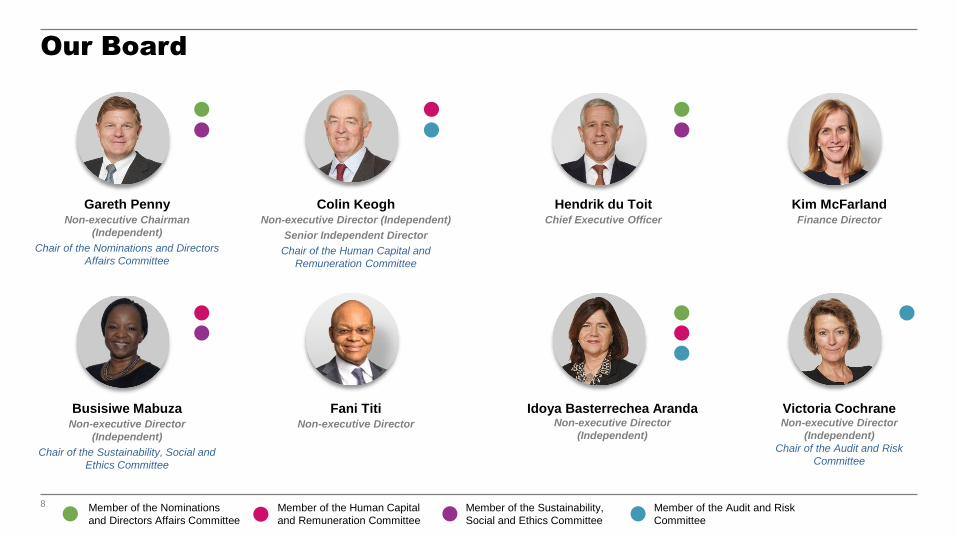
Our Board
Fani TitiNon-executive Director
Gareth PennyNon-executive Chairman
(Independent)
Chair of the Nominations and Directors
Affairs Committee
Colin KeoghNon-executive Director (Independent)
Senior Independent Director
Chair of the Human Capital and
Remuneration Committee
Idoya Basterrechea ArandaNon-executive Director
(Independent)
Victoria CochraneNon-executive Director
(Independent)
Chair of the Audit and Risk
Committee
Busisiwe MabuzaNon-executive Director
(Independent)
Chair of the Sustainability, Social and
Ethics Committee
Member of the Nominations
and Directors Affairs Committee
Member of the Human Capital
and Remuneration Committee
Member of the Sustainability,
Social and Ethics Committee
Member of the Audit and Risk
Committee

9
Today’s agenda
Key differentiators
Strategic principles and priorities
Financial performance and outlook
10
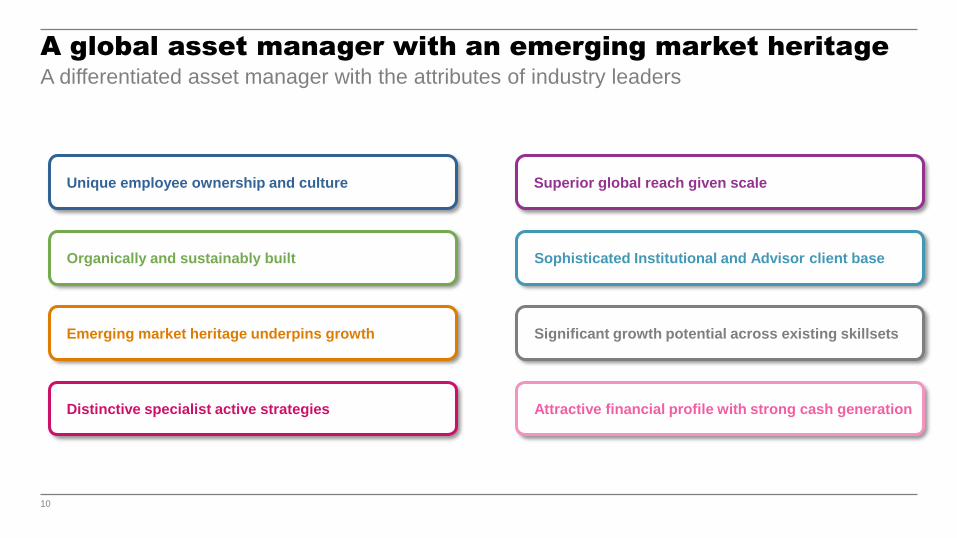
A global asset manager with an emerging market heritage
Unique employee ownership and culture
Organically and sustainably built
Distinctive specialist active strategies
Emerging market heritage underpins growth
Superior global reach given scale
Sophisticated Institutional and Advisor client base
Significant growth potential across existing skillsets
Attractive financial profile with strong cash generation
A differentiated asset manager with the attributes of industry leaders
11
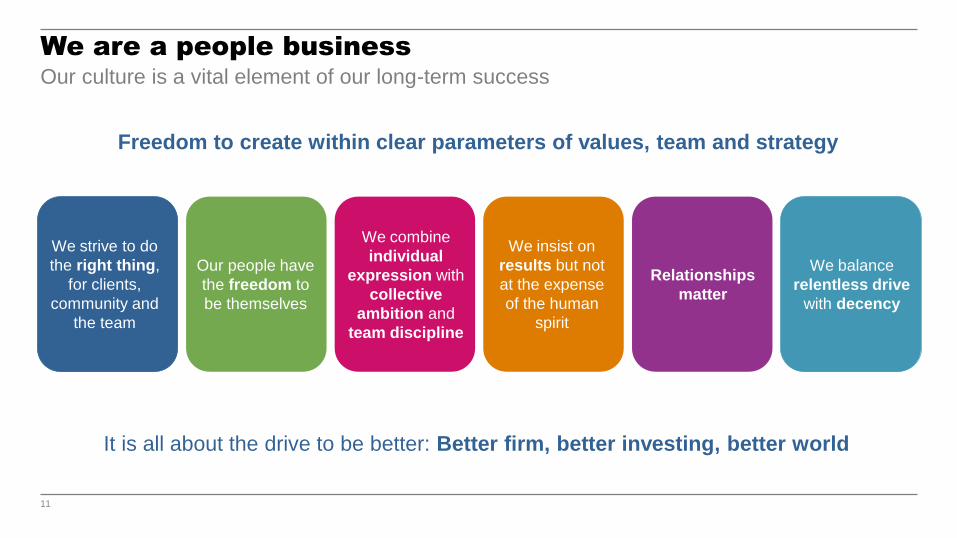
We are a people businessOur culture is a vital element of our long-term success
Our people have
the freedom to
be themselves
We combine
individual
expression with
collective
ambition and
team discipline
We insist on
results but not
at the expense
of the human
spirit
We balance
relentless drive
with decency
Freedom to create within clear parameters of values, team and strategy
It is all about the drive to be better: Better firm, better investing, better world
We strive to do
the right thing,
for clients,
community and
the team
Relationships
matter
12
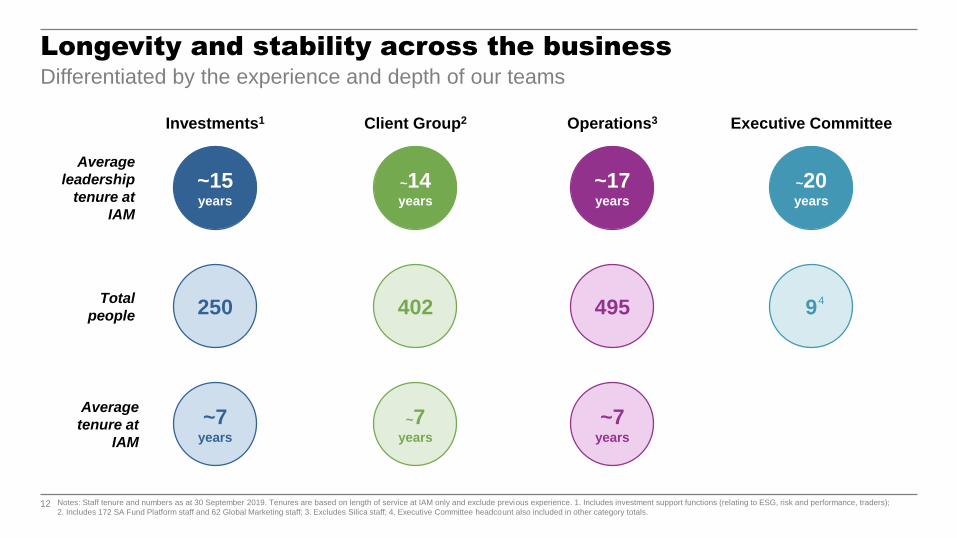
Longevity and stability across the business
Notes: Staff tenure and numbers as at 30 September 2019. Tenures are based on length of service at IAM only and exclude previous experience. 1. Includes investment support functions (relating to ESG, risk and performance, traders);
2. Includes 172 SA Fund Platform staff and 62 Global Marketing staff; 3. Excludes Silica staff; 4. Executive Committee headcount also included in other category totals.
Investments1 Client Group2 Operations3 Executive Committee
~20years
~7 years
~7years
~7years
Average
tenure at
IAM
Average
leadership
tenure at
IAM
~15 years
~14years
~17years
Differentiated by the experience and depth of our teams
250 402 495 9Total
people4
13
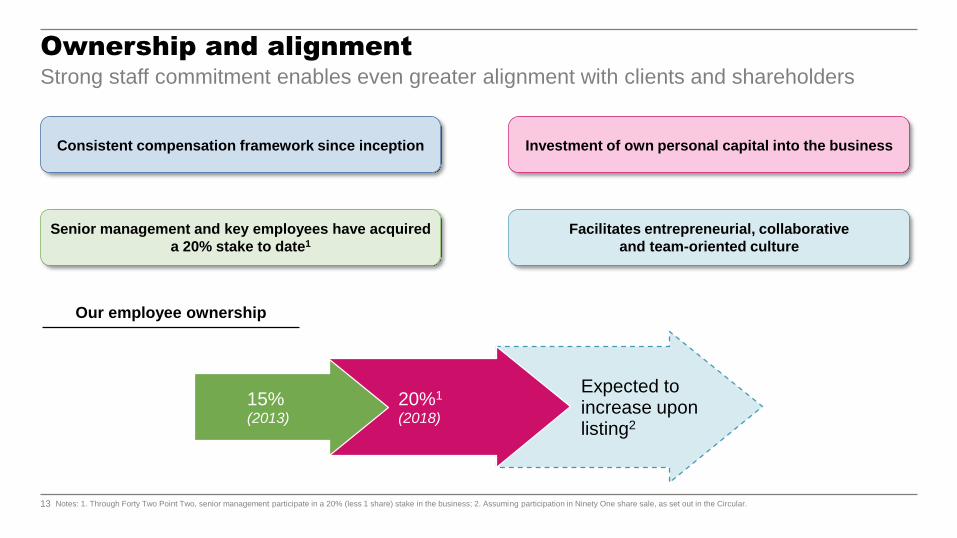
Ownership and alignment
Notes: 1. Through Forty Two Point Two, senior management participate in a 20% (less 1 share) stake in the business; 2. Assuming participation in Ninety One share sale, as set out in the Circular.
15%(2013)
20%1
(2018)
Expected to increase upon listing2
Our employee ownership
Strong staff commitment enables even greater alignment with clients and shareholders
Consistent compensation framework since inception
Senior management and key employees have acquired
a 20% stake to date1
Investment of own personal capital into the business
Facilitates entrepreneurial, collaborative
and team-oriented culture
14
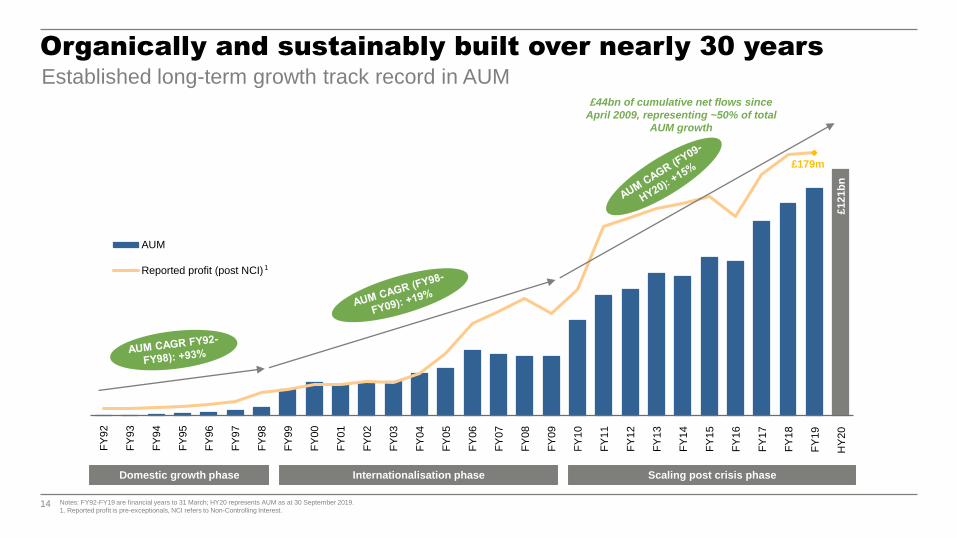
£121b
n
£179m
AUM
Reported profit (post NCI)
Organically and sustainably built over nearly 30 years
FY
92
FY
93
FY
94
FY
95
FY
96
FY
97
FY
98
FY
99
FY
00
FY
01
FY
02
FY
03
FY
04
FY
05
FY
06
FY
07
FY
08
FY
09
FY
10
FY
11
FY
12
FY
13
FY
14
FY
15
FY
16
FY
17
FY
18
FY
19
Notes: FY92-FY19 are financial years to 31 March; HY20 represents AUM as at 30 September 2019.
1. Reported profit is pre-exceptionals, NCI refers to Non-Controlling Interest.
£44bn of cumulative net flows since
April 2009, representing ~50% of total
AUM growth
Established long-term growth track record in AUM
HY
20
Domestic growth phase Internationalisation phase Scaling post crisis phase
1
15
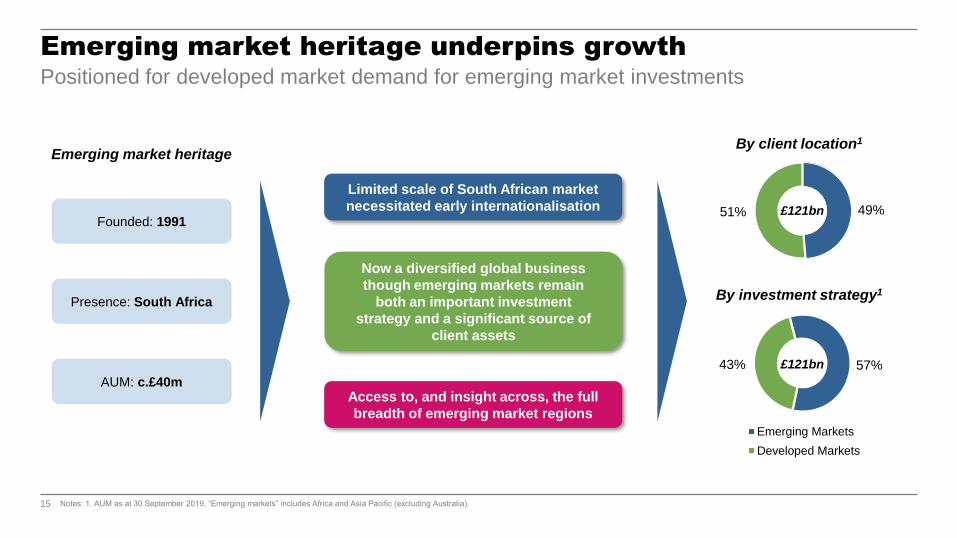
57%43%
49%51%
50%50%Emerging Markets
Developed Markets
Emerging market heritage underpins growthPositioned for developed market demand for emerging market investments
Notes: 1. AUM as at 30 September 2019, “Emerging markets” includes Africa and Asia Pacific (excluding Australia).
£121bn
By client location1
By investment strategy1
Emerging market heritage
Limited scale of South African market
necessitated early internationalisation
Now a diversified global business
though emerging markets remain
both an important investment
strategy and a significant source of
client assets
Access to, and insight across, the full
breadth of emerging market regions
Founded: 1991
Presence: South Africa
AUM: c.£40m
£121bn
16
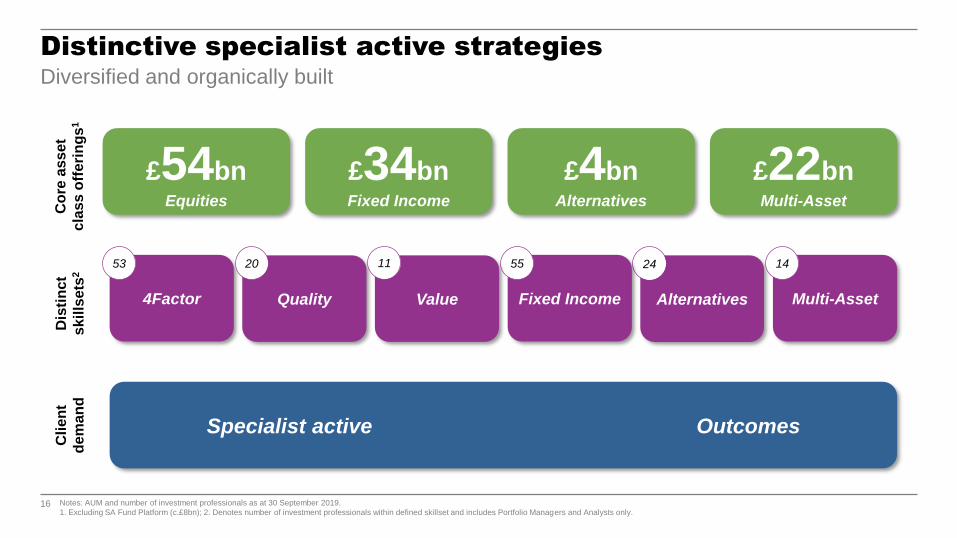
Alternatives
24
Distinctive specialist active strategies
Notes: AUM and number of investment professionals as at 30 September 2019.
1. Excluding SA Fund Platform (c.£8bn); 2. Denotes number of investment professionals within defined skillset and includes Portfolio Managers and Analysts only.
Dis
tin
ct
skil
lsets
2
4Factor
53
Fixed Income
55
Quality
20
Value
11
Cli
en
t
dem
an
d
£34bnFixed Income
Co
re a
ss
et
cla
ss
off
eri
ng
s1
£54bnEquities
£4bnAlternatives
£22bnMulti-Asset
Diversified and organically built
Multi-Asset
14
Specialist active Outcomes
17
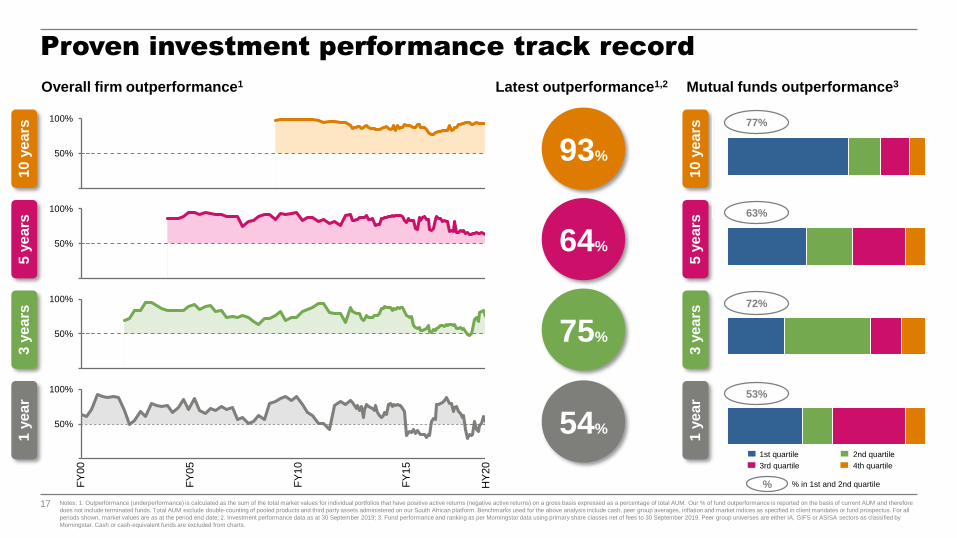
1st quartile 2nd quartile
3rd quartile 4th quartile
0%
50%
100%
1 y
ear
3 y
ears
5 y
ears
10 y
ears
93%
64%
75%
54%
1 y
ear
3 y
ears
5 y
ears
10 y
ears
Latest outperformance1,2Overall firm outperformance1 Mutual funds outperformance3
Notes: 1. Outperformance (underperformance) is calculated as the sum of the total market values for individual portfolios that have positive active returns (negative active returns) on a gross basis expressed as a percentage of total AUM. Our % of fund outperformance is reported on the basis of current AUM and therefore
does not include terminated funds. Total AUM exclude double-counting of pooled products and third party assets administered on our South African platform. Benchmarks used for the above analysis include cash, peer group averages, inflation and market indices as specified in client mandates or fund prospectus. For all
periods shown, market values are as at the period end date; 2. Investment performance data as at 30 September 2019; 3. Fund performance and ranking as per Morningstar data using primary share classes net of fees to 30 September 2019. Peer group universes are either IA, GIFS or ASISA sectors as classified by
Morningstar. Cash or cash-equivalent funds are excluded from charts.
77%
63%
72%
53%
% % in 1st and 2nd quartile
Proven investment performance track record
0%
50%
100%
0%
50%
100%
0%
50%
100%
FY
00
FY
05
FY
10
FY
15
HY
20
18
Today’s agenda
Key differentiators
Strategic principles and priorities
Financial performance and outlook
19
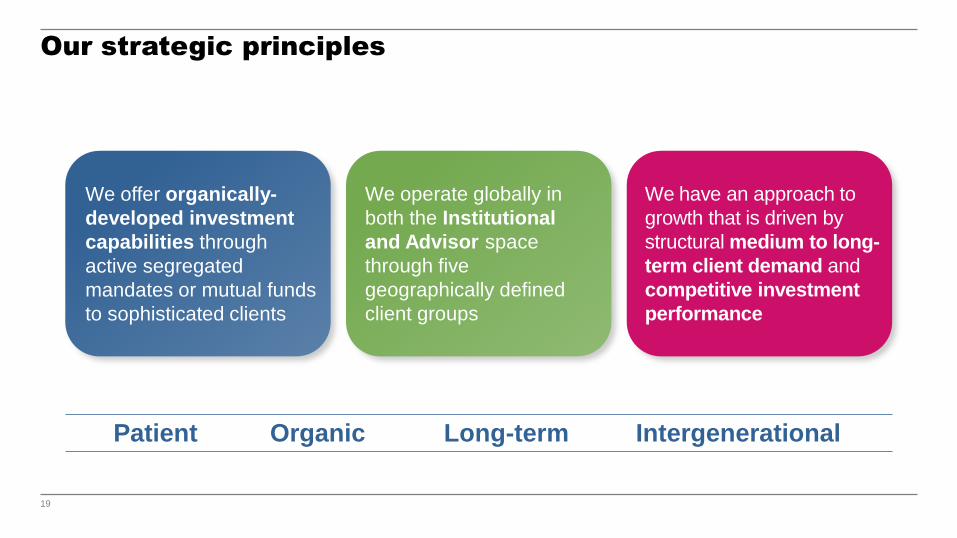
Our strategic principles
Patient Organic Long-term Intergenerational
We offer organically-
developed investment
capabilities through
active segregated
mandates or mutual funds
to sophisticated clients
We operate globally in
both the Institutional
and Advisor space
through five
geographically defined
client groups
We have an approach to
growth that is driven by
structural medium to long-
term client demand and
competitive investment
performance
20
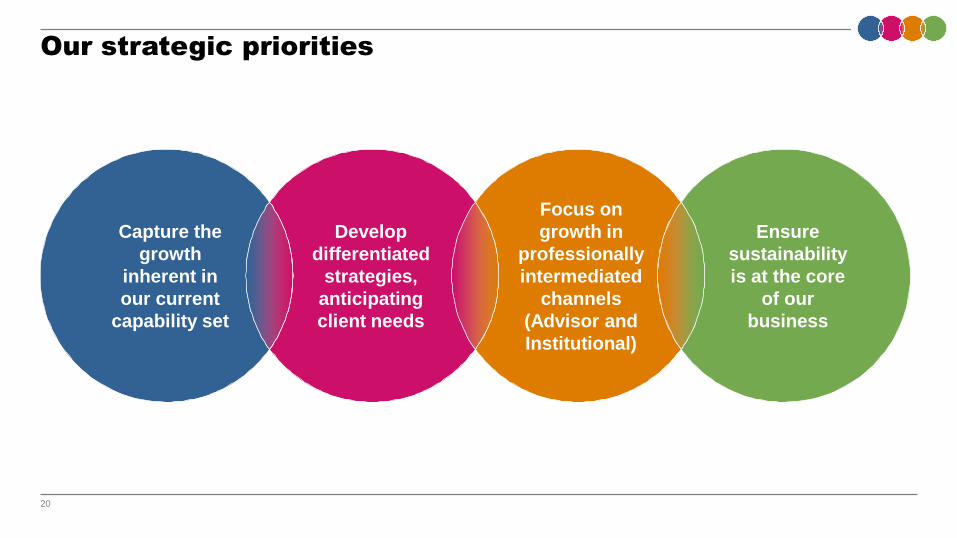
Our strategic priorities
Capture the
growth
inherent in
our current
capability set
Develop
differentiated
strategies,
anticipating
client needs
Focus on
growth in
professionally
intermediated
channels
(Advisor and
Institutional)
Ensure
sustainability
is at the core
of our
business
21
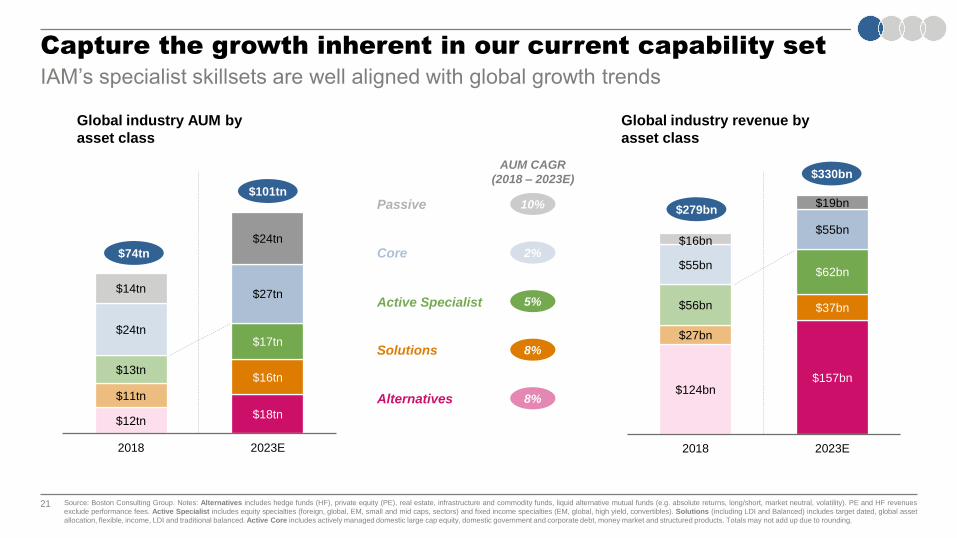
$12tn$18tn
$11tn
$16tn$13tn
$17tn$24tn
$27tn$14tn
$24tn
2018 2023E
IAM’s specialist skillsets are well aligned with global growth trends
$124bn$157bn
$27bn
$37bn$56bn
$62bn$55bn
$55bn$16bn
$19bn
2018 2023E
Global industry AUM by
asset class
Global industry revenue by
asset class
Capture the growth inherent in our current capability set
Source: Boston Consulting Group. Notes: Alternatives includes hedge funds (HF), private equity (PE), real estate, infrastructure and commodity funds, liquid alternative mutual funds (e.g. absolute returns, long/short, market neutral, volatility). PE and HF revenues
exclude performance fees. Active Specialist includes equity specialties (foreign, global, EM, small and mid caps, sectors) and fixed income specialties (EM, global, high yield, convertibles). Solutions (including LDI and Balanced) includes target dated, global asset
allocation, flexible, income, LDI and traditional balanced. Active Core includes actively managed domestic large cap equity, domestic government and corporate debt, money market and structured products. Totals may not add up due to rounding.
Alternatives
Solutions
Active Specialist
Passive
Core$74tn
$101tn
$279bn
$330bn
10%
2%
5%
8%
8%
AUM CAGR
(2018 – 2023E)
22
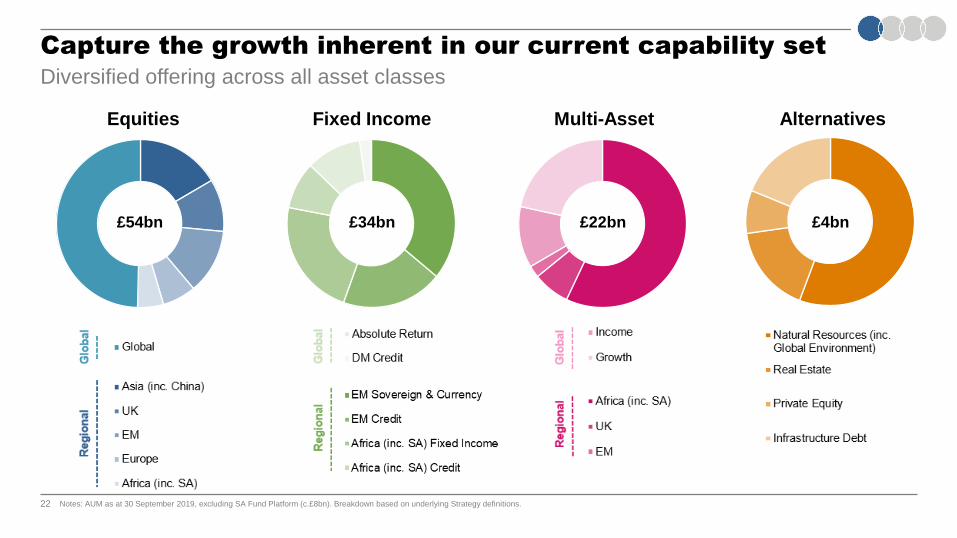
Capture the growth inherent in our current capability set
Diversified offering across all asset classes
Note: AUM as at 30 September 2019, excluding SA Fund Platform (£8bn). Breakdown based on underlying Strategy definition
Asia (inc. China)
UK
EM
Europe
Africa (inc. SA)
Global
£4bn£54bn
EM Sovereign & Currency
EM Credit
Africa (inc. SA) FI
Africa (inc. SA) Credit
Absolute Return
DM Credit
£34bn £22bn
Reg
ion
al
Glo
ba
l
Re
gio
na
l G
lob
al
Reg
ion
al
Glo
ba
l
Equities Fixed Income Multi-Asset Alternatives
Africa (inc. SA)
UK
EM
Income
Growth
Natural Resources (inc.Global Environment)
Real Estate
Private Equity
Infrastructure Debt
Notes: AUM as at 30 September 2019, excluding SA Fund Platform (c.£8bn). Breakdown based on underlying Strategy definitions.
23
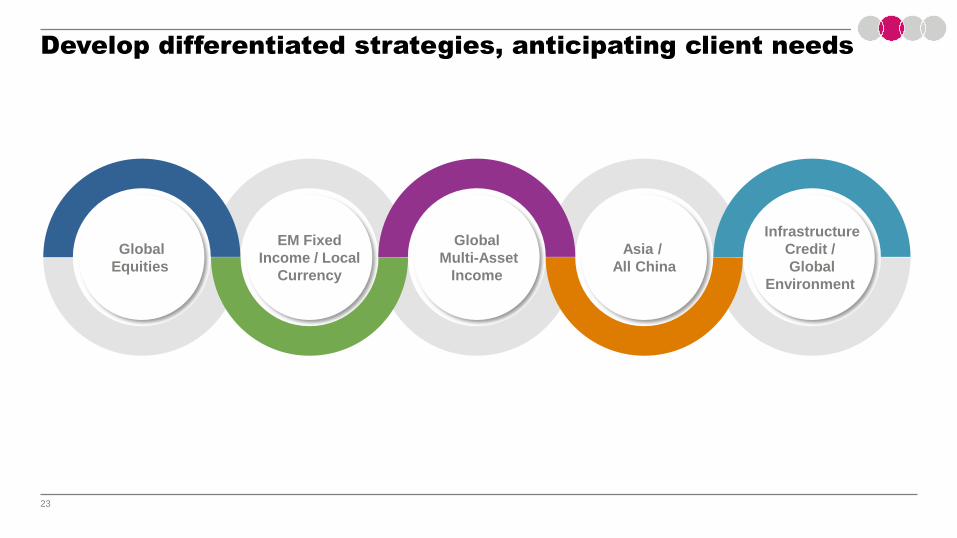
Develop differentiated strategies, anticipating client needs
Global
Equities
EM Fixed
Income / Local
Currency
Global
Multi-Asset
Income
Asia /
All China
Infrastructure
Credit /
Global
Environment
24
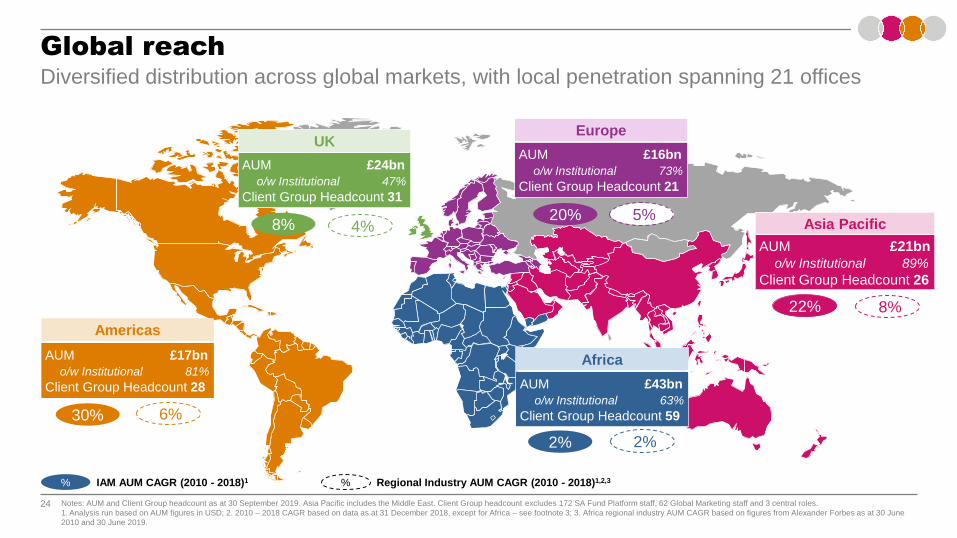
% IAM AUM CAGR (2010 - 2018)1 % Regional Industry AUM CAGR (2010 - 2018)1,2,3
AUM £17bn
o/w Institutional 81%
Client Group Headcount 28
Americas
30% 6%
AUM £43bn
o/w Institutional 63%
Client Group Headcount 59
Africa
AUM £21bn
o/w Institutional 89%
Client Group Headcount 26
Asia Pacific
AUM £16bn
o/w Institutional 73%
Client Group Headcount 21
Europe
AUM £24bn
o/w Institutional 47%
Client Group Headcount 31
UK
8%20%
22%
2%
4%5%
8%
2%
Global reachDiversified distribution across global markets, with local penetration spanning 21 offices
Notes: AUM and Client Group headcount as at 30 September 2019. Asia Pacific includes the Middle East. Client Group headcount excludes 172 SA Fund Platform staff, 62 Global Marketing staff and 3 central roles.
1. Analysis run based on AUM figures in USD; 2. 2010 – 2018 CAGR based on data as at 31 December 2018, except for Africa – see footnote 3; 3. Africa regional industry AUM CAGR based on figures from Alexander Forbes as at 30 June
2010 and 30 June 2019.
25
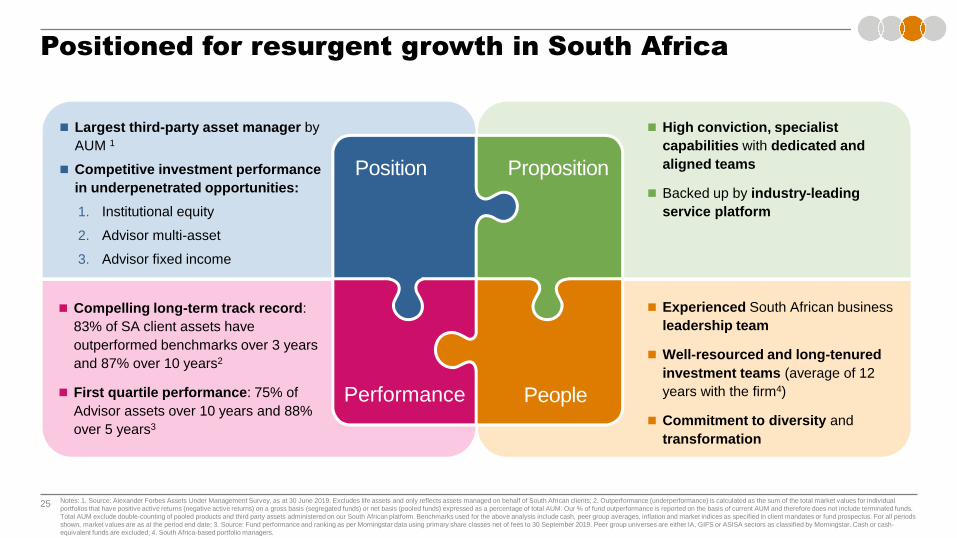
Positioned for resurgent growth in South Africa
Notes: 1. Source: Alexander Forbes Assets Under Management Survey, as at 30 June 2019. Excludes life assets and only reflects assets managed on behalf of South African clients; 2. Outperformance (underperformance) is calculated as the sum of the total market values for individual
portfolios that have positive active returns (negative active returns) on a gross basis (segregated funds) or net basis (pooled funds) expressed as a percentage of total AUM. Our % of fund outperformance is reported on the basis of current AUM and therefore does not include terminated funds.
Total AUM exclude double-counting of pooled products and third party assets administered on our South African platform. Benchmarks used for the above analysis include cash, peer group averages, inflation and market indices as specified in client mandates or fund prospectus. For all periods
shown, market values are as at the period end date; 3. Source: Fund performance and ranking as per Morningstar data using primary share classes net of fees to 30 September 2019. Peer group universes are either IA, GIFS or ASISA sectors as classified by Morningstar. Cash or cash-
equivalent funds are excluded; 4. South Africa-based portfolio managers.
◼ Compelling long-term track record:
83% of SA client assets have
outperformed benchmarks over 3 years
and 87% over 10 years2
◼ First quartile performance: 75% of
Advisor assets over 10 years and 88%
over 5 years3
◼ Experienced South African business
leadership team
◼ Well-resourced and long-tenured
investment teams (average of 12
years with the firm4)
◼ Commitment to diversity and
transformation
◼ Largest third-party asset manager by
AUM 1
◼ Competitive investment performance
in underpenetrated opportunities:
1. Institutional equity
2. Advisor multi-asset
3. Advisor fixed income
◼ High conviction, specialist
capabilities with dedicated and
aligned teams
◼ Backed up by industry-leading
service platform
Position Proposition
PeoplePerformance
26
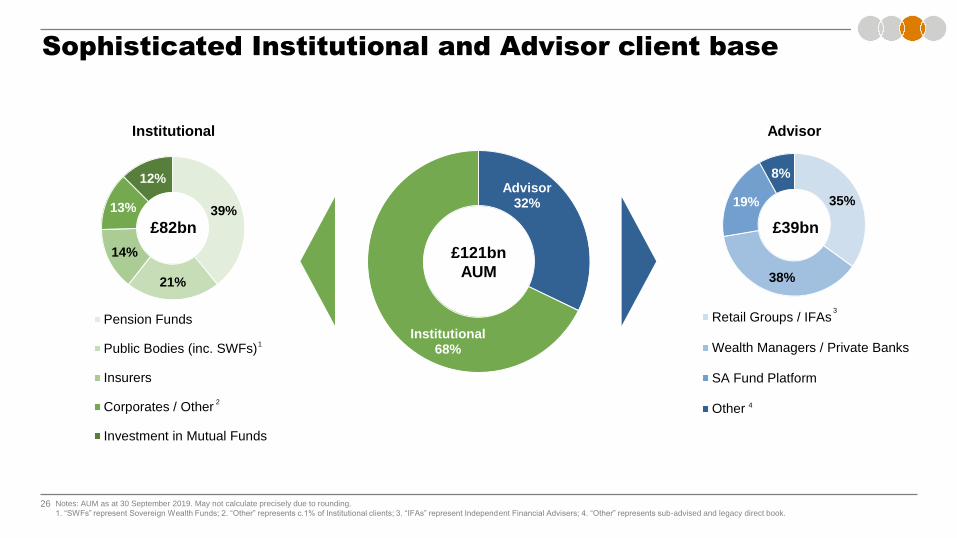
39%
21%
14%
13%
12%
Pension Funds
Public Bodies (inc. SWFs)
Insurers
Corporates / Other
Investment in Mutual Funds
35%
38%
19%
8%
Retail Groups / IFAs
Wealth Managers / Private Banks
SA Fund Platform
Other
Advisor32%
Institutional68%
Sophisticated Institutional and Advisor client base
Institutional Advisor
£121bn
AUM
£39bn£82bn
1
4
3
Notes: AUM as at 30 September 2019. May not calculate precisely due to rounding.
1. “SWFs” represent Sovereign Wealth Funds; 2. “Other” represents c.1% of Institutional clients; 3. “IFAs” represent Independent Financial Advisers; 4. “Other” represents sub-advised and legacy direct book.
39%
21%
14%
12%
12%
Pension Funds
Public Bodies (inc. SWFs)
Insurers
Corporates / Other
Investment in Mutual Funds
2
27
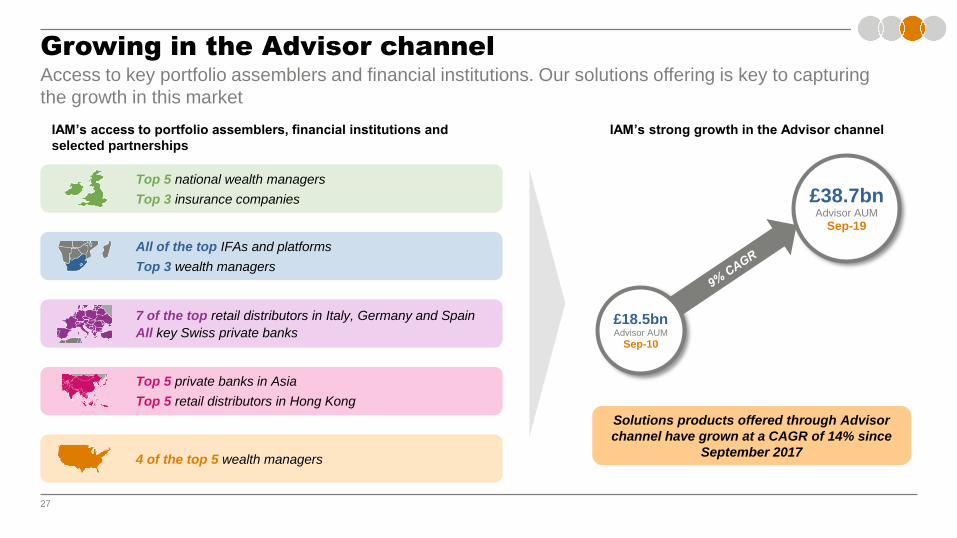
Growing in the Advisor channelAccess to key portfolio assemblers and financial institutions. Our solutions offering is key to capturing
the growth in this market
IAM’s access to portfolio assemblers, financial institutions and
selected partnerships
All of the top IFAs and platforms
Top 3 wealth managers
7 of the top retail distributors in Italy, Germany and Spain
All key Swiss private banks
Top 5 private banks in Asia
Top 5 retail distributors in Hong Kong
4 of the top 5 wealth managers
Top 5 national wealth managers
Top 3 insurance companies
£18.5bnAdvisor AUM
Sep-10
£38.7bnAdvisor AUM
Sep-19
IAM’s strong growth in the Advisor channel
Solutions products offered through Advisor
channel have grown at a CAGR of 14% since
September 2017
28
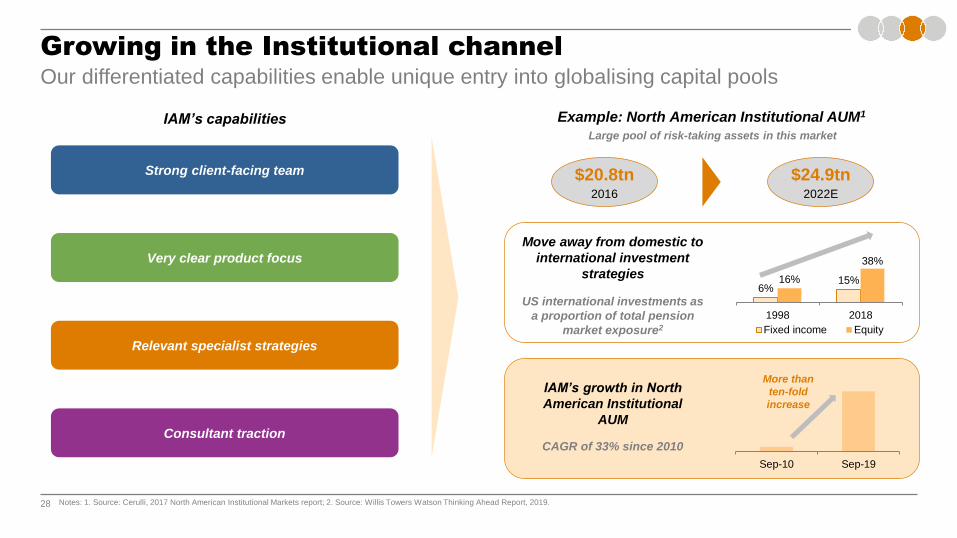
Growing in the Institutional channelOur differentiated capabilities enable unique entry into globalising capital pools
Strong client-facing team
Very clear product focus
Consultant traction
Relevant specialist strategies
Example: North American Institutional AUM1
Large pool of risk-taking assets in this market
$24.9tn2022E
$20.8tn2016
IAM’s capabilities
IAM’s growth in North
American Institutional
AUM
Sep-10 Sep-19
6%15%16%
38%
1998 2018
Fixed income Equity
US international investments as
a proportion of total pension
market exposure2
Move away from domestic to
international investment
strategies
CAGR of 33% since 2010
Notes: 1. Source: Cerulli, 2017 North American Institutional Markets report; 2. Source: Willis Towers Watson Thinking Ahead Report, 2019.
More than
ten-fold
increase
29
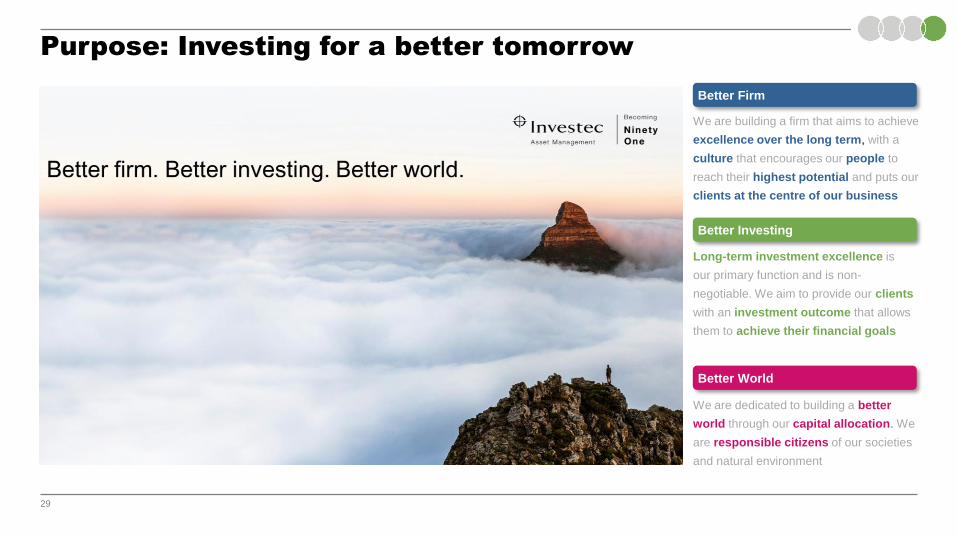
Purpose: Investing for a better tomorrow
Better Firm
We are building a firm that aims to achieve
excellence over the long term, with a
culture that encourages our people to
reach their highest potential and puts our
clients at the centre of our business
Long-term investment excellence is
our primary function and is non-
negotiable. We aim to provide our clients
with an investment outcome that allows
them to achieve their financial goals
Better Investing
We are dedicated to building a better
world through our capital allocation. We
are responsible citizens of our societies
and natural environment
Better World
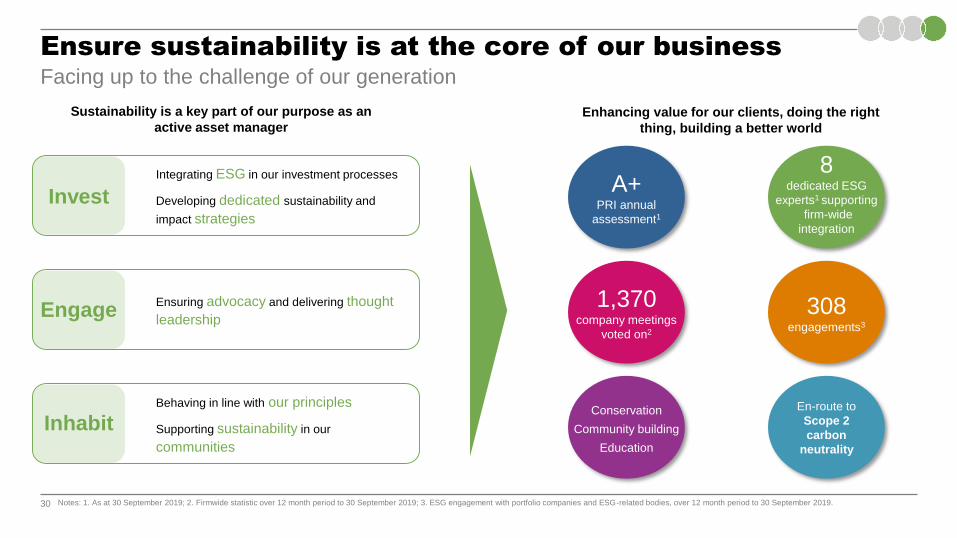
30 Notes: 1. As at 30 September 2019; 2. Firmwide statistic over 12 month period to 30 September 2019; 3. ESG engagement with portfolio companies and ESG-related bodies, over 12 month period to 30 September 2019.
Ensure sustainability is at the core of our business
Sustainability is a key part of our purpose as an
active asset manager
Integrating ESG in our investment processes
Developing dedicated sustainability and
impact strategies
Invest
Ensuring advocacy and delivering thought
leadershipEngage
Behaving in line with our principles
Supporting sustainability in our
communities
Inhabit
Enhancing value for our clients, doing the right
thing, building a better world
A+PRI annual
assessment1
1,370company meetings
voted on2
8dedicated ESG
experts1 supporting
firm-wide
integration
Conservation
Community building
Education
308 engagements3
En-route to
Scope 2
carbon
neutrality
Facing up to the challenge of our generation
31
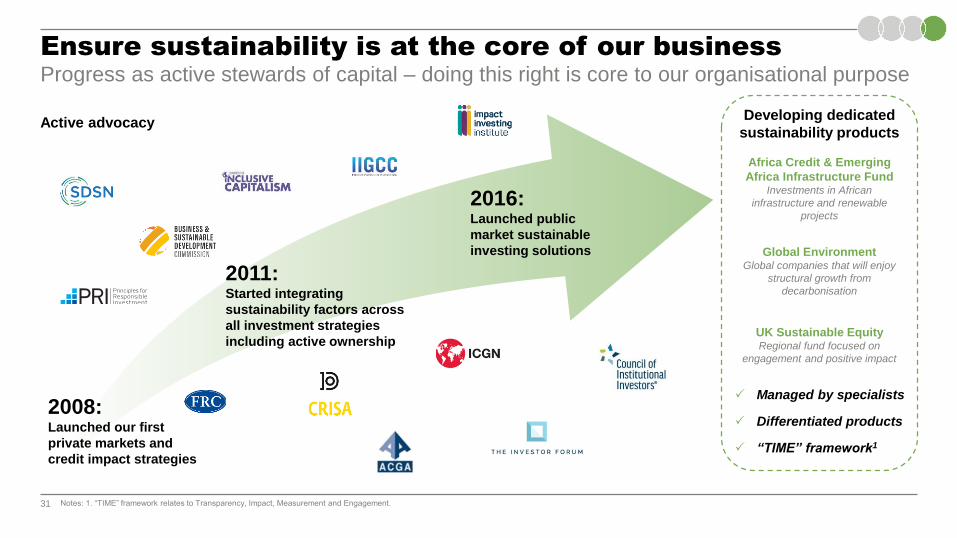
Ensure sustainability is at the core of our business
2016: Launched public
market sustainable
investing solutions
2011: Started integrating
sustainability factors across
all investment strategies
including active ownership
2008: Launched our first
private markets and
credit impact strategies
Progress as active stewards of capital – doing this right is core to our organisational purpose
Active advocacy
Managed by specialists
Differentiated products
“TIME” framework1
Developing dedicated
sustainability products
Global EnvironmentGlobal companies that will enjoy
structural growth from
decarbonisation
UK Sustainable EquityRegional fund focused on
engagement and positive impact
Notes: 1. “TIME” framework relates to Transparency, Impact, Measurement and Engagement.
Africa Credit & Emerging
Africa Infrastructure FundInvestments in African
infrastructure and renewable
projects
32
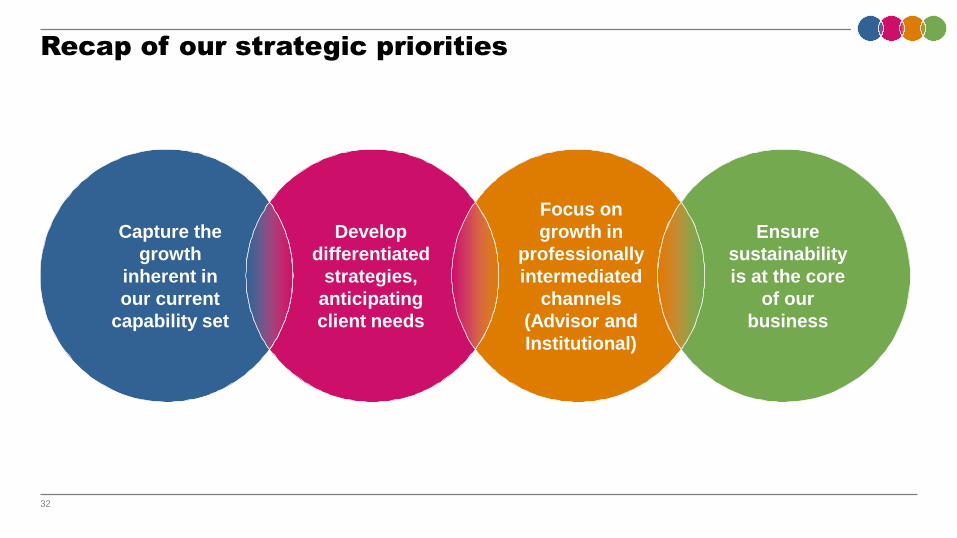
Recap of our strategic priorities
Capture the
growth
inherent in
our current
capability set
Develop
differentiated
strategies,
anticipating
client needs
Focus on
growth in
professionally
intermediated
channels
(Advisor and
Institutional)
Ensure
sustainability
is at the core
of our
business

33
Today’s agenda
Key differentiators
Strategic principles and priorities
Financial performance and outlook
34
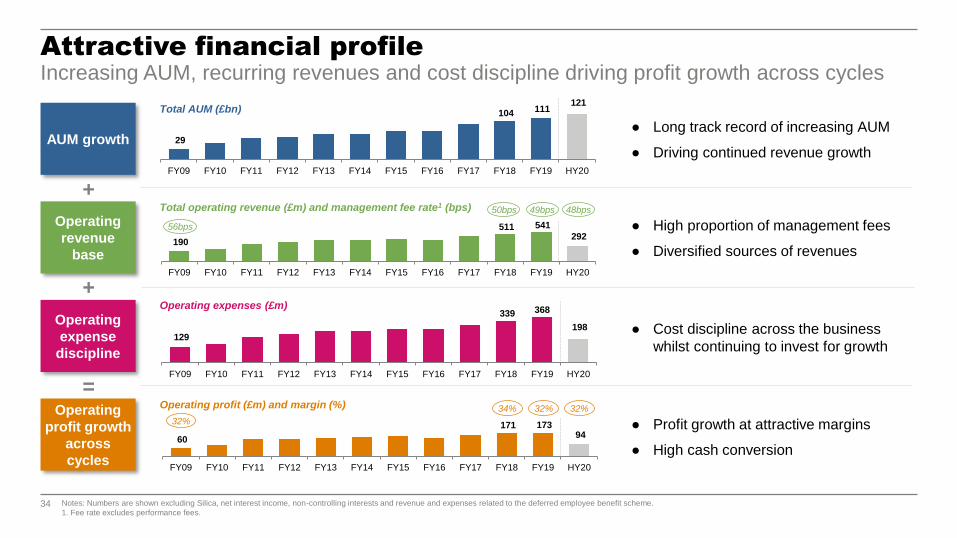
190
511 541
292
FY09 FY10 FY11 FY12 FY13 FY14 FY15 FY16 FY17 FY18 FY19 HY20
129
339 368
198
FY09 FY10 FY11 FY12 FY13 FY14 FY15 FY16 FY17 FY18 FY19 HY20
60
171 173 94
FY09 FY10 FY11 FY12 FY13 FY14 FY15 FY16 FY17 FY18 FY19 HY20
29
104 111 121
FY09 FY10 FY11 FY12 FY13 FY14 FY15 FY16 FY17 FY18 FY19 HY20
Operating
revenue
base
Operating
profit growth
across
cycles
Operating
expense
discipline
AUM growth
Attractive financial profileIncreasing AUM, recurring revenues and cost discipline driving profit growth across cycles
Notes: Numbers are shown excluding Silica, net interest income, non-controlling interests and revenue and expenses related to the deferred employee benefit scheme.
1. Fee rate excludes performance fees.
+
+
=
● High proportion of management fees
● Diversified sources of revenues
Total operating revenue (£m) and management fee rate1 (bps)
● Profit growth at attractive margins
● High cash conversion
Operating profit (£m) and margin (%)
● Cost discipline across the business
whilst continuing to invest for growth
Operating expenses (£m)
● Long track record of increasing AUM
● Driving continued revenue growth
Total AUM (£bn)
49bps
32%
32%
56bps
50bps
34%
48bps
32%
35
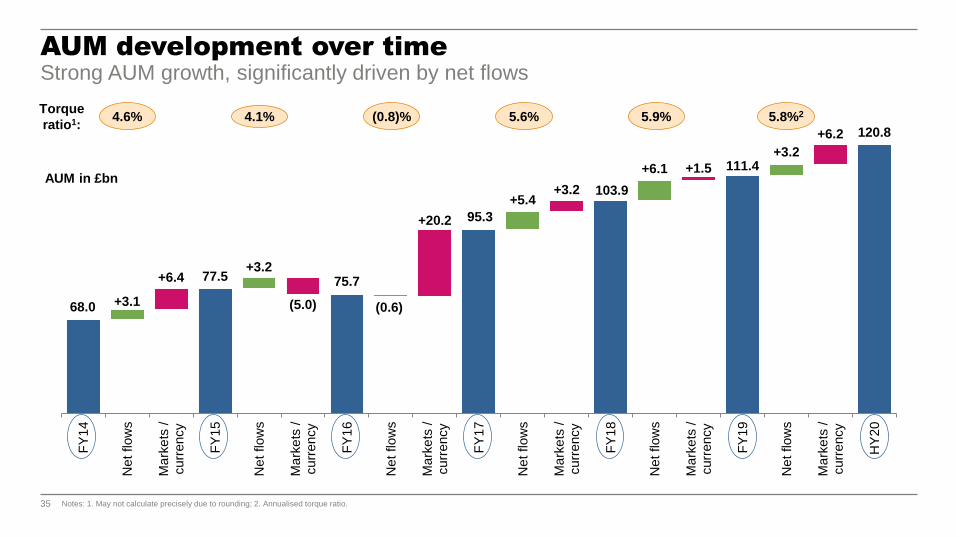
68.0
77.5 75.7
95.3
103.9
111.4
120.8
+3.1
+6.4+3.2
-
+20.2
+5.4+3.2
+6.1 +1.5
+3.2
+6.2
(5.0) (0.6)
FY
14
Ne
t flow
s
Ma
rke
ts /
curr
ency
FY
15
Ne
t flow
s
Ma
rke
ts /
curr
ency
FY
16
Ne
t flow
s
Ma
rke
ts /
curr
ency
FY
17
Ne
t flow
s
Ma
rke
ts /
curr
ency
FY
18
Ne
t flow
s
Ma
rke
ts /
curr
ency
FY
19
Ne
t flow
s
Ma
rke
ts /
curr
ency
HY
20
AUM development over time
Notes: 1. May not calculate precisely due to rounding; 2. Annualised torque ratio.
Strong AUM growth, significantly driven by net flows
4.6% 4.1% (0.8)% 5.6% 5.9%Torque
ratio1:5.8%2
AUM in £bn
36
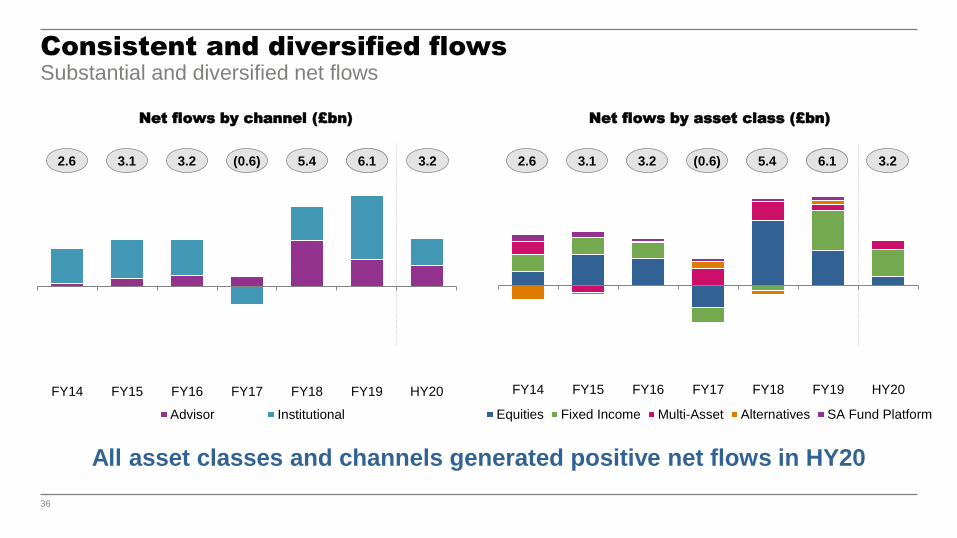
6.1
Consistent and diversified flows
Net flows by channel (£bn) Net flows by asset class (£bn)
Substantial and diversified net flows
All asset classes and channels generated positive net flows in HY20
FY14 FY15 FY16 FY17 FY18 FY19 HY20
Advisor Institutional
FY14 FY15 FY16 FY17 FY18 FY19 HY20
Equities Fixed Income Multi-Asset Alternatives SA Fund Platform
2.6 3.1 3.2 (0.6) 5.4 6.1 3.2 6.12.6 3.1 3.2 (0.6) 5.4 6.1 3.2
37
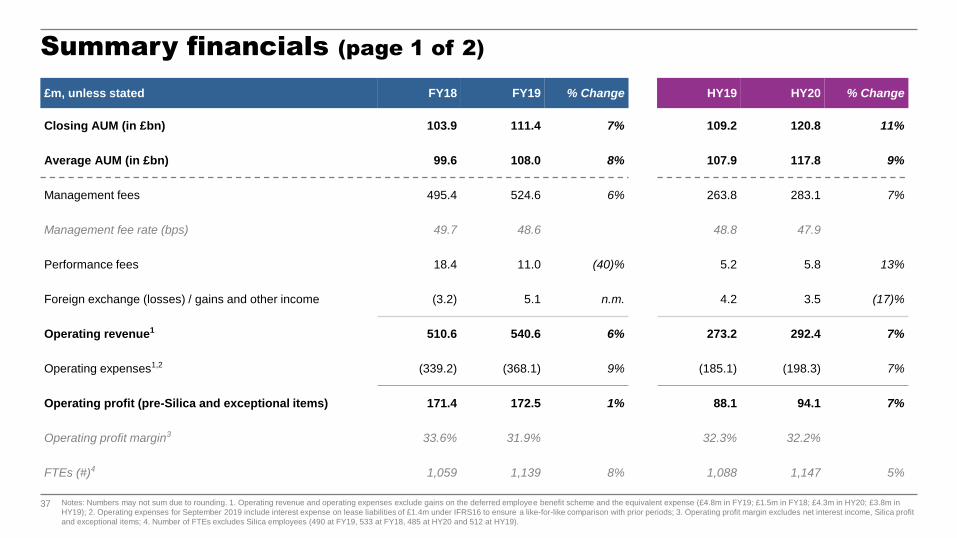
£m, unless stated FY18 FY19 % Change HY19 HY20 % Change
Closing AUM (in £bn) 103.9 111.4 7% 109.2 120.8 11%
Average AUM (in £bn) 99.6 108.0 8% 107.9 117.8 9%
Management fees 495.4 524.6 6% 263.8 283.1 7%
Management fee rate (bps) 49.7 48.6 48.8 47.9
Performance fees 18.4 11.0 (40)% 5.2 5.8 13%
Foreign exchange (losses) / gains and other income (3.2) 5.1 n.m. 4.2 3.5 (17)%
Operating revenue1 510.6 540.6 6% 273.2 292.4 7%
Operating expenses1,2 (339.2) (368.1) 9% (185.1) (198.3) 7%
Operating profit (pre-Silica and exceptional items) 171.4 172.5 1% 88.1 94.1 7%
Operating profit margin3 33.6% 31.9% 32.3% 32.2%
FTEs (#)4 1,059 1,139 8% 1,088 1,147 5%
Summary financials (page 1 of 2)
Notes: Numbers may not sum due to rounding. 1. Operating revenue and operating expenses exclude gains on the deferred employee benefit scheme and the equivalent expense (£4.8m in FY19; £1.5m in FY18; £4.3m in HY20; £3.8m in
HY19); 2. Operating expenses for September 2019 include interest expense on lease liabilities of £1.4m under IFRS16 to ensure a like-for-like comparison with prior periods; 3. Operating profit margin excludes net interest income, Silica profit
and exceptional items; 4. Number of FTEs excludes Silica employees (490 at FY19, 533 at FY18, 485 at HY20 and 512 at HY19).
38
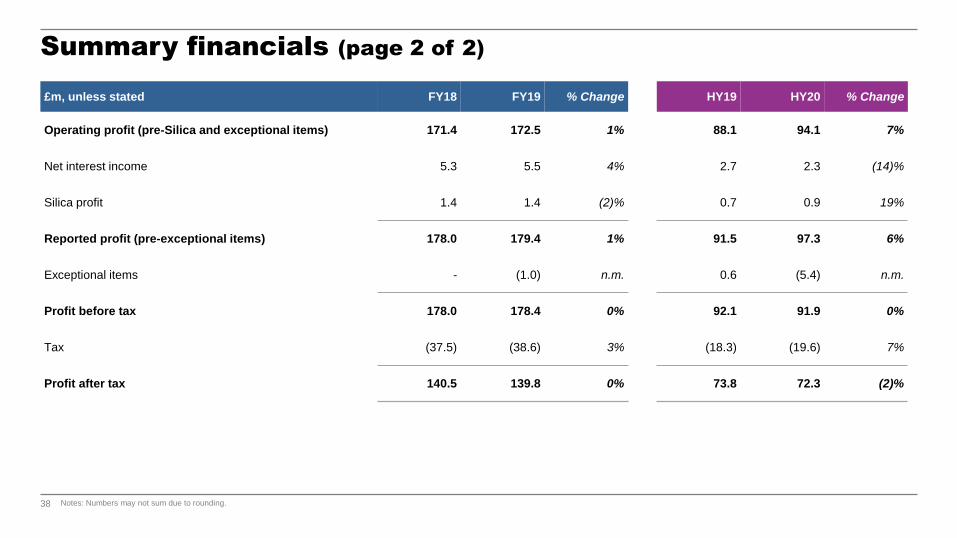
£m, unless stated FY18 FY19 % Change HY19 HY20 % Change
Operating profit (pre-Silica and exceptional items) 171.4 172.5 1% 88.1 94.1 7%
Net interest income 5.3 5.5 4% 2.7 2.3 (14)%
Silica profit 1.4 1.4 (2)% 0.7 0.9 19%
Reported profit (pre-exceptional items) 178.0 179.4 1% 91.5 97.3 6%
Exceptional items - (1.0) n.m. 0.6 (5.4) n.m.
Profit before tax 178.0 178.4 0% 92.1 91.9 0%
Tax (37.5) (38.6) 3% (18.3) (19.6) 7%
Profit after tax 140.5 139.8 0% 73.8 72.3 (2)%
Summary financials (page 2 of 2)
Notes: Numbers may not sum due to rounding.

39
28%
16%
15%
11%
10%
6%
14%Fund Administration
Accommodation
Systems
Information
Promotional
Travel
Overheads
1851987 2 3 1
66% 65%
HY19 Staffexpenses
Systems andinformation
Newoffices
Other HY20
339368
9 7 5 8
69% 66%
FY18 Staffexpenses
Systems andinformation
Newoffices
Other FY19
Analysis of operating expenses
Notes: Analysis excludes Silica expenses and expenses related to movements in the deferred employee benefit scheme (offset by an equal and opposite amount included in revenue in the financial statements).
1. Excludes Silica expenses; however, includes Silica as a non-consolidated third party provider within Fund Administration.
Breakdown of non-staff expenses1 (HY20)
● Strong cost discipline
● Investment to support our long-term growth
ambitions
● Substantial variable component within staff
expenses ensures alignment with firm-wide
performance
Staff expenses
Non-staff expenses
Analysis of expense growth (FY19, £m)
Staff expenses
Non-staff expenses
Analysis of expense growth (HY20, £m)

40
On-going listed company expenses and exceptional items
£mFY19
(actual)
H120
(actual)
H220
(estimate)
FY21
guidance
New corporate functions and replacement services 0.2 1.1 c.2.2Increase in marketing
expenses
Double accommodation, duplicate expenses 2.7 3.1 c.3.4 Decreasing
Demerger project expenses, one-off rebranding 1.5 5.4 c.5.4 Decreasing
Notes: 1. Exceptional items only relate to demerger project expenses. The difference between the FY19 exceptional items (£1.0m on page 38 and £1.5m on page 40) relates to the profit on closure of a subsidiary.
Operating
expenses
Exceptional items1
(excl. from operating expenses)
Recurring
Non-
recurring
41
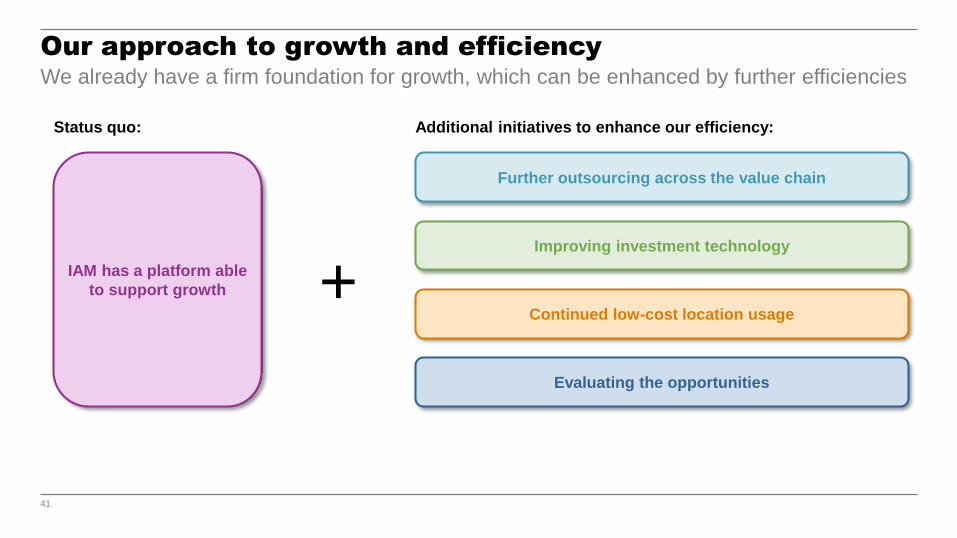
Our approach to growth and efficiencyWe already have a firm foundation for growth, which can be enhanced by further efficiencies
Further outsourcing across the value chain
Evaluating the opportunities
Improving investment technology
Continued low-cost location usage
IAM has a platform able
to support growth +
Additional initiatives to enhance our efficiency:Status quo:
42
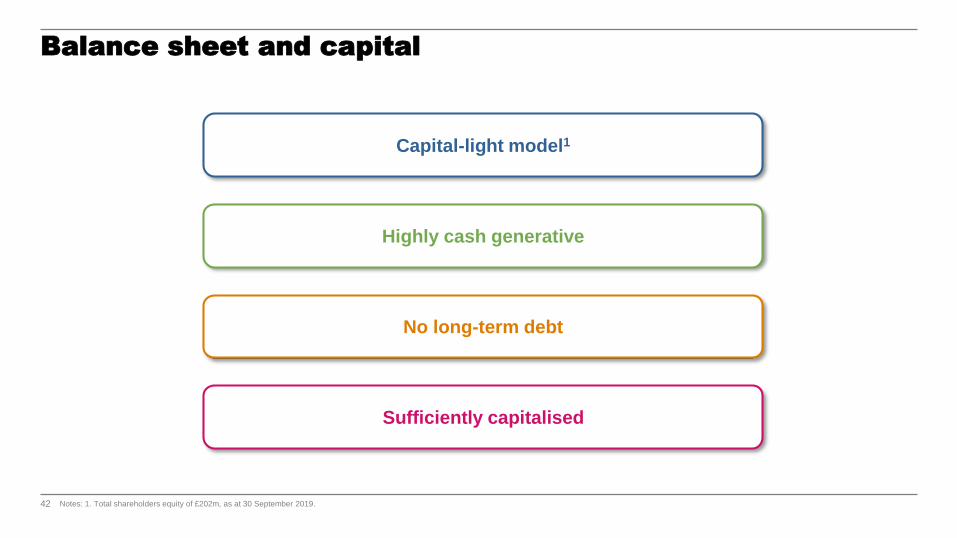
Capital-light model1
Notes: 1. Total shareholders equity of £202m, as at 30 September 2019.
Balance sheet and capital
Highly cash generative
No long-term debt
Sufficiently capitalised
43
-
200
400
600
800
1,000
1,200
1,400
FY09 FY10 FY11 FY12 FY13 FY14 FY15 FY16 FY17 FY18 FY19 HY20
Cu
mu
lati
ve
div
iden
ds
(£
m)
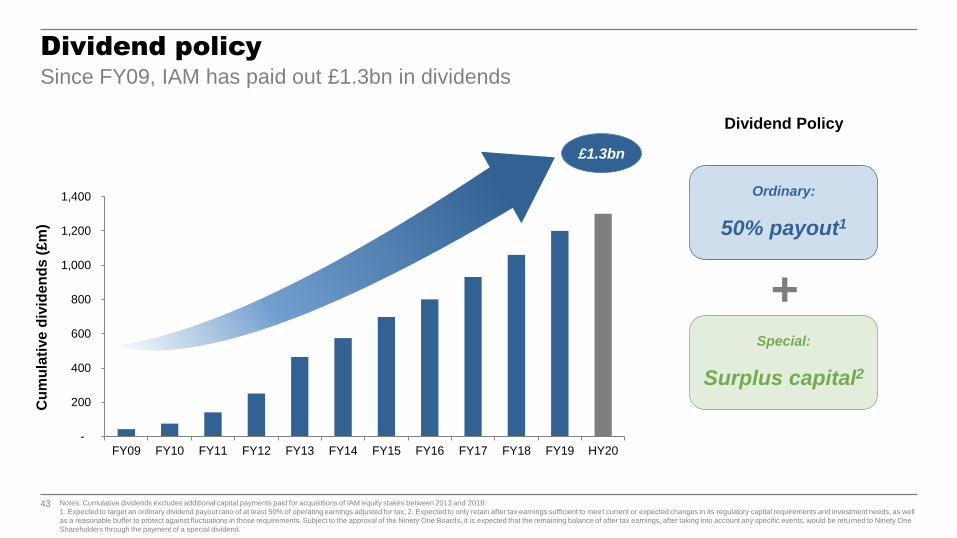
Dividend policySince FY09, IAM has paid out £1.3bn in dividends
£1.3bn
Notes: Cumulative dividends excludes additional capital payments paid for acquisitions of IAM equity stakes between 2013 and 2018.
1. Expected to target an ordinary dividend payout ratio of at least 50% of operating earnings adjusted for tax; 2. Expected to only retain after tax earnings sufficient to meet current or expected changes in its regulatory capital requirements and investment needs, as well
as a reasonable buffer to protect against fluctuations in those requirements. Subject to the approval of the Ninety One Boards, it is expected that the remaining balance of after tax earnings, after taking into account any specific events, would be returned to Ninety One
Shareholders through the payment of a special dividend.
Special:
Surplus capital2
Ordinary:
50% payout1
+
Dividend Policy

44
A clear strategy to deliver returns to our shareholders
Our growth strategy builds on our existing strengths – we remain committed to keeping the business model simple and capital-light
Independence, focus, clarity and motivated people are valuable success factors
IAM has a solid, well-invested platform and a successful history of long-term organic growth
Track
record
Strong culture and
team longevityClients
Global
reach
Ownership
model

45
“A pessimist sees the difficulty in every opportunity; an optimist sees the opportunity in every difficulty.”
Winston Churchill

46
Q&A
47
DisclaimerThis presentation (the “Presentation”) has been prepared by Investec plc and Investec Limited (together, the “Company”) and their subsidiaries from time to time (the “Group”) solely for use at the investor meeting held on 3
December 2019.
By reading the Presentation, you agree to be bound by the following limitations in relation to the existence of such Presentation and all information (including, without limitation, any projections, targets, estimates or forecasts)
or opinions contained herein or in connection with it (the “Information”).
The provision of the Information or any part of it does not constitute, and should not be construed as, part of any offer or invitation to sell, or any solicitation of any offer to purchase or subscribe for, any securities in any
member of the Group and it is not intended to provide the basis of any investment decision nor does it, nor is it, intended to form the basis of any contract for acquisition of or investment in any member of the Group, financial
promotion, or any offer or invitation in relation to any acquisition of or investment in any member of the Group in any jurisdiction.
You will hold the Information in strict confidence and you will not disclose, redistribute, reproduce, publish, pass on, or otherwise divulge the Information, electronically or otherwise, whether in whole or in part or directly or
indirectly (or permit any of the foregoing) to any other person without the prior written consent of the Company.
The Information has not been verified. Each recipient is responsible for making its own decision on the use, accuracy, reliability, fairness, completeness, appropriateness and validity of any Information. Neither the Company,
Boston Consulting Group (“BCG”), nor any of their respective subsidiary undertakings, or any such person's respective directors, officers, employees, agents, affiliates or advisers nor any other person makes any
representation or warranty of any sort as to, and no reliance should be placed on, the accuracy, completeness, fairness or reasonableness of the Information or the opinions contained in this Presentation or in any other
document or information made available in connection with this Presentation. No person shall have any right of action against the Company. BCG, nor any of their respective subsidiary undertakings, or any of such person's
respective directors, officers, employees, agents, affiliates or advisers or any other person in relation to the accuracy or completeness of any such information or for any loss, however arising, from any use of this Presentation
or its contents or otherwise arising in connection with this Presentation. No duty of care is owed or will be deemed to owe to you or any other person in respect of the Information.
The Information is provided as at the date of the Presentation and is subject to change, without notice.
BCG have been engaged as an industry adviser to the Company. Certain industry and market data contained in this Presentation has come from third party sources (including, but not limited to BCG). Third party industry
publications, studies and surveys generally state that the data contained therein have been obtained from sources believed to be reliable, but that there is no guarantee of the accuracy or completeness of such data. While the
Company believes that each of these publications, studies and surveys has been prepared by a reputable source, the Company has not independently verified the data contained therein. In addition, certain of the industry
and market data contained in this Presentation comes from the Company's own internal research and estimates based on the knowledge and experience of the Company's management in the market in which the Company
operates. While the Company believes that such research and estimates are reasonable and reliable, they, and their underlying methodology and assumptions, have not been verified by any independent source for accuracy
or completeness and are subject to change without notice. For the avoidance of doubt, BCG assume no liability for any industry or market data provided to the Company for the purposes of this Presentation.
This Presentation contains statements that constitute forward-looking statements relating to the business, financial performance and results of the Company and the industry in which the Company operates. These statements
may be identified by words such as “expectation”, “belief”, “estimate”, “plan”, “target”, or “forecast” and similar expressions or the negative thereof; or by forward-looking nature of discussions of strategy, plans or intentions; or
by their context. No representation is made that any of these statements or forecasts will come to pass or that any forecast results will be achieved. All statements regarding the future are subject to inherent risks and
uncertainties and various factors could cause actual future results, performance or events to differ materially from those described or implied in these statements. Such forward-looking statements are based on numerous
assumptions regarding the Company’s present and future business strategies and the environment in which the Company will operate in the future. Further, certain forward-looking statements are based upon assumptions of
future events which may not prove to be accurate and the Company nor any other person accepts any responsibility for the accuracy of the opinions expressed in this Presentation or the underlying assumptions. Past
performance is not an indication of future results and past performance should not be taken as a representation that trends or activities underlying past performance will continue in the future. The forward-looking statements
in this Presentation speak only as at the date of this Presentation and the Company expressly disclaims any obligation or undertaking to release any updates or revisions to these forward-looking statements to reflect any
change in the Company's expectations with regard thereto or any change in events, conditions or circumstances on which any statement is based after the date of this Presentation or to update or to keep current any other
information contained in this Presentation or to provide any additional information in relation to such forward-looking statements. You are therefore cautioned not to place any undue reliance on such forward-looking
statements.
Any matter or dispute (whether contractual or non-contractual) arising out of or in connection with this Presentation, shall be governed and construed in accordance with English law and the English courts shall have exclusive
jurisdiction in relation to any such matter or dispute.
Certain figures in this Presentation are subject to rounding. Accordingly, figures shown for the same category presented in different charts or tables may vary slightly and figures shown as totals in certain charts or tables may
not be an arithmetic aggregation of the figures that precede them.