Embed Size (px)
Citation preview
INTRUSION DETECTION IN DISTRIBUTED
MULTIMEDIA APPLICATIONS
Regina Awor Komakec
Student Number: s0535273
Research Number: 571
A Thesis Submitted to theInstitute for Computing and Information Sciences of
Radboud University Nijmegenfor the
Degree of Master of Science
August 2007
Supervisor: Dr. Engelbert HubbersReviewer: Dr. Perry Groot

2
Abstract
Over the past few years, distributed multimedia systems and applications have experienced anincrease in popularity. However, there are growing security concerns as growth in internet usehas led to rise to internet-based attacks. With the increasing attacks on internet-based applica-tions, intrusion detection systems play an important role in providing warnings indicating possiblesecurity breach.
The aim of this research is to investigate, using Bayesian statistics, how well intrusion detectionsystems can be used to secure internet-based telephony, vis-a-vis teleconferencing systems. Wehypothesize that the exchange of information between IDSs, by setting them in sequence, canimprove the effectiveness of intrusion detection in a real-time scenario. To examine this notion, wetested two different intrusion detection systems, with varying specifications, in turn against VoIP-based traffic containing a pre-determined number of attacks. We also investigated the possibilityof applying the two IDSs in sequence, where the information output from one IDS acts as inputfor the second IDS.
The main contribution of this thesis is its demonstration of how varying intrusion detection sys-tems (IDSs) complement each other. In addition, we demonstrate how Bayesian network classifierscan be used to evaluate, as well as to predict IDS performance.
3

4

Acknowledgement
I would like to express my sincere gratitude to all the people who made this thesis possible. Firstand foremost, I am indebted to my supervisor, Dr. Engelbert Hubbers, for his guidance, as wellas patience during the not-so-smooth periods.
I wish to thank Dr. Peter Lucas for suggesting valuable pointers with regard to Bayesiannetworks. I am also very grateful to Dr. Perry Groot for accepting to read and review this thesisat such short notice.
Lastly, but certainly not least, I would like to say a big thank you to my family for theircontinued support and encouragement throughout my studies.
5

6

Contents
1 Introduction 111.1 Overview of the Thesis . . . . . . . . . . . . . . . . . . . . . . . . . . . . . . . . . . 11
2 Background 132.1 Problem Description . . . . . . . . . . . . . . . . . . . . . . . . . . . . . . . . . . . 132.2 Related Work . . . . . . . . . . . . . . . . . . . . . . . . . . . . . . . . . . . . . . . 132.3 Intrusion Detection Systems . . . . . . . . . . . . . . . . . . . . . . . . . . . . . . . 14
2.3.1 Approaches to Intrusion Detection . . . . . . . . . . . . . . . . . . . . . . . 142.3.2 General Intrusion Detection Model . . . . . . . . . . . . . . . . . . . . . . . 162.3.3 IDS Effectiveness Measurements . . . . . . . . . . . . . . . . . . . . . . . . 17
2.4 Bayesian Belief Networks . . . . . . . . . . . . . . . . . . . . . . . . . . . . . . . . 172.4.1 Bayesian Network Classifiers - Inferencing . . . . . . . . . . . . . . . . . . . 18
2.5 Dynamic Nature of Computer Environment . . . . . . . . . . . . . . . . . . . . . . 182.5.1 Teleconferencing: A Distributed Multimedia Application . . . . . . . . . . . 19
2.6 IDS Deployment in Teleconferencing Scenario . . . . . . . . . . . . . . . . . . . . . 21
3 Testing Intrusion Detection Systems 233.1 IDS Testing and Benchmarking . . . . . . . . . . . . . . . . . . . . . . . . . . . . . 233.2 Test Setup . . . . . . . . . . . . . . . . . . . . . . . . . . . . . . . . . . . . . . . . . 24
3.2.1 Snort . . . . . . . . . . . . . . . . . . . . . . . . . . . . . . . . . . . . . . . 253.2.2 Firestorm . . . . . . . . . . . . . . . . . . . . . . . . . . . . . . . . . . . . . 25
3.3 Actual Test . . . . . . . . . . . . . . . . . . . . . . . . . . . . . . . . . . . . . . . . 263.3.1 Snort Output . . . . . . . . . . . . . . . . . . . . . . . . . . . . . . . . . . . 263.3.2 Firestorm Output . . . . . . . . . . . . . . . . . . . . . . . . . . . . . . . . 26
3.4 Combining Snort with Firestorm . . . . . . . . . . . . . . . . . . . . . . . . . . . . 273.5 Analysis of Test Results . . . . . . . . . . . . . . . . . . . . . . . . . . . . . . . . . 283.6 Confirmatory Test . . . . . . . . . . . . . . . . . . . . . . . . . . . . . . . . . . . . 30
3.6.1 Estimates for Network-based Intrusion Detection . . . . . . . . . . . . . . . 31
4 IDS Evaluation using A Bayesian Networks Classifier 33
5 Conclusion 395.1 Future Research . . . . . . . . . . . . . . . . . . . . . . . . . . . . . . . . . . . . . 40
7

8 CONTENTS

List of Figures
2.1 Categorization of IDSs . . . . . . . . . . . . . . . . . . . . . . . . . . . . . . . . . . 142.2 General Model of Intrusion Detection Systems . . . . . . . . . . . . . . . . . . . . . 162.3 General Teleconferencing Model . . . . . . . . . . . . . . . . . . . . . . . . . . . . . 192.4 SIP Header . . . . . . . . . . . . . . . . . . . . . . . . . . . . . . . . . . . . . . . . 20
3.1 IDS Testing Process . . . . . . . . . . . . . . . . . . . . . . . . . . . . . . . . . . . 243.2 Screenshot of Snort result for tcpdump-2 . . . . . . . . . . . . . . . . . . . . . . . . 27
4.1 Individual IDS Classifiers . . . . . . . . . . . . . . . . . . . . . . . . . . . . . . . . 334.2 Bayesian Network Classifier . . . . . . . . . . . . . . . . . . . . . . . . . . . . . . . 344.3 Bayesian Network created using Genie . . . . . . . . . . . . . . . . . . . . . . . . . 344.4 Updated modelwith Network variable = true . . . . . . . . . . . . . . . . . . . . . 354.5 Updated model with Signature variable = true . . . . . . . . . . . . . . . . . . . . 364.6 Updated model with Anomaly variable = true . . . . . . . . . . . . . . . . . . . . . 364.7 Updated model with all variables = true . . . . . . . . . . . . . . . . . . . . . . . . 37
9

10 LIST OF FIGURES

Chapter 1
Introduction
In recent years, distributed multimedia systems and applications, such as internet-based telecon-ferencing, have experienced an increase in popularity. Many institutions, ranging from educationto business and finance, are adopting voice over IP (VoIP) technology as a means of exchanginginformation, most of which is highly sensitive. Information is a major asset for every institution;any security breach can have damaging effects. For example, the business world, in case of abreach of confidentiality where a firm’s competitors get to know their (the firm’s) private strategy,the firm’s survival is thrown into jeopardy.
The rapid growth of internet use, however, has resulted in growing security concerns, as thenumber of internet-based attacks is also on the rise. The internet gives such multimedia systemsmore exposure to potential attackers. Today, not only are attack tools published on the internet,there is also a movement from command-line to graphical user interface (GUI) -based tools, makingthem easily accessible and usable. As a result, potential attackers are no longer made up exclusivelyof people with technical expertise, but also include the so-called script kiddies, who with limitedtechnical knowledge, can carry out attacks on poorly maintained systems.
For internet-based systems, such as teleconferencing systems, there is a tendency to focus solelyon ensuring network security. However, this definitely does not guarantee the security of thesystem. Other aspects of the whole system also have to be taken into consideration; for instance,operating system and application security. It is also important to note that the main threat toinformation systems comes from people. These threats do not only originate from outsiders, butalso from insiders who misuse their privileges. Intrusion detection systems (IDS) are thereforenecessary to cope with the increasing threats, both from inside and outside, which are becomingeven more difficult to predict.
The basic idea of intrusion detection systems is that there is a clear distinction between thebehavior of an intruder and that of a legitimate user. There are several types of intrusion detectionsystems, which can be classified into two basic groups, namely: network-based or host-based.Depending on their functionality, they can also be classified as anomaly-based or signature-based(pattern matching). The main challenge facing intrusion detection systems is how to maximizedetection rates, while minimizing the occurrence of false positives (situations when IDSs reportan event for a nonexistent intrusion).
We are going to investigate to what extent IDSs can be used to secure teleconferencing systems.In particular, we will illustrate how signature-based and anomaly-based detection systems cancomplement each other. Furthermore, this study proposes the use of Bayesian belief networks asa potential security measure.
1.1 Overview of the Thesis
The second chapter discusses the main themes of this research, that is, Bayesian Belief Networks,intrusion detection systems and teleconferencing systems. We present the general intrusion detec-
11

12 CHAPTER 1. INTRODUCTION
tion model, and discuss the various IDS techniques. We also discuss Bayesian network classifierswith regard to data mining. A section is devoted to discussing teleconferencing systems, its securityrequirements, and the possibilities of IDS deployment teleconferencing set-up.
The third chapter, Testing Intrusion Detection Systems, is devoted to the testing procedurecarried out on two IDSs, namely: Snort and Firestorm network intrusion systems. This is followedby an evaluation of the test results in chapter four, IDS Evaluation using A Bayesian NetworksClassifier. In this fourth chapter, we apply Bayesian network classifiers to create IDS categoriesbased on the various specifications or functionalities. We propose to model the performance ofIDSs in terms of the detection and false positive rates if a given classification (set of IDS features).
The thesis is ended with the fifth chapter reviewing the results of the tests. It outlines theconclusions drawn, as well as possibilities of future work.
Chapter 2
Background
2.1 Problem Description
This thesis attempts to answer the research question: ’How well can intrusion detection systemsdeal with the dynamic nature of the computer environment?’ Specifically, the thesis is investi-gating performance of intrusion detection systems deployed in distributed multimedia systems,particularly voice over IP applications, where real-time detection is paramount.
The thesis shall also look at the use of Bayesian statistics to analyze IDS performance, and ineffect explore how well the Bayesian network approach performs as a security measure.
2.2 Related Work
The application of data mining techniques to intrusion detection is a growing area of interest. In[3], Axelsson uses the Bayesian rule of conditional probability to point out the implications of theso-called ’base-rate fallacy ’ for intrusion detection. The base-rate fallacy phenomenon refers tothe belief that probability rates are false. Plotting a curve of detection rate against false alarmrate provided proof that there is a link between detection rates and false alarm rates. Axelsson,therefore, concluded that as a result of the base-rate fallacy problem, the performance of an IDSis dependent on its ability to suppress false alarms, and not on its ability to correctly identifyintrusive behaviour.
Most research work has focused on the application of Bayesian probability theory to createintrusion detection models [1], [17], [21]. Abouzakhar’s [1] proposed a prediction approach fornetwork intrusion detection. The work by Kruegel et al. [17] is in response to Axelsson’s findings,which highlights the complexities of dealing with false positives. Kruegel’s et al. research focusedon how Bayesian networks can be used to mitigate the problem of high false positive rate inanomaly detection. They attribute this problem to the incorrect classification of events in currentanomaly-based systems. Two reasons are given for this incorrect classification of events. Firstly,it is usually the case that in the decision phase, the sum of the model results (which could be aprobability value) is calculated and compared to a threshold. The problem stems from how smallthis threshold value should be. Having a very small value increases the rate of false positives insituations where events have many features that deviate slightly from normal behavior definedin the profile. Secondly, there is a lack of integration of additional information, which may bereceived from other intrusion detection sensors or from system health monitors. So, how canBayesian techniques solve this problem? According to Kruegel, using Bayesian decision processto classify input events improves the aggregation of different model outputs. As a result, it allowsone to seamlessly incorporate additional information.
These researches only are related to our work through the application of Bayesian statisticsin intrusion detection. Our work differs from the others in that we use Bayesian networks todemonstrate its abilities as a performance measure for intrusion detection systems.
13

14 CHAPTER 2. BACKGROUND
2.3 Intrusion Detection Systems
Intrusion detection refers to the ability to detect and respond to inappropriate activity [22]. Inap-propriate activity, in this case, may include unauthorized or malicious use and abuse of computingand network resources.
2.3.1 Approaches to Intrusion Detection
The primary categorization of intrusion detection is as anomaly detection and pattern-matchingdetection [4]. Anomaly detection, sometimes called Statistical anomaly detection, searches forabnormalities. By studying system or application events, anomaly-based IDSs extract models ofexpected system or application behavior. Subsequent activities or events are observed and if theydeviate significantly from normal usage profiles they are marked as anomalies [25] [21]. Since itis behavioral based, it has the ability to detect novel attacks. However, a potentially high rateof false positives is an intrinsic property of anomaly detection because any previously unseen, yetlegitimate, behavior may be recognized as an anomaly. For anomaly-based IDS, the task is todefine an ’abnormal’ event. One approach is to set an optimal threshold. Here, for the specificevent, an anomaly score is assigned to each packet, representing the degree of abnormality. Analert is generated for scores above this threshold. Therefore, if the threshold is set too high, thenumber of false alarms will increase, and if it is too low there will be more instances of falsenegatives (missed attacks).
Pattern-matching or signature detection, on the other hand, depends on some previously de-fined pattern or signature of a known intrusion. Lee et al. [21] refers to this category as misusedetection, and defines it as the matching of patterns of well-known attacks (rules), to known in-trusions in audit data. This raises an important question, what about new attacks? Althoughthe rate of false positives is low, there is a high rate of false negatives. Rules that are too specificmay cause the IDS to fail to detect an existing attack (false negatives), whereas rules that are toogeneral may induce false positives.
Intrusion detection systems can also be further classified as network-based or application-based,with systems in each case undertaking the anomaly and/or pattern-matching detection approach.This presents a kind of two-dimensional matrix-like categorization of IDSs. As shown in figure 2.1,some IDSs therefore, may fall in more than one category. Scidive is discussed later in this chapter,while Snort and Firestorm are discussed in detail in chapter 3.
Signature-based detection Anomaly-based detectionNetwork-based Snort Firestorm
Bro BroDragon DragonPrelude
Host/Application-based Prelude Scidive
Figure 2.1: Categorization of IDSs
Bro [26] is an open source, intrusion detection tool developed by Vern Paxson of the NetworkResearch Group (NRG) at Lawrence Berkeley National Laboratory (California). Bro is a passive,network-based IDS that employs both signature (pattern matching) and anomaly-based detectionmethods. According to Paxson, Bro’s analysis includes mainly the detection of specific attacks,thus attacks defined by signatures as well as those defined in terms of events. Bro is also able todetect unusual behavior, such as certain hosts connecting to certain services, or patterns of failedconnection attempts.
Dragon [9] is a network-based intrusion detection and prevention system. It is referred to as anintrusion detection and prevention system because it not only raises alerts for an event it deemssuspicious, but also takes action to stop the event and records it for further analysis. To identify

2.3. INTRUSION DETECTION SYSTEMS 15
attacks, Dragon applies a combination of techniques, namely: pattern matching, protocol analysis,and anomaly-based techniques.
Prelude [28] is a hybrid IDS framework that consolidates security events generated by differentsecurity applications, which include IDS systems. Prelude is considered a hybrid intrusion detec-tion system, because it performs the functionality of both a NIDS (Network Intrusion DetectionSystem) and a HIDS (Host Intrusion Detection System). In order to centralize the security eventsoriginating from various system, Prelude uses the Intrusion Detection Message Exchange For-mat (IDMEF) standard [6] to define a standard data format that the different types of intrusiondetection and response systems can use to report alerts.
Both network and application intrusion detection systems look at attack signatures, which arespecific patterns that usually indicate malicious intent. While network-based intrusion detectionsystems monitor all packets (network traffic) for intruders, host-based intrusion detection systemsreside on the host and monitor log files for abnormalities in user or program behavior. Thereis a close relation between host-based and application-based systems. Host-based IDSs monitoroperating and file systems, whereas application-based intrusion detection systems monitor onlyspecific applications. Application-based systems are therefore sometimes classified under host-based systems [32]. According to Mutz [25], because user behavior is erratic and difficult tocharacterize, the focus of anomaly detection research for host-based IDSs has shifted from userto program behavior. Program behavior models are normally based on system calls. The modelsmay be based on system call sequences, system call arguments, or both.
Network Layer Intrusion Detection
Network-based intrusion detection checks if packets match a ’signature’, which could be a string,port, or a header condition [22]. A network intrusion detection system (NIDS) therefore mayinclude a packet sniffer and a logger, which helps detect attacks, like buffer overflows, stealth portscans, Common Gateway Interface (CGI) attacks, Server Message Block (SMB) probes. Snort [30]is a popular network intrusion detection system.
Naturally, attackers want to hide their identity, by being anonymous or using pseudo names.Anonymity, unlike pseudonymity, makes it impossible to associate a group of messages with a user.A common practice used by attackers to keep anonymous, is to use a technique called Stepping-stones, where previously compromised, intermediary hosts are used to initiate attacks, ratherthan the attacker’s own computer. Stepping-stone detection attempts to detect traffic involvedin stepping-stone attacks at the routers. Tor [36], short for The Onion Router, is a networkof computers on the internet that allows people to improve their privacy on the internet, forexample, in web browsing. It is a real-time anonymous communication channel over the internet,and therefore could be used by intruders to launch attacks without being detected. Unlike inStepping-stones, the members of the Tor network voluntarily offer their computers to be part ofthe decentralized network.
Notions such as round-trip time (RTT), thumbprints (’signatures’), and traceback are commonnotions applied in several network intrusion detection and response systems. In the networkingcontext, round-trip time can be defined as the time a packet takes to travel back and forth betweenhosts; hence it is a measure of delay. The TCP transport protocol keeps an estimate of RTT asa measure of a connection chain. RTT computation involves matching the ’send’ packets withthe ’echo’ packets [15]. RTT can therefore be used as a way of detecting intrusions such asstepping-stones.
A thumbprint is basically a signature of a session; it characterizes a session. It is both content-based and time-based; it calculates time gaps between packets and includes round-trip time (RTT).According to Huang [15], the advantages with this approach include: use of small storage space,hides transmitted content, and computes efficiently. However, since it is content-based, it isunsuitable for encrypted sessions.
Traceback is a technique used to trace back an attack to its source. It is therefore not adetection feature, but rather it constitutes the response activity of the network intrusion detectionsystem, particularly for anonymous attacks.
16 CHAPTER 2. BACKGROUND
Application Layer Intrusion Detection
As already mentioned, it is important to ensure the security of the applications, particularly in thecase of critical, real-time systems. Application IDSs are systems designed for a specific application,such as a Web server. There are several systems where intrusion detection can be applied, for ex-ample, financial systems (fraud detection systems), information management systems (databases),identity management systems, and so on.
It has been widely suggested that a combination of network and application-based intrusiondetection is more efficient than each one separately. According to Lee [20],
‘Intrusion detection at application can potentially offer accurate and precise detec-tion for the targeted application.’
This implies that intrusion detection is not only necessary at network and host level, but also atapplication level.
2.3.2 General Intrusion Detection Model
Before modeling an intrusion detection system for a computer system, it is vital to consider how itinteracts with its environment. The external environment includes the behavior of users, includingintruders, from whom input comes. The intrusion detection process starts with determining whatis to be detected, and eventually results in a decision being made.
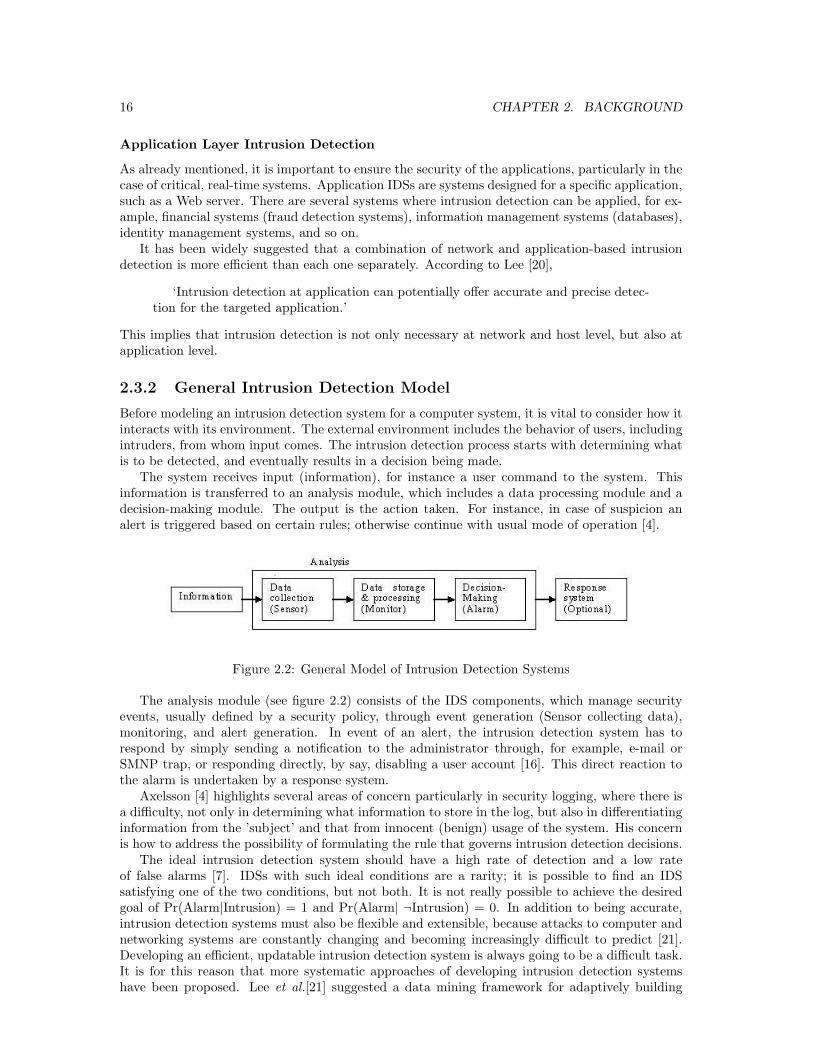
The system receives input (information), for instance a user command to the system. Thisinformation is transferred to an analysis module, which includes a data processing module and adecision-making module. The output is the action taken. For instance, in case of suspicion analert is triggered based on certain rules; otherwise continue with usual mode of operation [4].
Figure 2.2: General Model of Intrusion Detection Systems
The analysis module (see figure 2.2) consists of the IDS components, which manage securityevents, usually defined by a security policy, through event generation (Sensor collecting data),monitoring, and alert generation. In event of an alert, the intrusion detection system has torespond by simply sending a notification to the administrator through, for example, e-mail orSMNP trap, or responding directly, by say, disabling a user account [16]. This direct reaction tothe alarm is undertaken by a response system.
Axelsson [4] highlights several areas of concern particularly in security logging, where there isa difficulty, not only in determining what information to store in the log, but also in differentiatinginformation from the ’subject’ and that from innocent (benign) usage of the system. His concernis how to address the possibility of formulating the rule that governs intrusion detection decisions.
The ideal intrusion detection system should have a high rate of detection and a low rateof false alarms [7]. IDSs with such ideal conditions are a rarity; it is possible to find an IDSsatisfying one of the two conditions, but not both. It is not really possible to achieve the desiredgoal of Pr(Alarm|Intrusion) = 1 and Pr(Alarm| ¬Intrusion) = 0. In addition to being accurate,intrusion detection systems must also be flexible and extensible, because attacks to computer andnetworking systems are constantly changing and becoming increasingly difficult to predict [21].Developing an efficient, updatable intrusion detection system is always going to be a difficult task.It is for this reason that more systematic approaches of developing intrusion detection systemshave been proposed. Lee et al.[21] suggested a data mining framework for adaptively building

2.4. BAYESIAN BELIEF NETWORKS 17
intrusion detection models. The idea behind their approach is to apply data mining programs tothe gathered audit data to automatically construct models that represent intrusion patterns andnormal behavior.
2.3.3 IDS Effectiveness Measurements
The effectiveness measure of an intrusion detection system could be likened to measuring systemsecurity. According to Payne [27], security metrics are valuable tools that can be used for mea-suring the effectiveness of security systems. Andersson et al. [2] defines a security metric as, ‘aruler against which the security of systems is measured’.
Security Measures
The task here is how to quantify security. Several suggestions have been made for measuringsecurity in different scenarios. According to Gollmann [12], security metrics could be actualconfigurations of operational systems. For example, security metrics for systems with accesscontrol features could include the number of accounts with system privileges or weak passwords,whereas for a networked system, the number of open ports available from outside could be usedas a security measure. The security measures suggested by Gollmann [12] that apply particularlyto intrusion detection include, the number of security flaws detected by the IDS over a period oftime, or, in the case of a networked system (such as the teleconferencing system), how quickly andfar the attacks could have spread before they are detected.
Another approach to security measurement involves the use of the analogy between systemreliability and system security (vis-a-vis system failure and security breach), where the measuresfor reliability could be compared to operational security measures [12], [23]. Gollmann [12] notesthat the methods developed for the measurement of software reliability assume that, ‘the detectionof flaws and the invocation of buggy code are governed by a probability distribution given a priori,or a given family of probability distributions where parameters still have to be estimated.’ Cautionhas to be taken when setting these parameters (boundaries) [23]. For example, Littlewood et al.[23] proposed effort to the next security attack rather than time (a common reliability metric) asa random variable because not only is it impossible to know all attacks to a system, the numberof attacks increases with time.
We think the probabilistic approach presents an opportunity to use several metric combina-tions. For a real-time system like teleconferencing system, it is impossible to ignore the timefactor. Bayesian statistical methods could be used, where the reliability of an intrusion detectionsystem is influenced by the probability distribution given some prior condition(s), during a par-ticular time frame. For instance, determining the probability of false positives given network loadand traffic condition, where the states of network load and traffic condition are light/heavy andclean/unclean respectively.
2.4 Bayesian Belief Networks
A Bayesian belief network is a graphical model that depicts the joint probability distributionover variables of interest [14]. Joint probability is used to find the likelihood of two or moreevents happening simultaneously. A joint probability distribution across a group of variablesrepresents the probability of each of the variables taking on each of its values, given considerationof the values of the other variables [35]. Bayesian networks are called Belief networks because theBayesian probability describes one’s degree of belief of the occurrence of an event. It is therefore apersonal probability. It is a quantitative technique of measuring the effects of events on each otherby encoding the strength of causal relationships with probabilities. Hence, it is a representationof the probability of events or conditions based on causal relations. An important requirement fora Bayesian network to model a probability distribution is the conditional independence between

18 CHAPTER 2. BACKGROUND
each variable and all its non-descendants given the value of all its parents.
Pr(X1, ..., Xn) =n∏
i=1
Pr(Xi|Parents(Xi)) (2.1)
2.4.1 Bayesian Network Classifiers - Inferencing
Bayesian networks applies Bayes’ Theorem for calculating conditional probabilities, for example,what is the probability of event X occurring given event Y has already occurred, Pr(X | Y)?This is referred to as inferencing. Bayesian Network Inferencing is therefore the computation of aprobability of interest [14]. Bayes’ Theorem is defined as follows in equation 2.2:
Pr(X|Y ) =Pr(X) ∗ Pr(Y |X)
Pr(Y )(2.2)
Where, Pr(X) is the prior probability representing the initial degree of belief, Pr(Y | X) is thelikelihood of event Y given X, Pr(Y) is the marginal likelihood (or evidence) of Y.
The application of Bayes’ Theorem allows calculations in both directions. Hence, it is alsopossible to determine Pr(Y | X) from equation 2.2. See equation 2.3.
Pr(Y |X) =Pr(Y ) ∗ Pr(X|Y )
Pr(X)(2.3)
Bayesian networks have also been criticized for the subjectivity of prior probabilities, thatis, there is always the risk of excessive optimism or pessimism [14]. For Bayesian networks to beeffective, therefore, prior information has to be reliable. However, the benefits of Bayesian networksoutweigh this shortcoming. The ability of Bayesian networks to learn causal relationships is one ofBayesian network’s main advantages. According to Heckerman [14], this property not only enablesone to gain an understanding of the problem domain through exploration, it can also be used forpredictive and classification tasks. Other advantages of using Bayesian networks for extractingand encoding knowledge from data, as highlighted by Heckerman, include the following:
• Since Bayesian networks encode dependencies among all variables; they readily handle in-complete data sets.
• Bayesian networks is an ideal representation for combining prior knowledge and data becausethe model has both causal and probabilistic semantics.
• Bayesian statistical methods in conjunction with Bayesian networks offers good generaliza-tion (avoids the overfitting of data).
2.5 Dynamic Nature of Computer Environment
Computer systems - composition of hardware and software - are designed to fulfill some functionin a particular environment. According to Gollmann [12], ‘a system is a specific IT installation,with a particular purpose and operational environment.’
Sometimes this environment might be complex, necessitating the interconnections betweenseveral computer systems and/or the distribution of tasks, resulting in a larger system. Thisintroduces concepts of computer networking and distributed computing.
The environment, which the computer system is supposed to model, is constantly changing,as well as its needs. It is crucial that the system designers keep up with these changes. Facedwith complicated tasks to solve, designers have to find the right balance between functionality andsecurity, which is of paramount importance.
Now, consider internet-based teleconferencing - the interactive communication between two ormore people over the internet. What makes this technology dynamic? The constantly varyingnumber of conference members (users), the location of the users, and the network load. From thesecurity point of view, all these factors must be taken into consideration in designing an effectiveintrusion detection system.

2.5. DYNAMIC NATURE OF COMPUTER ENVIRONMENT 19
2.5.1 Teleconferencing: A Distributed Multimedia Application
Distributed systems in general consist of three components: the server, the clients, and the commu-nication (information flow) channel linking the server to the client. With distributed multimediaarises the notion of video-on-demand, audio-on-demand, and Quality of Service (QoS), whichincludes, among others, latency, jitter, and loss rates. The applications might be classified asinteractive or non-interactive. Multimedia information not only constitutes continuous data, butalso discrete data, like text and images. Distributed multimedia systems can also be classified aseither real-time or non-real time applications. Real-time applications may have, what is commonlyreferred to as, soft deadlines, where a short time delay can be tolerated. Hard deadlines are mostlyassociated with safety critical applications.
Teleconferencing is a distributed multimedia application, which deals with the real-time infor-mation sharing among people and/or machines in remote sites (see figure 2.3).
Figure 2.3: General Teleconferencing Model
Teleconferencing might be either phone-based or internet-based. Phone-based teleconferencingrefers to interactive communication sessions over telephone lines, while internet-based teleconfer-encing refers to communication sessions conducted over the internet. Phone-based teleconferencinghas existed for years. But, the internet is currently a popular choice for the delivery of informationto the intended recipients. Not only do more people have access to the internet than ever before,it is easier to install and use internet-based services such as Voice over IP (VoIP) applications.
However, the internet is certainly not the safest ‘environment’. Packets can travel all over theworld before arriving at the final destination. There is therefore less control over the commu-nication channel with internet-based teleconferencing as compared to teleconferencing by phone,hence it is more susceptible to attacks.
Teleconferencing System Security Requirements
Internet-based teleconferencing involves exchange of information over the internet among peoplein remote sites. It makes use of voice over internet protocol (VoIP), which allows communicationbetween more than two users in real time. VoIP uses the Session Initiation Protocol (SIP) forsignaling purposes. SIP is an application-layer protocol for initiating, managing, and terminatingmultimedia sessions in a network. It is similar to HTTP and SMTP; two established internetprotocols. SIP employs a request/response protocol (client/server model) based on an HTTP-likerequest/response transaction model. The Internet Engineering Task Force (IETF) describes SIPin RFC 3261 [31].
The security requirements for the teleconferencing set-up include availability, access control,data confidentiality and integrity, authentication of conference participants, and non-repudiation.For a real-time application, the teleconferencing services must be available to all users within aspecific time frame, which is ‘now’. When invited to a conference, users have to identify them-selves. Access control may be enforced through the use of conference IDs, personal identification
20 CHAPTER 2. BACKGROUND
numbers (PINs), and passwords. Cryptographic controls should therefore be used to guaranteeconfidentiality, integrity, and authentication. Signatures are used not only to prove the legitimacyof the sender, but also to authenticate the information transmitted amongst the users. Lack ofencryption is a vulnerability that allows an eavesdropper to listen in on the conference by tappingon one of the user’s lines.
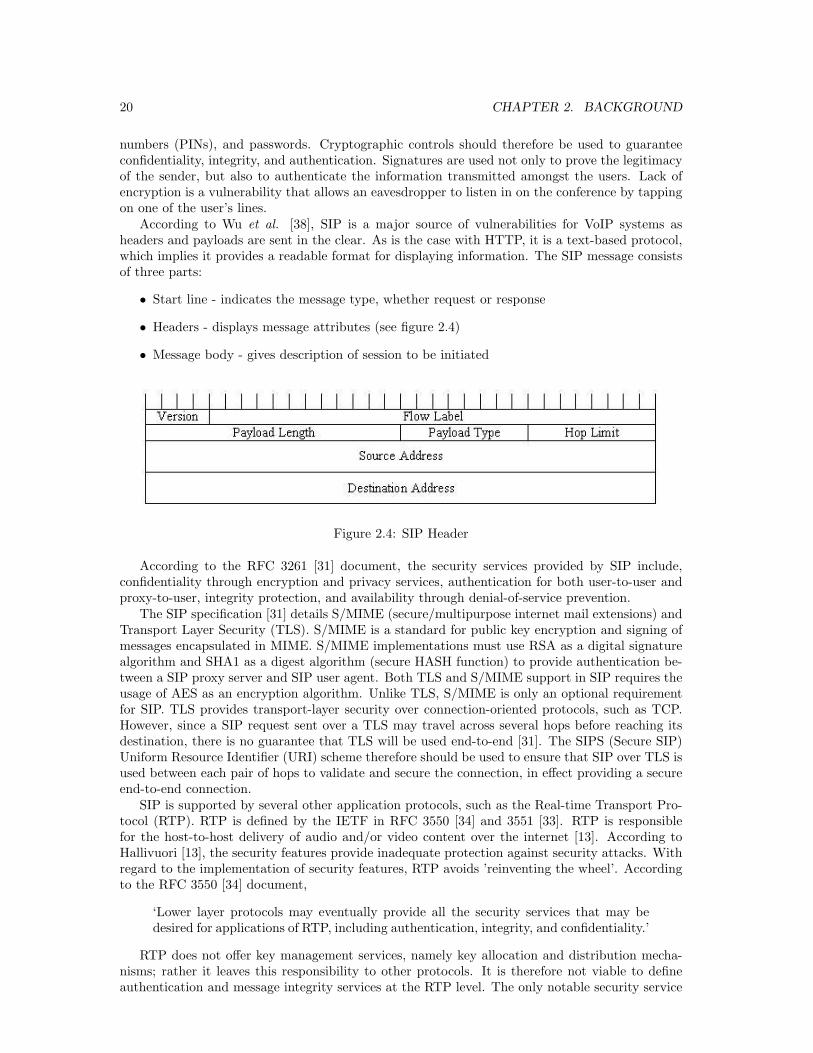
According to Wu et al. [38], SIP is a major source of vulnerabilities for VoIP systems asheaders and payloads are sent in the clear. As is the case with HTTP, it is a text-based protocol,which implies it provides a readable format for displaying information. The SIP message consistsof three parts:
• Start line - indicates the message type, whether request or response
• Headers - displays message attributes (see figure 2.4)
• Message body - gives description of session to be initiated
Figure 2.4: SIP Header
According to the RFC 3261 [31] document, the security services provided by SIP include,confidentiality through encryption and privacy services, authentication for both user-to-user andproxy-to-user, integrity protection, and availability through denial-of-service prevention.
The SIP specification [31] details S/MIME (secure/multipurpose internet mail extensions) andTransport Layer Security (TLS). S/MIME is a standard for public key encryption and signing ofmessages encapsulated in MIME. S/MIME implementations must use RSA as a digital signaturealgorithm and SHA1 as a digest algorithm (secure HASH function) to provide authentication be-tween a SIP proxy server and SIP user agent. Both TLS and S/MIME support in SIP requires theusage of AES as an encryption algorithm. Unlike TLS, S/MIME is only an optional requirementfor SIP. TLS provides transport-layer security over connection-oriented protocols, such as TCP.However, since a SIP request sent over a TLS may travel across several hops before reaching itsdestination, there is no guarantee that TLS will be used end-to-end [31]. The SIPS (Secure SIP)Uniform Resource Identifier (URI) scheme therefore should be used to ensure that SIP over TLS isused between each pair of hops to validate and secure the connection, in effect providing a secureend-to-end connection.
SIP is supported by several other application protocols, such as the Real-time Transport Pro-tocol (RTP). RTP is defined by the IETF in RFC 3550 [34] and 3551 [33]. RTP is responsiblefor the host-to-host delivery of audio and/or video content over the internet [13]. According toHallivuori [13], the security features provide inadequate protection against security attacks. Withregard to the implementation of security features, RTP avoids ’reinventing the wheel’. Accordingto the RFC 3550 [34] document,
‘Lower layer protocols may eventually provide all the security services that may bedesired for applications of RTP, including authentication, integrity, and confidentiality.’
RTP does not offer key management services, namely key allocation and distribution mecha-nisms; rather it leaves this responsibility to other protocols. It is therefore not viable to defineauthentication and message integrity services at the RTP level. The only notable security service
2.6. IDS DEPLOYMENT IN TELECONFERENCING SCENARIO 21
offered by standard RTP is confidentiality. However, the default encryption algorithm is the DataEncryption Standard (DES) algorithm, which has been found relatively easy to break [33].
From the IETF specifications for the SIP and RTP protocols, the security services providedby both protocols meet the security requirements for VoIP applications. But, although VoIPtechnology has enjoyed growing popularity, not much attention has been paid to its security.Secure RTP (SRTP) and Secure SIP (SIPS) are optional requirements, which means not all VoIPapplications actually implement SRTP or SIPS.
These are just a few of the possible loopholes that may be exploited by attackers. It is almostimpossible to build a computer system free of vulnerabilities, hence the need to install intrusiondetection systems to check for inappropriate system activities, which may include unauthorizeduse and abuse of computing or networking activities.
2.6 IDS Deployment in Teleconferencing Scenario
The intrusion detection system may be installed at strategic points on the network and/or thehost computer. Currently there are several intrusion detection systems available. However, iden-tifying intrusion detection systems for internet-based teleconferencing systems, namely VoIP, isa non-trivial task. Developing an IDS suited for teleconferencing intrusion detection has provedchallenging. Wu et al. [38] attributes this to the multiple protocols employed for call managementand data delivery, the distributed nature of such systems, the wide range of attacks directed tothe system, and finally the system components that are under different domains. With the aim ofcountering these challenges, they proposed an IDS called Scidive. Scidive detects anomalies usinga rule-matching engine. It applies both stateful detection and cross-protocol detection methodolo-gies. Stateful detection refers to the grouping of multiple packets into a single state, for instance,the assembly of packets from the same session. This state is compared with a rule-set to checkfor possible attacks. Cross-protocol detection assesses packets from multiple protocols, hence ag-gregation across protocols. With cross-protocol detection patterns in different protocols, say SIPand RTP, can be identified.
Unfortunately, Scidive is an abstract framework and therefore no working implementationexists. According to Scidive’s authors, its framework has been developed further, resulting in animproved VoIP IDS architecture called Spacedive. They assert that Spacedive is more scalablethan Scidive and also features more flexible detection rule semantics. Unfortunately again, thereis also no working implementation of Spacedive available.

22 CHAPTER 2. BACKGROUND

Chapter 3
Testing Intrusion DetectionSystems
3.1 IDS Testing and Benchmarking
Intrusion detection systems are designed to look out for particular activities (events). Benchmark-ing is a basic requirement for IDS testing. Ranum [29] outlines factors to consider for constructinggood benchmarks. These include determining what is to be measured, realistic traffic generation,measuring the performance of an aggregate intrusion detection system rather than pitting hostintrusion detection system (HID) against network intrusion detection system (NID), and how toorganize packets (in case of network intrusion detection systems).
Evaluating IDS involves, among other things, selecting attacks to be used in the testing process.Such attacks could be artificially generated. The NIDSBENCH/IDS Wakeup tool is an example ofan IDS testing tool, which generates packets. Other traffic generation tools include WebAvalanceand Iperf [8]. IDS testing tools offer a safer approach to, say, downloading published executablesfrom the Web. This is because it is difficult to verify the authenticity of many of these exploits asthey are published by several individuals and hosted from various locations. Furthermore, there isalways the risk of having an exploit doing the unexpected and compromising the host’s security.For example, there is always the danger that certain downloaded executable files may install abackdoor on the host running the attack.
There have been attempts to build generalized test environments, which incorporate a collec-tion of tools for traffic generation and analysis. Common examples include Defense AdvancedResearch Projects Agency (DARPA) sponsored MIT Lincoln Lab Intrusion Detection Evaluation[18] and Lincoln Adaptable Real-time Information Assurance Testbed (LARIAT). LARIAT is anextension of DARPA. Both offer quantitative and metrics-based assessment of IDS. DARPA hasbeen criticized for focusing too much on denial of service attacks, making no attempt to detectfalse positives, and also for the fact that the attacks generated are evenly distributed [8]. However,it is difficult to come across an improved data set. DARPA remains the most freely available dataset. Secondly, it comes from a legitimate source - MIT Lincoln Laboratory. For this research, theDARPA 1998 intrusion detection system evaluation data set will therefore be used. This corpusconsisted on four main categories of attacks:
• Denial of service (DOS)
• Probing attacks to find potential weaknesses
• Unauthorized access from remote machine
• Unauthorized access to local superuser privileges
23
24 CHAPTER 3. TESTING INTRUSION DETECTION SYSTEMS
Given the fact that intrusion detection systems are dependent on their operating environment,it has been suggested that creating a customized testbed would provide an ideal test environment[29]. It should be noted that attacks within the DARPA data set apply generally to any computersystem or application.
3.2 Test Setup
The SIP client we selected for the testing task was the Ekiga [10] video conferencing application.Since the focus of this research is on teleconferencing systems, there is need to include traffic toand from a teleconferencing application. To do this, the Wireshark tool [37] was used to capturevoice over IP (VoIP) traffic as Ekiga is running. Wireshark also includes XML (eXtensible MarkupLanguage), postScript, CSV (comma-separated values), and plain text export features. We usedthe DARPA environment; an intrusion detection evaluation tool from the Massachusetts Instituteof Technology (MIT) Lincoln Laboratory [18]. MIT Lincoln Laboratory provides a collectionof data sets (corpora), which consists of background traffic mixed with intrusions. We carriedout tests on two different data corpora, in form of tcpdump files, from the 1998 DARPA datasets, namely the test data from Friday of Week 2 and Thursday of Week 1. The second testwas for confirmatory purposes. The selection of these two data sets was based on the numberof network packets they contained as well as the computer memory constraints. The Friday ofWeek 2 tcpdump file, with a memory size of 477.9 megabytes, contained 2,177,646 packets, whileThursday of Week 1 tcpdump file, with a memory size of 729.1 megabytes, contained 2,362,894packets. The size of the tcpdump file therefore is not only dependent on the number of packets itholds, but also on the network packet size.
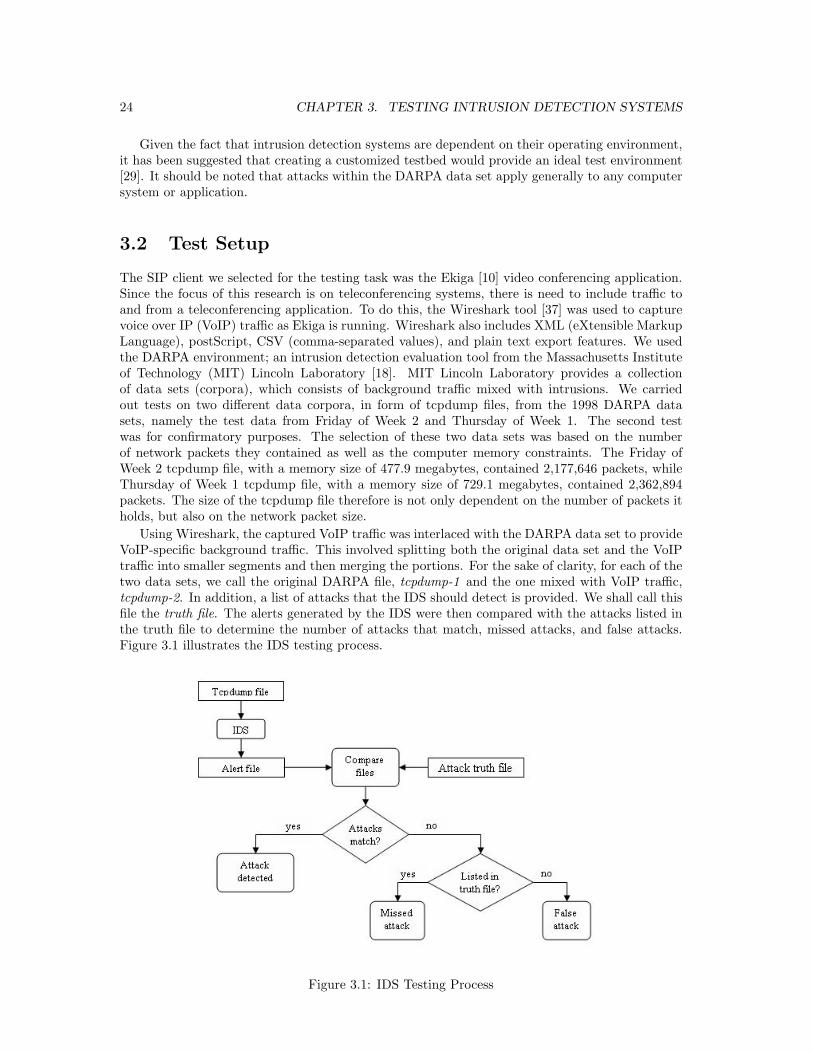
Using Wireshark, the captured VoIP traffic was interlaced with the DARPA data set to provideVoIP-specific background traffic. This involved splitting both the original data set and the VoIPtraffic into smaller segments and then merging the portions. For the sake of clarity, for each of thetwo data sets, we call the original DARPA file, tcpdump-1 and the one mixed with VoIP traffic,tcpdump-2. In addition, a list of attacks that the IDS should detect is provided. We shall call thisfile the truth file. The alerts generated by the IDS were then compared with the attacks listed inthe truth file to determine the number of attacks that match, missed attacks, and false attacks.Figure 3.1 illustrates the IDS testing process.
Figure 3.1: IDS Testing Process
3.2. TEST SETUP 25
It is easier to compare two files that are in the same format. It is for this reason that boththe truth and alert files were converted to XML format. The alert files generated by Snort wereconverted into XML format using Wireshark. A custom made sed (stream editor) script was usedto transform the truth file from plain text format to XML.
Two network detection systems were selected for testing, namely Snort [30], created by MartinRoesch, and Firestorm NIDS [19], because of their contrasting approaches to intrusion detection.They are both capable of real-time traffic analysis and packet logging. Snort applies signature-based detection, while Firestorm NIDS is anomaly-based (refer to figure 2.1). We did not opt forPrelude because it operates more or less like a management system. It only receives alerts raisedby other IDSs, and then makes a decision; hence it is not a ’traditional’ IDS.
3.2.1 Snort
According to Roesch [30], Snort is an open source, signature-based, packet sniffing network intru-sion detection system. Snort can be used on-line and off-line. It has the ability to capture live dataon network interfaces, as well as read packet data from dump files. Snort offers a libpcap-basedsniffing interface, thus it has the ability to read libpcap files such as tcpdump files. Snort featuresa rule-based detection engine that performs pattern matching. The rules form ’signatures’ withwhich the input data is matched to detect attacks. Snort offers several output options. The de-fault alerting mechanisms are to log in decoded ASCII format and use full alerts. Other commonoutput options (output modes) include, among others:
• Printing alerts in a quick one-line format to a specified output file
• Logging packets to a tcpdump-formatted file
• Sending Snort data to a specified SQL database
For testing purposes, Snort was used off-line; configured to capture packet data from tcpdumpfiles. It was run in both NIDS mode and packet logger mode, which allowed the raised alerts to belogged in a specific file. The test data in libpcap format was fed into the same host machine runningSnort. With the Snort process started, the following command was entered on the command line:
snort -r /path-to-tcpdump-file -c /path-to-configuration-file -A fast -l /path-to-output-file
The snort -r switch is used to read tcpdump files, while -c switch reads the configuration file.The -A switch generates the output (an alert file). The fast alert mode, -A fast, is the NIDSmode output option responsible for writing the alert in a simple format with a timestamp, alertmessage, source and destination IPs and ports. The -l switch is used when Snort is run in packetlogger mode to specify a logging directory.
Snort was configured with all the rules enabled. First, the tcpdump-1 file was fed into the hostmachine followed by tcpdump-2. This resulted in two alert files (in text format) corresponding toeach tcpdump file. We shall call these alert files snortAlert-1 and snortAlert-2 respectively.
3.2.2 Firestorm
Firestorm [19] is a network intrusion detection system (NIDS) created by Gianni Tedesco. LikeSnort, Firestorm can be used on-line and off-line.
Firestorm is Snort compatible, thus it supports Snort’s signature format. Unlike Snort, how-ever, Firestorm offers protocol anomaly detection. Firestorm outputs alerts in extended log (elog)format to a specified directory. Firestorm includes a tool called firecat for converting Firestormalert logs to pcap format.
In this research, Firestorm NIDS was also configured to capture off-line network traffic; henceit could capture traffic from libpcap files. As was the case with the Snort test, Firestorm NIDSwas configured to read first the tcpdump-1 file, then the tcpdump-2. Using the firecat tool, thegenerated alerts were converted to libpcap format. Again, for the sake of clarity, we shall call the

26 CHAPTER 3. TESTING INTRUSION DETECTION SYSTEMS
generated alert files fireAlert-1 and fireAlert-2 corresponding to tcpdump-1 file and tcpdump-2,respectively.
3.3 Actual Test
As described in the Test Setup section, the data sets were read, in turn, by the two IDSs - Snortand Firestorm. The data corpora used for this test consisted of a modified version of the originalDARPA 1998 data set from Friday of Week 2, that is, one mixed with the VoIP traffic at a ratio1:2. This customized version, tcpdump-2, contained a total of 3,167,722 packets. In addition, thetwo IDSs where tested against data sets with varying amounts of VoIP traffic to check how itaffected their performance.
3.3.1 Snort Output
The snortAlert-1 file, corresponding to tcpdump-1, contained 66,414 intrusions, while snortAlert-2, corresponding to tcpdump-2, contained 66,707 intrusions. However both values are far lessthan the 108,831 attacks listed in the truth file. The truth file and snortAlert-2 file were furthersorted to remove duplicates, based on destination IP addresses and destination port instances.The truth file contained 2,079 unique ports for 1,218 different destination IP addresses, while thesnortAlert-1 and snortAlert-2 files contained only 481 and 490 different destination IP addressesand port instances.
3.3.2 Firestorm Output
The fireAlert-1 file, corresponding to tcpdump-1, and fireAlert-2 file, corresponding to tcpdump-2contained only 50 and 46 alerts, respectively. The general observation was that the detection rateof Firestorm NIDS is very low. Hence, the number of missed attacks is very high. On the brightside, all the alerts generated were listed in the truth file (no false alarms). This observation isclearly bizarre, as it is a deviation from the common belief that anomaly detection has a potentiallyhigh rate of false positives.
As already mentioned, both Snort and Firestorm output their findings in log files. However,unlike Firestorm, Snort also prints a summary of results on the screen. See a screenshot of Snort’soutput after reading the tcpdump-2 file in figure 3.2. Table 3.1 gives a summary of results fromSnort and Firestorm.
Table 3.1: Output from Snort and Firestorm
File No. of intrusion instances No. of unique alert instances raisedTruth file 108,831 2,079snortAlert-1 66,414 481snortAlert-2 66,707 490fireAlert-1 50 32fireAlert-2 46 30
The number of VoIP packets in the tcpdump-2 file was varied in order to ascertain whetherthe number of VoIP packets compared to those in the original file (tcpdump-1) has an effect onthe performance of the IDSs. See Table 3.2.
As a result of the increasing number of VoIP packets, Snort’s generates more alerts, but actuallythe alert rate falls slightly. However for Firestorm, with the original tcpdump file (tcpdump-1),it recorded 4 more alerts than with the data set containing VoIP traffic. As the ratio was varied,there was also a fall in Firestorm’s detection rate.

3.4. COMBINING SNORT WITH FIRESTORM 27
Figure 3.2: Screenshot of Snort result for tcpdump-2
3.4 Combining Snort with Firestorm
As already highlighted in the previous sections, both systems have their disadvantages. However,we believe the advantages they possess could compliment each other, resulting in an effective IDS.We therefore explored the possibility of combining the two systems so as to take full advantage ofthe good qualities both systems have to offer. The combination process involved ordering of thetwo IDSs, that is, Snort generated alerts acting as input for Firestorm, and alerts generated byFirestorm in turn acting as input for Snort.
Of the 108,831 alerts listed in the truth files, Snort generated 66,707 alerts (see table 3.3).The probability of detection is 0.612941165. Notice Snort processed 3,166,116 out of the pos-sible 3,167,722 packets in the tcpdump-2 file. When Firestorm alerts act as input for Snort,of the 46 Firestorm alerts, Snort generated 27 alerts, hence, the probability of detection fallsto 0.586956522; a percentage decrease of 4.2393373. However, Snort missed all 4 attacks inthe file oneFromFireWk25-2.pcap. Snort processed 10 packets out of the possible 42 packetsin twoFromFireWk25-2.pcap, of which Snort generated 27, resulting in a false rate of 17
27 =0.62962963.
Of the 108,831 alerts listed in the truth files, Firestorm generated 46 alerts (see table 3.4).Hence, the probability of detection is 0.000422674. Of the 66,707 Snort alerts (with Snort alertsacting as input for Firestorm), Firestorm generated 23 alerts. Hence, the probability of detectionfell to 0.0003447914; a percentage decrease of 18.42610221 percent. Firestorm has a 0 percentfalse rate.

28 CHAPTER 3. TESTING INTRUSION DETECTION SYSTEMS
Table 3.2: Test Results with varying ratios
File No. of Packets Ratio No. of Snort alerts No. of Firestorm alertswk25Original 2,177,646 N/A 66,414 50wk25VoIP.cap 2,182,559 1:444 66,433 46wk25VoIP7-1.cap 2,508,116 1:7 66,513 46wk25VoIP2-1.cap 3,167,722 1:2 66,707 46
Table 3.3: Snort Alerts
Input: Packets Processed Output: Alertstcpdump-2 3,167,722 logSnortWk25-2 66,707Alerts from FirestormoneFromFireWk25-2.pcap 4 logSnortFireMerge1 0twoFromFireWk25-2.pcap 10 logSnortFireMerge2 27Total: 14 Total: 27
The decrease in the probability of detection just goes to show that a difference in traffic loadproduces different results. It does not suggest that a combination of the two IDSs decreasesperformance; rather a combination produces better results. When each IDS was tested separately,one of the attacks originally missed by Snort and detected by Firestorm was eventually detected bySnort when Firestorm alerts acted as input for Snort. Although this observation appears trivial,it indicates that a combination of the two IDSs performs better than either IDS alone.
3.5 Analysis of Test Results
If Ttcpdump represents the total number of packets tcpdump file and Atcpdump represents the totalnumber of attacks in tcpdump file, the probability of having clean traffic, Pr(CT), is:
Pr(CT ) =Ttcpdump − Atcpdump
Ttcpdump(3.1)
Hence, the probability of having clean traffic is 3,167,722−108,8313,167,722 = 0.9656. To calculate the
number of false positives, the total number of accurately detected attacks is subtracted from thetotal number of alerts raised. The result can then be divided by the total number of alerts raisedto compute the probability of a false positive occurrence. For a given intrusion detection system,IDS, suppose AIDS represents the total number of alerts raised, while DIDS represents the totalnumber of accurately detected attacks. The probability of a false positive, Pr(FP), is:
Pr(FP ) =AIDS − DIDS
AIDS(3.2)
To calculate the number of negatives (missed attacks), you take the total number attacks sentand subtract the total number of accurately detected attacks. Therefore, the probability of a falsenegative or missed attack, Pr(M), is
Pr(M) =Atcpdump − DIDS
Atcpdump(3.3)
With Snort the probability of detection was approximated to 66,707108,831 = 0.61. Therefore, the
false negative rate (probability of missed attacks) is 1 − 0.61 = 0.39.

3.5. ANALYSIS OF TEST RESULTS 29
Table 3.4: Firestorm Alerts
Input: Output: Alertstcpdump-2 logWk25-2(Dir)
oneFromFireWk25-2.pcap 4twoFromFireWk25-2.pcap 42
Total: 46Alerts from SnortlogSnortWk25-2.cap logCombine2(Dir)
snortFireWk25-2.pcap 23Total: 23
Given the enormous size of the data set and memory constraints of the host machine, it wasdifficult to accurately match the exact attack instances. In an attempt to curb this problem,segments based on packet ranges were created. Table 3.5 shows test results for smaller segmentsof test data (tcpdump-1 file).
Table 3.5: Segment Test Results
Packets range Number of Alerts1-1,000 48
1,001-2,000 22,001-3,000 623,001-4,000 604,001-5,000 153
5,001-500,000 9,947500,001-1,000,000 4,850
1,000,001-1,500,000 7,8671,500,001-2,000,000 18,0622,000,001-2,177,646 25,684
Total 66,735
After running Snort, the number of alerts from each segment was totaled to 66,735; whichis greater than the 66,414 alerts for the tcpdump-1 (single file input). This could be a resultof intrusions being fragmented, creating more intrusion instances. It is for this reason that thegenerated alert file was sorted to remove duplicates to determine the number of false alarms. Thenumber of instances of each unique destination IP address and its corresponding port numberin the truth file and the alert file were determined. The resulting value from the truth file wassubtracted from that of the alert file. A surplus meant, there was no match found, and hence itwas used to estimate the number of false alarms. There were 33,357 unmatched destination IPaddresses in the alert file, therefore, the probability of false alarm was approximated to 33,357
66,707 =0.5001.
With Firestorm NIDS, the probability of detection was approximated to 46108,831 = 0.000422674,
while the probability of missed attacks is 1 − 0.000422674 = 0.999577326 (see table 3.6). Theprobability of false alarm was 0.

30 CHAPTER 3. TESTING INTRUSION DETECTION SYSTEMS
Table 3.6: IDS Evaluation Results
Snort Firestorm NIDSDetected attacks 66,707 46Missed attacks 42,124 108,785False Positives 33,357 0Pr(Detected attacks) 0.61294117 0.00042267Pr(Missed attacks) 0.38705883 0.99957733Pr(False Positives) 0.49994753 0
3.6 Confirmatory Test
To check for consistency, a second test was carried out using the DARPA 1998 data set fromThursday of Week 1. The same procedure used in actual test was applied in this confirmatorytest. Table 3.7 shows the results for the second test featuring data corpora with varying numbersof VoIP packets. As was the case in the actual test, as the amount of VoIP produces varying Snortalert instances. However, there was no change in the number of Firestorm alerts. Generally, forboth IDSs, there is a fall in detection rates.
Table 3.7: Results for Confirmatory Test with varying ratios
File No. of Packets Ratio No. of Snort alerts No. of Firestorm alertswk14Original 2,362,894 N/A 79,667 47wk14VoIP7-1.cap 2,693,364 1:7 79,766 47wk14VoIP2-1.cap 3,352,970 1:2 79,960 47
For this confirmatory test, the focus of attention was on the data corpora with the highestratio, hence the tcpdump-2 file with a 2:1 ratio, containing a total of 3,352,970 packets. Thecorresponding truth file had a list of 119,318 attack instances.
Snort generated 79,960 alerts, while Firestorm generated only 47 alerts. Hence, the prob-abilities of detection for Snort and Firestorm are 0.670141973 and 0.00039390536, respectively.With regard to false positives, Snort generated 29,753 false alarms, hence a false alarm rate of0.372098549, while Firestorm once again did not raise any false alarms. Table 3.8 presents theresults of the second test.
Table 3.8: IDS Evaluation Results for Confirmatory Test
Snort Firestorm NIDSDetected attacks 79,960 47Missed attacks 39,358 119,271False Positives 29,753 0Pr(Detected attacks) 0.67014197 0.00039391Pr(Missed attacks) 0.32985803 0.99960609Pr(False Positives) 0.37209855 0
There is no significant difference between the findings in the actual test and those in theconfirmatory test. In the case of Snort, there is a slight increase in the rate of detection, whilethere is a drop in the probability of missed attacks and probability false positives. Firestorm, onthe other hand, did not record any false alarms, as was the case in the actual test. However, there

3.6. CONFIRMATORY TEST 31
is a slight decrease in the probability of detection, while the probability of missed attacks risesslightly.
Tables 3.9 and 3.10 give a summary of results from the actual test and confirmatory test. Itis based on the two tcpdump files (Friday of Week 2 and Thursday of Week 1) mixed VoIP trafficat a 2:1 ratio.
Table 3.9: Summary of Snort Alerts from Tests 1 and 2
Input Output Alertswk25VoIP2-1.cap log25VoIP2-1 66,707wk14VoIP2-1.cap log14VoIP2-1 79,960
Alerts from FirestormlogFromFireWk25.pcap logMixtureWk25.pcap 27logFromFireWk14.pcap logMixtureWk14.pcap 20
Table 3.10: Summary of Firestorm Alerts from Tests 1 and 2
Input Output Alertswk25VoIP2-1.cap log25VoIP2-1 46wk14VoIP2-1.cap log14VoIP2-1 47Alerts from Snort
logFromSnortWk25.pcap logMixtureWk25.pcap 23logFromSnortWk14.pcap logMixtureWk14.pcap 20
3.6.1 Estimates for Network-based Intrusion Detection
Table 3.11 presents the protocols of the packets that were listed as attacks in the truth file andshows whether they were detected by either of the two NIDS: Snort or Firestorm. We alsochecked this for the second confirmatory test and found exactly the same results. The idea behindpresenting this list is to estimate probabilities of detection, false alarms, and missed attacks forNIDS in general. Because Firestorm has a very low detection rate, many of the listed protocolswere not detected by it. This explains why each NIDS was not considered separately, hence thereis no separate column for each NIDS in table 3.11.
As observed in table 3.11, of the 43 different protocols, the number of protocols detected byeither Snort or Firestorm is 23, while the number of protocols not detected is 20. There were 4false alarms, thus, protocols detected by either NIDS but are not listed as attacks in the truth file.With these values, it is possible to estimate the probability of detection, false alarm, and missedattacks of a NIDS given an occurrence of an alarm.
Therefore, for a NIDS, the probability of detection was approximated to 2343 = 0.5348, while the
probability of missed attacks was 43−2343 = 0.4651. The probability of false alarm was approximated
to 443 = 0.0930.

32 CHAPTER 3. TESTING INTRUSION DETECTION SYSTEMS
Table 3.11: Protocols
Port number in truth file Protocol Detected by Snort or Firestorm1/u 1/udp YES
111/u sunrpc YES177/u xdmcp NO21103 - NO
32775/u Sometimes-rpc14 NO32776/u Sometimes-rpc16 NO32777 Sometimes-rpc18 NO32948 - NO540 uucp, uucpd NO8000 irdmi NO970/u - YES971/u - YES971 - NO
975/u - YES976/u - YES979/u - YES980/u - YES
25 SMTP NO161 SNMP YES6000 X11 YES19 chargen NO53 domain/u YES- eco/i YES- ecr /i YES
79 finger YES- frag/i YES
23 frag/u YES20 ftp-data YES21 ftp NO70 gopher NO80 http YES113 ident NO143 imap NO6667 irc YES513 login NO119 nntp NO123 ntp/u NO110 pop3 NO111 sunrpc YES23 telnet YES- tim/i NO
37 time YES- urp/i YES
Chapter 4
IDS Evaluation using A BayesianNetworks Classifier
The different types of IDSs use different approaches to intrusion detection. How can the per-formance of an IDS be predicted based on these features? Because this involves classification ofIDSs according to their characteristics, the Bayesian network approach offers a possible solution.Bayesian networks classify data by calculating the appropriate conditional probability.
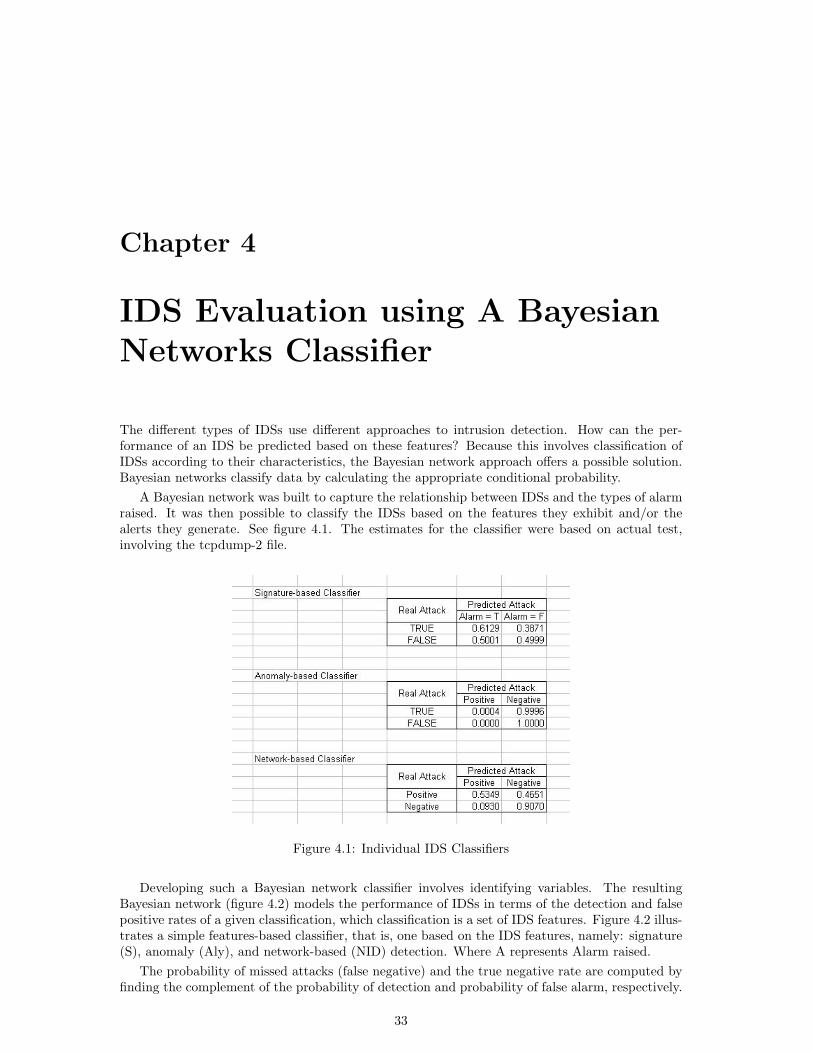
A Bayesian network was built to capture the relationship between IDSs and the types of alarmraised. It was then possible to classify the IDSs based on the features they exhibit and/or thealerts they generate. See figure 4.1. The estimates for the classifier were based on actual test,involving the tcpdump-2 file.
Figure 4.1: Individual IDS Classifiers
Developing such a Bayesian network classifier involves identifying variables. The resultingBayesian network (figure 4.2) models the performance of IDSs in terms of the detection and falsepositive rates of a given classification, which classification is a set of IDS features. Figure 4.2 illus-trates a simple features-based classifier, that is, one based on the IDS features, namely: signature(S), anomaly (Aly), and network-based (NID) detection. Where A represents Alarm raised.
The probability of missed attacks (false negative) and the true negative rate are computed byfinding the complement of the probability of detection and probability of false alarm, respectively.
33

34 CHAPTER 4. IDS EVALUATION USING A BAYESIAN NETWORKS CLASSIFIER
A True False Missed (False negative) True negativeP(S=true | A) 0.6129 0.5001 0.3871 0.4999
P(Aly=true | A) 0.0004 0.0000 0.9996 1.0000P(NID=true | A) 0.5349 0.0930 0.4651 0.9070
Figure 4.2: Bayesian Network Classifier
Equation 4.1 determines the joint probability, P(A, S, Aly, NID):
P (A,S,Aly, NID) = P (NID|A) ∗ P (Aly|A) ∗ P (S|A) ∗ P (A) (4.1)
As the reader will have noticed, the host-based detection feature is not included in the list ofvariables. There are two reasons for this. Firstly, it was difficult to get reliable figures, becausethere were no application-based IDSs available for testing. Secondly, since VoIP technology isnetwork based, a NIDS is more important than a HIDS and hence omitting the HIDS feature maynot have notable consequences.
Assume the notation, Pfifj(adt), denotes the probability that an IDS with classification fi
will raise an alert for an intrusion detected by another IDS with classification fj when subjectedto traffic with attack a, where fi and fj represent different combinations of IDS features, whilePfifj
(afp), denotes the probability that an IDS with classification fi will raise a false alarm for afalse alarm raised by another IDS with classification fj when subjected to traffic with attack a.Estimates for these can be determined using joint probability.
To encode the above probabilities, the Genie[11] software package was used. Genie is a tooldeveloped by the Decision Systems Laboratory from the University of Pittsburgh. With this tool,we can develop the model or classifier in figure 4.3.
Figure 4.3: Bayesian Network created using Genie
Genie was selected for this project because of its ability to build Bayesian network models,as well as creating inference diagrams and evaluating the created probabilistic models. There areseveral tools capable of constructing and testing Bayesian networks, for example, BayesBuilder [5]

35
and Microsoft Bayesian Network tools [24]. However, Genie’s model evaluating feature gives theedge over the other tools.
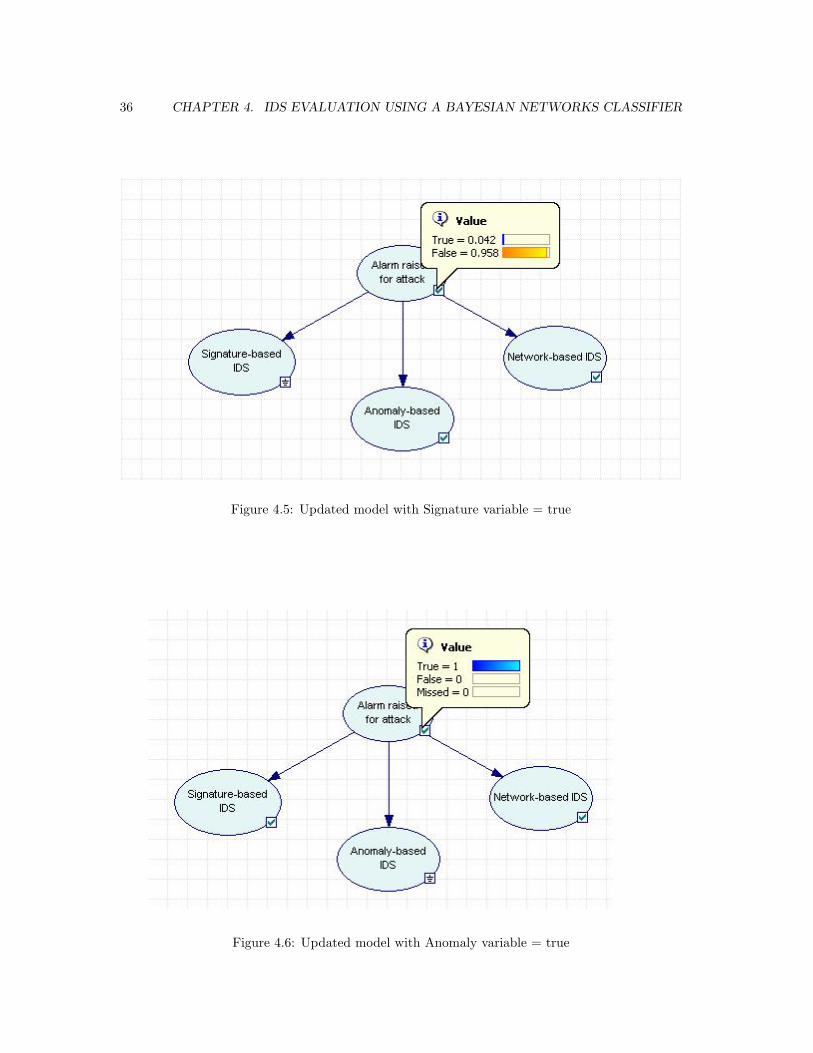
The created Bayesian network is then put to task to make predictions of the unknown. Toillustrate this, suppose we want to know the chance that an attack exists if a network-based IDSraises an alarm. Using Genie, the value of the NIDS variable is set to true. Genie then updatesits probability distribution over the variable Alarm. As shown in figure 4.4, if the alert raised bya network-based IDS is true, the probability of the alarm being an attack changes from 0.034 to0.176. Given the alert raised by a signature-based IDS is true, the probability of the alarm beingan attack changes from 0.034 to 0.042, while if the alert raised by an anomaly-based IDS is true,the probability of the alarm being an attack raises significantly from 0.034 to 1.0. (See figures 4.5and 4.6, respectively).
This outcome is attributed to the respective rates of false alarm. In each of the three cases,there is an increase in the probability of alarm, given a true condition. However, the rate ofincrease is dependent on the rate of false alarms. In the case of signature-based IDS, the falsealarm rate of 0.4999 affects the slight increase in probability of alarm from 0.034 to 0.042. Thisis increase is relatively small compared to the one in the network-based IDS case, with a 0.0930false alarm rate, which results in an increase in the probability of alarm from 0.034 to 0.176. Theanomaly-based IDS, with a 0.0 false alarm rate, exhibits the highest increase in the probability ofalarm, from 0.034 to 1.0.
Figure 4.4: Updated modelwith Network variable = true
Considering a case where all three variables are true (that is, they raise true alerts), theprobability of an attack being present is 1.0. See figure 4.7. This justifies (with the help ofBayesian networks) the widely accepted fact that an IDS with a combination of three features willdefinitely perform better than one exhibiting just one of the features.
36 CHAPTER 4. IDS EVALUATION USING A BAYESIAN NETWORKS CLASSIFIER
Figure 4.5: Updated model with Signature variable = true
Figure 4.6: Updated model with Anomaly variable = true

37
Figure 4.7: Updated model with all variables = true

38 CHAPTER 4. IDS EVALUATION USING A BAYESIAN NETWORKS CLASSIFIER
Chapter 5
Conclusion
Internet-based telephony (VoIP) has experienced an explosion in popularity. Unfortunately, therehas been little focus on VoIP security concerns. Not much attention was paid to the security ofthe major VoIP protocols, like SIP and RTP. They are usually implemented in their standardforms, that is, with no security measures in place, even though they do exist in the specification asan option. Given the wide range of threats on the internet, implementing Secure SIP and SecureRTP should be a necessity, and not just an option.
For real-time systems, IDS output should be processed in real-time. Although the two IDSswe tested, namely Snort and Firestorm, satisfy this condition, they still do not have impressivedetection rates. As we observed in the tests, Snort in particular does not process all input packets.This is an area of concern as IDS deployed in teleconferencing systems will have to cope with thehuge amounts of data in form of audio or video. Signature-based Snort boasts of a much higherdetection rate than anomaly-based Firestorm NIDS, when tested against a data set containingVoIP traffic. However, as already mentioned Firestorm has a lower false positive rate. Snorttherefore is a better alert system. But, for response activity, Firestorm is a more feasible option,because not only does it generate less traffic, but also it gives more direction to where the intrusionoriginates. The information given by Firestorm about protocols, in particular was a little moredetailed than what Snort offers. For example, it identified packet 27,274 as 200 OK text/html,which means a request was accepted and the content type was text. This is because Firestormfeatures protocol anomaly detection.
In addition, the Bayesian network models confirmed Axelsson’s [3] findings, that false alarmrates influence detection rates. We observed that with Snort’s false alarm rate of 0.5001, theprobability of a positive attack was predicted to be 0.042, while Firestorm’s false alarm rate of 0.0resulted in a 1.0 probability prediction.
As already mentioned we explored two options, namely running Snort followed by Firestormand vice-versa. Using Snort output as input for Firestorm produced better results than usingFirestorm alerts as input for Snort (see tables 3.3 and 3.4). This is because with Firestorm’shigh missed attack rate, most of the intrusion will have escaped detection by the time Snort isrun. Combining the two IDSs produces slightly better results. Using Bayesian belief networks, weapplied a probabilistic treatment of IDS performance. The predictions made from the Bayesiannetwork models concurred this finding, and hence strengthening the case for the Bayesian approachas a potential IDS effective measure. This prediction feature is particularly useful in real-timeapplications, where large amounts of information need to be processed in real-time.
The ability of Bayesian network classifiers to predict the performance of an IDS with or withoutcertain features is a major advantage it holds over other measures. The main disadvantage ofthe Bayesian approach is that unlike other security measures, it is over dependent on reliableinformation (prior probabilities). This shortcoming had no effect on the outcome of our researchbecause the values obtained from the IDS testing process were accurate.
39

40 CHAPTER 5. CONCLUSION
5.1 Future Research
As mentioned in chapter 2, a combination of network and application-based intrusion detectionis more efficient than each one separately. However, for this research it was not possible to fullyexplore this notion since most, if not all, the proposed VoIP-specific IDSs are abstract frame-works. Therefore, there is an absolute need to move that one step forward and build a workingimplementation of an application-specific IDS for VoIP-based systems, like teleconferencing.
A major difficulty we faced during IDS testing process was in determining accurately thenumber of false alarms. Since we were using offline test data, we were able to make good approx-imations, with the help of the truth files. Nonetheless, in case of online traffic, where the load ismuch bigger and time is of utmost importance, it is not practicable to employ the manual-basedmethods used in this research.
In our research, we investigated the possibility of applying the two IDSs in sequence, where theIDS tools are run after each other. However, this transfer of information was also done manually,which makes it infeasible in a real-time scenario. It would therefore be necessary to automatethis by developing an interface across which the IDSs can exchange information. This involvesdeveloping an algorithm that will allow a quick exchange of information. For example, convertingthe IDSs’ output into a common format in shortest time possible in order to cope with the demandsof heavy multimedia traffic.

Bibliography
[1] N. Abouzakhar, A. Gani, G. Manson, M. Abuitbel, and D. King. Bayesian Learning NetworksApproach to Cybercrime Detection. In PGNET ’03: Proceedings of the 2003 PostGraduateNetworking Conference, Liverpool, United Kingdom, 2003.
[2] R. Andersson, A. Hunstad, and J. Hallberg. Evaluation of the security of components indistributed information systems. Technical report, FOI: Swedish Defence Research Agency,November 2003. Also available at http://www2.foi.se/rapp/foir1042.pdf.
[3] S. Axelsson. The base-rate fallacy and its implications for the difficulty of intrusion detec-tion. In CCS ’99: Proceedings of the 6th ACM conference on Computer and communicationssecurity, pages 1–7, New York, NY, USA, 1999. ACM Press.
[4] S. Axelsson. Intrusion Detection: A Survey and Taxonomy. PDF document, 2000. http://www.cs.plu.edu/courses/CompSec/arts/taxonomy.pdf.
[5] BayesBuilder: A tool for constructing and testing Bayesian networks. http://www.snn.ru.nl/nijmegen/index.php3?page=31.
[6] H. Debar, D. Curry, and B. Feinstein. The Intrusion Detection Message Exchange Format(IDMEF). Internet Engineering Task Force, March 2007. http://www.rfc-editor.org/rfc/rfc4765.txt.
[7] D.E. Denning. An Intrusion-Detection Model. In IEEE Symposium on Security and Privacy,pages 222–232, Oakland, California, USA, April 1986. IEEE Computer Society Press. Avail-able at: http://csdl.computer.org/dl/proceedings/sp/1986/0716/00/07160118.pdf.
[8] M. Desai. Survey - IDS Testing. Powerpoint presentation. Available at http://web2.uwindsor.ca/courses/cs/aggarwal/cs60592/IDSTesting.ppt.
[9] Dragon. http://www.enterasys.com/company/literature/dragon-idsips-ds.pdf.
[10] Ekiga. Available at http://www.gnomemeeting.org/.
[11] Genie. Available at http://genie.sis.pitt.edu/.
[12] D. Gollmann. Computer Security, chapter 1, pages 1–16. John Wiley & Sons, 2005. Alsoavailable at http://media.wiley.com/product_data/excerpt/39/04708629/0470862939.pdf.
[13] V. Hallivuori. Real-time Transport Protocol (RTP) security, 2000. Available at http://www.tml.tkk.fi/Opinnot/Tik-110.501/2000/papers/hallivuori.pdf.
[14] D. Heckerman. A tutorial on learning with Bayesian networks. pages 301–354, 1999.
[15] S. Huang. Intrusion Detection Design and Analysis of Algorithms. Powerpoint presentation,September 2005. http://www.cs.uh.edu/events/2005_09_minitalks/Huang.ppt.
41

42 BIBLIOGRAPHY
[16] P. Innella and O. McMillan. An Introduction to Intrusion Detection Systems. Article onthe SecurityFocus portal, December 2001. Available at http://www.securityfocus.com/infocus/1520.
[17] C. Kruegel, D. Mutz, W. Robertson, and F. Valeur. Bayesian Event Classification for IntrusionDetection. In ACSAC ’03: Proceedings of the 19th Annual Computer Security ApplicationsConference, page 14, Washington, DC, USA, 2003. IEEE Computer Society.
[18] MIT Lincoln Laboratory. DARPA Intrusion Detection Evaluation Data Sets, January 2002.Available at http://www.ll.mit.edu/IST/ideval/data/data_index.html.
[19] J. Leach and G. Tedesco. Firestorm Network Intrusion Detection System. Firestorm Docu-mentation, 2003. Available at http://www.scaramanga.co.uk/firestorm/.
[20] S.Y. Lee, W.L.Low, and P.Y.Wong. Learning Fingerprints for a Database Intrusion DetectionSystem. In 7th European Symposium on Research in Computer Security, volume 2502/2002,pages 264–279, Zurich, Switzerland, 2002. Springer Berlin / Heidelberg.
[21] W. Lee, S.J. Stolfo, and K.W. Mok. A Data Mining Framework for Building IntrusionDetection Models. In IEEE Symposium on Security and Privacy, page 0120, 1999. Availableat: http://csdl.computer.org/dl/proceedings/sp/1999/0176/00/01760120.pdf.
[22] D. Lehmann. What is ID? SANS Institute: Intrusion Detection FAQ.Available at http://www.sans.org/resources/idfaq/what_is_id.php?portal=7a7d026c64983858261f04abc00ec026. Accessed Jan-07.
[23] B. Littlewood, S. Brocklehurst, N. Fenton, P. Mellor, S. Page, D. Wright, J. Dobson, J. McDer-mid, and D. Gollmann. Towards Operational Measures of Computer Security. Computer Sci-ence, 2(3), 1994. Also available at http://web.cs.wpi.edu/~fcco/classes/cs525F-2005/readings/littlewood91towards.pdf.
[24] Microsoft Bayesian Network Editor and Toolkit. http://research.microsoft.com/adapt/MSBNx/.
[25] D. Mutz, F. Valeur, G. Vigna, and C. Kruegel. Anomalous system call detection. ACMTrans. Inf. Syst. Secur., 9(1):61–93, 2006.
[26] V. Paxson. Bro: a system for detecting network intruders in real-time. Comput. Networks,31(23-24):2435–2463, 1999.
[27] S.C. Payne. A Guide to Security Metrics, June 2006. SANS Security Essentials GSECPracticle Assignment.
[28] Prelude: The Hybrid IDS Framework. http://www.prelude-ids.org/spip.php?rubrique13.
[29] M.J. Ranum. Intrusion Detection System benchmarking. Technical publications, NFR Secu-rity, December 2001. Available at http://www.snort.org/docs/Benchmarking-IDS-NFR.pdf.
[30] M. Roesch. Snort - Lightweight Intrusion Detection for Networks. In LISA ’99: Proceedings ofthe 13th USENIX conference on System administration, pages 229–238, Berkeley, CA, USA,1999. USENIX Association. Snort tool available at http://www.snort.org/.
[31] J. Rosenberg, H. Schulzrinne, G. Camarillo, A. Johnston, J. Peterson, R. Sparks, M. Handley,and E. Schooler. SIP: Session Initiation Protocol. Internet Engineering Task Force, June 2002.http://http://www.ietf.org/rfc/rfc3261.txt.

BIBLIOGRAPHY 43
[32] K. Scarfone and P. Mell. Guide to Intrusion Detection and Prevention Systems. SpecialPublication 800-94, National Institute of Standards and Technology, February 2007. Availableat http://csrc.ncsl.nist.gov/publications/nistpubs/800-94/SP800-94.pdf.
[33] H. Schulzrinne and S. Casner. RTP Profile for Audio and Video Conferences with MinimalControl. Internet Engineering Task Force, July 2003. http://www.ietf.org/rfc/rfc3550.txt?number=3550.
[34] H. Schulzrinne, S. Casner, R. Frederick, and V. Jacobson. RTP: A Transport Protocol forReal-Time Applications. Internet Engineering Task Force, July 2003. http://www.ietf.org/rfc/rfc3551.txt?number=3551.
[35] V. A. Smith. Bayesian Networks. http://biology.st-andrews.ac.uk/vannesmithlab/bayesnet.html.
[36] Tor: anonymity online. http://tor.eff.org/.
[37] Wireshark. Available at http://www.wireshark.org/.
[38] Y. Wu, S. Bagchi, S. Garg, N. Singh, and T. Tsai. SCIDIVE: A Stateful and Cross ProtocolIntrusion Detection Architecture for Voice-over-IP Environments. In DSN ’04: Proceedingsof the 2004 International Conference on Dependable Systems and Networks (DSN’04), page433, Washington, DC, USA, 2004. IEEE Computer Society. Also available at http://cobweb.ecn.purdue.edu/~dcsl/Publications/papers/scidive_dsn04_submit.pdf.