Embed Size (px)
Citation preview
Introduction to Operations Management 1
Quality Assurance
(Quality Control)
Introduction to Operations Management 2
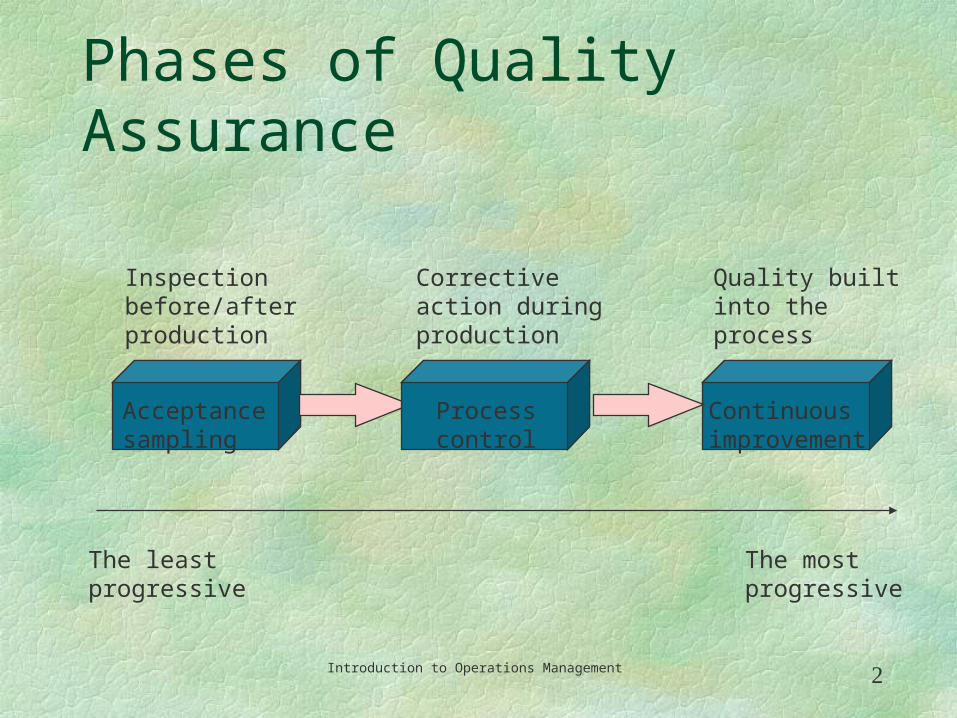
Phases of Quality Assurance
Acceptancesampling
Processcontrol
Continuousimprovement
Inspectionbefore/afterproduction
Correctiveaction duringproduction
Quality builtinto theprocess
The leastprogressive
The mostprogressive
Introduction to Operations Management 3
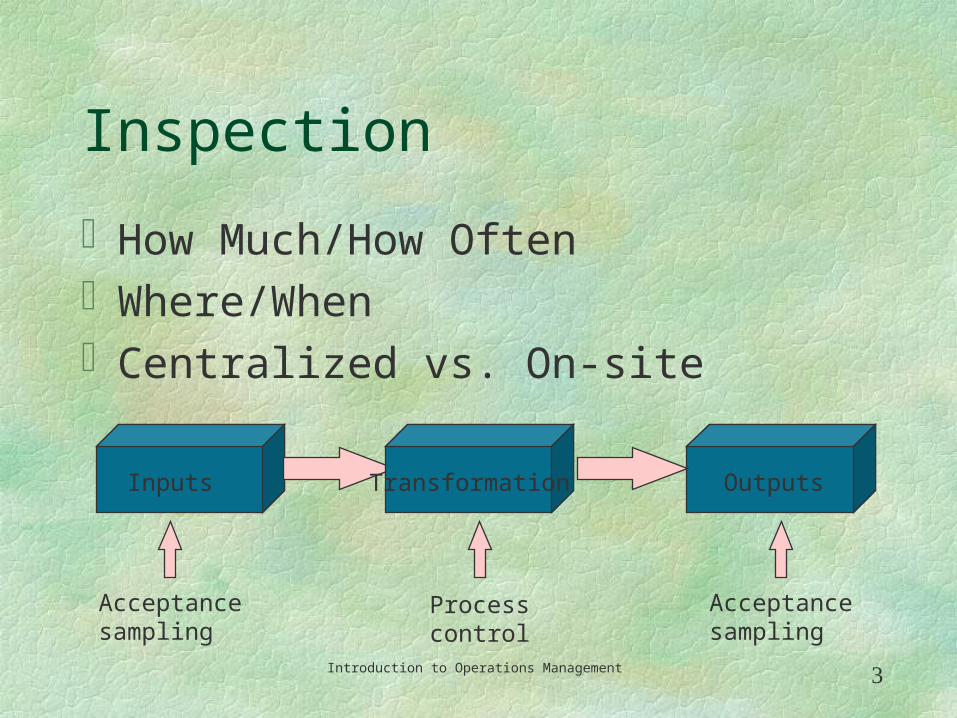
Inspection
How Much/How OftenWhere/When Centralized vs. On-site
Inputs Transformation Outputs
Acceptancesampling
Processcontrol
Acceptancesampling
Introduction to Operations Management 4
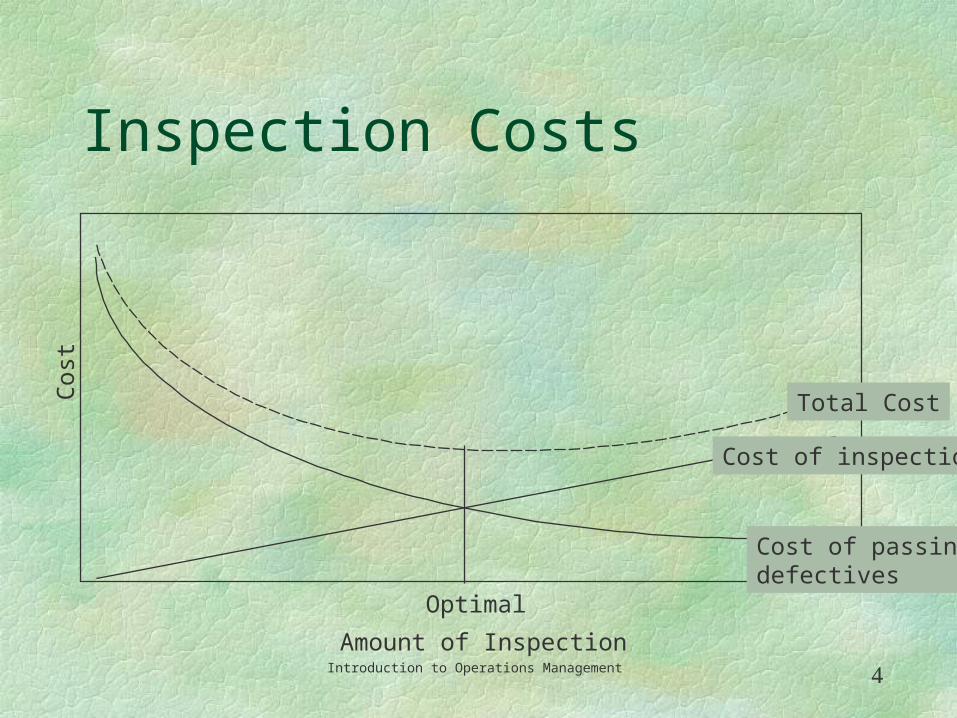
Inspection Costs
Optimal
Cos
t
Amount of Inspection
Cost of inspection
Cost of passingdefectives
Total Cost

Introduction to Operations Management 5
Where to Inspect in the Process
Raw materials and purchased partsFinished productsBefore a costly operationBefore an irreversible processBefore a covering process
Introduction to Operations Management 6
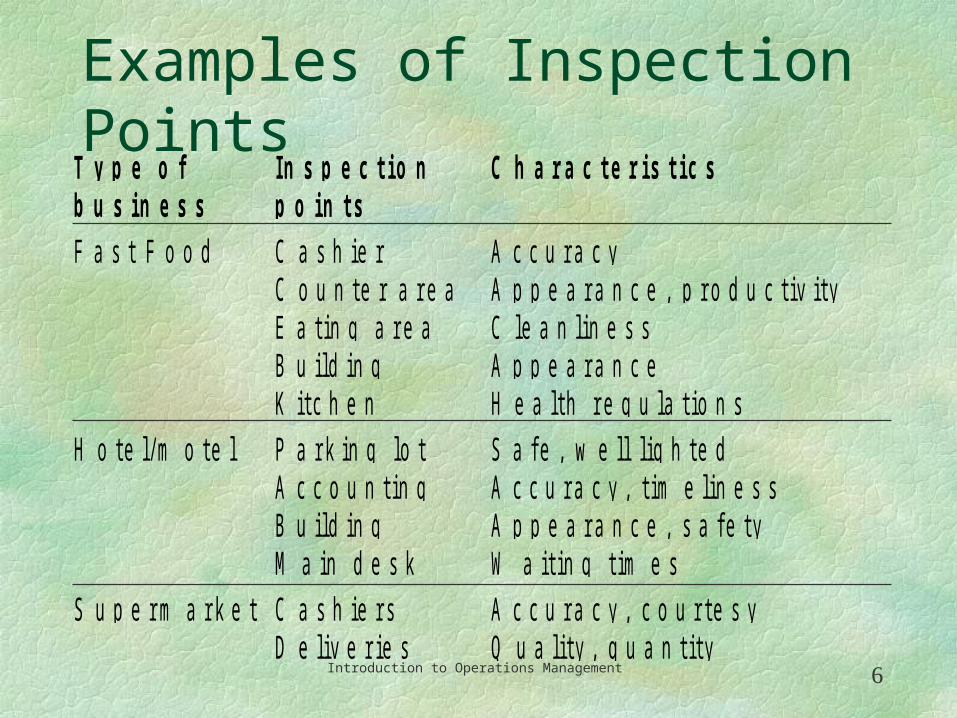
Examples of Inspection PointsT y p e o fb u s i n e s s
I n s p e c t i o np o i n t s
C h a r a c t e r i s t i c s
F a s t F o o d C a s h i e rC o u n t e r a r e aE a t i n g a r e aB u i l d i n gK i t c h e n
A c c u r a c yA p p e a r a n c e , p r o d u c t i v i t yC l e a n l i n e s sA p p e a r a n c eH e a l t h r e g u l a t i o n s
H o t e l / m o t e l P a r k i n g l o tA c c o u n t i n gB u i l d i n gM a i n d e s k
S a f e , w e l l l i g h t e dA c c u r a c y , t i m e l i n e s sA p p e a r a n c e , s a f e t yW a i t i n g t i m e s
S u p e r m a r k e t C a s h i e r sD e l i v e r i e s
A c c u r a c y , c o u r t e s yQ u a l i t y , q u a n t i t y
Introduction to Operations Management 7
Statistical Process Control
The Control Process Define Measure Compare to a standard Evaluate Take corrective action Evaluate corrective action
Introduction to Operations Management 8
Statistical Process Control
Variations and Control Random variation: Natural variations in the out
put of process, created by countless minor factors
Assignable variation: A variation whose source can be identified
Introduction to Operations Management 9
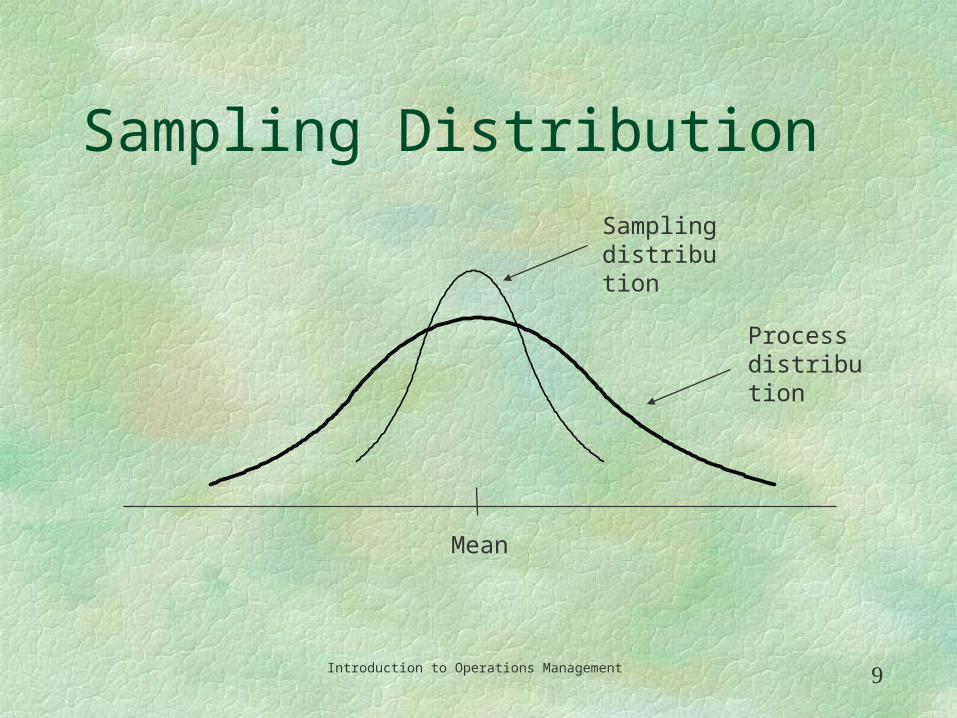
Sampling Distribution
Samplingdistribution
Processdistribution
Mean
Introduction to Operations Management 10
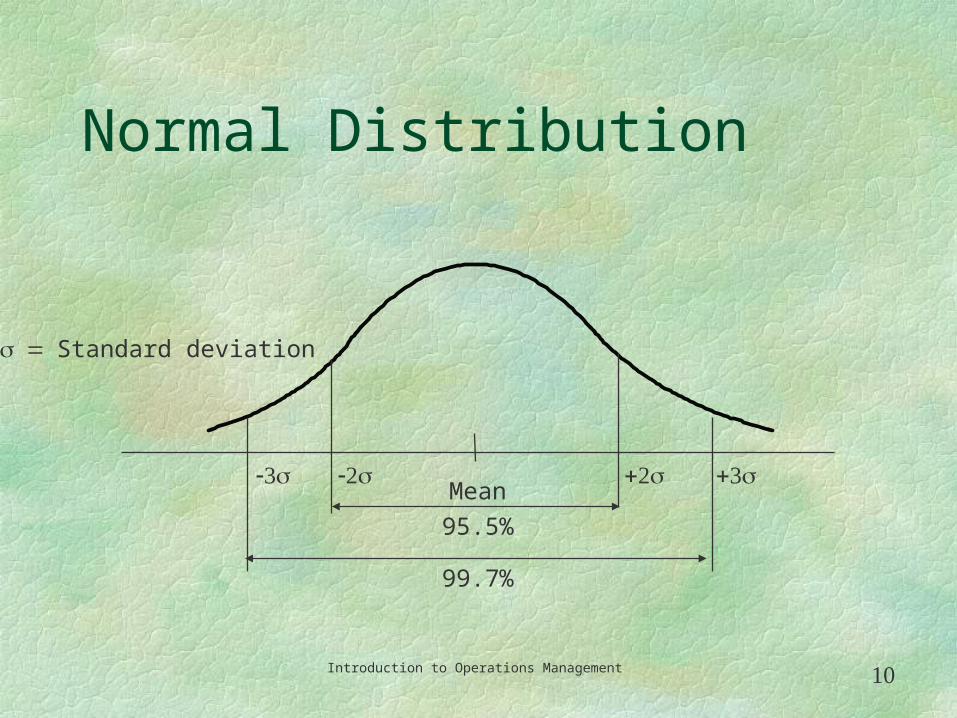
Normal Distribution
Mean3 2 2 3
95.5%
99.7%
Standard deviation
Introduction to Operations Management 11
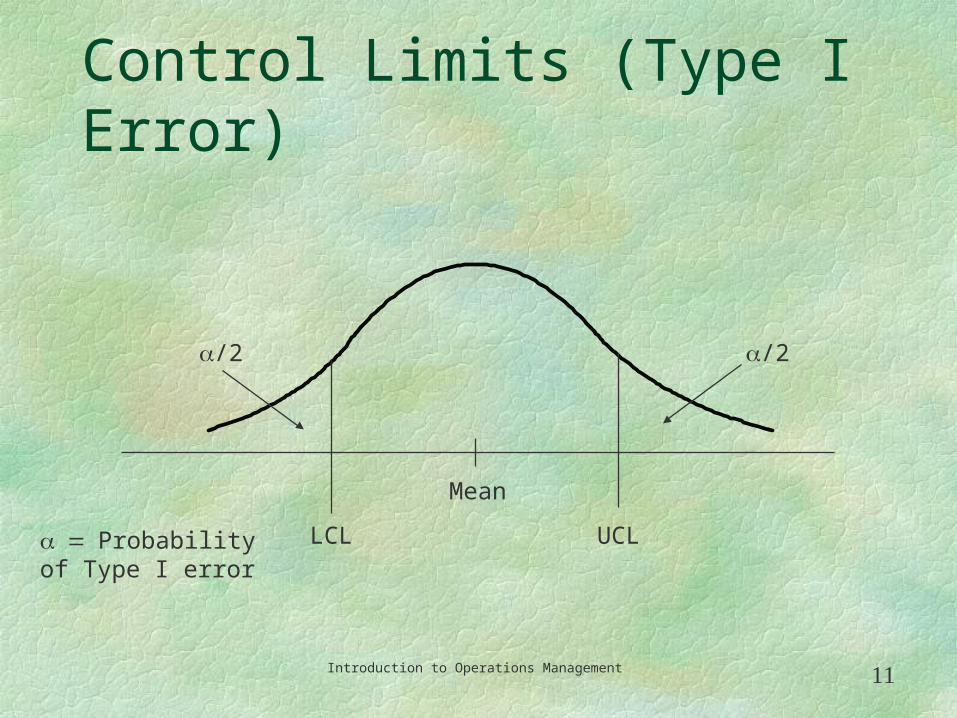
Control Limits (Type I Error)
Mean
LCL UCL
/2 /2
Probabilityof Type I error

Introduction to Operations Management 12
Control LimitsSamplingdistribution
Processdistribution
Mean
Lowercontrol
limit
Uppercontrol
limit
Introduction to Operations Management 13
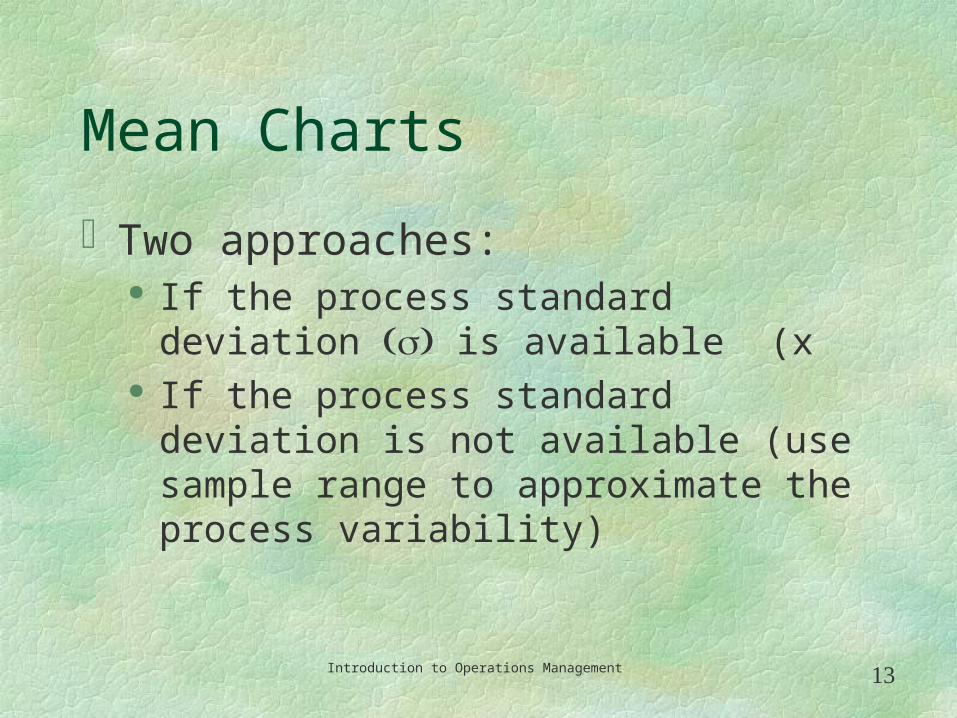
Mean Charts
Two approaches: If the process standard deviation is
available (x If the process standard deviation is not
available (use sample range to approximate the process variability)
Introduction to Operations Management 14
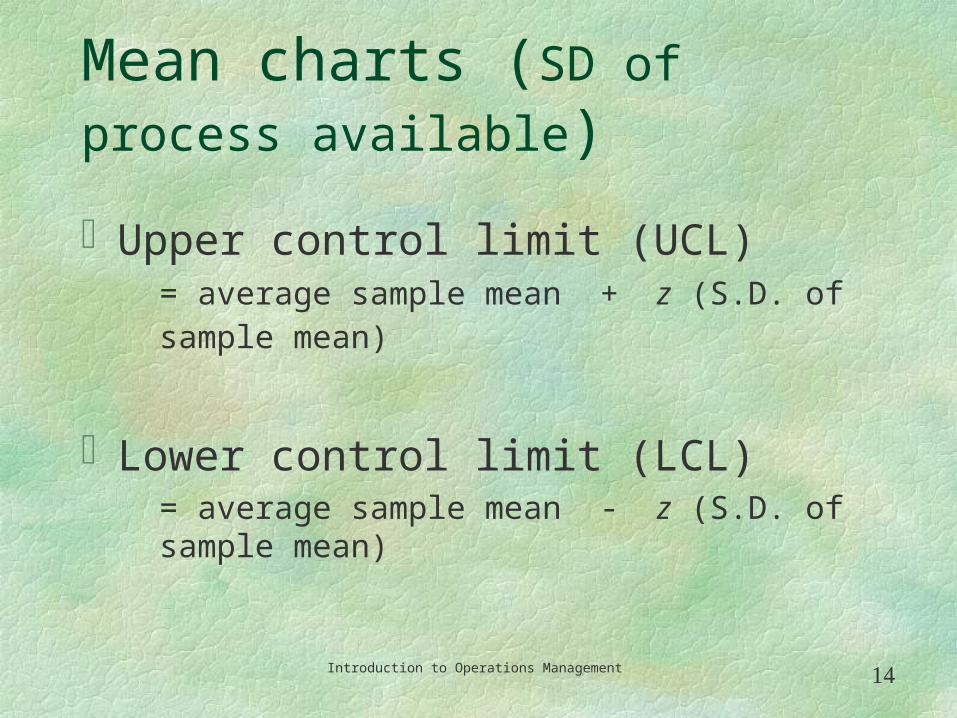
Mean charts (SD of process available)
Upper control limit (UCL) = average sample mean + z (S.D. of sample mean)
Lower control limit (LCL) = average sample mean - z (S.D. of sample mean)

Introduction to Operations Management 15
Mean charts (SD of process not
available)
UCL = average of sample mean + A2 (average of sample range)
LCL = average of sample mean - A2 (average of sample range)
A2 is a parameter depending on the sample size and is obtainable from table.
Introduction to Operations Management 16
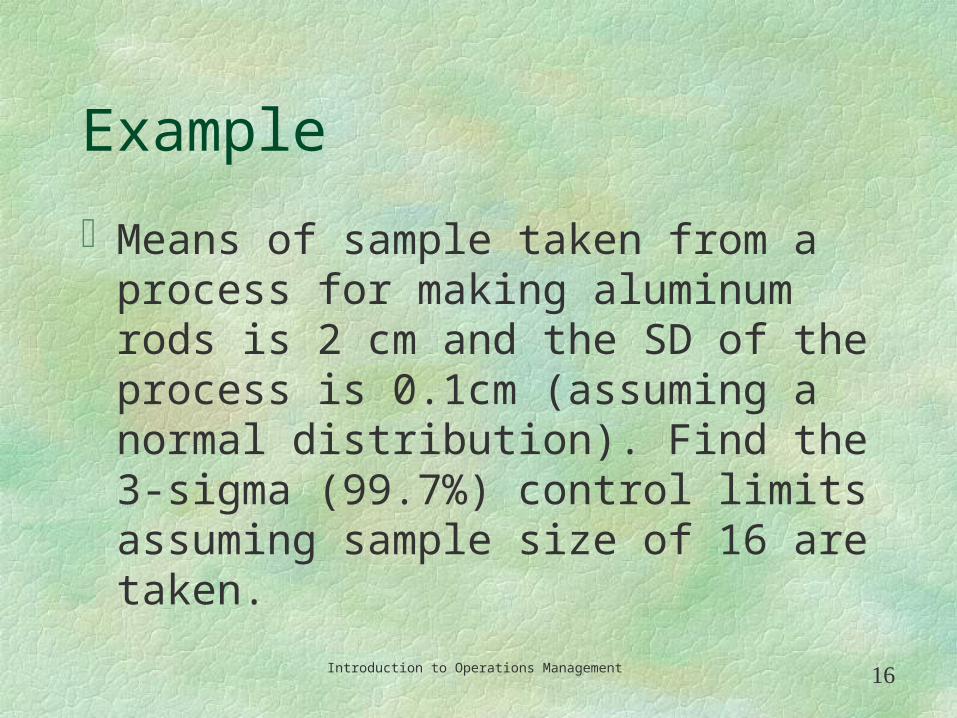
Example
Means of sample taken from a process for making aluminum rods is 2 cm and the SD of the process is 0.1cm (assuming a normal distribution). Find the 3-sigma (99.7%) control limits assuming sample size of 16 are taken.
Introduction to Operations Management 17
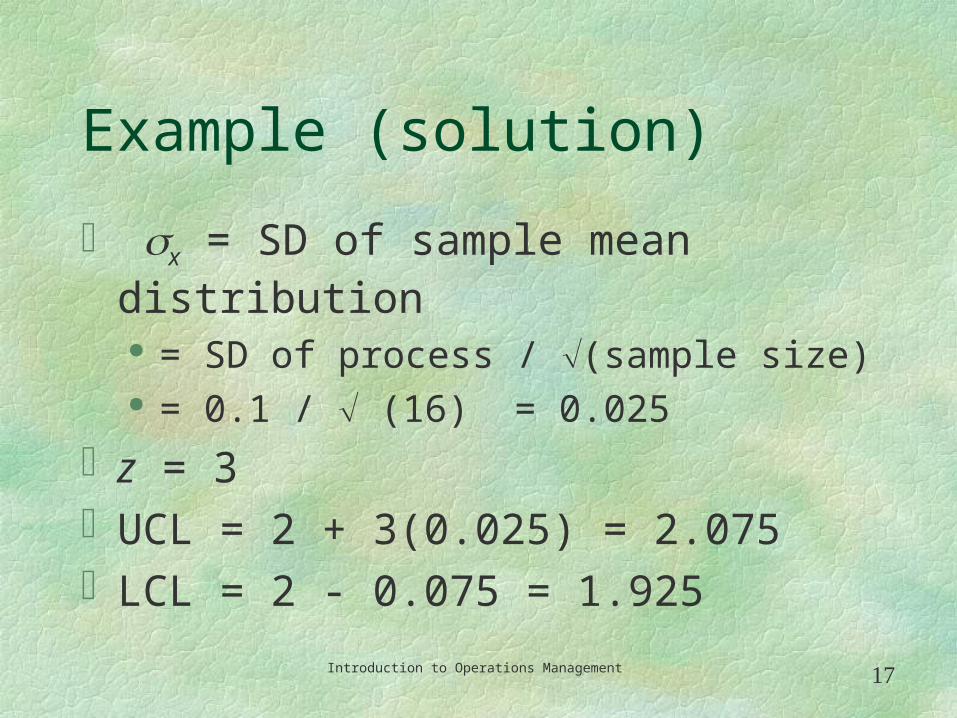
Example (solution)
x = SD of sample mean distribution = SD of process / (sample size) = 0.1 / (16) = 0.025
z = 3UCL = 2 + 3(0.025) = 2.075LCL = 2 - 0.075 = 1.925
Introduction to Operations Management 18
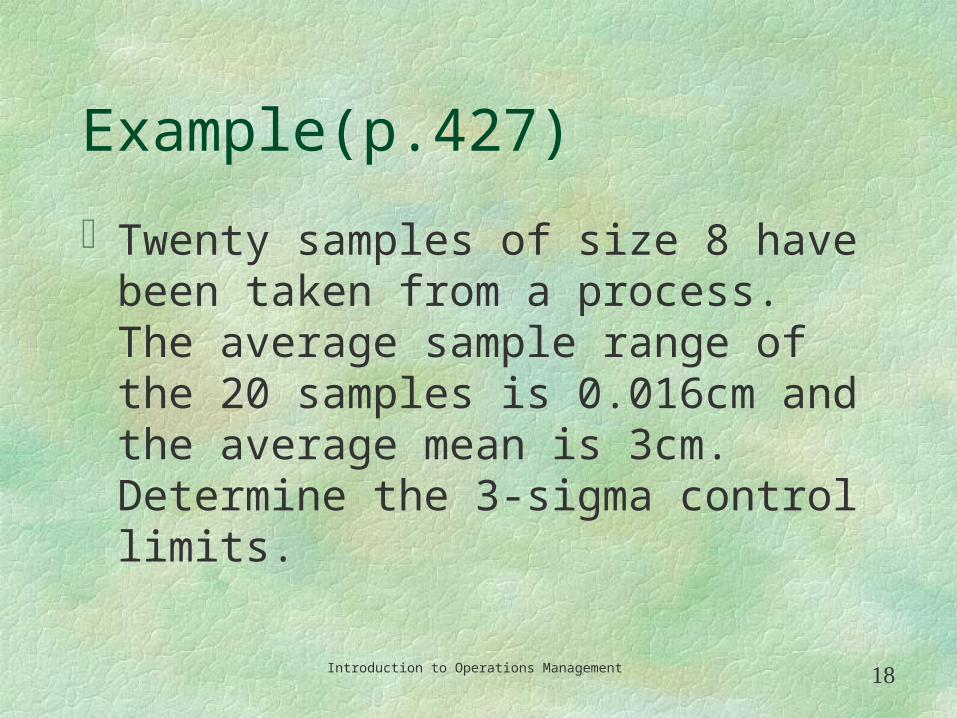
Example(p.427)
Twenty samples of size 8 have been taken from a process. The average sample range of the 20 samples is 0.016cm and the average mean is 3cm. Determine the 3-sigma control limits.
Introduction to Operations Management 19
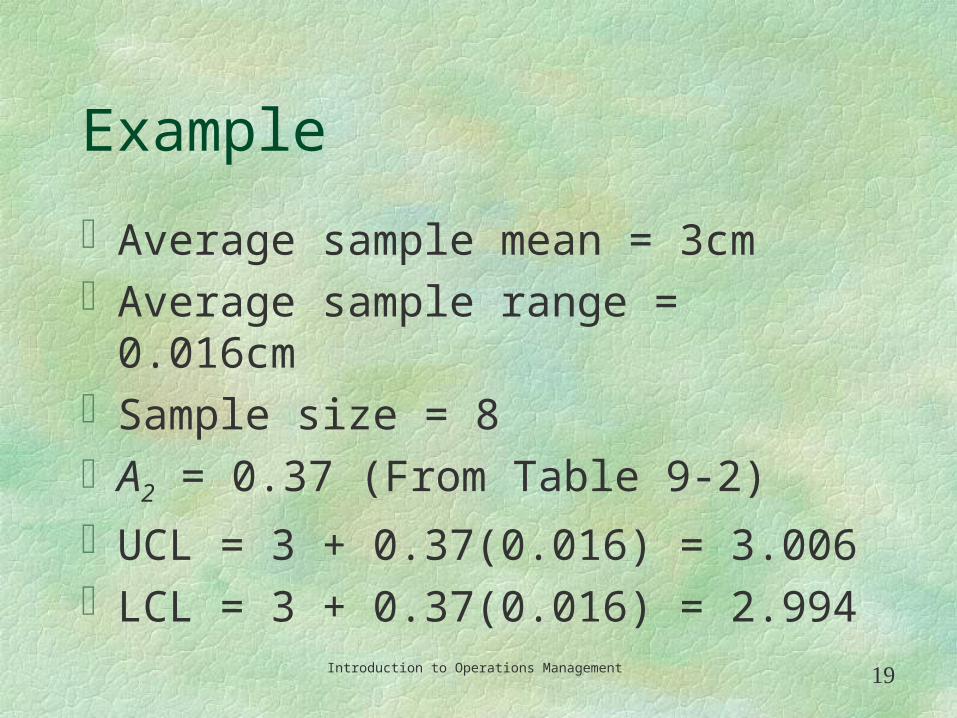
Example
Average sample mean = 3cmAverage sample range = 0.016cmSample size = 8A2 = 0.37 (From Table 9-2)
UCL = 3 + 0.37(0.016) = 3.006LCL = 3 + 0.37(0.016) = 2.994

Introduction to Operations Management 20
Control Chart
970
980
990
1000
1010
1020
0 1 2 3 4 5 6 7 8 9 10 11 12 13 14 15
UCL
LCL
Sample number
Mean
Out ofcontrol
Normal variationdue to chance
Abnormal variationdue to assignable sources
Abnormal variationdue to assignable sources

Introduction to Operations Management 21
Observations from Sample Distribution
Sample number
UCL
LCL
1 2 3 4
Introduction to Operations Management 22
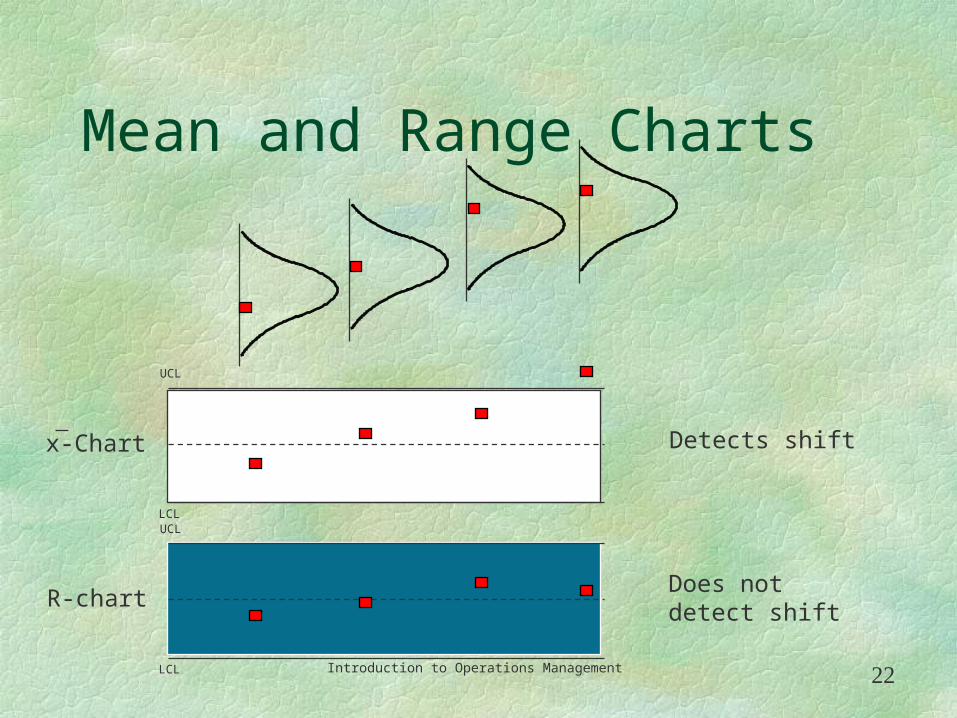
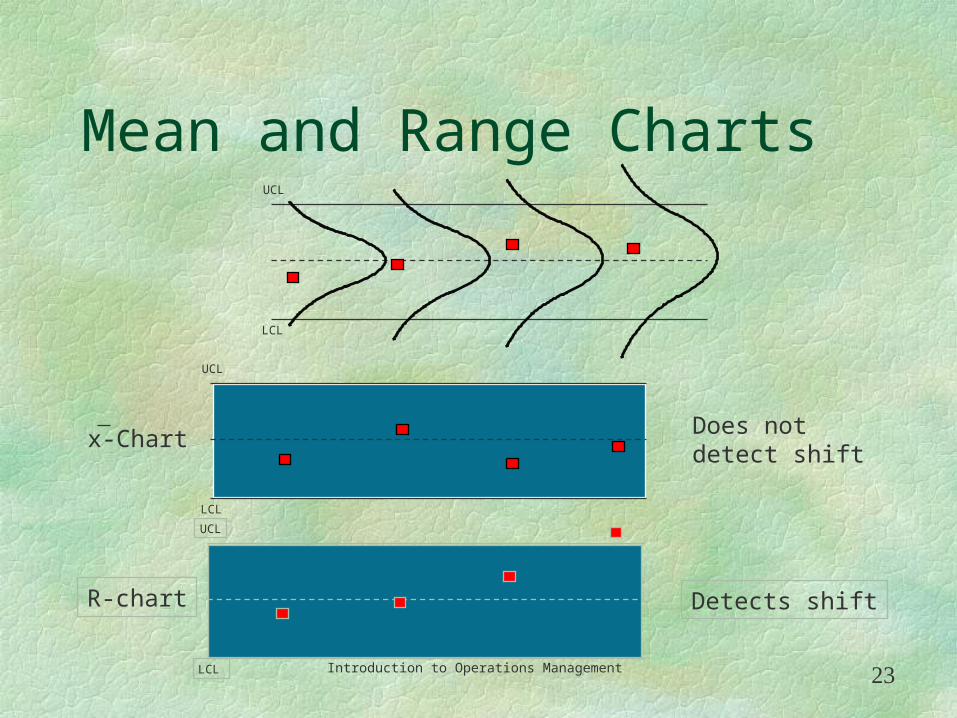
Mean and Range Charts
UCL
LCLUCL
LCL
R-chart
x-Chart Detects shift
Does notdetect shift
Introduction to Operations Management 23
Mean and Range ChartsUCL
LCL
UCL
LCL
x-Chart
UCL
LCL
R-chart Detects shift
Does notdetect shift

Introduction to Operations Management 24
Control Chart for Attributes
p-Chart - Control chart used to monitor the proportion of defectives in a process
c-Chart - Control chart used to monitor the number of defects per unit
Introduction to Operations Management 25
Use of p-ChartsWhen observations can be placed into two
categories. Good or bad Pass or fail Operate or do not operate
When the data consists of multiple samples of several observations each
Introduction to Operations Management 26
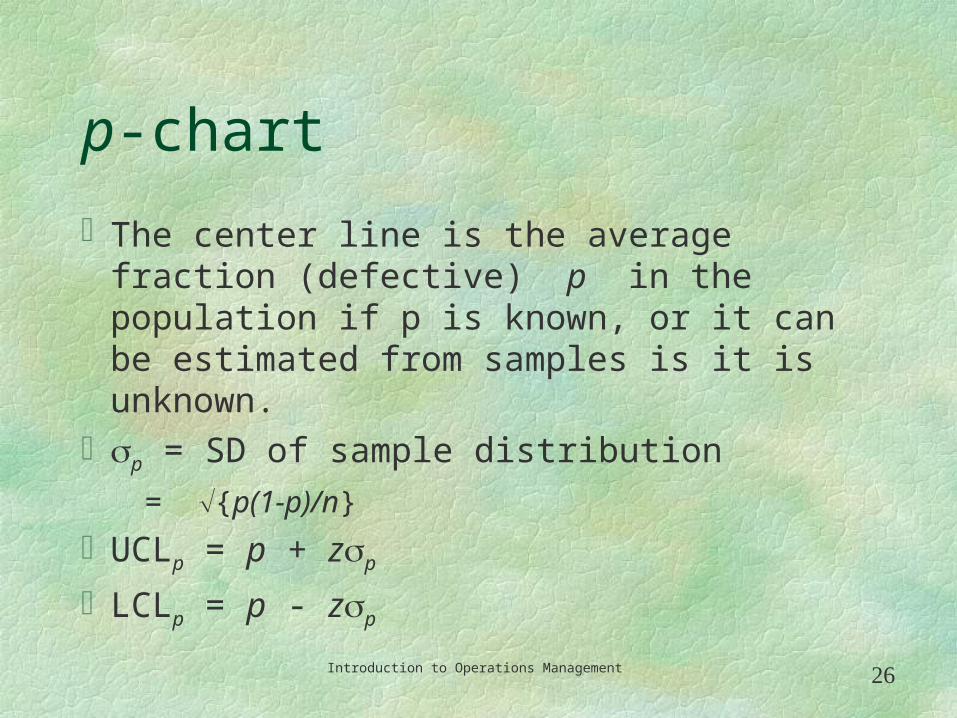
p-chart
The center line is the average fraction (defective) p in the population if p is known, or it can be estimated from samples is it is unknown.
p = SD of sample distribution = {p(1-p)/n}
UCLp = p + zp LCLp = p - zp
Introduction to Operations Management 27
Example (p.431)
The following table indicates the defective items in 20 samples, each of size 100. Construct a control chart that will describe 95.5% of the chance variations of the process
Introduction to Operations Management 28
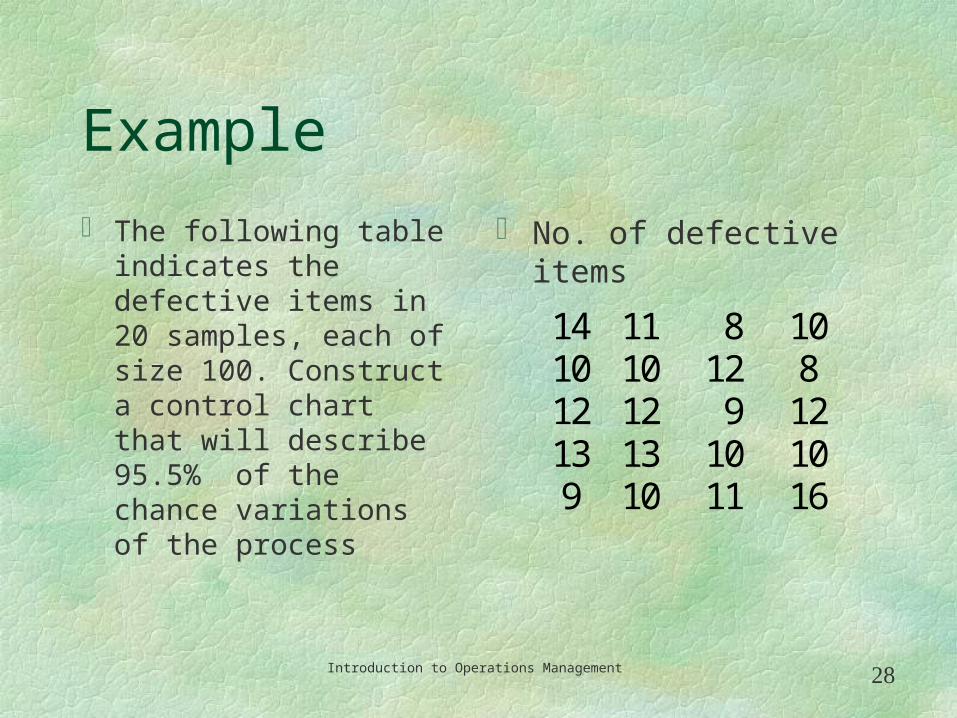
Example
The following table indicates the defective items in 20 samples, each of size 100. Construct a control chart that will describe 95.5% of the chance variations of the process
No. of defective items
14 11 8 1010 10 12 812 12 9 1213 13 10 10 9 10 11 16
11
Introduction to Operations Management 29
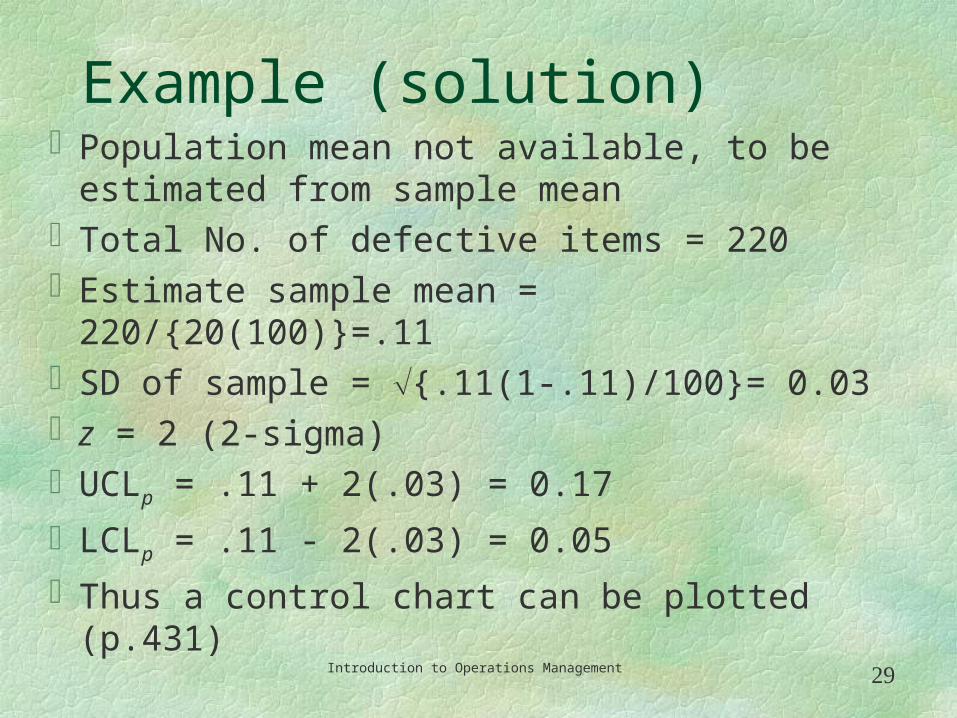
Example (solution)Population mean not available, to be estimated
from sample meanTotal No. of defective items = 220Estimate sample mean = 220/{20(100)}=.11SD of sample = {.11(1-.11)/100}= 0.03z = 2 (2-sigma)UCLp = .11 + 2(.03) = 0.17
LCLp = .11 - 2(.03) = 0.05
Thus a control chart can be plotted (p.431)
Introduction to Operations Management 30
Use of c-ChartsUse only when the number of occurrences per
unit of measure can be counted; nonoccurrences cannot be counted. Scratches, chips, dents, or errors per item Cracks or faults per unit of distance Calls, complaints, failures per unit of time
Introduction to Operations Management 31
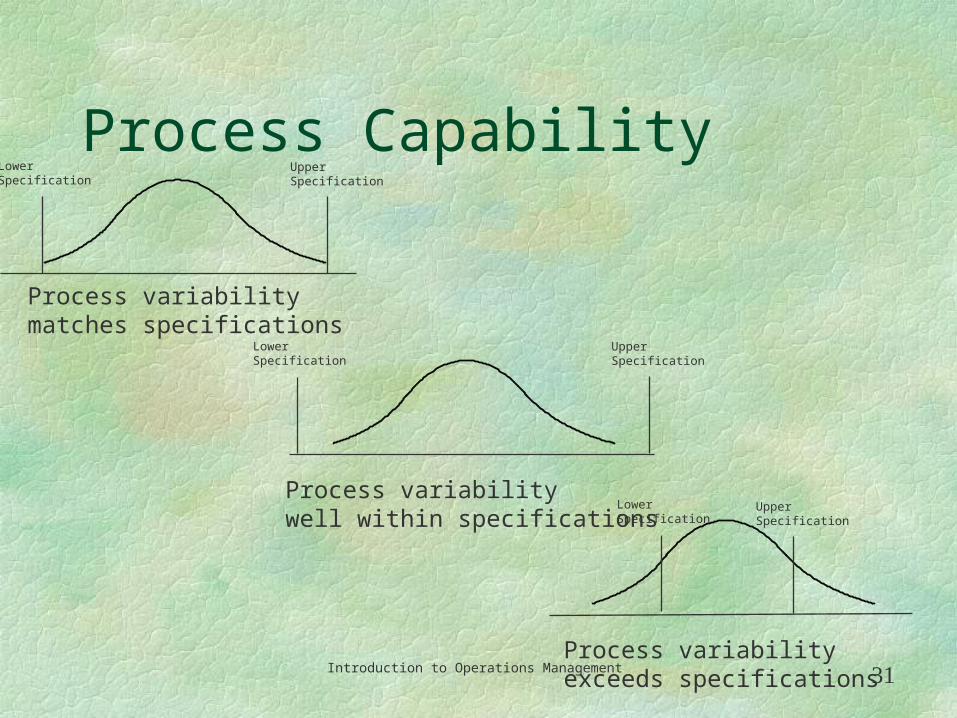
Process CapabilityLowerSpecification
UpperSpecification
Process variabilitymatches specifications
LowerSpecification
UpperSpecification
Process variabilitywell within specifications
LowerSpecification
UpperSpecification
Process variabilityexceeds specifications


![QUALITY ASSURANCE PROGRAM MANUAL · Quality Assurance Program Requirements (Operations) 19 G. Regulatory Guide 1.37 (Revision 0) [March 1973], ... control of quality related activities](https://img.dokumen.tips/doc/110x75/5ec70f11dd366960b61e5408/quality-assurance-program-manual-quality-assurance-program-requirements-operations.jpg)