Embed Size (px)
Citation preview
© 2012 Cisco and/or its affiliates. All rights reserved. This document is Cisco Public. Page 1 of 1
White Paper
Introduction to Cisco IOS® NetFlow
Last updated: May 2012
Successfully delivering mission critical, performance sensitive services and applications with NetFlow
NetFlow is an embedded instrumentation within Cisco IOS Software to characterize network operation. Visibility
into the network is an indispensable tool for IT professionals. In response to new requirements and pressures,
network operators are finding it critical to understand how the network is behaving including:
● Application and network usage
● Network productivity and utilization of network resources
● The impact of changes to the network
● Network anomaly and security vulnerabilities
● Long term compliance issues
Cisco IOS NetFlow fulfills those needs, creating an environment where administrators have the tools to
understand who, what, when, where, and how network traffic is flowing. When the network behavior is understood,
business process will improve and an audit trail of how the network is utilized is available. This increased
awareness reduces vulnerability of the network as related to outage and allows efficient operation of the network.
Improvements in network operation lower costs and drives higher business revenues by better utilization of the
network infrastructure.
Enterprises depend heavily on Cisco IOS NetFlow in order to meet their business objectives including Cisco IT:
“As converged networks and IP telephony become more prevalent, the ability to characterize traffic on the
network, both for capacity planning and anomaly detection, will become even more critical.” Roland Dobbins,
Cisco IT Network Engineer.
Read more information on how Cisco IT uses NetFlow:
● NetFlow gives Network Managers a Detailed View of Application Flows on the Network
http://www.cisco.com/en/US/prod/collateral/iosswrel/ps6537/ps6555/ps6601/prod_case_study0900aecd80
311fc2.pdf
This white paper illustrates the importance of NetFlow and demonstrates how NetFlow can be used by
Enterprises, Small and Medium-sized Businesses (SMBs), and Channel Partners to meet critical network
challenges. It is a basic overview of how NetFlow works and produces data and reporting solutions.
© 2012 Cisco and/or its affiliates. All rights reserved. This document is Cisco Public. Page 2 of 16
Increasing Importance of Network Awareness
Traditional SNMP Performance Monitoring
Traditionally customers relied almost exclusively on Simple Network Management Protocol (SNMP) to monitor
bandwidth. Although SNMP facilitates capacity planning, it does little to characterize traffic applications and
patterns, essential for understanding how well the network supports the business. A more granular understanding
of how bandwidth is being used is extremely important in IP networks today. Packet and byte interface counters
are useful but understanding which IP addresses are the source and destination of traffic and which applications
are generating the traffic is invaluable.
NetFlow Based Network Awareness
The ability to characterize IP traffic and understand how and where it flows is critical for network availability,
performance and troubleshooting. Monitoring IP traffic flows facilitates more accurate capacity planning and
ensures that resources are used appropriately in support of organizational goals. It helps IT determine where to
apply Quality of Service (QoS), optimize resource usage and it plays a vital role in network security to detect
Denial-of-Service (DoS) attacks, network-propagated worms, and other undesirable network events.
NetFlow facilitates solutions to many common problems encountered by IT professionals.
● Analyze new applications and their network impact
Identify new application network loads such as VoIP or remote site additions.
● Reduction in peak WAN traffic
Use NetFlow statistics to measure WAN traffic improvement from application-policy changes; understand
who is utilizing the network and the network top talkers.
● Troubleshooting and understanding network pain points
Diagnose slow network performance, bandwidth hogs and bandwidth utilization quickly with command line
interface or reporting tools.
● Detection of unauthorized WAN traffic
Avoid costly upgrades by identifying the applications causing congestion.
● Security and anomaly detection
NetFlow can be used for anomaly detection and worm diagnosis along with applications such as Cisco
CS-Mars.
● Validation of QoS parameters
Confirm that appropriate bandwidth has been allocated to each Class of Service (CoS) and that no CoS is
over- or under-subscribed.
© 2012 Cisco and/or its affiliates. All rights reserved. This document is Cisco Public. Page 3 of 16
How does NetFlow give you network information?
What is an IP Flow?
Each packet that is forwarded within a router or switch is examined for a set of IP packet attributes. These
attributes are the IP packet identity or fingerprint of the packet and determine if the packet is unique or similar to
other packets.
Traditionally, an IP Flow is based on a set of 5 and up to 7 IP packet attributes.
IP Packet attributes used by NetFlow:
● IP source address
● IP destination address
● Source port
● Destination port
● Layer 3 protocol type
● Class of Service
● Router or switch interface
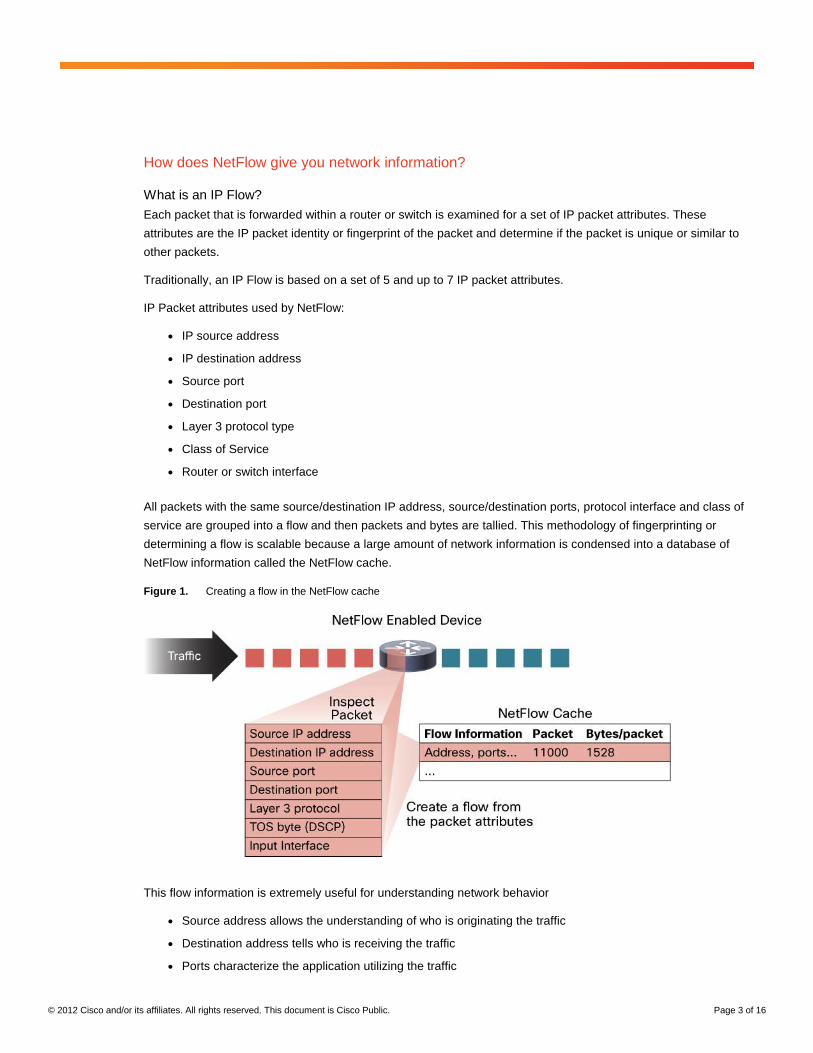
All packets with the same source/destination IP address, source/destination ports, protocol interface and class of
service are grouped into a flow and then packets and bytes are tallied. This methodology of fingerprinting or
determining a flow is scalable because a large amount of network information is condensed into a database of
NetFlow information called the NetFlow cache.
Figure 1. Creating a flow in the NetFlow cache
This flow information is extremely useful for understanding network behavior
● Source address allows the understanding of who is originating the traffic
● Destination address tells who is receiving the traffic
● Ports characterize the application utilizing the traffic
© 2012 Cisco and/or its affiliates. All rights reserved. This document is Cisco Public. Page 4 of 16
● Class of service examines the priority of the traffic
● The device interface tells how traffic is being utilized by the network device
● Tallied packets and bytes show the amount of traffic
Additional information added to a flow includes
● Flow timestamps to understand the life of a flow; timestamps are useful for calculating packets and bytes
per second
● Next hop IP addresses including BGP routing Autonomous Systems (AS)
● Subnet mask for the source and destination addresses to calculate prefixes
● TCP flags to examine TCP handshakes
How to Access the Data Produced by NetFlow?
There are two primary methods to access NetFlow data: the Command Line Interface (CLI) with show commands
or utilizing an application reporting tool. If you are interested in an immediate view of what is happening in your
network, the CLI can be used. NetFlow CLI is very useful for troubleshooting.
The other choice is to export NetFlow to a reporting server or what is called the “NetFlow collector”. The NetFlow
collector has the job of assembling and understanding the exported flows and combining or aggregating them to
produce the valuable reports used for traffic and security analysis. NetFlow export, unlike SNMP polling, pushes
information periodically to the NetFlow reporting collector. In general, the NetFlow cache is constantly filling with
flows and software in the router or switch is searching the cache for flows that have terminated or expired and
these flows are exported to the NetFlow collector server. Flows are terminated when the network communication
has ended (ie: a packet contains the TCP FIN flag). The following steps are used to implement NetFlow data
reporting:
● NetFlow is configured to capture flows to the NetFlow cache
● NetFlow export is configured to send flows to the collector
● The NetFlow cache is searched for flows that have terminated and these are exported to the NetFlow
collector server
● Approximately 30 to 50 flows are bundled together and typically transported in UDP format to the NetFlow
collector server
● The NetFlow collector software creates real-time or historical reports from the data
How Does the Router or Switch Determine Which Flows to Export to the NetFlow Collector Server?
A flow is ready for export when it is inactive for a certain time (ie: no new packets received for the flow); or if the
flow is long lived (active) and lasts greater than the active timer (ie: long FTP download). Also, the flow is ready for
export when a TCP flag indicates the flow is terminated (i.e. FIN, RST flag). Their are timers to determine if a flow
is inactive or if a flow is long lived and the default for the inactive flow timer is 15 seconds and the active flow timer
is 30 minutes. All the timers for export are configurable but the defaults are used in most cases except on the
Cisco Catalyst 6500 Series Switch platform. The collector can combine flows and aggregate traffic. For example,
an FTP download that lasts longer than the active timer may be broken into multiple flows and the collector can
combine these flows showing total ftp traffic to a server at a specific time of day.
© 2012 Cisco and/or its affiliates. All rights reserved. This document is Cisco Public. Page 5 of 16
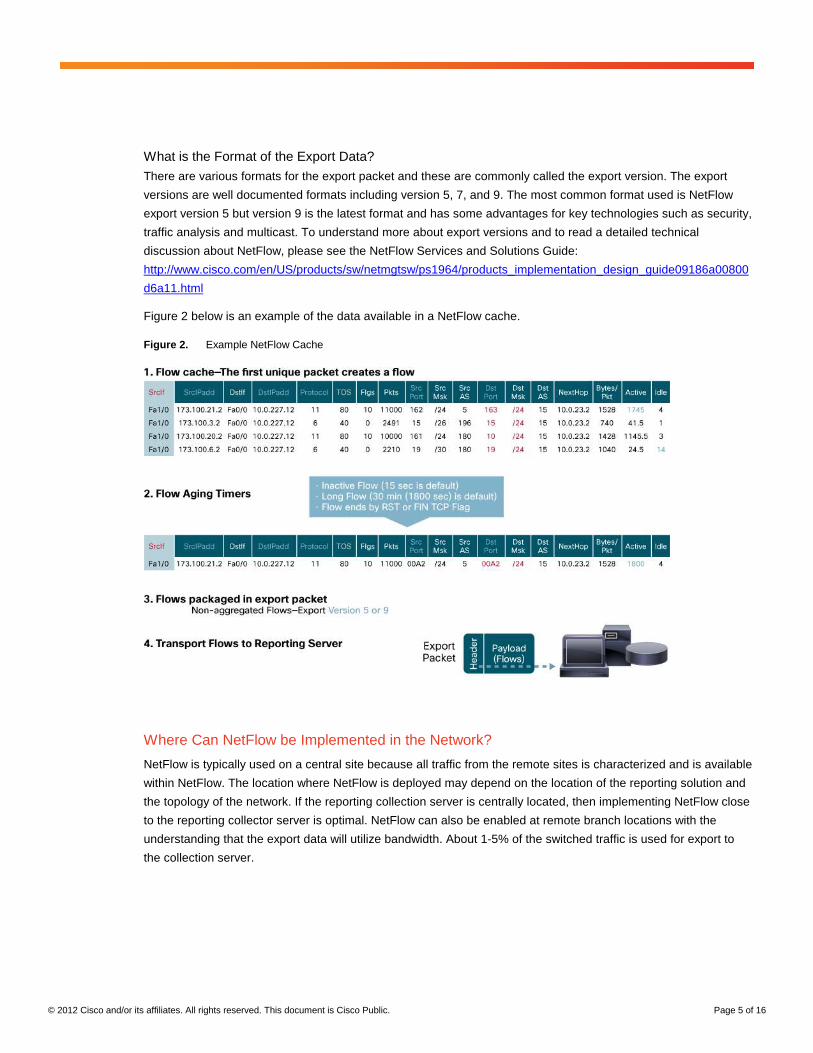
What is the Format of the Export Data?
There are various formats for the export packet and these are commonly called the export version. The export
versions are well documented formats including version 5, 7, and 9. The most common format used is NetFlow
export version 5 but version 9 is the latest format and has some advantages for key technologies such as security,
traffic analysis and multicast. To understand more about export versions and to read a detailed technical
discussion about NetFlow, please see the NetFlow Services and Solutions Guide:
http://www.cisco.com/en/US/products/sw/netmgtsw/ps1964/products_implementation_design_guide09186a00800
d6a11.html
Figure 2 below is an example of the data available in a NetFlow cache.
Figure 2. Example NetFlow Cache
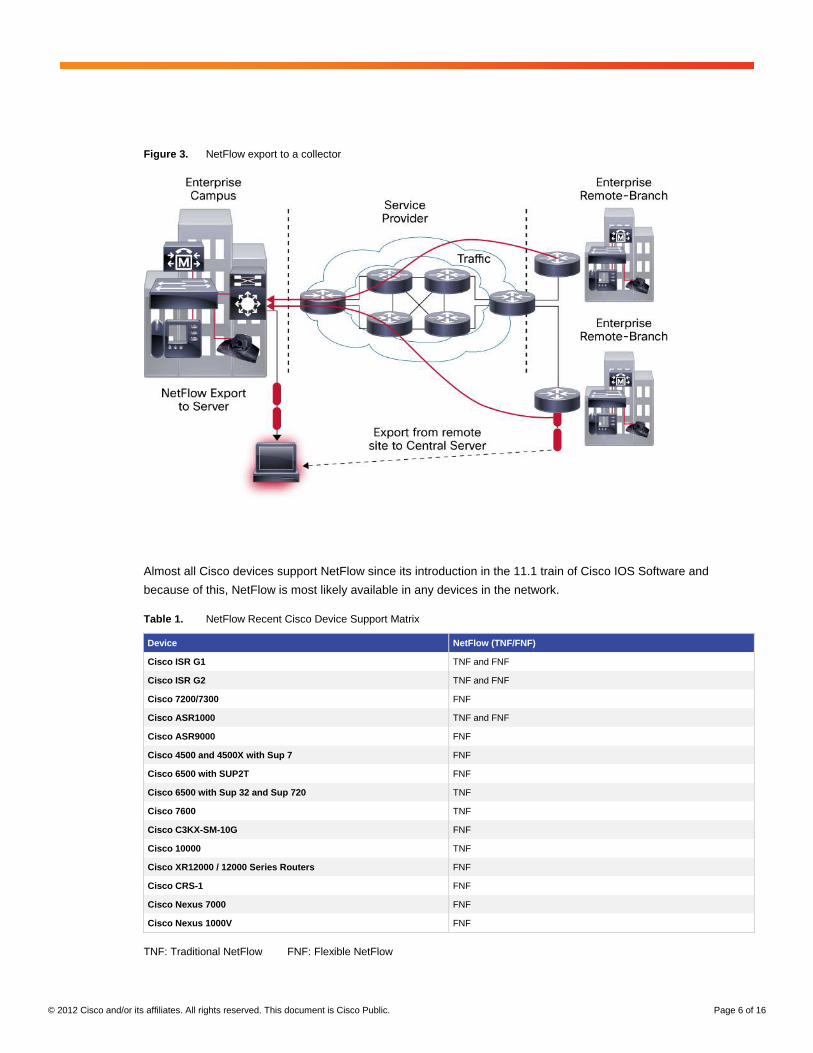
Where Can NetFlow be Implemented in the Network?
NetFlow is typically used on a central site because all traffic from the remote sites is characterized and is available
within NetFlow. The location where NetFlow is deployed may depend on the location of the reporting solution and
the topology of the network. If the reporting collection server is centrally located, then implementing NetFlow close
to the reporting collector server is optimal. NetFlow can also be enabled at remote branch locations with the
understanding that the export data will utilize bandwidth. About 1-5% of the switched traffic is used for export to
the collection server.
© 2012 Cisco and/or its affiliates. All rights reserved. This document is Cisco Public. Page 6 of 16
Figure 3. NetFlow export to a collector
Almost all Cisco devices support NetFlow since its introduction in the 11.1 train of Cisco IOS Software and
because of this, NetFlow is most likely available in any devices in the network.
Table 1. NetFlow Recent Cisco Device Support Matrix
Device NetFlow (TNF/FNF)
Cisco ISR G1 TNF and FNF
Cisco ISR G2 TNF and FNF
Cisco 7200/7300 FNF
Cisco ASR1000 TNF and FNF
Cisco ASR9000 FNF
Cisco 4500 and 4500X with Sup 7 FNF
Cisco 6500 with SUP2T FNF
Cisco 6500 with Sup 32 and Sup 720 TNF
Cisco 7600 TNF
Cisco C3KX-SM-10G FNF
Cisco 10000 TNF
Cisco XR12000 / 12000 Series Routers FNF
Cisco CRS-1 FNF
Cisco Nexus 7000 FNF
Cisco Nexus 1000V FNF
TNF: Traditional NetFlow FNF: Flexible NetFlow
© 2012 Cisco and/or its affiliates. All rights reserved. This document is Cisco Public. Page 7 of 16
Which Applications Report on NetFlow Data?
There are a large number of NetFlow collectors including Cisco, freeware and third party commercial vendors’
products that report and utilize NetFlow data. It is important to understand various factors when picking a partner
for NetFlow reporting.
● What will be the main uses for NetFlow? Security, capacity planning and traffic analysis including
application and user monitoring?
● Is real-time reporting or historical reporting more important?
● Which operating system is preferred for the server?
● Is this a large or small implementation of NetFlow and is scalability a concern?
● How much are you willing to pay for the product?
● Are there any current performance management products used in your organization and can these be
extended to support NetFlow?
Once the reporting application is chosen, the sizing of the server and number of servers are determined by talking
with the vendor for the product. Some reporting systems offer a two-tier architecture, where collectors are placed
near key sites in the network and they aggregate and forward the data to a main reporting server. Other smaller
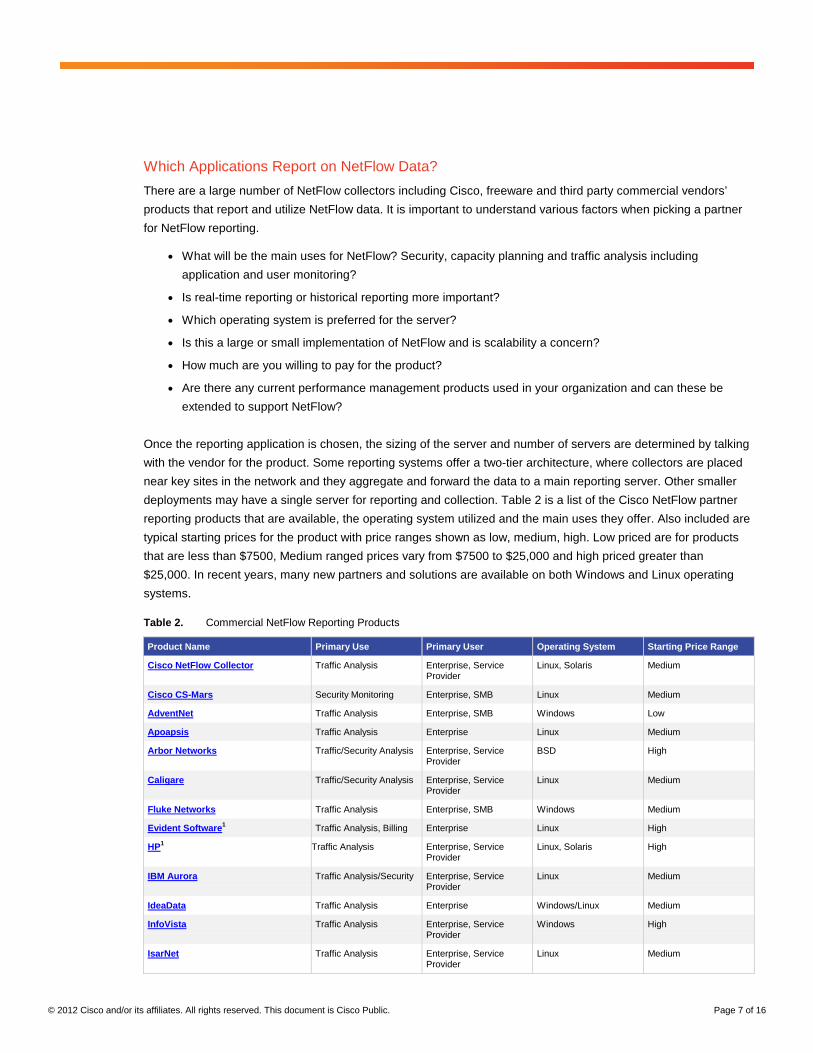
deployments may have a single server for reporting and collection. Table 2 is a list of the Cisco NetFlow partner
reporting products that are available, the operating system utilized and the main uses they offer. Also included are
typical starting prices for the product with price ranges shown as low, medium, high. Low priced are for products
that are less than $7500, Medium ranged prices vary from $7500 to $25,000 and high priced greater than
$25,000. In recent years, many new partners and solutions are available on both Windows and Linux operating
systems.
Table 2. Commercial NetFlow Reporting Products
Product Name Primary Use Primary User Operating System Starting Price Range
Cisco NetFlow Collector Traffic Analysis Enterprise, Service Provider
Linux, Solaris Medium
Cisco CS-Mars Security Monitoring Enterprise, SMB Linux Medium
AdventNet Traffic Analysis Enterprise, SMB Windows Low
Apoapsis Traffic Analysis Enterprise Linux Medium
Arbor Networks Traffic/Security Analysis Enterprise, Service Provider
BSD High
Caligare Traffic/Security Analysis Enterprise, Service Provider
Linux Medium
Fluke Networks Traffic Analysis Enterprise, SMB Windows Medium
Evident Software1 Traffic Analysis, Billing Enterprise Linux High
HP1 Traffic Analysis Enterprise, Service Provider
Linux, Solaris High
IBM Aurora Traffic Analysis/Security Enterprise, Service Provider
Linux Medium
IdeaData Traffic Analysis Enterprise Windows/Linux Medium
InfoVista Traffic Analysis Enterprise, Service Provider
Windows High
IsarNet Traffic Analysis Enterprise, Service Provider
Linux Medium
© 2012 Cisco and/or its affiliates. All rights reserved. This document is Cisco Public. Page 8 of 16
Product Name Primary Use Primary User Operating System Starting Price Range
Lancope Traffic/Security Analysis Enterprise, Service Provider
Linux High
Micromuse1 Traffic Analysis Enterprise, Service Provider
Solaris High
CA NetQoS Traffic/Security Analysis Enterprise Windows High
Plixer / Scrutinizer Traffic Analysis / Security Analysis / Billing
Enterprise / SMB/ Service Provider
Windows/Linux Medium
Valencia Systems Traffic Analysis Enterprise Windows High
Solarwinds Traffic Analysis Enterprise, SMB Windows Low
Wired City Traffic Analysis Enterprise Windows High
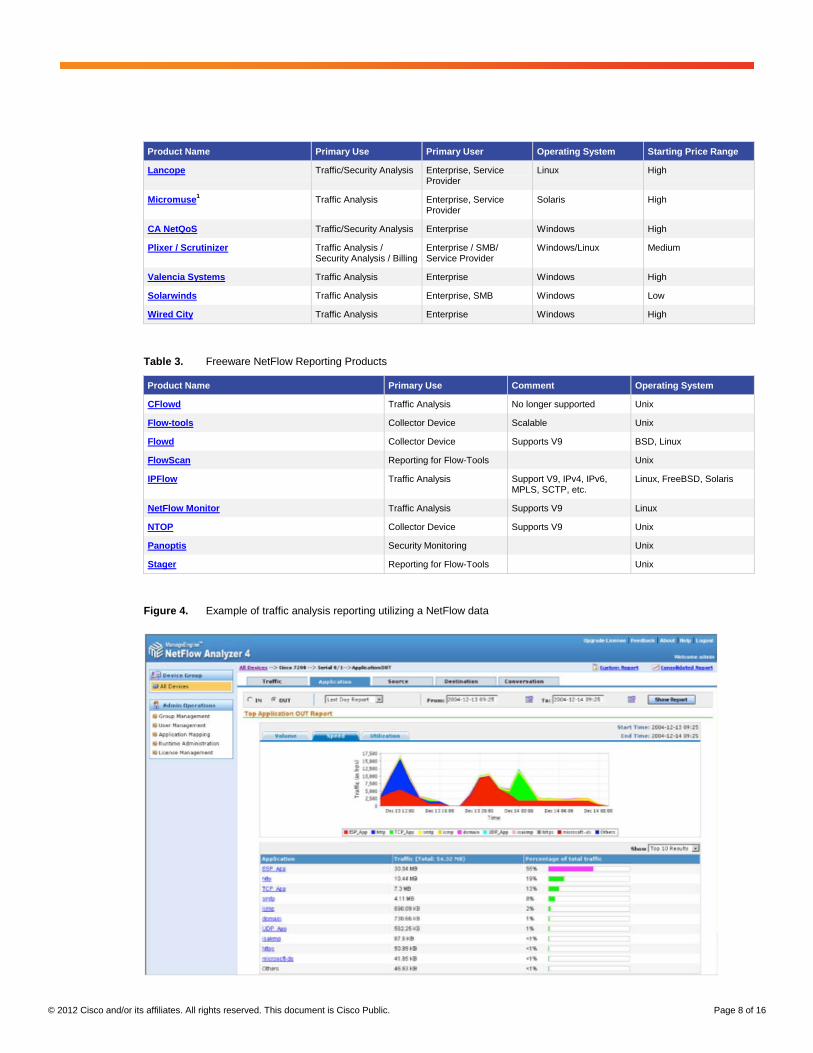
Table 3. Freeware NetFlow Reporting Products
Product Name Primary Use Comment Operating System
CFlowd Traffic Analysis No longer supported Unix
Flow-tools Collector Device Scalable Unix
Flowd Collector Device Supports V9 BSD, Linux
FlowScan Reporting for Flow-Tools Unix
IPFlow Traffic Analysis Support V9, IPv4, IPv6, MPLS, SCTP, etc.
Linux, FreeBSD, Solaris
NetFlow Monitor Traffic Analysis Supports V9 Linux
NTOP Collector Device Supports V9 Unix
Panoptis Security Monitoring Unix
Stager Reporting for Flow-Tools Unix
Figure 4. Example of traffic analysis reporting utilizing a NetFlow data
© 2012 Cisco and/or its affiliates. All rights reserved. This document is Cisco Public. Page 9 of 16
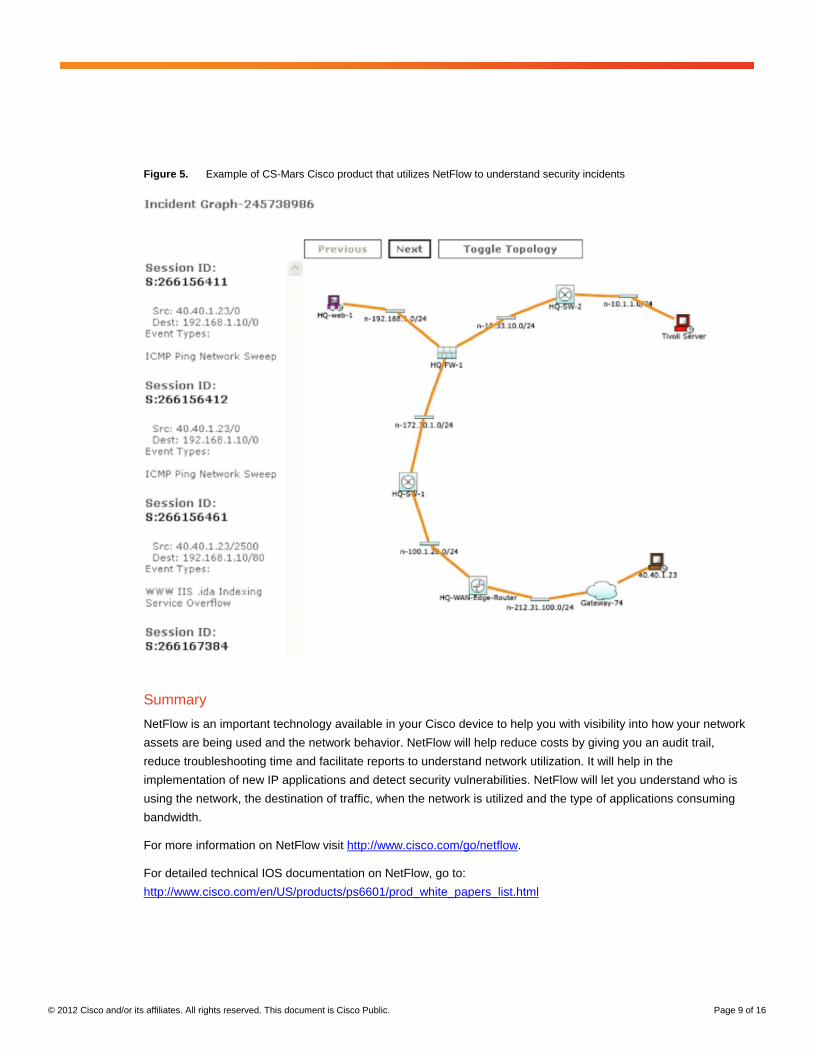
Figure 5. Example of CS-Mars Cisco product that utilizes NetFlow to understand security incidents
Summary
NetFlow is an important technology available in your Cisco device to help you with visibility into how your network
assets are being used and the network behavior. NetFlow will help reduce costs by giving you an audit trail,
reduce troubleshooting time and facilitate reports to understand network utilization. It will help in the
implementation of new IP applications and detect security vulnerabilities. NetFlow will let you understand who is
using the network, the destination of traffic, when the network is utilized and the type of applications consuming
bandwidth.
For more information on NetFlow visit http://www.cisco.com/go/netflow.
For detailed technical IOS documentation on NetFlow, go to:
http://www.cisco.com/en/US/products/ps6601/prod_white_papers_list.html
© 2012 Cisco and/or its affiliates. All rights reserved. This document is Cisco Public. Page 10 of 16
Appendix A: Software Platform Configuration
The following is an example of a basic router configuration for NetFlow. NetFlow basic functionality is very easy to
configure. NetFlow is configured on a per interface basis. When NetFlow is configured on the interface, IP packet
flow information will be captured into the NetFlow cache. Also, the NetFlow data can be configured to export the
NetFlow data to a collection server if a server is deployed.
1. Configuring the interface to capture flows into the NetFlow cache. CEF followed by NetFlow flow capture is
configured on the interface
Router(config)# ip cef
Router(config)# interface ethernet 1/0 .
Router(config-if)# ip flow ingress
Or
Router(config-if)# ip route-cache flow
Note: Either ip flow ingress or ip route-cache flow command can be used depending on the Cisco IOS Software
version. Ip flow ingress is available in Cisco IOS Software Release 12.2(15)T or above.
2. This step is required if exporting the NetFlow cache to a reporting server. The version or format of the
NetFlow export packet is chosen and then the destination IP address of the export server. The 9997 is the
UDP port the server will use to receive the UDP export from the Cisco device.
Router(config)# ip flow-export version 9
Router(config)# ip flow-export destination 172.22.23.7 9997
More Information on NetFlow Configuration is available at:
http://www.cisco.com/en/US/products/ps6601/prod_white_papers_list.html
Appendix B: Cisco Catalyst 6500 Series Switch Platform NetFlow Configuration
The following is an example of NetFlow on a Cisco Catalyst 6500 Series Switch. The Cisco Catalyst 6500 Series
Switch has two aspects of NetFlow configuration, configuration of hardware based NetFlow and software NetFlow.
Almost all flows on the Cisco Catalyst 6500 Series Switch are hardware switched and the MLS commands are
used to characterize NetFlow in hardware. The MSFC (software based NetFlow) will characterize software based
flows for packets that are punted up to the MSFC. Figure 8 shows the concept of two paths for NetFlow packets,
the hardware and software paths and the configuration for each path. Normally on Cisco Catalyst 6500 Series
Switch both hardware and software based NetFlow is configured.
© 2012 Cisco and/or its affiliates. All rights reserved. This document is Cisco Public. Page 11 of 16
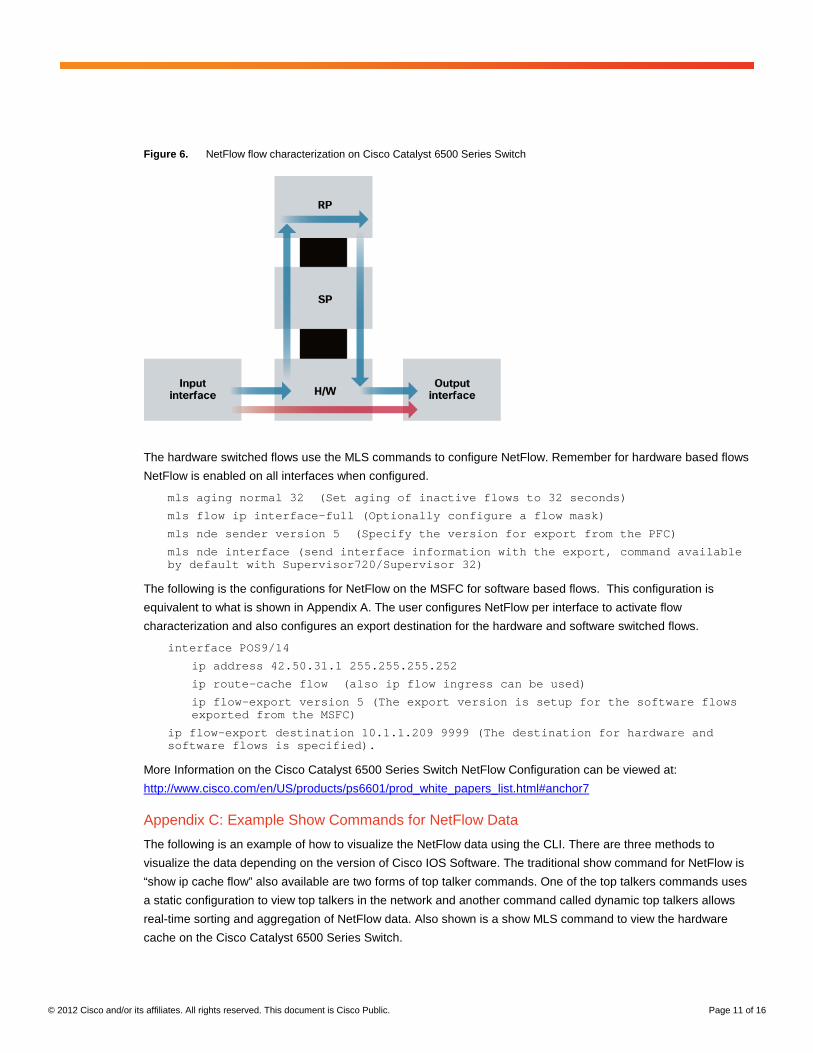
Figure 6. NetFlow flow characterization on Cisco Catalyst 6500 Series Switch
The hardware switched flows use the MLS commands to configure NetFlow. Remember for hardware based flows
NetFlow is enabled on all interfaces when configured.
mls aging normal 32 (Set aging of inactive flows to 32 seconds)
mls flow ip interface-full (Optionally configure a flow mask)
mls nde sender version 5 (Specify the version for export from the PFC)
mls nde interface (send interface information with the export, command available by default with Supervisor720/Supervisor 32)
The following is the configurations for NetFlow on the MSFC for software based flows. This configuration is
equivalent to what is shown in Appendix A. The user configures NetFlow per interface to activate flow
characterization and also configures an export destination for the hardware and software switched flows.
interface POS9/14
ip address 42.50.31.1 255.255.255.252
ip route-cache flow (also ip flow ingress can be used)
ip flow-export version 5 (The export version is setup for the software flows exported from the MSFC)
ip flow-export destination 10.1.1.209 9999 (The destination for hardware and software flows is specified).
More Information on the Cisco Catalyst 6500 Series Switch NetFlow Configuration can be viewed at:
http://www.cisco.com/en/US/products/ps6601/prod_white_papers_list.html#anchor7
Appendix C: Example Show Commands for NetFlow Data
The following is an example of how to visualize the NetFlow data using the CLI. There are three methods to
visualize the data depending on the version of Cisco IOS Software. The traditional show command for NetFlow is
“show ip cache flow” also available are two forms of top talker commands. One of the top talkers commands uses
a static configuration to view top talkers in the network and another command called dynamic top talkers allows
real-time sorting and aggregation of NetFlow data. Also shown is a show MLS command to view the hardware
cache on the Cisco Catalyst 6500 Series Switch.
© 2012 Cisco and/or its affiliates. All rights reserved. This document is Cisco Public. Page 12 of 16
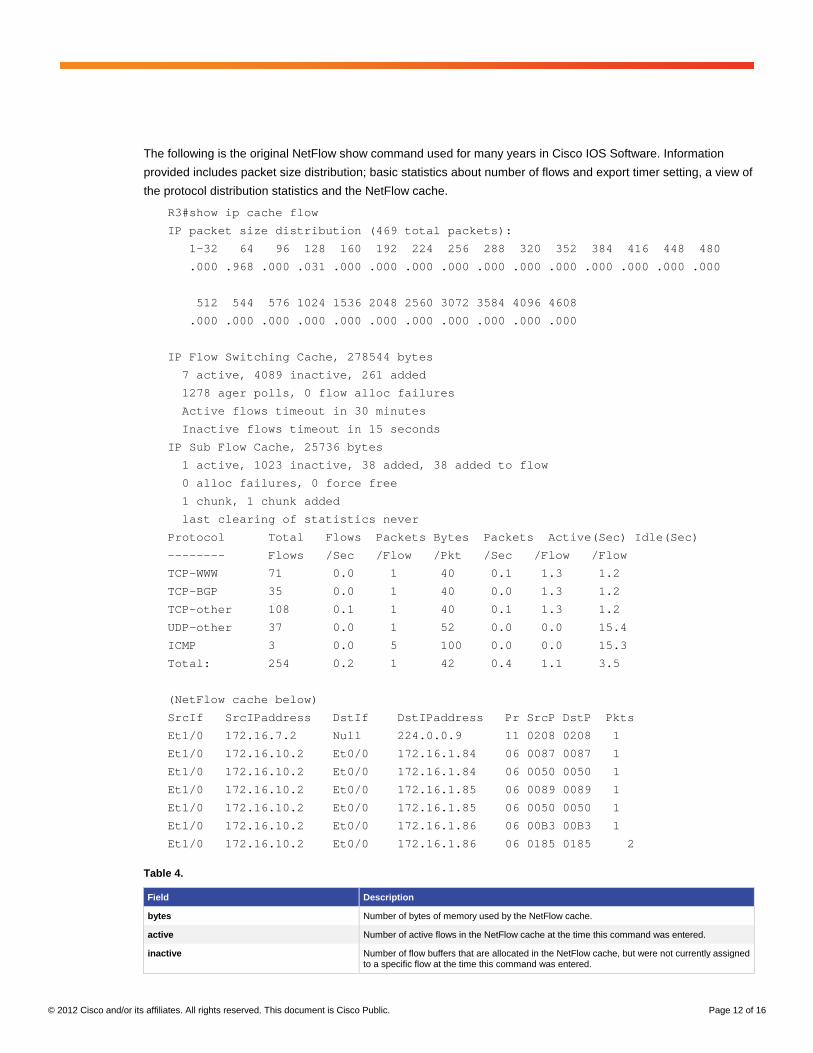
The following is the original NetFlow show command used for many years in Cisco IOS Software. Information
provided includes packet size distribution; basic statistics about number of flows and export timer setting, a view of
the protocol distribution statistics and the NetFlow cache.
R3#show ip cache flow
IP packet size distribution (469 total packets):
1-32 64 96 128 160 192 224 256 288 320 352 384 416 448 480
.000 .968 .000 .031 .000 .000 .000 .000 .000 .000 .000 .000 .000 .000 .000
512 544 576 1024 1536 2048 2560 3072 3584 4096 4608
.000 .000 .000 .000 .000 .000 .000 .000 .000 .000 .000
IP Flow Switching Cache, 278544 bytes
7 active, 4089 inactive, 261 added
1278 ager polls, 0 flow alloc failures
Active flows timeout in 30 minutes
Inactive flows timeout in 15 seconds
IP Sub Flow Cache, 25736 bytes
1 active, 1023 inactive, 38 added, 38 added to flow
0 alloc failures, 0 force free
1 chunk, 1 chunk added
last clearing of statistics never
Protocol Total Flows Packets Bytes Packets Active(Sec) Idle(Sec)
-------- Flows /Sec /Flow /Pkt /Sec /Flow /Flow
TCP-WWW 71 0.0 1 40 0.1 1.3 1.2
TCP-BGP 35 0.0 1 40 0.0 1.3 1.2
TCP-other 108 0.1 1 40 0.1 1.3 1.2
UDP-other 37 0.0 1 52 0.0 0.0 15.4
ICMP 3 0.0 5 100 0.0 0.0 15.3
Total: 254 0.2 1 42 0.4 1.1 3.5
(NetFlow cache below)
SrcIf SrcIPaddress DstIf DstIPaddress Pr SrcP DstP Pkts
Et1/0 172.16.7.2 Null 224.0.0.9 11 0208 0208 1
Et1/0 172.16.10.2 Et0/0 172.16.1.84 06 0087 0087 1
Et1/0 172.16.10.2 Et0/0 172.16.1.84 06 0050 0050 1
Et1/0 172.16.10.2 Et0/0 172.16.1.85 06 0089 0089 1
Et1/0 172.16.10.2 Et0/0 172.16.1.85 06 0050 0050 1
Et1/0 172.16.10.2 Et0/0 172.16.1.86 06 00B3 00B3 1
Et1/0 172.16.10.2 Et0/0 172.16.1.86 06 0185 0185 2
Table 4.
Field Description
bytes Number of bytes of memory used by the NetFlow cache.
active Number of active flows in the NetFlow cache at the time this command was entered.
inactive Number of flow buffers that are allocated in the NetFlow cache, but were not currently assigned to a specific flow at the time this command was entered.
© 2012 Cisco and/or its affiliates. All rights reserved. This document is Cisco Public. Page 13 of 16
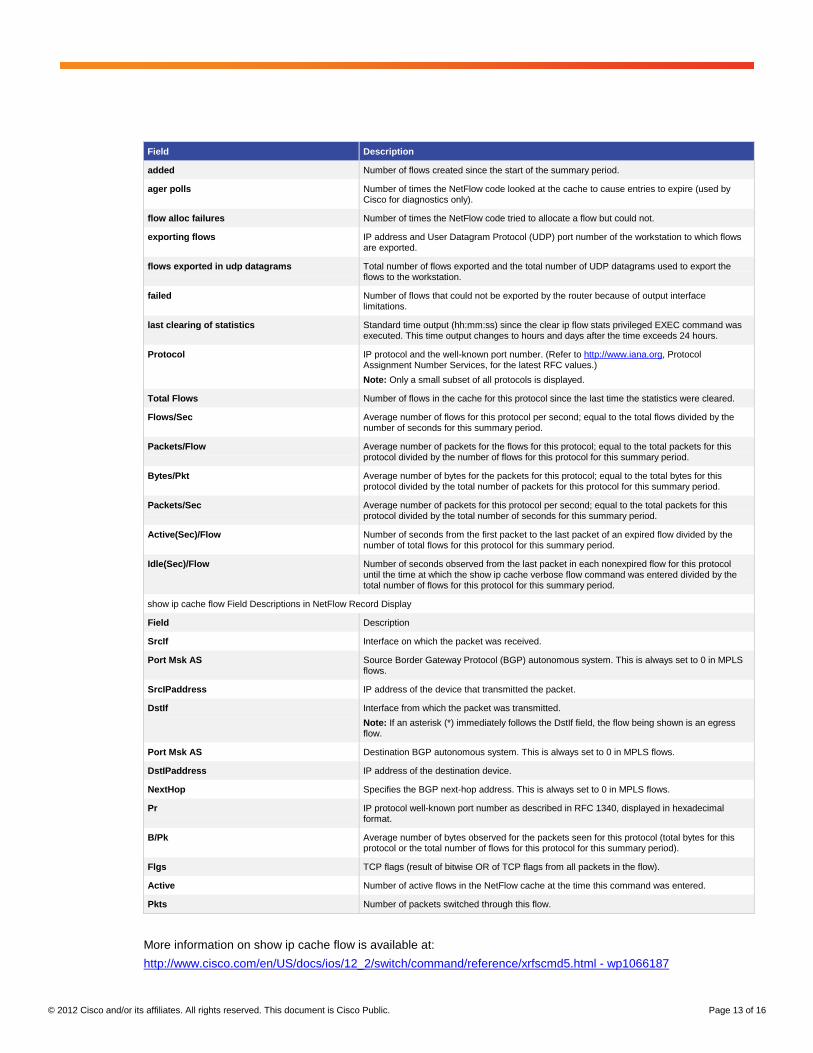
Field Description
added Number of flows created since the start of the summary period.
ager polls Number of times the NetFlow code looked at the cache to cause entries to expire (used by Cisco for diagnostics only).
flow alloc failures Number of times the NetFlow code tried to allocate a flow but could not.
exporting flows IP address and User Datagram Protocol (UDP) port number of the workstation to which flows are exported.
flows exported in udp datagrams Total number of flows exported and the total number of UDP datagrams used to export the flows to the workstation.
failed Number of flows that could not be exported by the router because of output interface limitations.
last clearing of statistics Standard time output (hh:mm:ss) since the clear ip flow stats privileged EXEC command was executed. This time output changes to hours and days after the time exceeds 24 hours.
Protocol IP protocol and the well-known port number. (Refer to http://www.iana.org, Protocol Assignment Number Services, for the latest RFC values.)
Note: Only a small subset of all protocols is displayed.
Total Flows Number of flows in the cache for this protocol since the last time the statistics were cleared.
Flows/Sec Average number of flows for this protocol per second; equal to the total flows divided by the number of seconds for this summary period.
Packets/Flow Average number of packets for the flows for this protocol; equal to the total packets for this protocol divided by the number of flows for this protocol for this summary period.
Bytes/Pkt Average number of bytes for the packets for this protocol; equal to the total bytes for this protocol divided by the total number of packets for this protocol for this summary period.
Packets/Sec Average number of packets for this protocol per second; equal to the total packets for this protocol divided by the total number of seconds for this summary period.
Active(Sec)/Flow Number of seconds from the first packet to the last packet of an expired flow divided by the number of total flows for this protocol for this summary period.
Idle(Sec)/Flow Number of seconds observed from the last packet in each nonexpired flow for this protocol until the time at which the show ip cache verbose flow command was entered divided by the total number of flows for this protocol for this summary period.
show ip cache flow Field Descriptions in NetFlow Record Display
Field Description
SrcIf Interface on which the packet was received.
Port Msk AS Source Border Gateway Protocol (BGP) autonomous system. This is always set to 0 in MPLS flows.
SrcIPaddress IP address of the device that transmitted the packet.
DstIf Interface from which the packet was transmitted.
Note: If an asterisk (*) immediately follows the DstIf field, the flow being shown is an egress flow.
Port Msk AS Destination BGP autonomous system. This is always set to 0 in MPLS flows.
DstIPaddress IP address of the destination device.
NextHop Specifies the BGP next-hop address. This is always set to 0 in MPLS flows.
Pr IP protocol well-known port number as described in RFC 1340, displayed in hexadecimal format.
B/Pk Average number of bytes observed for the packets seen for this protocol (total bytes for this protocol or the total number of flows for this protocol for this summary period).
Flgs TCP flags (result of bitwise OR of TCP flags from all packets in the flow).
Active Number of active flows in the NetFlow cache at the time this command was entered.
Pkts Number of packets switched through this flow.
More information on show ip cache flow is available at:
http://www.cisco.com/en/US/docs/ios/12_2/switch/command/reference/xrfscmd5.html - wp1066187
© 2012 Cisco and/or its affiliates. All rights reserved. This document is Cisco Public. Page 14 of 16
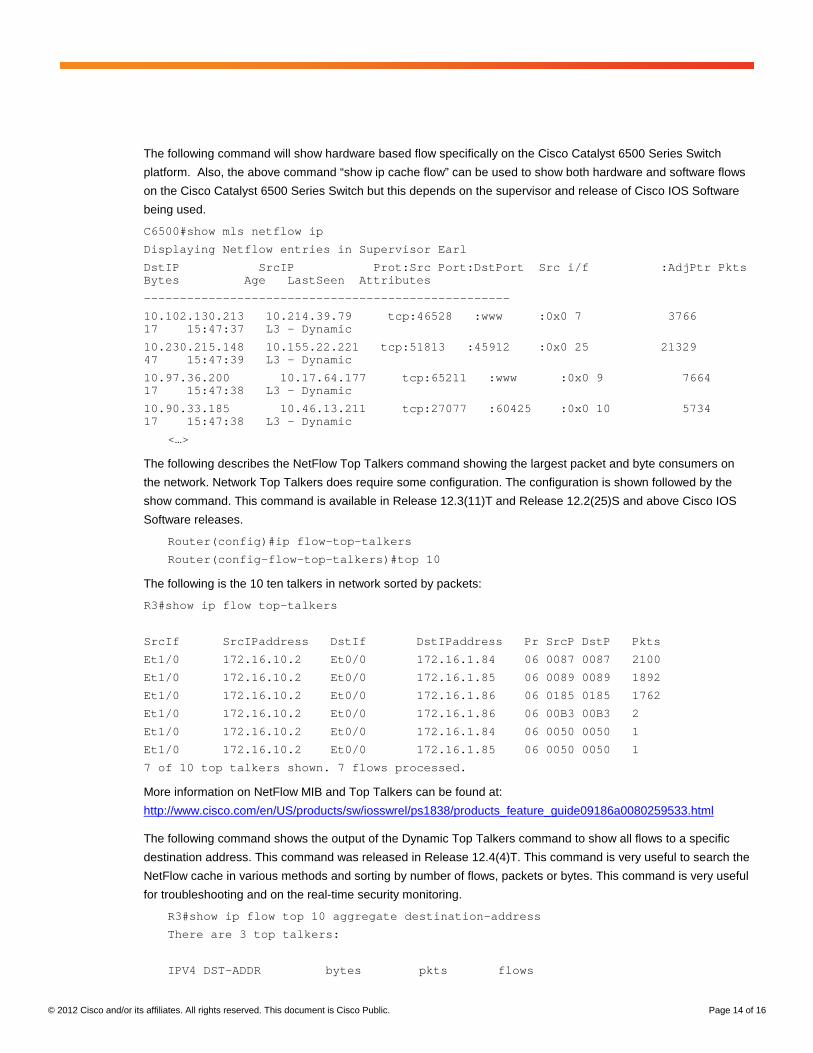
The following command will show hardware based flow specifically on the Cisco Catalyst 6500 Series Switch
platform. Also, the above command “show ip cache flow” can be used to show both hardware and software flows
on the Cisco Catalyst 6500 Series Switch but this depends on the supervisor and release of Cisco IOS Software
being used.
C6500#show mls netflow ip
Displaying Netflow entries in Supervisor Earl
DstIP SrcIP Prot:Src Port:DstPort Src i/f :AdjPtr Pkts Bytes Age LastSeen Attributes
---------------------------------------------------
10.102.130.213 10.214.39.79 tcp:46528 :www :0x0 7 3766 17 15:47:37 L3 - Dynamic
10.230.215.148 10.155.22.221 tcp:51813 :45912 :0x0 25 21329 47 15:47:39 L3 - Dynamic
10.97.36.200 10.17.64.177 tcp:65211 :www :0x0 9 7664 17 15:47:38 L3 - Dynamic
10.90.33.185 10.46.13.211 tcp:27077 :60425 :0x0 10 5734 17 15:47:38 L3 - Dynamic
<…>
The following describes the NetFlow Top Talkers command showing the largest packet and byte consumers on
the network. Network Top Talkers does require some configuration. The configuration is shown followed by the
show command. This command is available in Release 12.3(11)T and Release 12.2(25)S and above Cisco IOS
Software releases.
Router(config)#ip flow-top-talkers
Router(config-flow-top-talkers)#top 10
The following is the 10 ten talkers in network sorted by packets:
R3#show ip flow top-talkers
SrcIf SrcIPaddress DstIf DstIPaddress Pr SrcP DstP Pkts
Et1/0 172.16.10.2 Et0/0 172.16.1.84 06 0087 0087 2100
Et1/0 172.16.10.2 Et0/0 172.16.1.85 06 0089 0089 1892
Et1/0 172.16.10.2 Et0/0 172.16.1.86 06 0185 0185 1762
Et1/0 172.16.10.2 Et0/0 172.16.1.86 06 00B3 00B3 2
Et1/0 172.16.10.2 Et0/0 172.16.1.84 06 0050 0050 1
Et1/0 172.16.10.2 Et0/0 172.16.1.85 06 0050 0050 1
7 of 10 top talkers shown. 7 flows processed.
More information on NetFlow MIB and Top Talkers can be found at:
http://www.cisco.com/en/US/products/sw/iosswrel/ps1838/products_feature_guide09186a0080259533.html
The following command shows the output of the Dynamic Top Talkers command to show all flows to a specific
destination address. This command was released in Release 12.4(4)T. This command is very useful to search the
NetFlow cache in various methods and sorting by number of flows, packets or bytes. This command is very useful
for troubleshooting and on the real-time security monitoring.
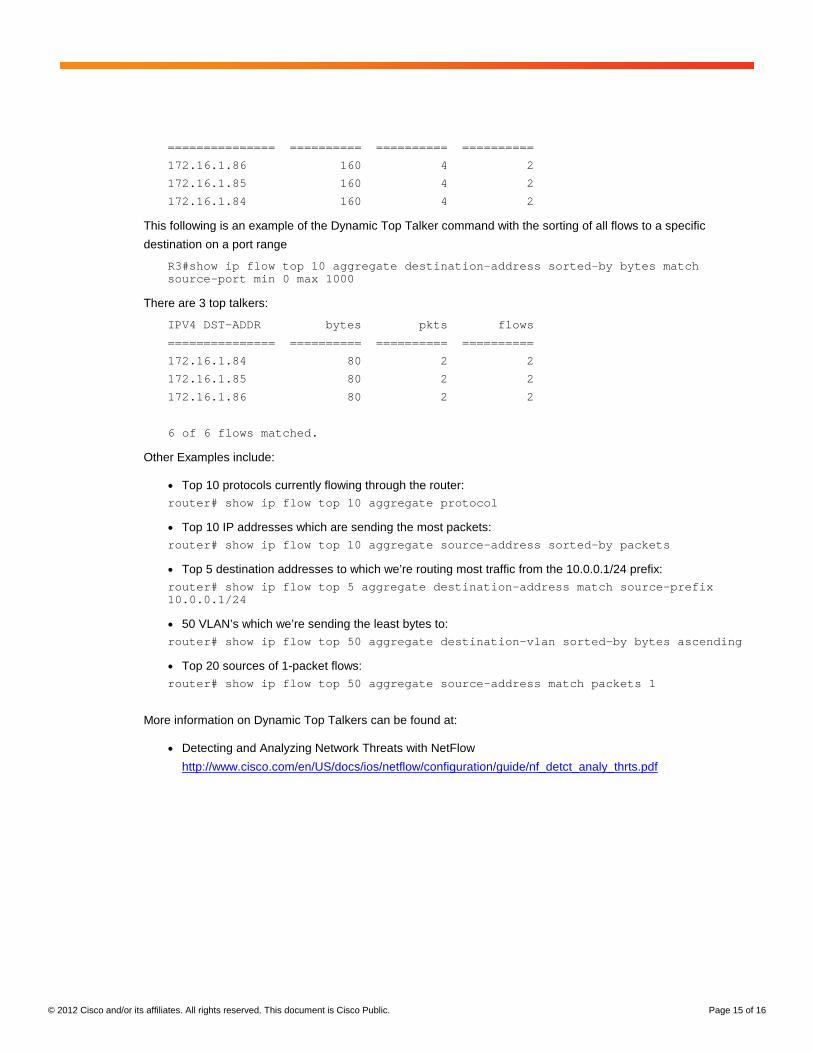
R3#show ip flow top 10 aggregate destination-address
There are 3 top talkers:
IPV4 DST-ADDR bytes pkts flows
© 2012 Cisco and/or its affiliates. All rights reserved. This document is Cisco Public. Page 15 of 16
=============== ========== ========== ==========
172.16.1.86 160 4 2
172.16.1.85 160 4 2
172.16.1.84 160 4 2
This following is an example of the Dynamic Top Talker command with the sorting of all flows to a specific
destination on a port range
R3#show ip flow top 10 aggregate destination-address sorted-by bytes match source-port min 0 max 1000
There are 3 top talkers:
IPV4 DST-ADDR bytes pkts flows
=============== ========== ========== ==========
172.16.1.84 80 2 2
172.16.1.85 80 2 2
172.16.1.86 80 2 2
6 of 6 flows matched.
Other Examples include:
● Top 10 protocols currently flowing through the router: router# show ip flow top 10 aggregate protocol
● Top 10 IP addresses which are sending the most packets: router# show ip flow top 10 aggregate source-address sorted-by packets
● Top 5 destination addresses to which we’re routing most traffic from the 10.0.0.1/24 prefix: router# show ip flow top 5 aggregate destination-address match source-prefix 10.0.0.1/24
● 50 VLAN’s which we’re sending the least bytes to: router# show ip flow top 50 aggregate destination-vlan sorted-by bytes ascending
● Top 20 sources of 1-packet flows: router# show ip flow top 50 aggregate source-address match packets 1
More information on Dynamic Top Talkers can be found at:
● Detecting and Analyzing Network Threats with NetFlow
http://www.cisco.com/en/US/docs/ios/netflow/configuration/guide/nf_detct_analy_thrts.pdf

© 2012 Cisco and/or its affiliates. All rights reserved. This document is Cisco Public. Page 16 of 16
Printed in USA C17-408326-02 05/12