Embed Size (px)
Citation preview
Intro to LSP 121 Normal Distributions
LSP 121
Welcome to LSP 121Quantitative Reasoning and Technological
Literacy IIContinuation of concepts from LSP 120Topics we feel you will need to make it through
college and into a careerNormal distributionsDescriptive statistics and correlationProbability and riskDatabasesAlgorithms
If you feel you know this material, take the testSee Syllabus under ‘Prerequisites’
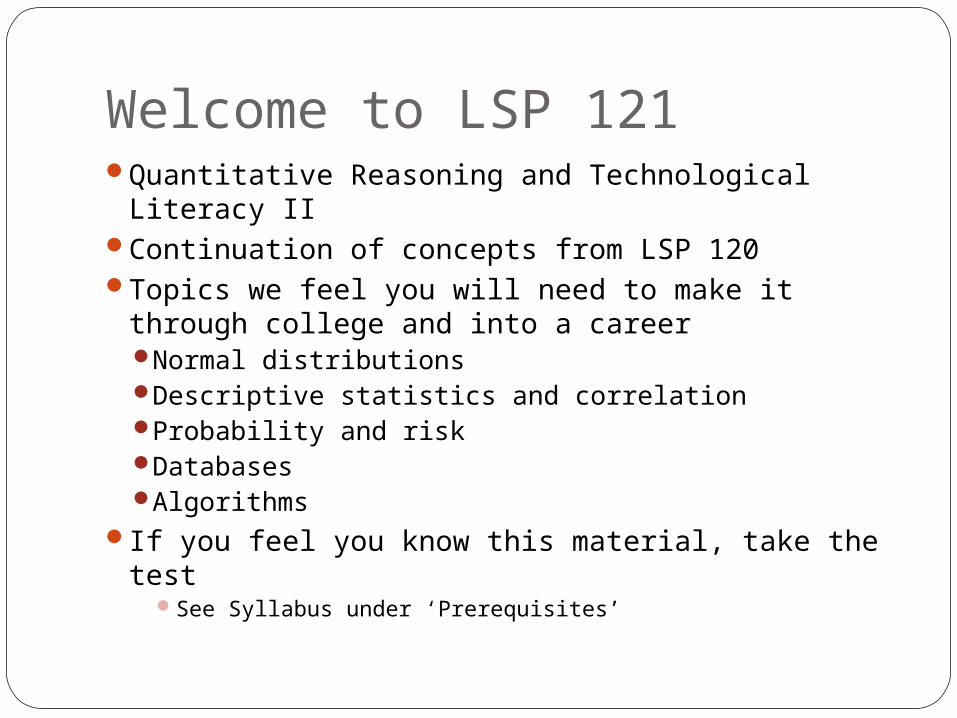
What is a Normal Distribution?Very common, very special type of
distributionMost data values are clustered near the
mean (a single peak)Distribution is symmetricTapering tales as you move away from the
meanLooks like a bell curve
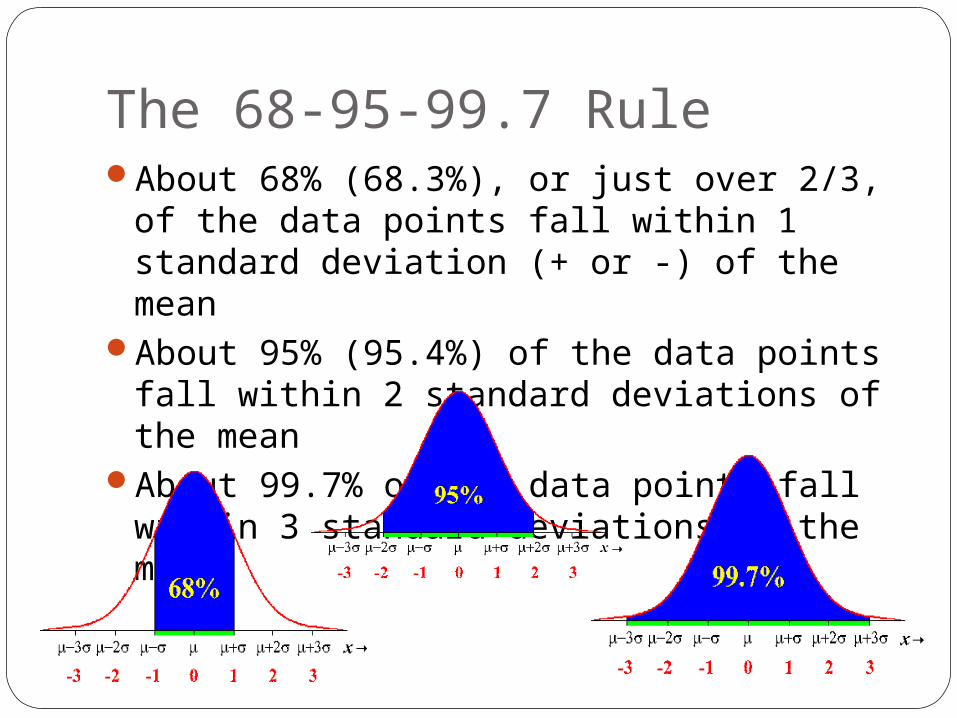
The 68-95-99.7 RuleAbout 68% (68.3%), or just over 2/3, of the
data points fall within 1 standard deviation (+ or -) of the mean
About 95% (95.4%) of the data points fall within 2 standard deviations of the mean
About 99.7% of the data points fall within 3 standard deviations of the mean
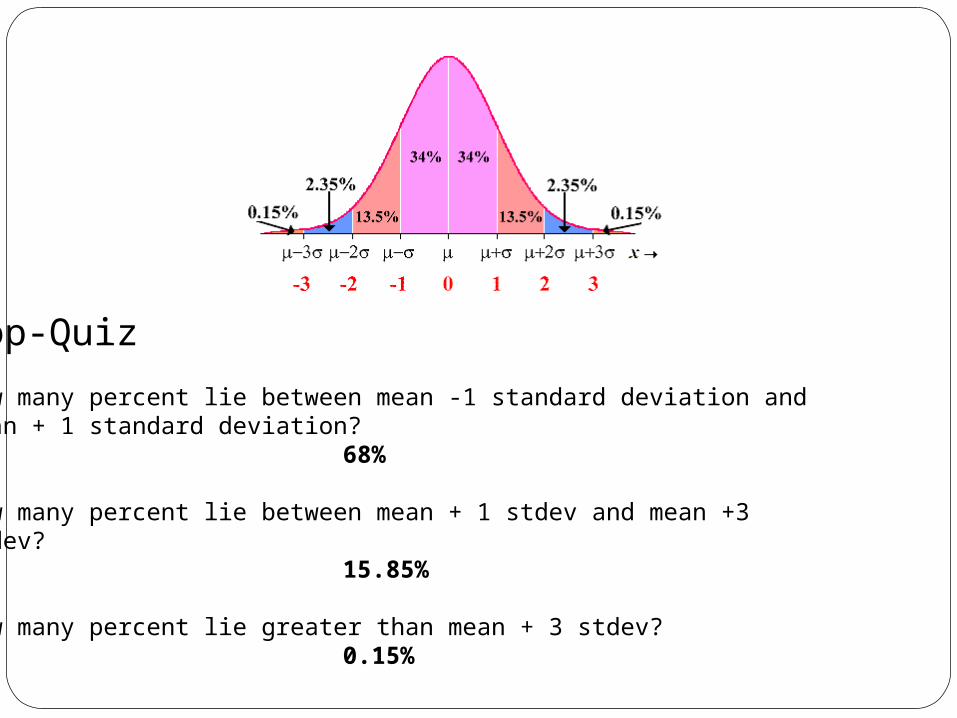
Pop-Quiz
How many percent lie between mean -1 standard deviation and mean + 1 standard deviation?
68%
How many percent lie between mean + 1 stdev and mean +3 stdev?
15.85%
How many percent lie greater than mean + 3 stdev? 0.15%

ExampleIn the real world, SAT exams typically produce normal
distributions with a mean of 500 and a standard deviation of 100.
Thus, 68% of the students score between 400 and 60095% of the students score between 300 and 70099.7% score between 200 and 800What if someone scored 720 on the SAT? What
percentage of students scored less than or equal to 720?Use Excel’s NORMDIST functionIn a cell type: =NORMDIST(X, mean, stdev, true)For our problem: =NORMDIST(720, 500, 100, TRUE)Answer = 0.986097, or 98.6097%
What percentage scored greater than 720?
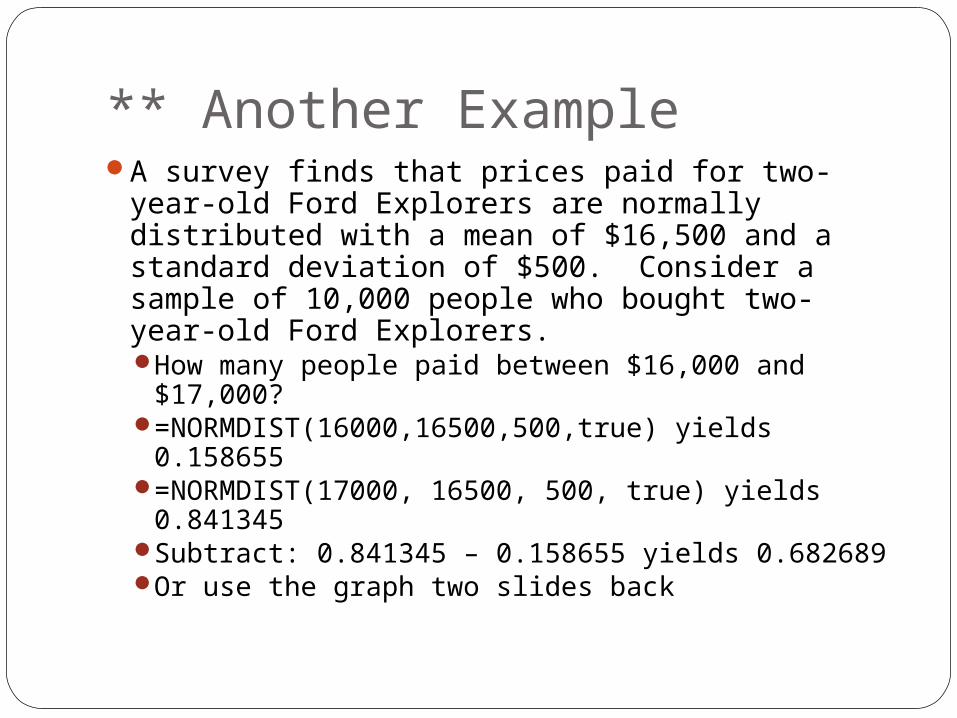
** Another ExampleA survey finds that prices paid for two-year-old
Ford Explorers are normally distributed with a mean of $16,500 and a standard deviation of $500. Consider a sample of 10,000 people who bought two-year-old Ford Explorers.How many people paid between $16,000 and
$17,000?=NORMDIST(16000,16500,500,true) yields
0.158655=NORMDIST(17000, 16500, 500, true) yields
0.841345Subtract: 0.841345 – 0.158655 yields 0.682689Or use the graph two slides back
Another ExampleHow many paid less than $16,000?
=NORMDIST(16000, 16500, 500, true) yields 0.158655, or 15.8655 %
Or use the graph
What is another way of saying “What percentage of values are less than or equal to some value X?” (see next slide)
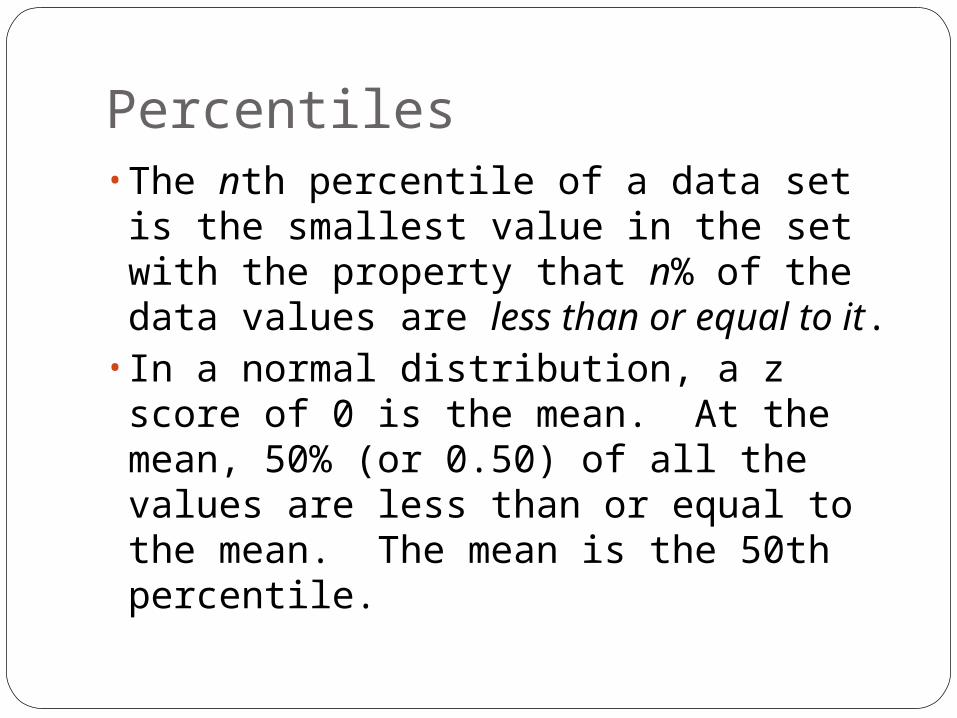
Percentiles• The nth percentile of a data set is the smallest value in the set with the property that n% of the data values are less than or equal to it.• In a normal distribution, a z score of 0 is the mean. At the mean, 50% (or 0.50) of all the values are less than or equal to the mean. The mean is the 50th percentile.
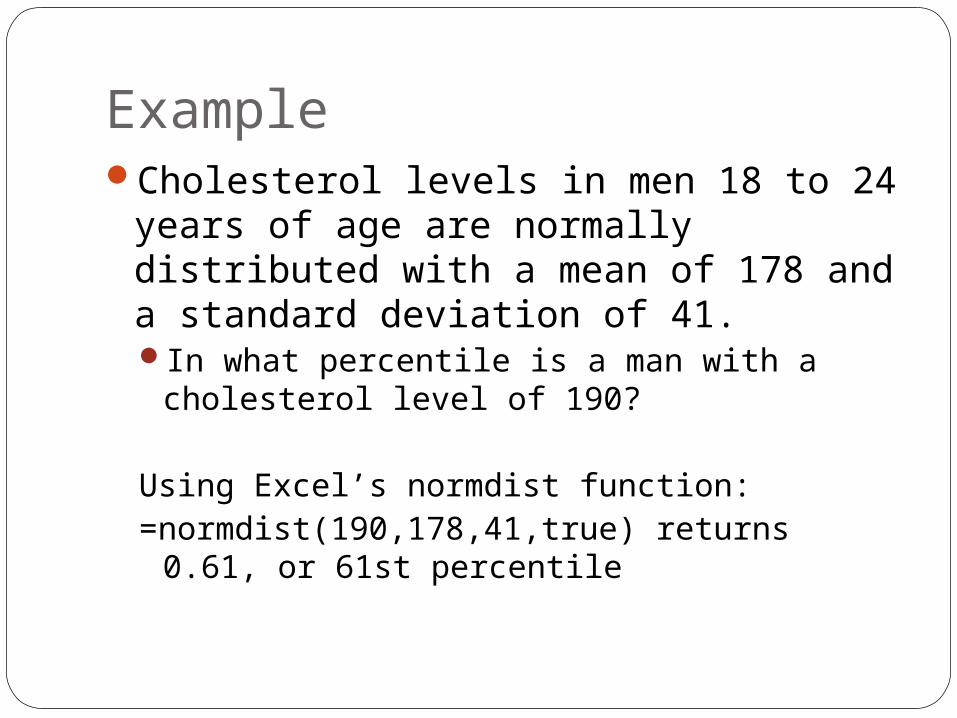
ExampleCholesterol levels in men 18 to 24 years
of age are normally distributed with a mean of 178 and a standard deviation of 41.In what percentile is a man with a cholesterol
level of 190?
Using Excel’s normdist function:=normdist(190,178,41,true) returns 0.61, or
61st percentile
Standard Scores
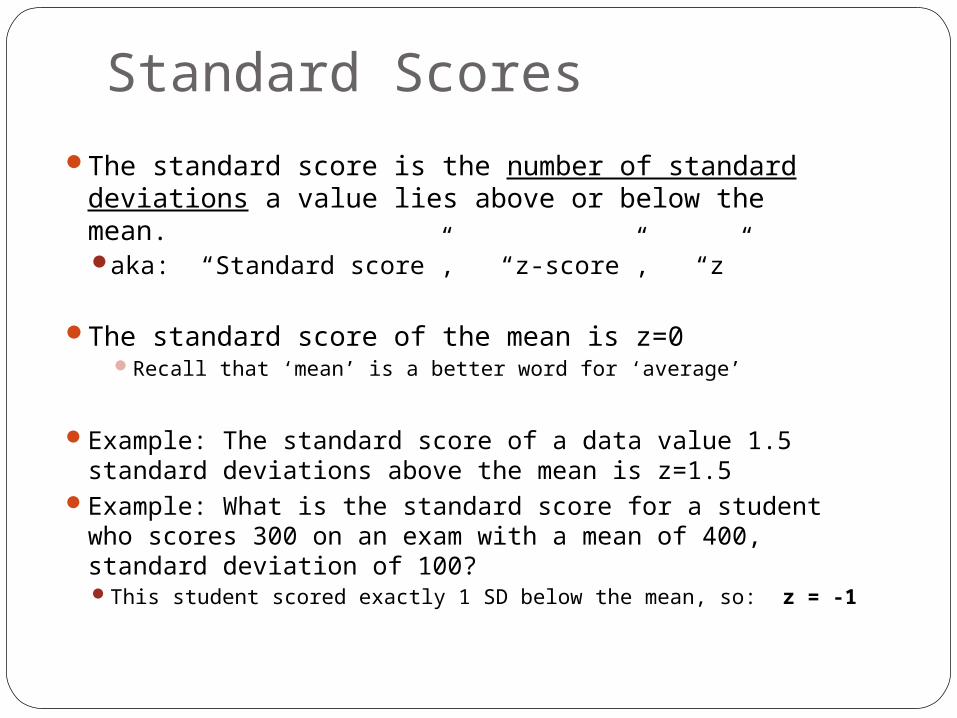
The standard score is the number of standard deviations a value lies above or below the mean. aka: “Standard score”, “z-score”, “z”
The standard score of the mean is z=0Recall that ‘mean’ is a better word for ‘average’
Example: The standard score of a data value 1.5 standard deviations above the mean is z=1.5
Example: What is the standard score for a student who scores 300 on an exam with a mean of 400, standard deviation of 100?This student scored exactly 1 SD below the mean, so: z = -1
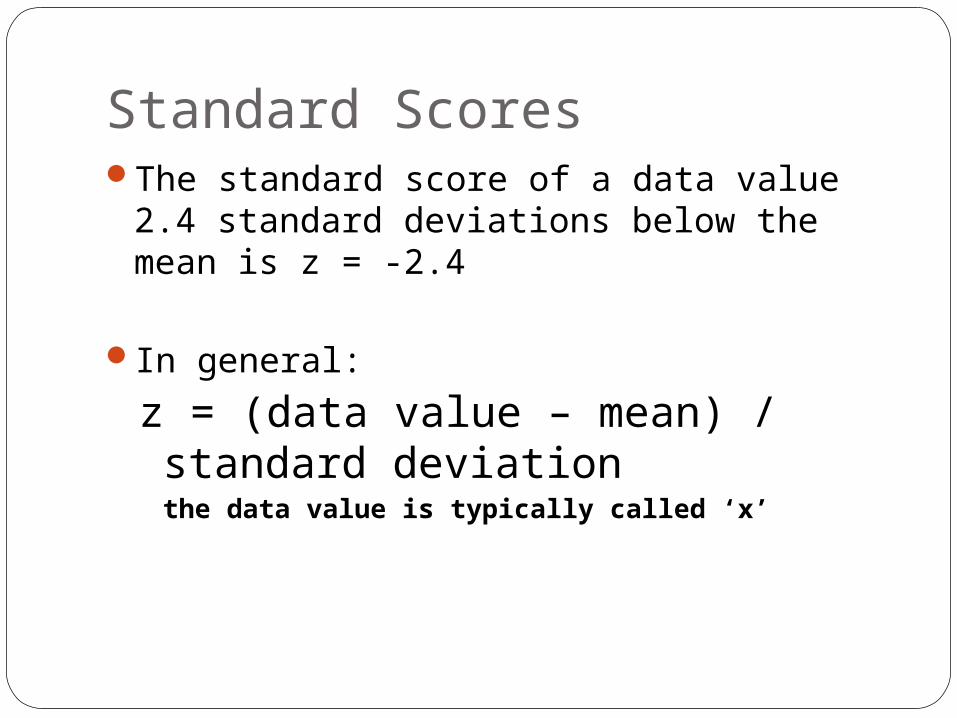
Standard ScoresThe standard score of a data value 2.4
standard deviations below the mean is z = -2.4
In general:
z = (data value – mean) / standard deviationthe data value is typically called ‘x’

ExampleThe Stanford-Binet IQ test is designed so that scores are normally distributed with a mean of 100 and a standard deviation of 16. What are the z-scores for IQ scores of 95 and 125?z = (95 - 100) / 16 = -0.31z = (125 - 100) / 16 = 1.56 Thus, an IQ score of
125 lies 1.56 standard deviations above the mean.
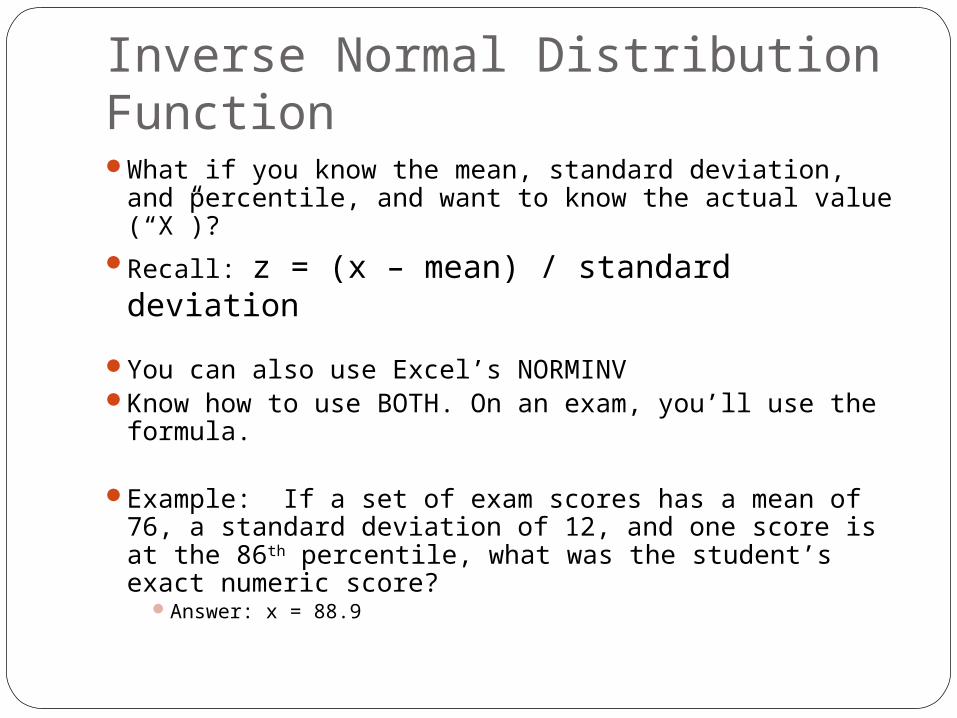
Inverse Normal Distribution FunctionWhat if you know the mean, standard deviation, and
percentile, and want to know the actual value (“X”)?Recall: z = (x – mean) / standard deviation
You can also use Excel’s NORMINVKnow how to use BOTH. On an exam, you’ll use the
formula.
Example: If a set of exam scores has a mean of 76, a standard deviation of 12, and one score is at the 86th percentile, what was the student’s exact numeric score?
Answer: x = 88.9