Embed Size (px)
Citation preview
| P a g e h t t p : / / w w w . l i n k e d i n . c o m / i n / n i t i n k o l a p k a r
INTRINSIC VALUATION
OF EQUITY SHARE OF A
COMPANY
This report was made during summer internship
at Stoic Advisors LLP Company. Stoic started
recently to provide investor education in India.
Stoic is run by an eminent value investor who
walks on the principles led by Benjamin Graham.
Submitted by: Nitin Kolapkar (15IB341)
JUNE 2016
Industry Mentor: Faculty Mentor:
Mr. Puneet Khurana Prof. Arindam Banerjee
CFA USA Faculty - Finance and Accounting
Managing Partner BIMTECH
Stoic Advisors LLP
i | P a g e h t t p : / / w w w . l i n k e d i n . c o m / i n / n i t i n k o l a p k a r
Table of Contents
List of Tables .......................................................................................................................................... iii
List of charts and graphs .................................................................................................................. iv
Summer Project Certificate .............................................................................................................. v
Letter of Authorization ...................................................................................................................... vi
Letter of Transmittal ......................................................................................................................... vii
Executive Summary ......................................................................................................................... viii
About Stoic Advisors Llp ................................................................................................................... x
Concept of Value Investing ............................................................................................................... 1
Overview of Indian Economy .......................................................................................................... 3
Overview of Indian Paint Industry ................................................................................................ 5
Asian Paint .............................................................................................................................................. 8
About Asian Paint .............................................................................................................................. 10
Performance Highlights .................................................................................................................. 12
Financial Ratio Analysis .................................................................................................................. 13
Porters Five Forces Analysis ......................................................................................................... 17
Intrinsic Valuation (DCF Model) ................................................................................................. 19
Intrinsic Valuation (EPV Model) …………………………………………………………………… 23
Overview of Indian 2w Automibile Industry..………………………………….……………… 27
Hero Motocorp Ltd ............................................................................................................................ 28
Performance Highlights .................................................................................................................. 29
Financial Ratio Analysis .................................................................................................................. 34
Intrinsic Valuation (DCF Model) ................................................................................................. 36
Glossary .................................................................................................................................................. 38
References ............................................................................................................................................. 40
ii | P a g e h t t p : / / w w w . l i n k e d i n . c o m / i n / n i t i n k o l a p k a r
Acknowledgement
It is difficult to acknowledge precious a debt as that of learning as it is the only debt that is
difficult to repay except through gratitude.
It is my profound privilege to express sincere gratitude to MR. PUNEET KHURANA and MR.
MANISH DHAWAN for giving me the opportunity to do my summer training at STOIC ADVISORS
LLP. and for their expert guidance and support. They continuously motivated me to work on this
project and make it a success. Their willingness to inspire me contributed tremendously in its
completion. They had been very kind and patient while suggesting the outlines of this project
and correcting my doubts.
I would also like to express my gratitude to entire STOIC TEAM for their co-operation and
willingness to answer all my queries and provide valuable assistance and thereby helped me in
my project.
My heartfelt gratitude also goes to PROF. ARINDAM BANERJEE, my faculty mentor at BIMTECH,
who provided valuable suggestions, shared his rich experience and helped me script the
meticulous requisites
iii | P a g e h t t p : / / w w w . l i n k e d i n . c o m / i n / n i t i n k o l a p k a r
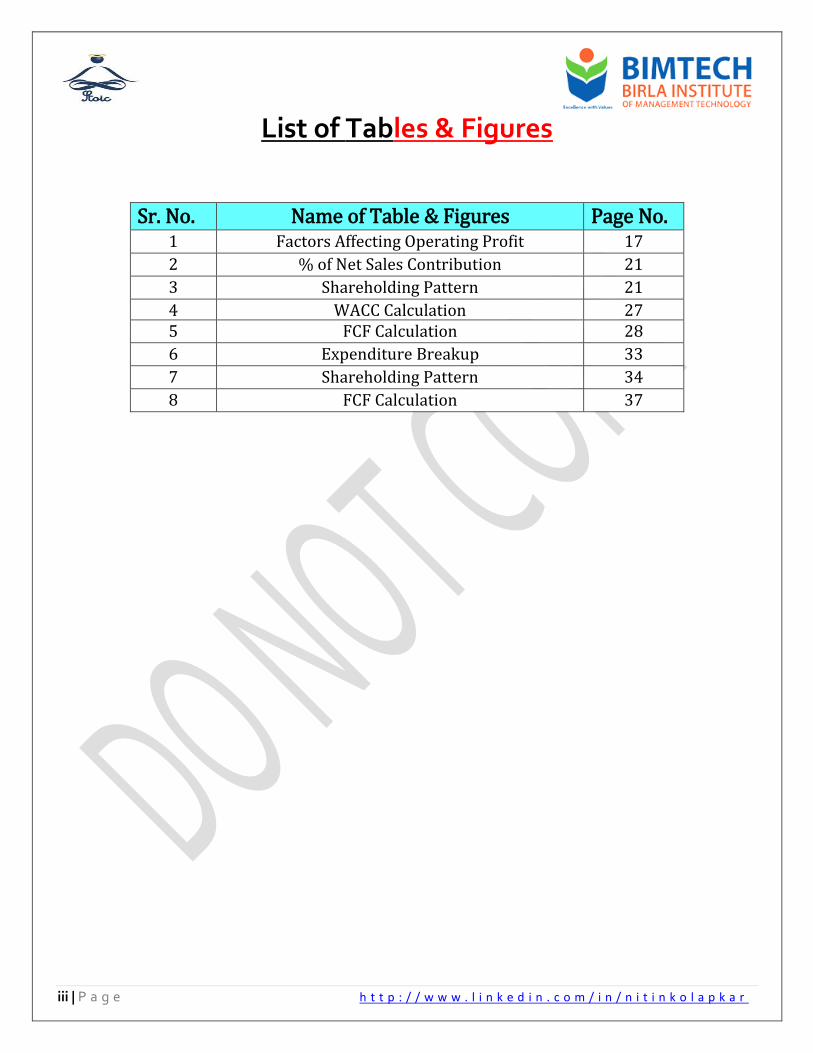
List of Tables & Figures
Sr. No. Name of Table & Figures Page No. 1 Factors Affecting Operating Profit 17
2 % of Net Sales Contribution 21
3 Shareholding Pattern 21
4 WACC Calculation 27 5 FCF Calculation 28
6 Expenditure Breakup 33
7 Shareholding Pattern 34
8 FCF Calculation 37
iv | P a g e h t t p : / / w w w . l i n k e d i n . c o m / i n / n i t i n k o l a p k a r
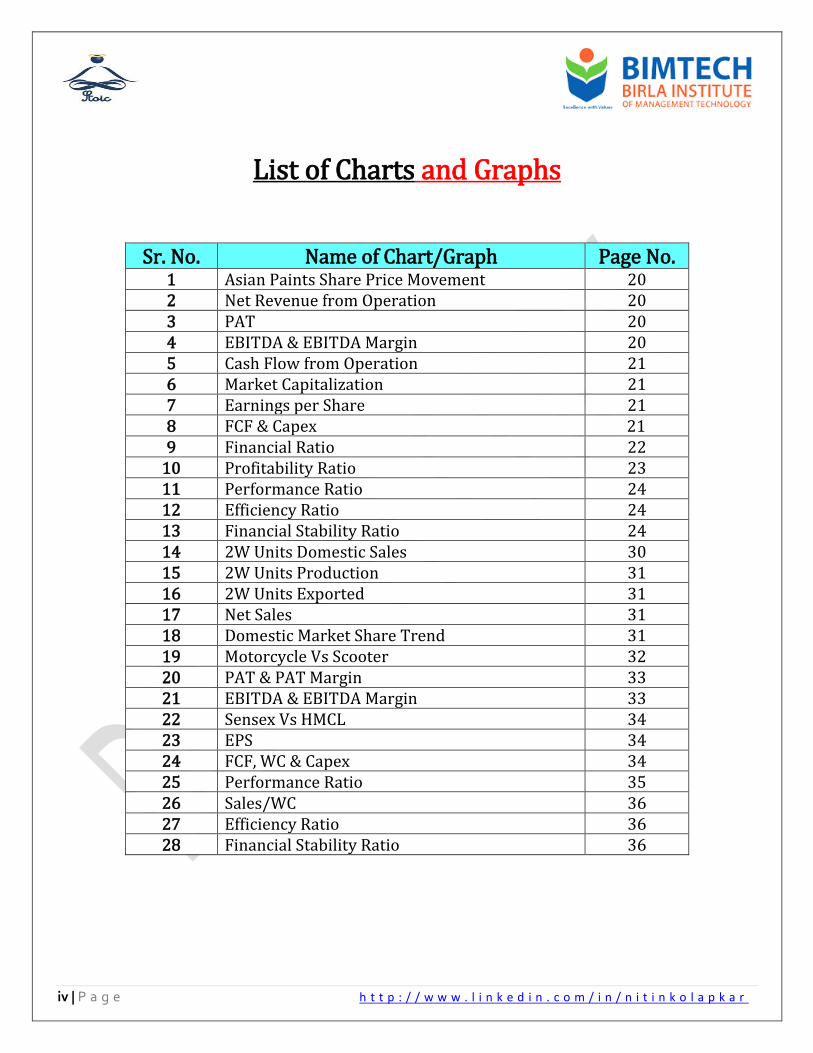
List of Charts and Graphs
Sr. No. Name of Chart/Graph Page No. 1 Asian Paints Share Price Movement 20 2 Net Revenue from Operation 20 3 PAT 20 4 EBITDA & EBITDA Margin 20 5 Cash Flow from Operation 21 6 Market Capitalization 21 7 Earnings per Share 21 8 FCF & Capex 21 9 Financial Ratio 22
10 Profitability Ratio 23 11 Performance Ratio 24 12 Efficiency Ratio 24 13 Financial Stability Ratio 24 14 2W Units Domestic Sales 30 15 2W Units Production 31 16 2W Units Exported 31 17 Net Sales 31 18 Domestic Market Share Trend 31 19 Motorcycle Vs Scooter 32 20 PAT & PAT Margin 33 21 EBITDA & EBITDA Margin 33 22 Sensex Vs HMCL 34 23 EPS 34 24 FCF, WC & Capex 34 25 Performance Ratio 35 26 Sales/WC 36 27 Efficiency Ratio 36 28 Financial Stability Ratio 36
v | P a g e h t t p : / / w w w . l i n k e d i n . c o m / i n / n i t i n k o l a p k a r
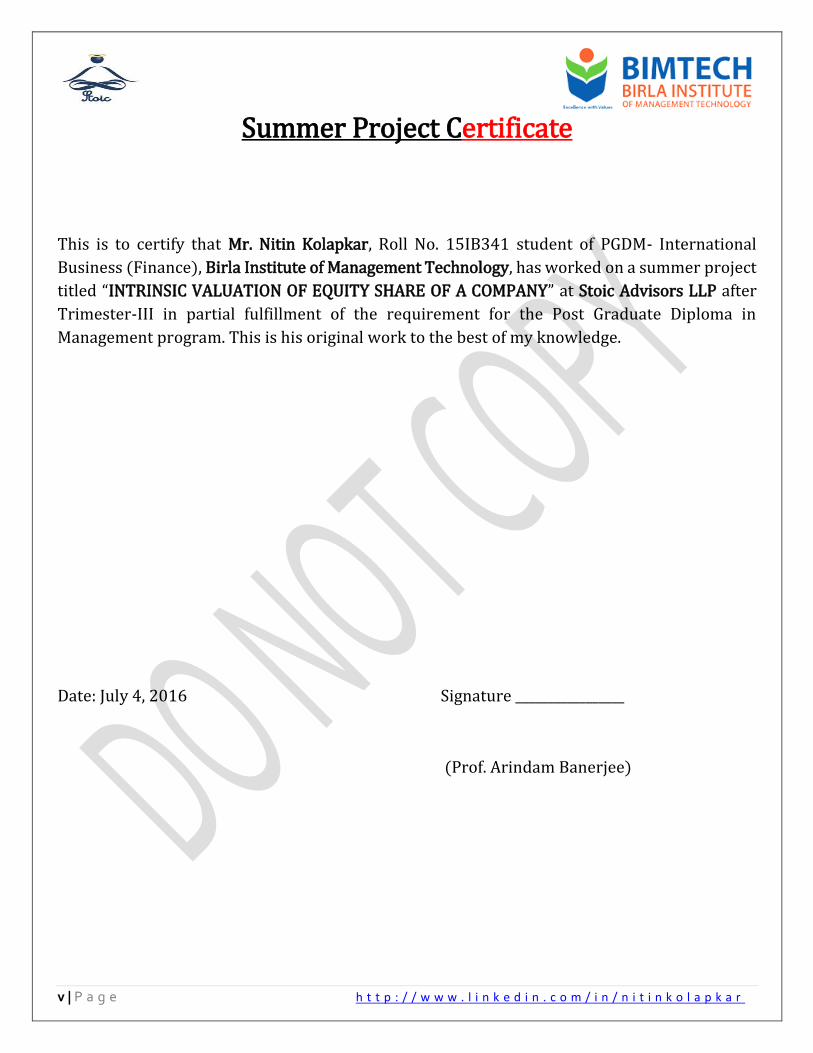
Summer Project Certificate
This is to certify that Mr. Nitin Kolapkar, Roll No. 15IB341 student of PGDM- International
Business (Finance), Birla Institute of Management Technology, has worked on a summer project
titled “INTRINSIC VALUATION OF EQUITY SHARE OF A COMPANY” at Stoic Advisors LLP after
Trimester-III in partial fulfillment of the requirement for the Post Graduate Diploma in
Management program. This is his original work to the best of my knowledge.
Date: July 4, 2016 Signature _________________
(Prof. Arindam Banerjee)
vi | P a g e h t t p : / / w w w . l i n k e d i n . c o m / i n / n i t i n k o l a p k a r
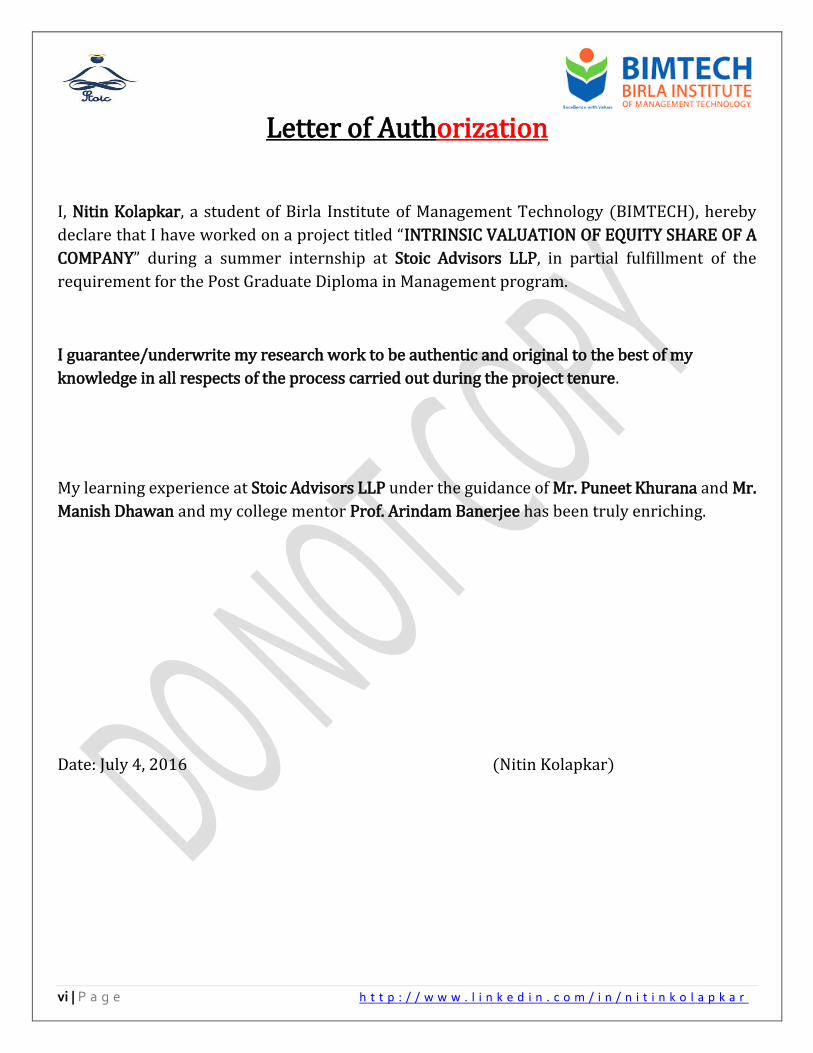
Letter of Authorization
I, Nitin Kolapkar, a student of Birla Institute of Management Technology (BIMTECH), hereby
declare that I have worked on a project titled “INTRINSIC VALUATION OF EQUITY SHARE OF A
COMPANY” during a summer internship at Stoic Advisors LLP, in partial fulfillment of the
requirement for the Post Graduate Diploma in Management program.
I guarantee/underwrite my research work to be authentic and original to the best of my
knowledge in all respects of the process carried out during the project tenure.
My learning experience at Stoic Advisors LLP under the guidance of Mr. Puneet Khurana and Mr.
Manish Dhawan and my college mentor Prof. Arindam Banerjee has been truly enriching.
Date: July 4, 2016 (Nitin Kolapkar)
vii | P a g e h t t p : / / w w w . l i n k e d i n . c o m / i n / n i t i n k o l a p k a r
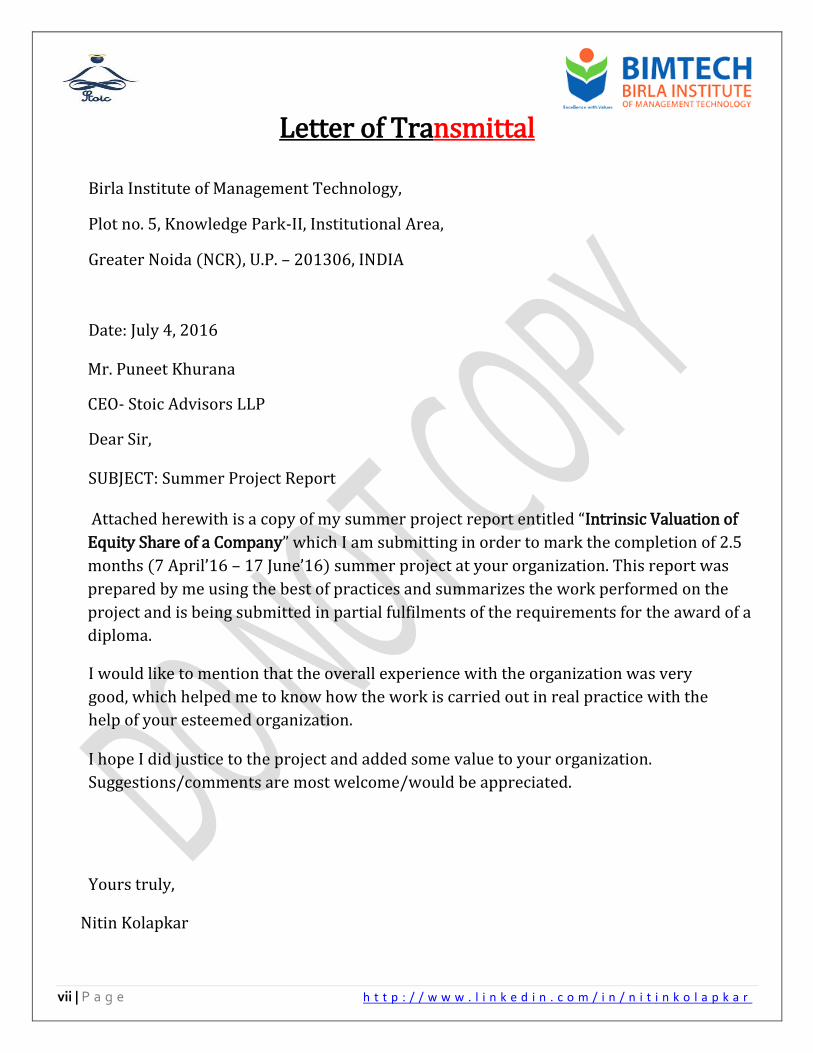
Letter of Transmittal
Birla Institute of Management Technology,
Plot no. 5, Knowledge Park-II, Institutional Area,
Greater Noida (NCR), U.P. – 201306, INDIA
Date: July 4, 2016
Mr. Puneet Khurana
CEO- Stoic Advisors LLP
Dear Sir,
SUBJECT: Summer Project Report
Attached herewith is a copy of my summer project report entitled “Intrinsic Valuation of
Equity Share of a Company” which I am submitting in order to mark the completion of 2.5
months (7 April’16 – 17 June’16) summer project at your organization. This report was
prepared by me using the best of practices and summarizes the work performed on the
project and is being submitted in partial fulfilments of the requirements for the award of a
diploma.
I would like to mention that the overall experience with the organization was very
good, which helped me to know how the work is carried out in real practice with the
help of your esteemed organization.
I hope I did justice to the project and added some value to your organization.
Suggestions/comments are most welcome/would be appreciated.
Yours truly,
Nitin Kolapkar
viii | P a g e h t t p : / / w w w . l i n k e d i n . c o m / i n / n i t i n k o l a p k a r
EXECUTIVE SUMMARY
“Price is what you pay and value is what you get”- Warren Buffet “Intrinsic value” is the worth of an enterprise to one who owns it “for keeps.” Logically, it must be based on the cash flow that would go to a continuing owner over the long run, as distinct from a speculative assessment of its resale value i.e. book value. DCF model and earning power value model can be used for calculating the intrinsic value of an asset or business. In Discounted Cash Flow model, we use FCF because FCF is what we finally get out of that business. The discounting factor that we use in DCF is weighted average cost of capital (WACC). Value investing is a concept coined by Benjamin Graham in his fabulous book “Security Analysis” written in 1934. He led basic principles that value investor uses in the intrinsic valuation of an asset. This principle is still found to be relevant in today's’ age. Many value investors walk on the way defined by Ben Graham. Framework for intrinsic valuation: Analyzing fundamentals of the company which includes studying Income statement (earning power of the company), Balance Sheet (Insights about assets of the company), Cash Flow Statement (Which differentiate accrual accounting vis a vis cash based accounting), Management leadership (How the management is utilizing assets in order to create value for their investors). Using this fundamental, we actually calculate what the company or an asset is worth today. In this research report, we have used two-stage DCF model for intrinsic valuation of Asian Paints and Hero MotoCorp Ltd. Since both the companies are market leaders in their respective industries we were keen to know about their fundamentals. Both the company have consistently created value for their investors. After intrinsic valuation of those two company, it was found that Asian Paint’s share price is undervalued whereas Hero MotoCorp Ltd.’s share price is overvalued. We have also used the concept of margin of safety of 30% for both the stocks in order to come out with the final buy price. MOS is used as a safeguard mechanism because no one can predict the future precisely. A value investor should think ahead of the management in order forecast the future of the company. But no research can ever be wrong or right. All researches are justifiable. Because no valuation comes without an assumption whether it is earnings, capex or FCF. It is the time which can only tell us about the mistakes what we have committed during the valuation. Forecasting is a vital part of the intrinsic valuation because, at the end of the day, results of forecasting give you a signal to take a decision on the stock. Key learning points of forecasting:
1. What all things we need to forecast 2. What is the sensible way of forecasting 3. What errors we generally commit in forecasting 4. How to avoid those errors 5. What is conservative way of doing forecasting 6. What is base rate forecasting

ix | P a g e h t t p : / / w w w . l i n k e d i n . c o m / i n / n i t i n k o l a p k a r
7. What is the best case scenario forecasting This internship report will give a complete view of value investing and how it differs from what we have learned in academics. There are many differences in opinions of academicians and value investors about principles of investing.
x | P a g e h t t p : / / w w w . l i n k e d i n . c o m / i n / n i t i n k o l a p k a r
ABOUT STOIC ADVISORS
Stoic advisors LLP is an emerging startup started by Mr. Puneet Khurana who is a CFA charter
holder. Mr. Puneet handled research work for some of the prominent hedge funds in Singapore,
Mauritius, and India for around eight years. He believes that Indian investors have many capabilities
but they should be groomed in a good manner. He is a professional investor and visiting faculty in
IIT Delhi, also he is a strong book lover.
Unlike the USA, Indian retail investors are risk averse and also poor in investing in the stock markets
because the lack of financial literacy is prevalent. But he believes that with proper investment
education, Indian investment community can change the face of investing.
In the wake of this, he has started Stoic Advisors a limited liability partnership firm which is providing
advice and insights to value investors. Stoic has achieved many milestones in their journey since
2014. Stoic has started a podcast series on their website stoicinvesting.com. Stoic invites successful
value investor, momentum investors, and decision-makers from India and abroad to share their
journey of investing and nuggets of wisdom. The one on one communication with those investors is
recorded and launched on the websites. Stoic Advisors got a huge response by investor community
since Stoic Advisor’s podcast offers incredible insights from successful investors.
Stoic Advisors also provides advisory services to HNI’s and fund houses. Stoic Advisors is about to
launch a full fledged website which will offer fundamental analysis of stocks listed on NSE and BSE.
Being a follower of Ben Graham and Warren Buffet Puneet is working towards building better
investment society in India.
0 | P a g e h t t p : / / w w w . l i n k e d i n . c o m / i n / n i t i n k o l a p k a r
CONCEPT OF VALUE INVESTING
The concept of value investing is coined by Benjamin Graham in his book “Security valuation” written
in 1934.
Value Investing Fundamental No. 1: Companies Have Intrinsic Value
The basic concept behind value investing is so simple that you might already do it on a regular basis.
Every asset has some worth. But the worth should be calculated on the basis of its value creation. If
it is cheaper then you will buy it otherwise not.
Most folks would agree that whether you buy a new mobile phone when it's on sale or when it's at
full price, you're getting the same mobile phone with the same features and the same service
warranty. The obvious assumption that we have to make is that the value of the mobile phone will
not depreciate with time as new technology becomes available. Stocks are the same way: the
company's stock price can change even when the company's intrinsic value is the same. Stocks, like
mobile phones, go through periods of higher and lower demand. These fluctuations change prices,
but they don't change what you're getting.
Many savvy shoppers would argue that it makes no sense to pay full price for a mobile phone since
mobile phones go on sale several times a year. Stocks work the same way. The only difference is
that, unlike mobile phones, stocks will not have offered on discount openly, you have worked hard
to find that stock which you are getting on discount. If they were, stocks on sale would be less of a
bargain because more people would know about the sale and drive the price up. If you're willing to
do the detective work to find these secret sales, you can get stocks at a bargain price.
Value Investing Fundamental No. 2: Always Have a Margin of Safety
Buying stocks at bargain prices gives you a better chance at earning a profit later when you sell
them. It also makes you less likely to lose money if the stock doesn't perform as you hope. This
principle called the margin of safety, is one of the keys to successful value investing. Unlike
speculative stocks whose price can plummet, it is less probable that value stocks will continue to
experience price declines.
You might already apply this principle when you shop something. When you buy a new shirt, maybe
you don't like to pay full price because sometimes you feel that this shirt doesn’t deserve. It might
look good and feel comfortable in the store, but then when you wear it in real life, it feels too tight or
too loose or it fades or shrinks in the washing machine. If you buy a shirt on sale for 500 rupees
instead of buying it at full price for 1500 rupees, you will only lose 500 bucks on a bad shirt purchase.
If you pay 1500 rupees, your loss will be significantly greater. By purchasing the shirt on sale for 500
rupees, you limit your potential loss. On the other hand, you might end up wearing the shirt a hundred
times, making it a great bargain at only 500 bucks. Either way, you're better off buying the shirt for
500 than for 1500.But yes, your shirt Shirts’ value will not appreciate, unlike stock.
1 | P a g e h t t p : / / w w w . l i n k e d i n . c o m / i n / n i t i n k o l a p k a r
Value investors implement the same sort of reasoning. If a stock is worth 100 rupees and you buy it for 75 rupees, you'll make a profit of 25 rupees simply by waiting for the stock's price to rise to the 100 rupees. On above of that, the company might outperform your estimate offering you a chance to earn even more money. If you had purchased it at its full price of 100 rupees, you would only make a 10 rupees’ profit. Benjamin Graham, the father of value investing, only bought stocks when they were priced at two-thirds or less of their intrinsic value. This is the margin of safety that he believed to give the maximum return.
Value Investing Fundamental No. 3: The Efficient-Market Hypothesis Is Wrong
Value investors don't believe in the efficient-market hypothesis, EMH tells us that all the information in incorporated in price. In today's’ age information is no more an edge of investing. Everyone is full of information. If we say that EMH is true, then no stock can ever be treated as undervalued or overvalued. But value investors believe that the stocks are always either undervalued or overvalued or correctly valued. As I said information is no more remained an edge in investing but processing and coming at one judgment is an edge of investing in today's’ world of investing.
Value Investing Fundamental No. 4: Successful Investors Don't Follow the Herd
Value investors possess many characteristics of contrarians – they don't follow the herd. Not only do they reject the efficient-market hypothesis, but when everyone else is buying, they're often selling or standing back. When everyone else is selling, they're buying or holding. Value investors don't buy the most popular stocks of the day (because they're typically overpriced), but they are willing to invest in companies that aren't household names if the financials are good. They also take a second look at stocks that are household names when those stocks' prices have plummeted. Value investors are actually on the journey like an alchemist to find the gems in the mines of coal. What matters to the value investor is the intrinsic value of stock. There are two types of value investors, first who buy growth stocks and the second who buy junk stock. Junk stock buyer will actually liquidate the whole company assets and earn money out of it. Growth stock buyer sticks with the company for 10-15 years.
Value Investing Fundamental No. 5: Beta cannot be considered as a risk
Beta is nothing but the relative volatility of the stock with the market. According to academicians, there are two types of risk Viz. Systematic and unsystematic. Beta captures systematic risk. But value investors such as Warren Buffet openly criticized the concept of beta and Capital Asset Pricing Model (CAPM is used to calculate the cost of equity) as according to them cannot be a risk. The volatility of the stock cannot be a risk. According to warren buffet risk to business can be categorized into two types. First losing the invested capital and second is a business risk (uncertainty of revenue). Therefore, value investors generally prefer to assume the cost of equity rather than calculate it by the proposed wring method.
2 | P a g e h t t p : / / w w w . l i n k e d i n . c o m / i n / n i t i n k o l a p k a r
OVERVIEW OF INDIAN ECONOMY
With the strong political mandate, India is believed to be a bright spot in the global economic
slowdown. Where world economy is growing at the prospective rate of 2.4% (World Bank), India is
able to achieve a GDP growth of 7.6% in 2015-16 against 7.2% in 2014-15. Which particularly tells
us the potential of this consumption based emerging market. Expectations are running high because
of passionate and strong government. India is proved to be the fastest growing economy in the world.
During the year India has managed to achieve or restore economic stability by using various tools
such as current account deficit, fiscal deficit, and inflation level. Weak commodity prices are proved
to be the major force behind economic stability. The Indian government has achieved a fiscal deficit
target of 3.9% of GDP. Fiscal consolidation by the Indian government has helped India’s sovereign
ratings. Inflation which is measured by CPI remained around 5.5% for most of the part in 2015-16,
whereas WPI remained negative since November 2014. Lower inflation level is mainly due to weak
commodity prices.
Government’s agenda to improve Ease of Doing Business has actually improved FII’s in India which
is an indicator of trust of foreign investors on Indian economy. Also, government’s programs such as
“Jan Dhan Program” for financial inclusion and direct benefit transfer has helped Indian rural
economy. The Indian government has launched “Smart City” program under which hundred smart
cities will be built. Which will create immense employment opportunities in construction sector
consequently will boost demand.
Despite all this Indian agriculture sector has underperformed because of weak monsoon in last two
years. But a recent optimistic report by Institute of Meteorological Dept. has kindled hope in the
corporate world. Since a major chunk of the population depends on agriculture for their livelihood,
monsoon has become the biggest determinant of economic success. Also, the government has
taken various initiatives to invest in rural infrastructure by increasing budgetary support in the recent
union budget.
This year has ended on a strong note of NPAs by Indian banks. Major corporates and banks
remained under stress on account of bad debt problems; this, in turn, has an adverse impact on
private investments. The whole corporate world is hoping for GST bill but, the picture is still gloomy.
On the international front, weak commodity prices such as crude oil have adversely impacted major
crude producing countries in the middle east which in turn affected demand. Devaluation of Chinese
Yuan has made economist worry. The Indian rupee has depreciated significantly during 2015-16
from 62 to nearly 69 Rupees to the US dollar, but Indian economy could not capitalize this opportunity
because of a global slowdown. In fact, India is not the only state of the depreciating currency, it’s
because of strong US dollar.
Meanwhile, Warren Buffet’s MCAP/GDP valuation triggered fear on Dalal Street as India’s
MCAP/GDP ratio is 153 which is more than the threshold. That means market capitalization of Indian
companies is far more overvalued as compared to its GDP if we compare this ratio to other
3 | P a g e h t t p : / / w w w . l i n k e d i n . c o m / i n / n i t i n k o l a p k a r
economies. Indian economy is consumption-led economy witnessed by 1.25 billion populations.
Which gives a strong mandate to a foreign investor to invest in India. India is proved to be a fastest
growing state in the world.
Recent news of cabinet approval to the Seventh Pay Commission also kindled hope in the corporate
world as it promises to hike salary of central government employees (Nearly 1 crore employee) by
average 23.55%. Which can boost demand in urban India? But one more side of the coin in that it is
gone increase government burden by 1.07 lac crores which will increase fiscal deficit.
This year India has developed a new statistical method to calculate GDP number, but unfortunately
many renowned economists have raised concern about methodology. Recent BREXIT issue has
also shaken world’s stock markets as it triggers fear about the unity of European Union. Stocks like
TCS, TATA MOTORS stumbled on the day of the referendum as their 30-35% topline is contributed
by Britain. Many investors are suffering from uncertainty about new policy framework of exited Britain.
4 | P a g e h t t p : / / w w w . l i n k e d i n . c o m / i n / n i t i n k o l a p k a r
INDIAN PAINT INDUSTRY OVERVIEW
Indian paint industry has dramatically changed over the years as it moved forward from decorative
paints market to the more diversified seasonal market. There are many factors that helped for the
rapid growth of the Indian paint industry such as adoption of new technology, availability of an
innovative range of products, increased disposable income, rapid urbanization, immense
infrastructure investment. Indian paint industry has grown 12.5% and it is estimated that it will grow
at the rate of 14% CAGR till 2019-20.
Indian paint industry has now begun to look like FMCG industry where brand, distribution, and
innovative use of technology become important determinants of growth. Current market size of
Indian paint industry is estimated at 350 Billion Rupees and which can easily grow at the rate of 12-
13%. In India, the per capita consumption of paint is 4 kgs is very low as compared to the developed
nations. Therefore, it seems that Indian paint industry has an optimistic outlook as the Indian
economy is emerging. As the economy modernizes or develops the per capita consumption of paint
will increase.
Indian paint market is not fully organized as 35% of the paint market is controlled by unorganized
players. There are around 2000 units of small and medium capacity which control this unorganized
paint market. Asian Paints, Kansai Nerolac, Berger Paints, and ICI are top players in Indian paint
industry.
There are two broad categories which drive demand:
Decorative:
This category includes the major segments such as interior wall paints, exterior wall paints, wood
finishes, coatings, enamel and supporting products such as putty, primers, etc. Decorative paint
segment accounts for around 70% of Indian paint market. Asian Paints is the market leader in this
category. Mainly Household painting drives demand for decorative paints. Demand for decorative
paints is seasonal and it is highest in September to November. This category is price sensitive and
it provides higher margin to players as compared to industry paint.
Industrial:
There are three main segments in this category named automotive coatings, powder coatings, and
protective coatings. Kansai Nerolac is the market leader in this category. Industrial paint category
requires more technological innovations as compared to decorative paint category. Therefore, many
domestic players have tied up with foreign players capitalizing their technology.
On an average Indian paint, industry spends 55% of total expenditure for purchase of raw materials
(50% Petro-based derivatives). That is why paint industry is highly dependent on crude oil prices.
Decorative paints are expected to promise higher growth in near term given the favorable economic
conditions and sufficient monsoon. Although demand for industry paint is warm in past year as it is
5 | P a g e h t t p : / / w w w . l i n k e d i n . c o m / i n / n i t i n k o l a p k a r
highly dependent on automobile sector. Weak monsoon in last two years has affected automobile
industry and consequently industry paint category.
Decorative paint segment is also dependent on the housing market. If we take current year inflation
of around 5.5% and interest rates into consideration, Indian paint industry looks promising. Last three
years were bad for the housing market because of high inflation and high-interest rates but now the
housing market is getting revived given the best monetary policies ever.
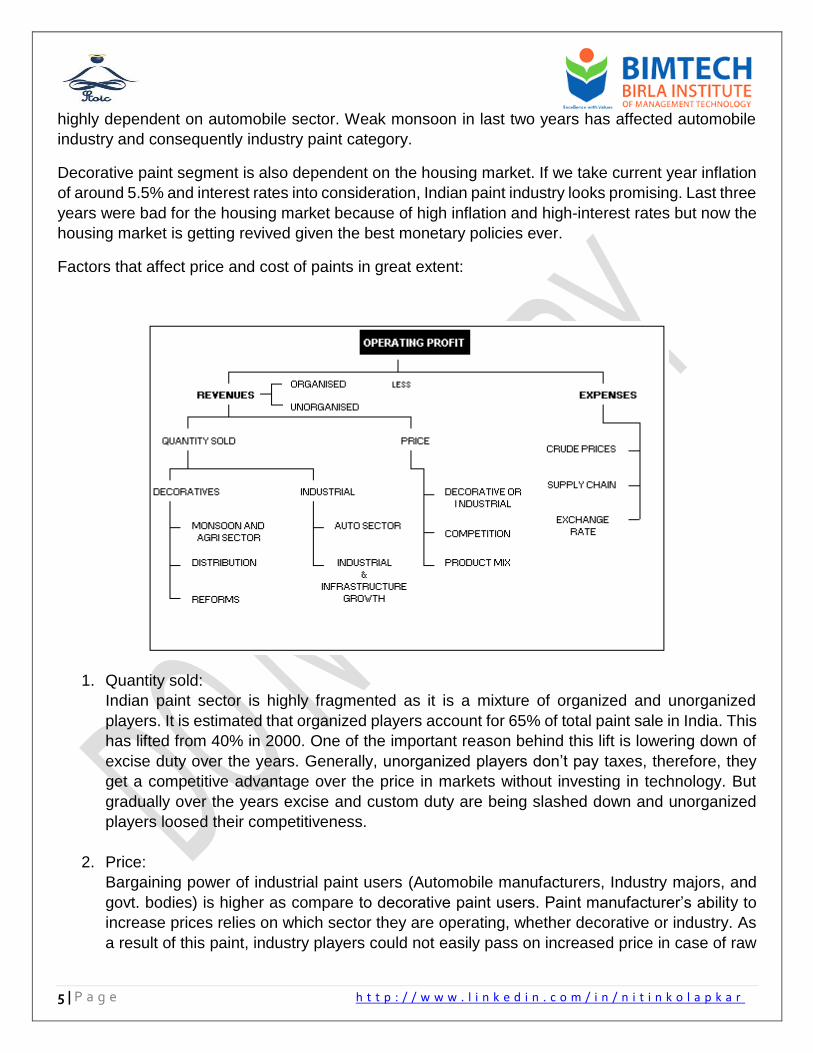
Factors that affect price and cost of paints in great extent:
1. Quantity sold:
Indian paint sector is highly fragmented as it is a mixture of organized and unorganized
players. It is estimated that organized players account for 65% of total paint sale in India. This
has lifted from 40% in 2000. One of the important reason behind this lift is lowering down of
excise duty over the years. Generally, unorganized players don’t pay taxes, therefore, they
get a competitive advantage over the price in markets without investing in technology. But
gradually over the years excise and custom duty are being slashed down and unorganized
players loosed their competitiveness.
2. Price:
Bargaining power of industrial paint users (Automobile manufacturers, Industry majors, and
govt. bodies) is higher as compare to decorative paint users. Paint manufacturer’s ability to
increase prices relies on which sector they are operating, whether decorative or industry. As
a result of this paint, industry players could not easily pass on increased price in case of raw
6 | P a g e h t t p : / / w w w . l i n k e d i n . c o m / i n / n i t i n k o l a p k a r
material price escalation. Economies of scale have enormous importance in industry paint
manufacturing as compare to decorative paint segment.
However decorative paint industry players can easily raise prices given its brand, product mix.
The decorative paint industry is highly competitive and seasonal. Since the demand is
seasonal, many players lower down prices of decorative paints in festive seasons. The dealer
tinting machine has played a vital role in decorative paint industry in recent years as it has
helped to increase customer engagement in the selection of colors. Therefore, this sector is
highly investing in brand building.
3. Cost:
Crude prices and dollar rate:
Raw material cost accounts for around 50% of total gross expenditure. There are more than
three hundred raw material used in the manufacturing of paints with Titanium Dioxide account
for more than 30% of sales. While some are crude derivatives. In the manufacturing of paint,
crude is used as a source of energy. Therefore, whenever crude prices increase in
international market paint manufactures feel the pressure.
Since Titanium Dioxide in India is of inferior quality, paint manufacturers import it. Therefore,
rupee-dollar movement plays an important role in cost structure. Another important factor is
the strength of supply chain of a company. Since this industry is highly working capital
intensive (300 raw materials) efficient distribution network can easily help the player to
achieve control on cost.
Indian paint sector is now moving towards FMCG status from commodity image.
7 | P a g e h t t p : / / w w w . l i n k e d i n . c o m / i n / n i t i n k o l a p k a r
ASIAN PAINTS (NSE CODE: ASIANPAINT, BSE CODE: 500820,
CMP:980, FV: ₹ 1)
Asian Paints Limited (the ‘Company’) is a public limited Company incorporated under the Indian Companies Act 1913. The Company is engaged in the business of manufacturing, selling, and distribution of paints, coatings, products related to home décor, bath fittings and providing of related services. Asian Paints was established in 1942 as a partnership firm. Over the course of 25 years, Asian Paints has achieved many milestones. Today Asian Paints is India’s largest player and Asia’s second largest player in paint industry with a turnover of 155 billion rupees. It has operations in 19 countries and has 26 manufacturing facilities, servicing consumers in over 65 countries. Asian Paints is the market leader in paints since 1967. Especially in decorative paints, Asian Paints has more than 50% market share in Indian paint market. Asian paint has a range of products in decorative as well as industry segment.
Besides Asian Paints the company operates in the whole world through its subsidiaries. To name a
few Berger International Limited, Apco Coatings, SCIB Paints, Taubmans and Kadisco. Asian Paints
has consistently made money for shareholders and have a professional reputation in the corporate
world.
The company is mainly present in the decorative segment, which contributes over 75% of its sales. The company features among the top 10 decorative paint players globally. It has a large distribution network of over 25,000 dealers and 27,000 'Colour World' outlets across India. The company's international revenue comes from countries in the Caribbean, Middle East, South Pacific and Asian regions.
In decorative paints, Asian Paints has a presence in interior wall finishes, exterior wall finishes,
enamels and wood finishes. Asian Paints has contributed a lot to the industry by its technologically
prudent innovations such as Colour Worlds (Dealer Tinting System), Home Solution (Painting
Solution Service) and Royal Play Special Effect Paints, etc. Asian Paints has always remained ahead
of the competitors in identifying consumer sentiments. They set a trend of consumer involvement in
the selection of paints in the paint industry. They came up with Signature Stores in Mumbai, Delhi,
and Kolkata, where consumers are educated about colors and how colors can change their dream
homes. They also set up AP Homes a multi-category store which provides a complete solution for
home décor (Kitchen, bath fittings, sanitary wares, paints, furnishings) in Coimbatore (Chennai).
Asian Paint had tied up with Henkel Adhesives, Germany for manufacturing and distributing Loctite
brand of adhesives. Asian Paints got success in vertical integration for manufacturing Phthalic
Anhydride and Pentaerythritol, which is used in paint manufacturing process. Asian Paints also
operates through PPG Asian Paints PVT LTD (50:50 JV between Asian Paints and PPG Inc, USA,
one of the largest automotive coatings manufacturer in the world) in order to service exponentially
growing Indian automotive coating market.
Asian Paints is highly motivated to enter and capture the home décor market. In order to do so, it
has acquired 51% stake in Sleek Group, a leading kitchen solution provider and Ess Ess Bathroom
Products Ltd., a prominent player in bath segment.
8 | P a g e h t t p : / / w w w . l i n k e d i n . c o m / i n / n i t i n k o l a p k a r
Recently, the company has launched ‘Smart Kitchen’ range for easy installation and design under
the Sleek brand. In the Bath space, it has introduced ‘Royale’ – premium range of bath fittings as
well as ‘Bathsense’ – sanitary ware range of products for the evolving consumer.
The company has a dedicated Group R&D Centre in India for paints and has been one of the
pioneering companies in India for effectively harnessing Information Technology solutions to
maximize efficiency in operations.
AP is successful in identifying consumer sentiment, in lieu of this AP has launched unique color
visualizer app that allows the customer to experience colors and décor. This app also provides color
consultancy to the buyers which offer a unique value proposition in the market. The company is now
preparing to rollout full-fledged ERP software which will give real-time information about inventory
holding at the dealer’s stores and efficiently managing inventory as production. Also, ERP can be
effectively used for the sales forecasting, data mining, and analysis purpose. ERP rollout will
definitely solve the logistics problems that AP is currently facing.
Crisil has rated Asian Paints for long-term debentures, cash credit and working capital loan as an
AAA company.
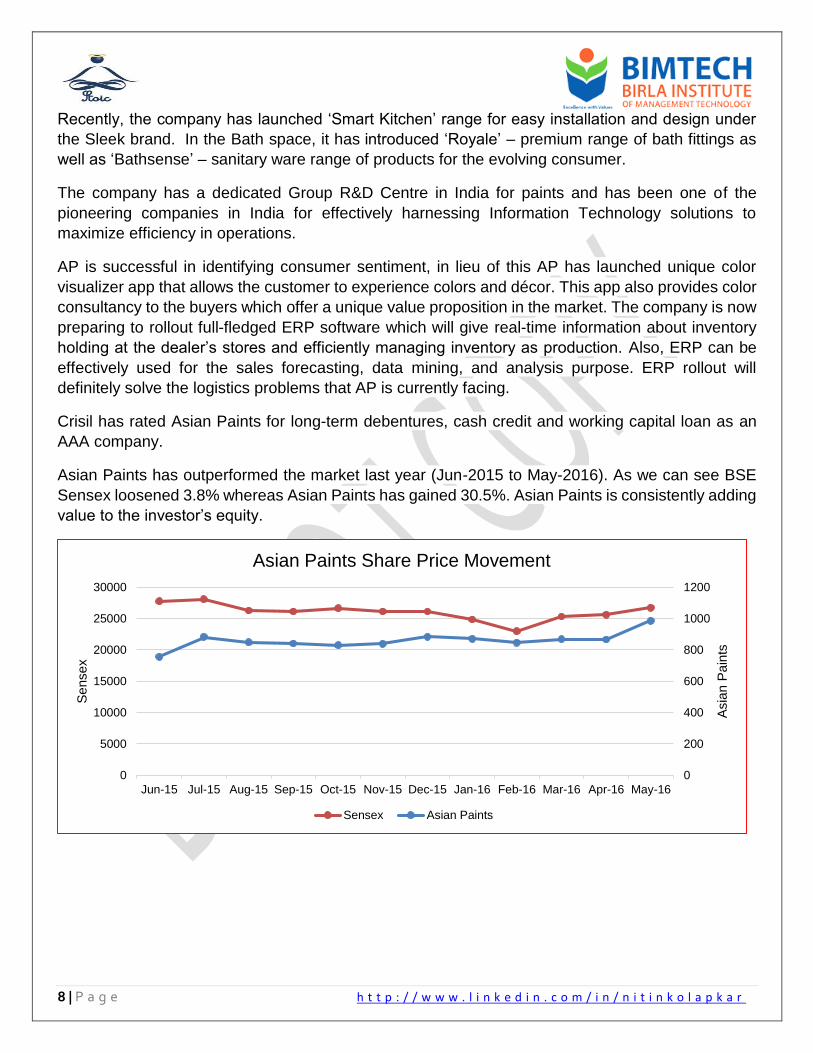
Asian Paints has outperformed the market last year (Jun-2015 to May-2016). As we can see BSE
Sensex loosened 3.8% whereas Asian Paints has gained 30.5%. Asian Paints is consistently adding
value to the investor’s equity.
0
200
400
600
800
1000
1200
0
5000
10000
15000
20000
25000
30000
Jun-15 Jul-15 Aug-15 Sep-15 Oct-15 Nov-15 Dec-15 Jan-16 Feb-16 Mar-16 Apr-16 May-16
Asia
n P
ain
ts
Sensex
Asian Paints Share Price Movement
Sensex Asian Paints
9 | P a g e h t t p : / / w w w . l i n k e d i n . c o m / i n / n i t i n k o l a p k a r
PERFORMANCE HIGHLIGHTS
79648960
1041911649
12646
2011-12 2012-13 2013-14 2014-15 2015-16
Net Revenue from Operations(₹ in Crores)
9581050
11691327
1597
2011-12 2012-13 2013-14 2014-15 2015-16
PAT(₹ in Crores)
13511551
17802015
2483
16.96%
17.31%17.08%
17.29%
19.64%
15.50%
16.00%
16.50%
17.00%
17.50%
18.00%
18.50%
19.00%
19.50%
20.00%
0
500
1000
1500
2000
2500
3000
2011-12 2012-13 2013-14 2014-15 2015-16
EB
ITD
A M
AR
GIN
EB
ITD
A
EBITDA & EBITDA Margins (%)(₹ in Crores)
EBITDA EBITDA MARGIN
880.48
1081.12
1370.89
1143.60
2045.69
2011-12 2012-13 2013-14 2014-15 2015-16
Cash Generated From Operation
(₹ in Crores)
31056
4713952559
7782083297
2011-12 2012-13 2013-14 2014-15 2015-16
Market Capitalisation(₹ in Crores)
10 | P a g e h t t p : / / w w w . l i n k e d i n . c o m / i n / n i t i n k o l a p k a r
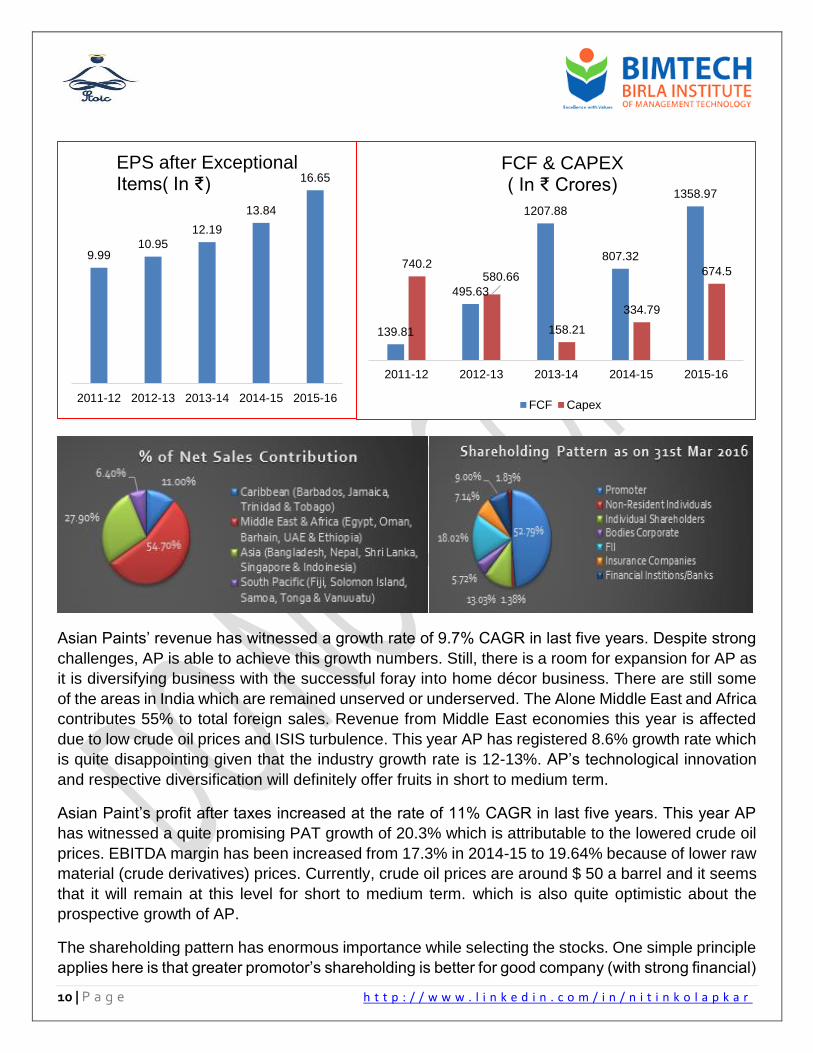
Asian Paints’ revenue has witnessed a growth rate of 9.7% CAGR in last five years. Despite strong
challenges, AP is able to achieve this growth numbers. Still, there is a room for expansion for AP as
it is diversifying business with the successful foray into home décor business. There are still some
of the areas in India which are remained unserved or underserved. The Alone Middle East and Africa
contributes 55% to total foreign sales. Revenue from Middle East economies this year is affected
due to low crude oil prices and ISIS turbulence. This year AP has registered 8.6% growth rate which
is quite disappointing given that the industry growth rate is 12-13%. AP’s technological innovation
and respective diversification will definitely offer fruits in short to medium term.
Asian Paint’s profit after taxes increased at the rate of 11% CAGR in last five years. This year AP
has witnessed a quite promising PAT growth of 20.3% which is attributable to the lowered crude oil
prices. EBITDA margin has been increased from 17.3% in 2014-15 to 19.64% because of lower raw
material (crude derivatives) prices. Currently, crude oil prices are around $ 50 a barrel and it seems
that it will remain at this level for short to medium term. which is also quite optimistic about the
prospective growth of AP.
The shareholding pattern has enormous importance while selecting the stocks. One simple principle
applies here is that greater promotor’s shareholding is better for good company (with strong financial)
9.9910.95
12.19
13.84
16.65
2011-12 2012-13 2013-14 2014-15 2015-16
EPS after ExceptionalItems( In ₹)
139.81
495.63
1207.88
807.32
1358.97
740.2580.66
158.21
334.79
674.5
2011-12 2012-13 2013-14 2014-15 2015-16
FCF & CAPEX( In ₹ Crores)
FCF Capex

11 | P a g e h t t p : / / w w w . l i n k e d i n . c o m / i n / n i t i n k o l a p k a r
and less promotor shareholding is considered as the worst for bad companies (with weak financials).
AP’s promoters’ shareholding is 53% which is quite promising. Also, a best-practiced value investor
who generally in pursuit of finding hidden gems ignore the stocks which have a mutual fund, FI’s
shareholding in them because they consider that this stock is already identified by many investors.
FII’s holding stands at 18% which clearly shows their trust on AP and likely on Indian paint industry.
But risk-averse investor generally likes the stocks which are held by FI’s, mutual funds, etc. since
they consider it as a safe stock to invest.
12 | P a g e h t t p : / / w w w . l i n k e d i n . c o m / i n / n i t i n k o l a p k a r
FINANCIAL RATIO ANALYSIS
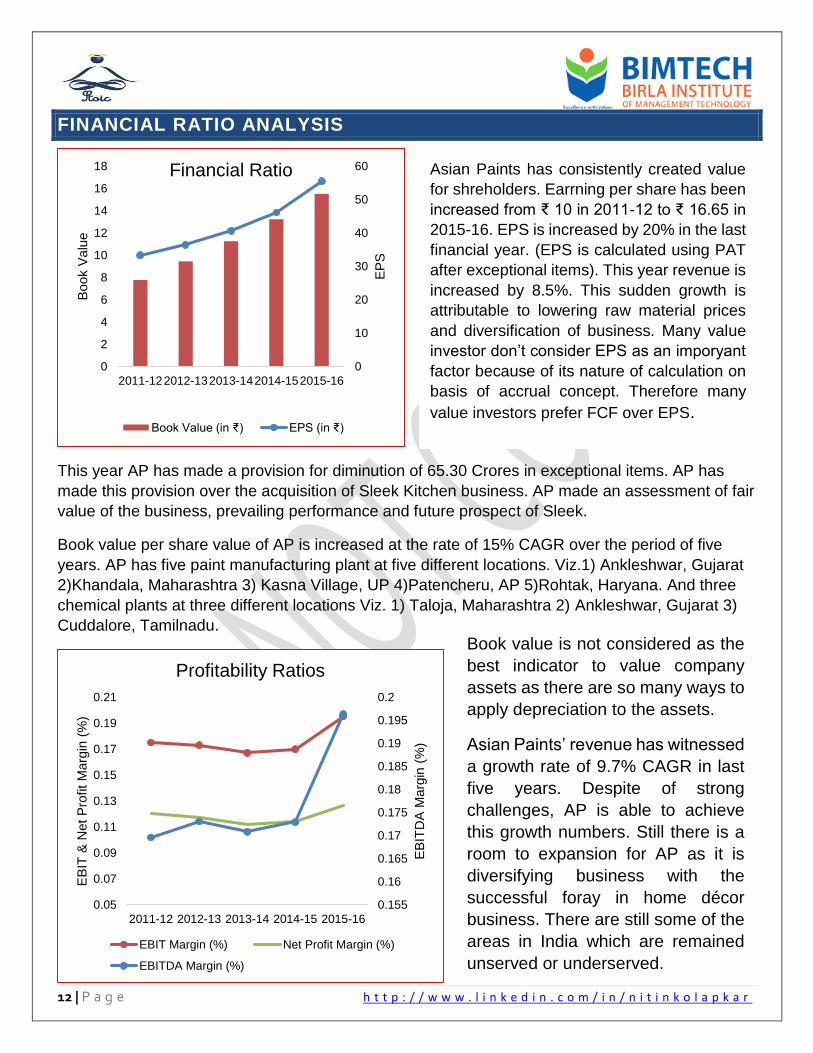
This year AP has made a provision for diminution of 65.30 Crores in exceptional items. AP has
made this provision over the acquisition of Sleek Kitchen business. AP made an assessment of fair
value of the business, prevailing performance and future prospect of Sleek.
Book value per share value of AP is increased at the rate of 15% CAGR over the period of five
years. AP has five paint manufacturing plant at five different locations. Viz.1) Ankleshwar, Gujarat
2)Khandala, Maharashtra 3) Kasna Village, UP 4)Patencheru, AP 5)Rohtak, Haryana. And three
chemical plants at three different locations Viz. 1) Taloja, Maharashtra 2) Ankleshwar, Gujarat 3)
Cuddalore, Tamilnadu.
0
10
20
30
40
50
60
0
2
4
6
8
10
12
14
16
18
2011-122012-132013-142014-152015-16E
PS
Book V
alu
e
Financial Ratio
Book Value (in ₹) EPS (in ₹)
0.155
0.16
0.165
0.17
0.175
0.18
0.185
0.19
0.195
0.2
0.05
0.07
0.09
0.11
0.13
0.15
0.17
0.19
0.21
2011-12 2012-13 2013-14 2014-15 2015-16
EB
ITD
A M
arg
in (
%)
EB
IT &
Net
Pro
fit
Marg
in (
%)
Profitability Ratios
EBIT Margin (%) Net Profit Margin (%)
EBITDA Margin (%)
Asian Paints has consistently created value
for shreholders. Earrning per share has been
increased from ₹ 10 in 2011-12 to ₹ 16.65 in
2015-16. EPS is increased by 20% in the last
financial year. (EPS is calculated using PAT
after exceptional items). This year revenue is
increased by 8.5%. This sudden growth is
attributable to lowering raw material prices
and diversification of business. Many value
investor don’t consider EPS as an imporyant
factor because of its nature of calculation on
basis of accrual concept. Therefore many
value investors prefer FCF over EPS.
Book value is not considered as the
best indicator to value company
assets as there are so many ways to
apply depreciation to the assets.
Asian Paints’ revenue has witnessed
a growth rate of 9.7% CAGR in last
five years. Despite of strong
challenges, AP is able to achieve
this growth numbers. Still there is a
room to expansion for AP as it is
diversifying business with the
successful foray in home décor
business. There are still some of the
areas in India which are remained
unserved or underserved.
13 | P a g e h t t p : / / w w w . l i n k e d i n . c o m / i n / n i t i n k o l a p k a r
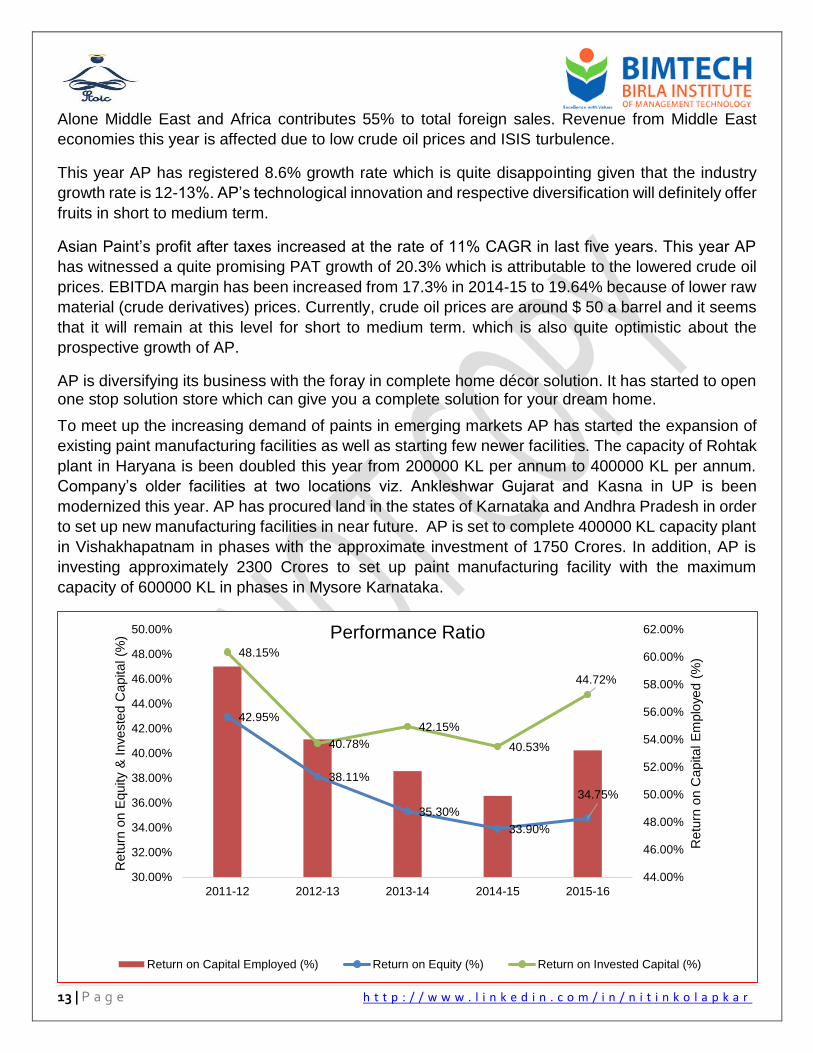
Alone Middle East and Africa contributes 55% to total foreign sales. Revenue from Middle East
economies this year is affected due to low crude oil prices and ISIS turbulence.
This year AP has registered 8.6% growth rate which is quite disappointing given that the industry
growth rate is 12-13%. AP’s technological innovation and respective diversification will definitely offer
fruits in short to medium term.
Asian Paint’s profit after taxes increased at the rate of 11% CAGR in last five years. This year AP
has witnessed a quite promising PAT growth of 20.3% which is attributable to the lowered crude oil
prices. EBITDA margin has been increased from 17.3% in 2014-15 to 19.64% because of lower raw
material (crude derivatives) prices. Currently, crude oil prices are around $ 50 a barrel and it seems
that it will remain at this level for short to medium term. which is also quite optimistic about the
prospective growth of AP.
AP is diversifying its business with the foray in complete home décor solution. It has started to open one stop solution store which can give you a complete solution for your dream home.
To meet up the increasing demand of paints in emerging markets AP has started the expansion of
existing paint manufacturing facilities as well as starting few newer facilities. The capacity of Rohtak
plant in Haryana is been doubled this year from 200000 KL per annum to 400000 KL per annum.
Company’s older facilities at two locations viz. Ankleshwar Gujarat and Kasna in UP is been
modernized this year. AP has procured land in the states of Karnataka and Andhra Pradesh in order
to set up new manufacturing facilities in near future. AP is set to complete 400000 KL capacity plant
in Vishakhapatnam in phases with the approximate investment of 1750 Crores. In addition, AP is
investing approximately 2300 Crores to set up paint manufacturing facility with the maximum
capacity of 600000 KL in phases in Mysore Karnataka.
42.95%
38.11%
35.30%
33.90%
34.75%
48.15%
40.78%
42.15%
40.53%
44.72%
44.00%
46.00%
48.00%
50.00%
52.00%
54.00%
56.00%
58.00%
60.00%
62.00%
30.00%
32.00%
34.00%
36.00%
38.00%
40.00%
42.00%
44.00%
46.00%
48.00%
50.00%
2011-12 2012-13 2013-14 2014-15 2015-16
Retu
rn o
n C
apital E
mplo
yed (
%)
Retu
rn o
n E
quity
& I
nveste
d C
apital (%
) Performance Ratio
Return on Capital Employed (%) Return on Equity (%) Return on Invested Capital (%)
14 | P a g e h t t p : / / w w w . l i n k e d i n . c o m / i n / n i t i n k o l a p k a r
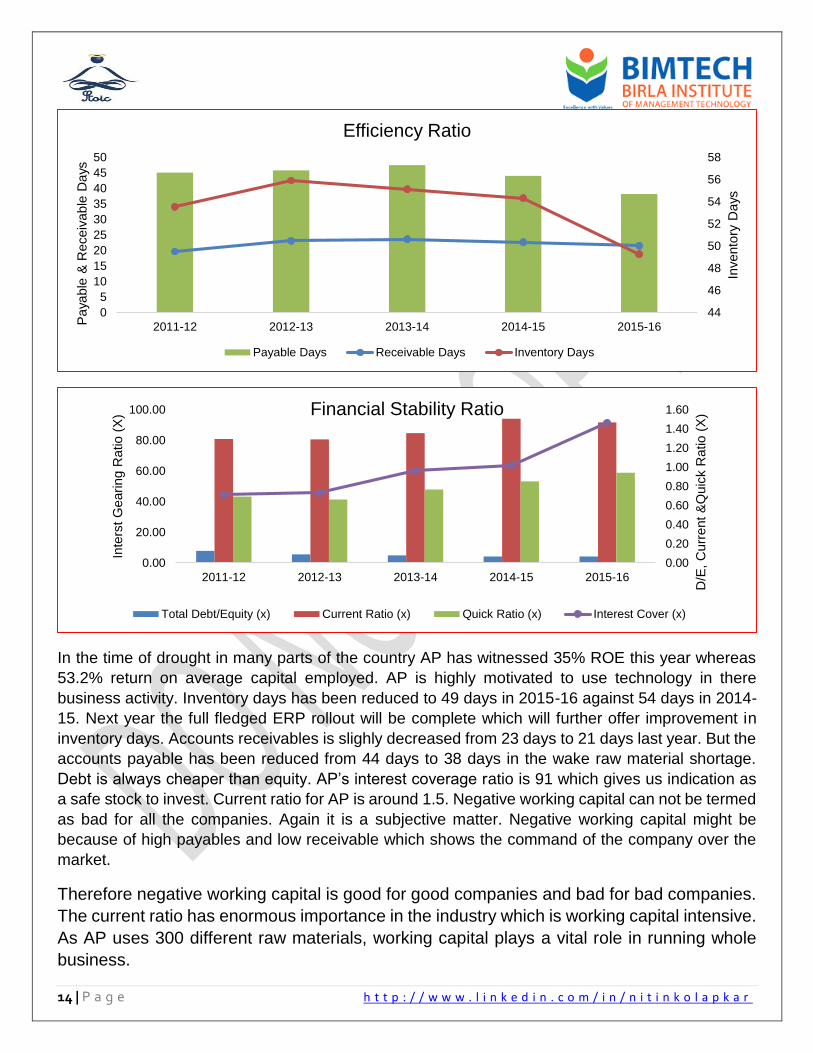
In the time of drought in many parts of the country AP has witnessed 35% ROE this year whereas
53.2% return on average capital employed. AP is highly motivated to use technology in there
business activity. Inventory days has been reduced to 49 days in 2015-16 against 54 days in 2014-
15. Next year the full fledged ERP rollout will be complete which will further offer improvement in
inventory days. Accounts receivables is slighly decreased from 23 days to 21 days last year. But the
accounts payable has been reduced from 44 days to 38 days in the wake raw material shortage.
Debt is always cheaper than equity. AP’s interest coverage ratio is 91 which gives us indication as
a safe stock to invest. Current ratio for AP is around 1.5. Negative working capital can not be termed
as bad for all the companies. Again it is a subjective matter. Negative working capital might be
because of high payables and low receivable which shows the command of the company over the
market.
Therefore negative working capital is good for good companies and bad for bad companies.
The current ratio has enormous importance in the industry which is working capital intensive.
As AP uses 300 different raw materials, working capital plays a vital role in running whole
business.
44
46
48
50
52
54
56
58
0
5
10
15
20
25
30
35
40
45
50
2011-12 2012-13 2013-14 2014-15 2015-16
Invento
ry D
ays
Paya
ble
& R
eceiv
able
Days
Efficiency Ratio
Payable Days Receivable Days Inventory Days
0.00
0.20
0.40
0.60
0.80
1.00
1.20
1.40
1.60
0.00
20.00
40.00
60.00
80.00
100.00
2011-12 2012-13 2013-14 2014-15 2015-16
D/E
, C
urr
ent
&Q
uic
k R
atio (
X)
Inte
rst
Gearing R
atio (
X) Financial Stability Ratio
Total Debt/Equity (x) Current Ratio (x) Quick Ratio (x) Interest Cover (x)
15 | P a g e h t t p : / / w w w . l i n k e d i n . c o m / i n / n i t i n k o l a p k a r
PORTER’S FIVE FORCES ANALYSIS
BARGAINING POWER OF SUPPLIERS
The paint industry is basically working capital intensive as it uses more than 300 raw materials in the
manufacturing. Among them, Titanium Dioxide is major content. After 2008-09 crisis, all the Titanium
Dioxide plant present is the USA and Europe forced to close then. Till now the global supply of TiO2
is not able to meet up with the growing demand. China is one biggest producer of TiO2. But Chinese
TiO2 is of inferior quality to USA’s TiO2. DUPONT is a major player available in the USA which
manufactures high-quality TiO2. Other raw material components are crude derivatives; the price of
crude derivatives depends on international crude prices. AP is the only player in paint industry who
manufactures Phthalic Anhydride which is an important raw material required in paint manufacturing.
In fact, AP is thriving to achieve full fledge vertical integration. Therefore, overall bargaining power
of suppliers in mediocre.
BARGAINING POWER OF THE BUYERS
The end user of this paints are industry are corporates and households. Decorative paint buyers
have much more options available in the market. Over the years Asian Paints increased consumer
involvement in the selection of decorative paints. Dealer tinting machine is one of the disruptions
that helped Asian paints achieve this position. Decorative paint buyers are price sensitive which
pressures paint manufactures. They have many more options available in the market. Understanding
this condition Asian Paint in past made huge investment to create a brand. Asian Paint has a
reputation to run a successful marketing campaigns.
Industrial paint segment is high revenue low margin business. The buyer of industrial paints is
generally automotive industries. Very prudently they compare prices and select their vendor. But
fortunately industrial paint business would have to run on economies of scale principle. And very few
players achieved this. Industry paints contribute 30% to the topline of Asian Paints. Therefore,
bargaining power of Asian Paints buyers is medium.
THREAT OF NEW ENTRANT
The paint industry is working capital intensive industry as it requires 300 different raw materials to
manufacture paint. Technological innovation in paint industry is critical factor to witness success.
Indian paint market is dominated by 5-6 major players as they have made huge investments in brand
building, distribution network, research, and development. Scarce availability of raw material is also
a critical factor while establishing new paint industry. In fact, technology, intensive working capital,
brand equity, supply chain are the critical factors which create barriers to the new entrant. Therefore,
the threat of new entrant is very low in the paint industry.
THREAT OF SUBSTITUTE
16 | P a g e h t t p : / / w w w . l i n k e d i n . c o m / i n / n i t i n k o l a p k a r
In rural areas lime wash is used as a substitute. Another alternative to the wall paint is wallpaper.
But the price of the wallpaper is too high as compared to the paints. And now there are many varieties
available in the market which can easily emulate the wallpapers. By considering this factors Asian
Paints forayed into home décor space where they are developing a complete solution to the house
décor. Therefore, the threat of substitute is very low.
COMPETITIVE RIVALRY
Asian Paints is the dominant player in the market with the market share more than 50%. About 80%
of the organized paint market is contributed by only three players. AP is dominant in decorative paint
segment. Where AP has actually capitalized the innovative technologies and not the product. AP’s
R & D Centre are renowned and world class. This year AP got success in registering five patents.
AP is the only paint company which manufactures phthalic Anhydride which is an important raw
material. In fact, AP is thriving to achieve full fledge vertical integration. The unorganized industry
players are small and don’t use much technology. In industry paint segment Kansai Nerolac is
dominant. The industrial paint industry is technology intensive which demands continuous
technology up gradation. The competitive rivalry for AP is medium.
17 | P a g e h t t p : / / w w w . l i n k e d i n . c o m / i n / n i t i n k o l a p k a r
INTRINSIC VALUATION (DCF MODEL)
“Intrinsic value” is the worth of an enterprise to one who owns it “for keeps.” Logically, it must be based on the cash flow that would go to a continuing owner over the long run, as distinct from a speculative assessment of its resale value i.e. book value. DCF model can be used for calculating the intrinsic value of an asset or business. In Discounted Cash Flow model, we use FCF because FCF is what we finally get out of that business. The discounting factor that we use in DCF is weighted average cost of capital (WACC).
WEIGHTED AVERAGE COST OF CAPITAL (WACC)
Year 2011-12 2012-13 2013-14 2014-15 2015-16
Long Term Borrowings 201.64 266.67 283.82 285.12 335.15
Short Term Borrowings 110.51 0.00 0.00 0.00 0.00
Total Borrowings 312.15 266.67 283.82 285.12 335.15
Interest Expenses 31.31 33.93 28.97 31.16 27.03
Cost of Debt 10.03% 12.72% 10.21% 10.93% 8.07%
Average cost of Debt= 10.39%
Calculation of cost of equity took a different turn in value investing the world from the academics. Academics taught to calculate the cost of equity using CAPM method. But many value investors like warren Buffet criticized the concept of Beta (β). The volatility of the stock cannot be categorized as a risk. According to academicians, more risk gives more return. But many studies suggests that high or low beta can’t determine the returns. Take a simple example of a stock. If a stock whose intrinsic value is 1 rupee and you are getting the same stocks at the price of 0.8 rupees and 0.5 rupees on different occasions. Which stock will you buy? According to the concept of beta the stock which you are getting at 0.5 rupees is less risky as compare to 0.8-rupee stock. But unfortunately both the stocks are same. The value investor cannot leave the opportunity to buy 0.5-rupee stock. According to academician risk is measured as a beta, which is nothing but the relative volatility of stock price with the market. Value investors consider it as a flawed concept. According to the value, investor business has two types of risk. Viz. the first risk of permanent capital loss and the other risk is that there’s just an inadequate return on the kind of capital we put in. “The real risk that an investor must assess is whether his aggregate after-tax receipts from an investment (including those he receives on sale) will over his prospective holding period, give him at least as much purchasing power as he had, to begin with, plus a modest rate of interest on that initial stake.”- warren Buffet According to a value investor, you don’t need to take the risk to earn money which is contradictory to the concept of beta which tells if you take more risk then only you will get more returns.
18 | P a g e h t t p : / / w w w . l i n k e d i n . c o m / i n / n i t i n k o l a p k a r
Therefore, value investors generally assume the cost of equity rather than calculating it by the CAPM method. Here we are assuming the cost of equity to be 16% which is 5 percentage point more as compared to the cost of debt as equity investor takes more risk as compared to debtors. Taking into consideration AP’s business model, future prospect, various risk parameters it becomes easy to assume how much return do I expect from such a stock. Indian housing market is about to revive in near short-term gave the prudent monetary policy by RBI. Recent cabinet approval to the seventh pay commission has kindled hope that it will generate demand and money circulation in the market. Middle east economies are also on the verge of revival as crude oil prices regaining their shape. Recent Indian Meteorological Department’s report predicts better than expected monsoon this year which will revive the rural economy in the short run. Inflation is at all time low around 5.5%. AP is diversifying its business with the foray in complete home décor solution. It has started to open one stop solution store which can give you a complete solution for your dream home. To meet up the increasing demand of paints in emerging markets AP has started the expansion of existing paint manufacturing facilities as well as starting few newer facilities. The capacity of Rohtak plant in Haryana is been doubled this year from 200000 KL per annum to 400000 KL per annum. Company’s older facilities at two locations viz. Ankleshwar Gujarat and Kasna in UP is been modernized this year. AP has procured land in the states of Karnataka and Andhra Pradesh in order to set up new manufacturing facilities in near future. AP is set to complete 400000 KL capacity plant in Vishakhapatnam in phases with the approximate investment of 1750 Crores. In addition, AP is investing approximately 2300 Crores to set up paint manufacturing facility with the maximum capacity of 600000 KL in phases in Mysore Karnataka.
Component of Capital Structure (%) Weightage of capital raised
Cost of Debt 10.39% 6%
Cost of Equity 16% 94%
WACC 15.65%
Year / Rs Crore 2012 2013 2014 2015 2016
Net cash (used in) / generated from operating activities 880.48 1081.12 1370.89 1143.6 2045.69
Payment for purchase of fixed assets -740.67 -585.49 -163.01 -336.28 -686.72
Sale of fixed assets 0.47 4.83 4.8 1.49 12.22
Free Cash Flow 139.81 495.63 1207.88 807.32 1358.97
FCF of AP is increased with the rate of 57% CAGR. In last financial year, FCF is been increased by 68%. Assuming AP’s FCF will increase at the rate of 35% for next five years and 20% there onwards for next five years. And calculating the terminal value on the basis of perpetual growth model at the rate of 12%. Here we have forecasted FCF for next 10 years.
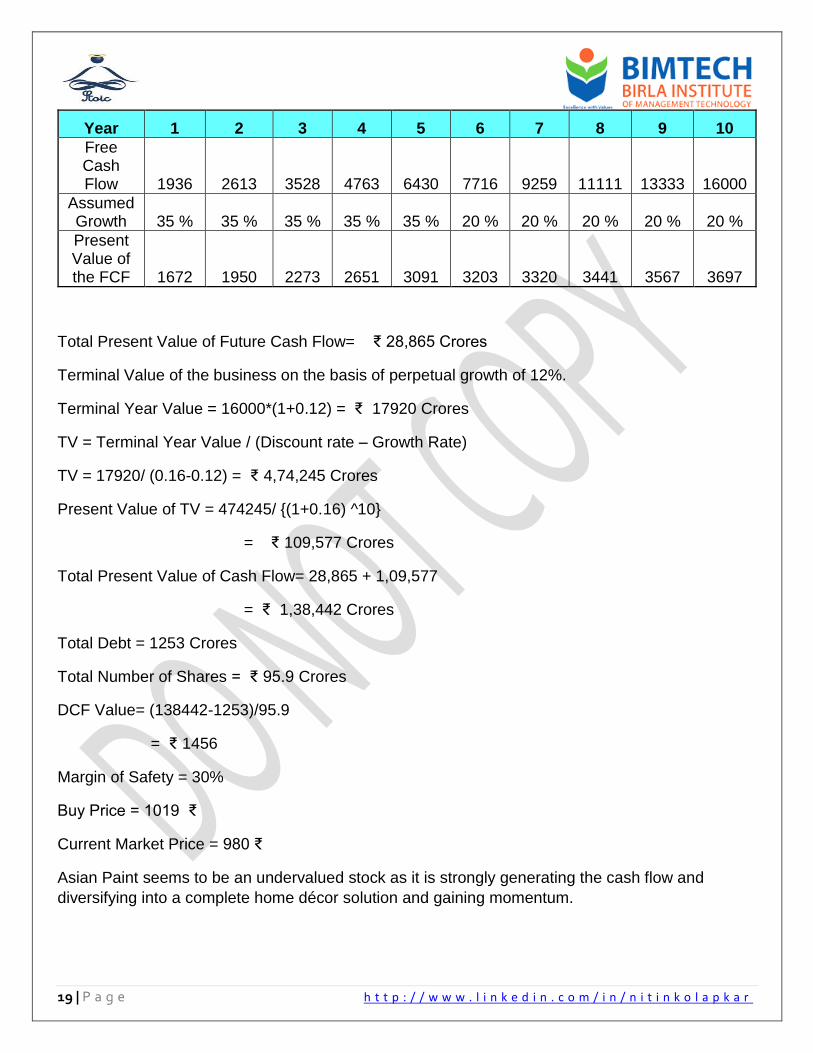
19 | P a g e h t t p : / / w w w . l i n k e d i n . c o m / i n / n i t i n k o l a p k a r
Year 1 2 3 4 5 6 7 8 9 10
Free Cash Flow 1936 2613 3528 4763 6430 7716 9259 11111 13333 16000
Assumed Growth 35 % 35 % 35 % 35 % 35 % 20 % 20 % 20 % 20 % 20 %
Present Value of the FCF 1672 1950 2273 2651 3091 3203 3320 3441 3567 3697
Total Present Value of Future Cash Flow= ₹ 28,865 Crores
Terminal Value of the business on the basis of perpetual growth of 12%.
Terminal Year Value = 16000*(1+0.12) = ₹ 17920 Crores
TV = Terminal Year Value / (Discount rate – Growth Rate)
TV = 17920/ (0.16-0.12) = ₹ 4,74,245 Crores
Present Value of TV = 474245/ {(1+0.16) ^10}
= ₹ 109,577 Crores
Total Present Value of Cash Flow= 28,865 + 1,09,577
= ₹ 1,38,442 Crores
Total Debt = 1253 Crores
Total Number of Shares = ₹ 95.9 Crores
DCF Value= (138442-1253)/95.9
= ₹ 1456
Margin of Safety = 30%
Buy Price = 1019 ₹
Current Market Price = 980 ₹
Asian Paint seems to be an undervalued stock as it is strongly generating the cash flow and
diversifying into a complete home décor solution and gaining momentum.
20 | P a g e h t t p : / / w w w . l i n k e d i n . c o m / i n / n i t i n k o l a p k a r
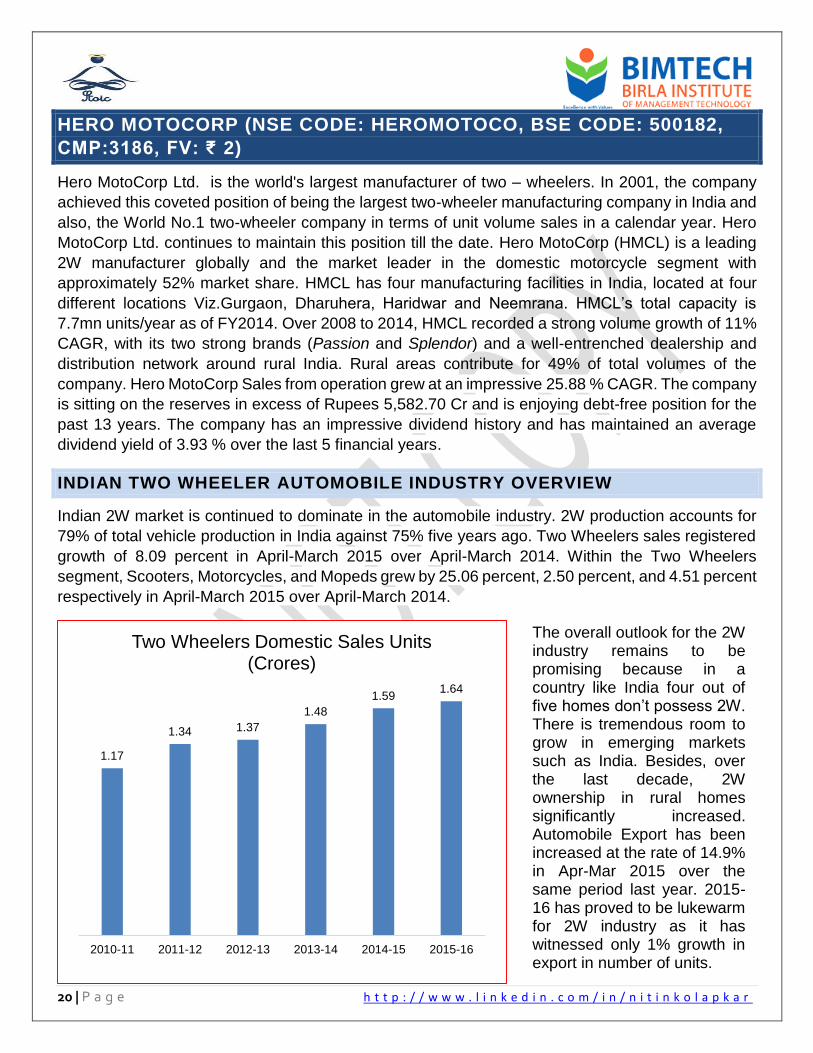
HERO MOTOCORP (NSE CODE: HEROMOTOCO, BSE CODE: 500182,
CMP:3186, FV: ₹ 2)
Hero MotoCorp Ltd. is the world's largest manufacturer of two – wheelers. In 2001, the company
achieved this coveted position of being the largest two-wheeler manufacturing company in India and
also, the World No.1 two-wheeler company in terms of unit volume sales in a calendar year. Hero
MotoCorp Ltd. continues to maintain this position till the date. Hero MotoCorp (HMCL) is a leading
2W manufacturer globally and the market leader in the domestic motorcycle segment with
approximately 52% market share. HMCL has four manufacturing facilities in India, located at four
different locations Viz.Gurgaon, Dharuhera, Haridwar and Neemrana. HMCL’s total capacity is
7.7mn units/year as of FY2014. Over 2008 to 2014, HMCL recorded a strong volume growth of 11%
CAGR, with its two strong brands (Passion and Splendor) and a well-entrenched dealership and
distribution network around rural India. Rural areas contribute for 49% of total volumes of the
company. Hero MotoCorp Sales from operation grew at an impressive 25.88 % CAGR. The company
is sitting on the reserves in excess of Rupees 5,582.70 Cr and is enjoying debt-free position for the
past 13 years. The company has an impressive dividend history and has maintained an average
dividend yield of 3.93 % over the last 5 financial years.
INDIAN TWO WHEELER AUTOMOBILE INDUSTRY OVERVIEW
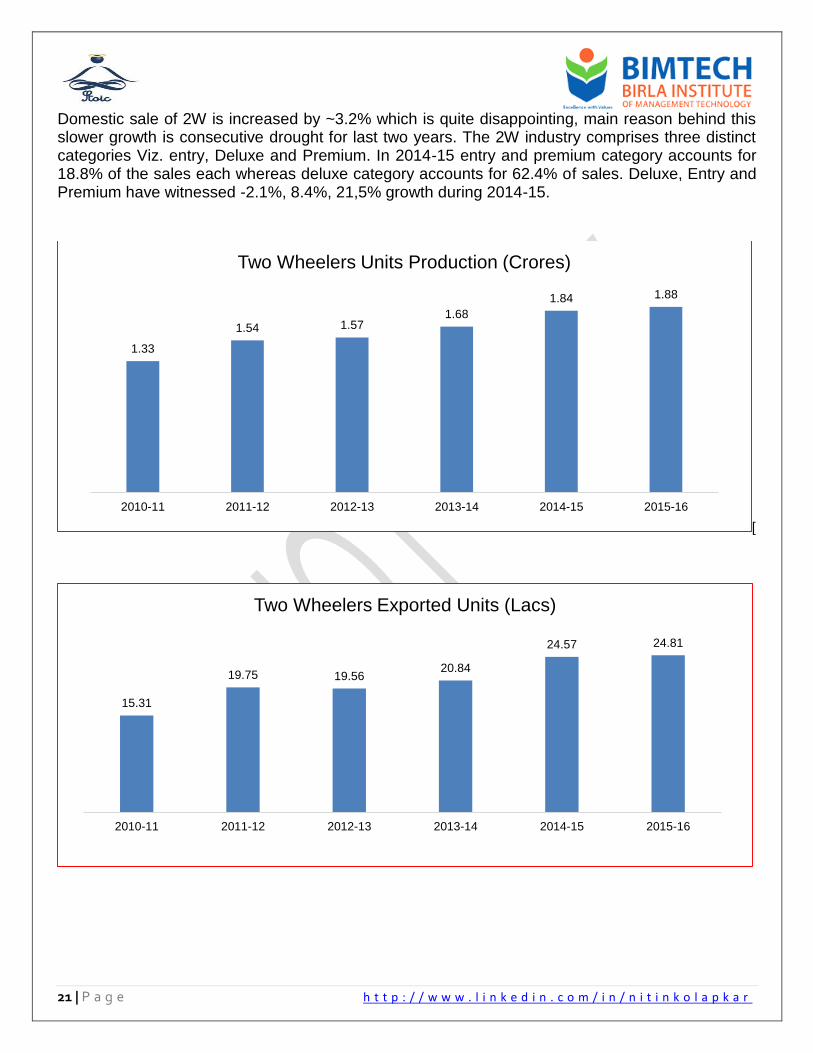
Indian 2W market is continued to dominate in the automobile industry. 2W production accounts for
79% of total vehicle production in India against 75% five years ago. Two Wheelers sales registered
growth of 8.09 percent in April-March 2015 over April-March 2014. Within the Two Wheelers
segment, Scooters, Motorcycles, and Mopeds grew by 25.06 percent, 2.50 percent, and 4.51 percent
respectively in April-March 2015 over April-March 2014.
1.17
1.34 1.37
1.48
1.591.64
2010-11 2011-12 2012-13 2013-14 2014-15 2015-16
Two Wheelers Domestic Sales Units(Crores)
The overall outlook for the 2W industry remains to be promising because in a country like India four out of five homes don’t possess 2W. There is tremendous room to grow in emerging markets such as India. Besides, over the last decade, 2W ownership in rural homes significantly increased. Automobile Export has been increased at the rate of 14.9% in Apr-Mar 2015 over the same period last year. 2015-16 has proved to be lukewarm for 2W industry as it has witnessed only 1% growth in export in number of units.
21 | P a g e h t t p : / / w w w . l i n k e d i n . c o m / i n / n i t i n k o l a p k a r
Domestic sale of 2W is increased by ~3.2% which is quite disappointing, main reason behind this slower growth is consecutive drought for last two years. The 2W industry comprises three distinct categories Viz. entry, Deluxe and Premium. In 2014-15 entry and premium category accounts for 18.8% of the sales each whereas deluxe category accounts for 62.4% of sales. Deluxe, Entry and Premium have witnessed -2.1%, 8.4%, 21,5% growth during 2014-15.
[
1.33
1.54 1.571.68
1.84 1.88
2010-11 2011-12 2012-13 2013-14 2014-15 2015-16
Two Wheelers Units Production (Crores)
15.31
19.75 19.5620.84
24.57 24.81
2010-11 2011-12 2012-13 2013-14 2014-15 2015-16
Two Wheelers Exported Units (Lacs)
22 | P a g e h t t p : / / w w w . l i n k e d i n . c o m / i n / n i t i n k o l a p k a r
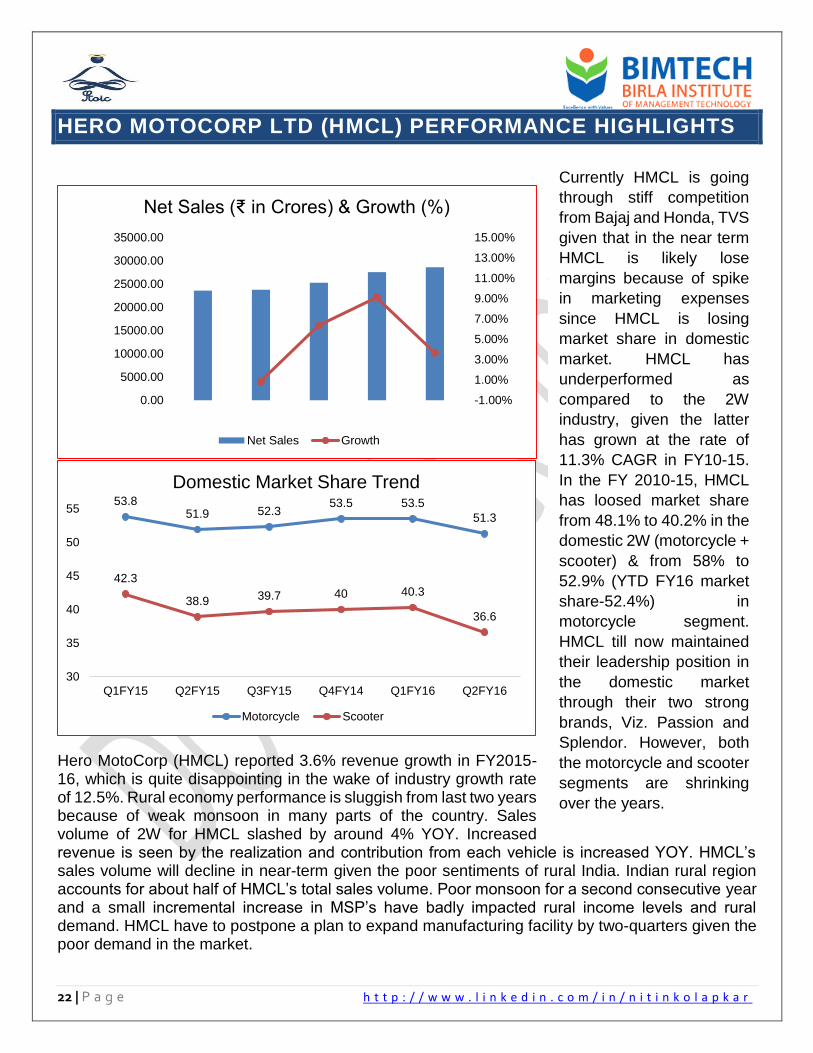
HERO MOTOCORP LTD (HMCL) PERFORMANCE HIGHLIGHTS
Hero MotoCorp (HMCL) reported 3.6% revenue growth in FY2015-16, which is quite disappointing in the wake of industry growth rate of 12.5%. Rural economy performance is sluggish from last two years because of weak monsoon in many parts of the country. Sales volume of 2W for HMCL slashed by around 4% YOY. Increased revenue is seen by the realization and contribution from each vehicle is increased YOY. HMCL’s sales volume will decline in near-term given the poor sentiments of rural India. Indian rural region accounts for about half of HMCL’s total sales volume. Poor monsoon for a second consecutive year and a small incremental increase in MSP’s have badly impacted rural income levels and rural demand. HMCL have to postpone a plan to expand manufacturing facility by two-quarters given the poor demand in the market.
-1.00%
1.00%
3.00%
5.00%
7.00%
9.00%
11.00%
13.00%
15.00%
0.00
5000.00
10000.00
15000.00
20000.00
25000.00
30000.00
35000.00
Net Sales (₹ in Crores) & Growth (%)
Net Sales Growth
53.851.9 52.3
53.5 53.5
51.3
42.3
38.9 39.7 40 40.3
36.6
30
35
40
45
50
55
Q1FY15 Q2FY15 Q3FY15 Q4FY14 Q1FY16 Q2FY16
Domestic Market Share Trend
Motorcycle Scooter
Currently HMCL is going
through stiff competition
from Bajaj and Honda, TVS
given that in the near term
HMCL is likely lose
margins because of spike
in marketing expenses
since HMCL is losing
market share in domestic
market. HMCL has
underperformed as
compared to the 2W
industry, given the latter
has grown at the rate of
11.3% CAGR in FY10-15.
In the FY 2010-15, HMCL
has loosed market share
from 48.1% to 40.2% in the
domestic 2W (motorcycle +
scooter) & from 58% to
52.9% (YTD FY16 market
share-52.4%) in
motorcycle segment.
HMCL till now maintained
their leadership position in
the domestic market
through their two strong
brands, Viz. Passion and
Splendor. However, both
the motorcycle and scooter
segments are shrinking
over the years.
23 | P a g e h t t p : / / w w w . l i n k e d i n . c o m / i n / n i t i n k o l a p k a r
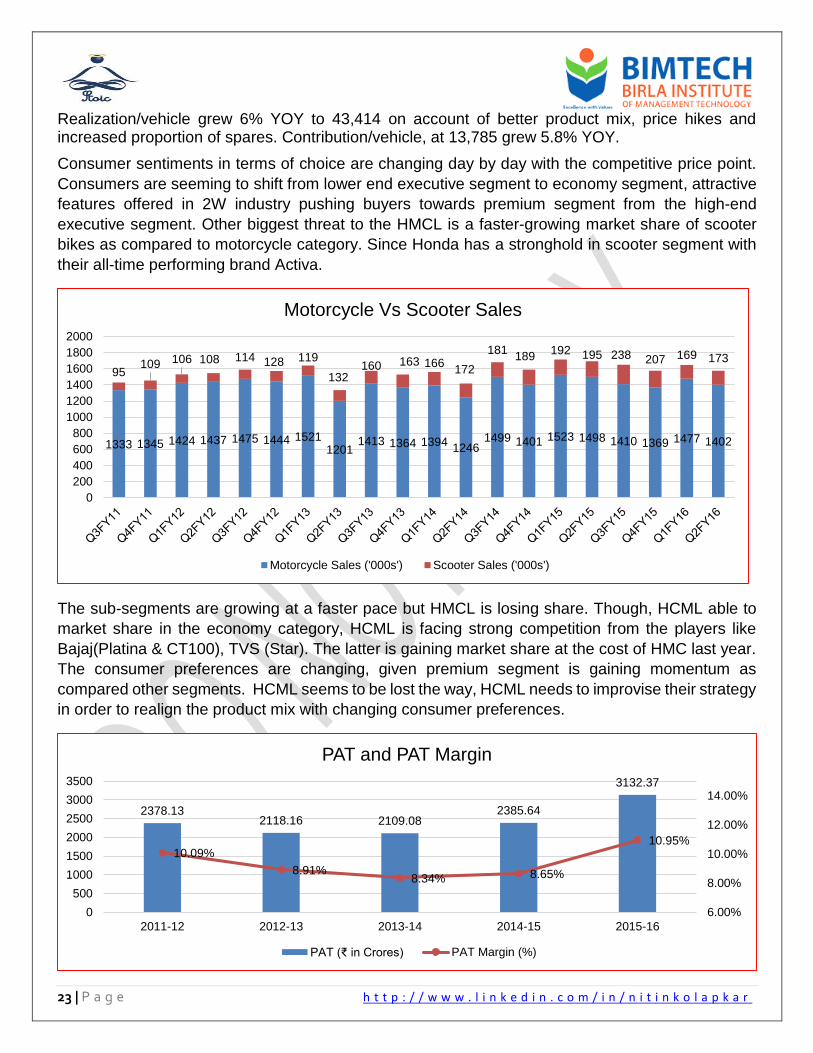
Realization/vehicle grew 6% YOY to 43,414 on account of better product mix, price hikes and increased proportion of spares. Contribution/vehicle, at 13,785 grew 5.8% YOY.
Consumer sentiments in terms of choice are changing day by day with the competitive price point.
Consumers are seeming to shift from lower end executive segment to economy segment, attractive
features offered in 2W industry pushing buyers towards premium segment from the high-end
executive segment. Other biggest threat to the HMCL is a faster-growing market share of scooter
bikes as compared to motorcycle category. Since Honda has a stronghold in scooter segment with
their all-time performing brand Activa.
The sub-segments are growing at a faster pace but HMCL is losing share. Though, HCML able to
market share in the economy category, HCML is facing strong competition from the players like
Bajaj(Platina & CT100), TVS (Star). The latter is gaining market share at the cost of HMC last year.
The consumer preferences are changing, given premium segment is gaining momentum as
compared other segments. HCML seems to be lost the way, HCML needs to improvise their strategy
in order to realign the product mix with changing consumer preferences.
1333 1345 1424 1437 1475 1444 15211201
1413 1364 13941246
1499 1401 1523 1498 1410 1369 1477 1402
95109 106 108 114 128 119
132160 163 166
172
181189
192 195 238 207 169 173
0
200
400
600
800
1000
1200
1400
1600
1800
2000
Motorcycle Vs Scooter Sales
Motorcycle Sales ('000s') Scooter Sales ('000s')
2378.132118.16 2109.08
2385.64
3132.37
10.09%
8.91%8.34% 8.65%
10.95%
6.00%
8.00%
10.00%
12.00%
14.00%
0
500
1000
1500
2000
2500
3000
3500
2011-12 2012-13 2013-14 2014-15 2015-16
PAT and PAT Margin
PAT (₹ in Crores) PAT Margin (%)
24 | P a g e h t t p : / / w w w . l i n k e d i n . c o m / i n / n i t i n k o l a p k a r
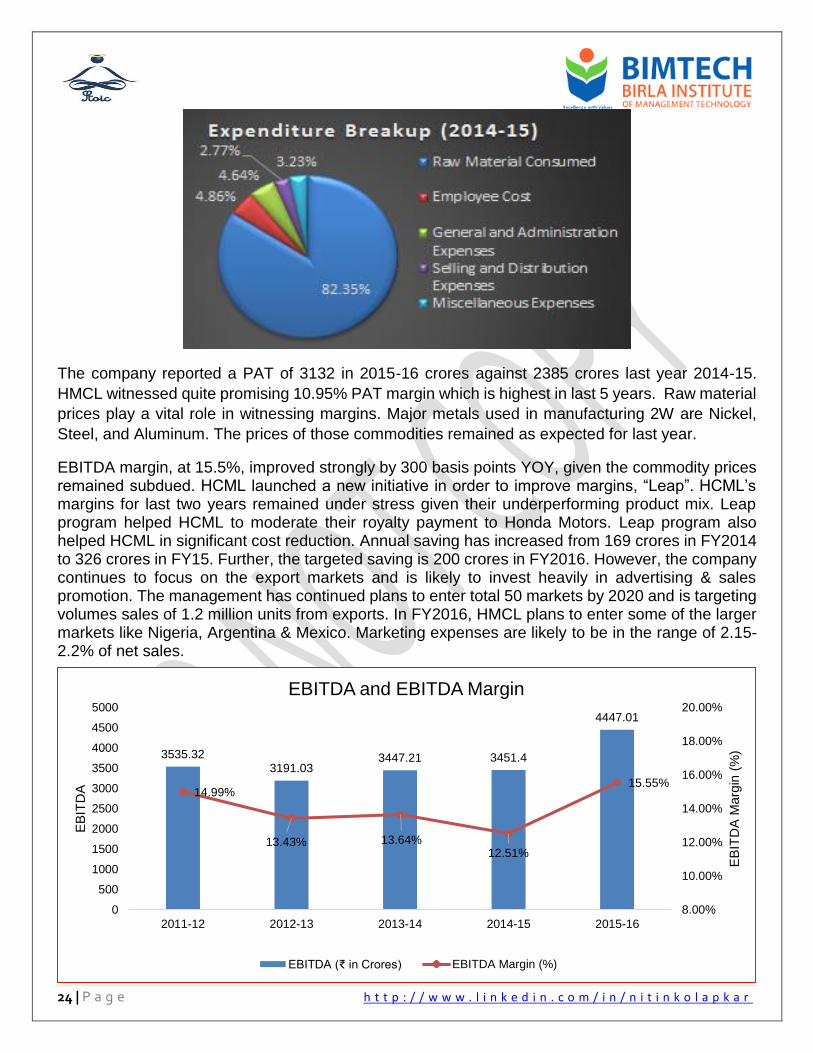
The company reported a PAT of 3132 in 2015-16 crores against 2385 crores last year 2014-15.
HMCL witnessed quite promising 10.95% PAT margin which is highest in last 5 years. Raw material
prices play a vital role in witnessing margins. Major metals used in manufacturing 2W are Nickel,
Steel, and Aluminum. The prices of those commodities remained as expected for last year.
EBITDA margin, at 15.5%, improved strongly by 300 basis points YOY, given the commodity prices remained subdued. HCML launched a new initiative in order to improve margins, “Leap”. HCML’s margins for last two years remained under stress given their underperforming product mix. Leap program helped HCML to moderate their royalty payment to Honda Motors. Leap program also helped HCML in significant cost reduction. Annual saving has increased from 169 crores in FY2014 to 326 crores in FY15. Further, the targeted saving is 200 crores in FY2016. However, the company continues to focus on the export markets and is likely to invest heavily in advertising & sales promotion. The management has continued plans to enter total 50 markets by 2020 and is targeting volumes sales of 1.2 million units from exports. In FY2016, HMCL plans to enter some of the larger markets like Nigeria, Argentina & Mexico. Marketing expenses are likely to be in the range of 2.15-2.2% of net sales.
3535.323191.03
3447.21 3451.4
4447.01
14.99%
13.43% 13.64%12.51%
15.55%
8.00%
10.00%
12.00%
14.00%
16.00%
18.00%
20.00%
0
500
1000
1500
2000
2500
3000
3500
4000
4500
5000
2011-12 2012-13 2013-14 2014-15 2015-16
EB
ITD
A M
arg
in (
%)
EB
ITD
A
EBITDA and EBITDA Margin
EBITDA (₹ in Crores) EBITDA Margin (%)
25 | P a g e h t t p : / / w w w . l i n k e d i n . c o m / i n / n i t i n k o l a p k a r
17404
18836
22386
27957
23779
2054.85
1541.9
2272.85
2642.6
2940
0
500
1000
1500
2000
2500
3000
3500
5000
10000
15000
20000
25000
30000
2011-12 2012-13 2013-14 2014-15 2015-16H
MC
Sensex
Sensex Vs HMC
Sensex 31st Mar HMC Stock Price (in ₹)
119
106 106
119
157
2011-12 2012-13 2013-14 2014-15 2015-16
EPS ( in ₹)
Category Shares
Held (%)
Promoter (Indian) 34.64%
Mutual Funds / UTI 3.41%
Financial Institutions / Banks 1.14%
Insurance Companies 6.34%
Foreign Institutional Investors 40.77%
Bodies Corporate 1.76%
Indian Public 6.76%
Trusts 0.64%
Clearing Members 0.11%
Non-Resident Indians 0.16%
Foreign Bodies 4.27%
26 | P a g e h t t p : / / w w w . l i n k e d i n . c o m / i n / n i t i n k o l a p k a r
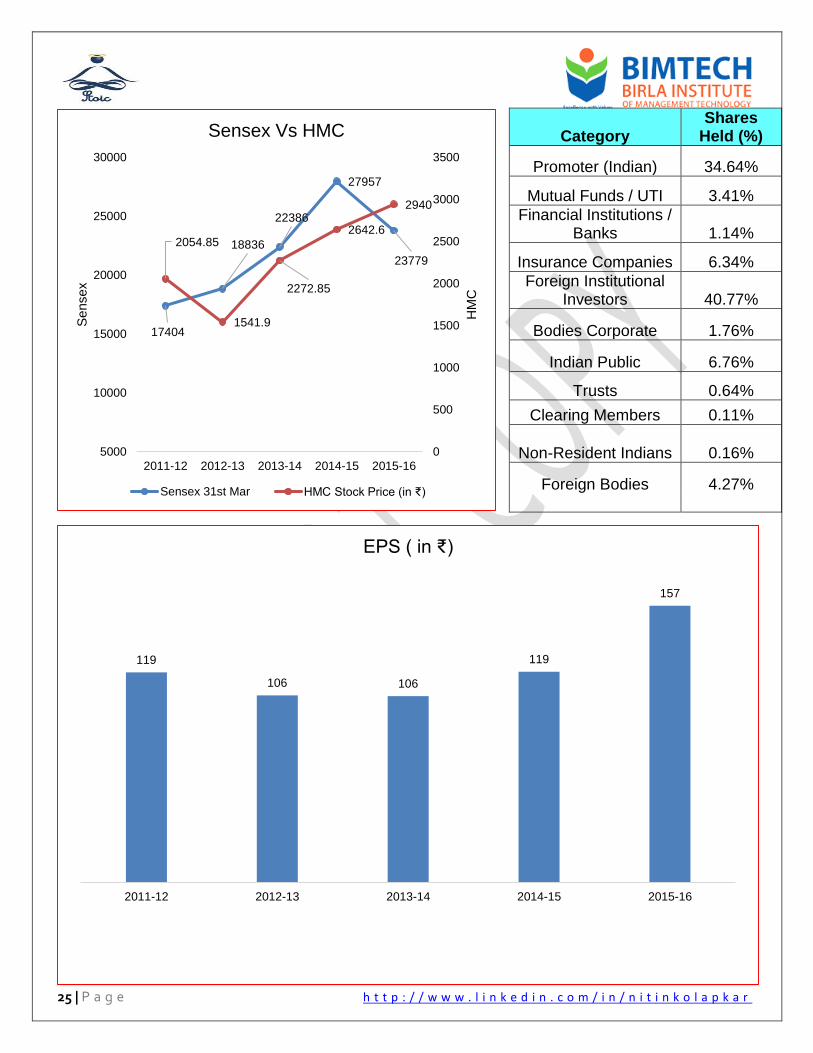
The shareholding pattern has enormous importance while selecting the stocks. Better control goes
hand in hand with a better shareholding number. One simple principle applies here is that greater
promotor’s shareholding is better for good company (with strong financial) and less promotor
shareholding is considered as the worst for bad companies (with weak financials). HCML’s
promoters’ shareholding is 34.64% which is quite promising. Also, a best-practiced value investor
who generally in pursuit of finding hidden gems ignore the stocks which have a mutual fund, FI’s
shareholding in them because they consider that this stock is already identified by many investors.
FII’s holding stands at 40.77% which clearly shows their confidence about HCML and likely on Indian
2W industry. But risk-averse investor generally likes the stocks which are held by FI’s, mutual funds,
etc. since they consider it as a safe stock to invest.
More institutional holding comes with the volatility in the stock which could also be assumed to be a
nightmare for retail investors.
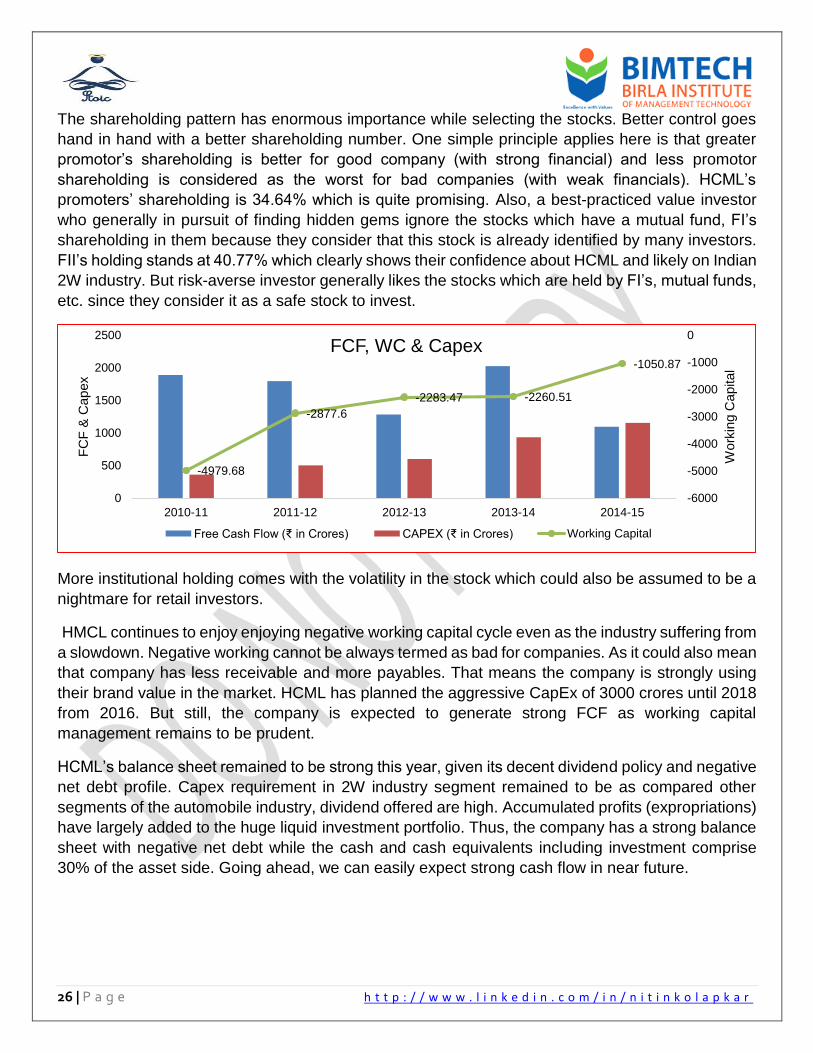
HMCL continues to enjoy enjoying negative working capital cycle even as the industry suffering from
a slowdown. Negative working cannot be always termed as bad for companies. As it could also mean
that company has less receivable and more payables. That means the company is strongly using
their brand value in the market. HCML has planned the aggressive CapEx of 3000 crores until 2018
from 2016. But still, the company is expected to generate strong FCF as working capital
management remains to be prudent.
HCML’s balance sheet remained to be strong this year, given its decent dividend policy and negative
net debt profile. Capex requirement in 2W industry segment remained to be as compared other
segments of the automobile industry, dividend offered are high. Accumulated profits (expropriations)
have largely added to the huge liquid investment portfolio. Thus, the company has a strong balance
sheet with negative net debt while the cash and cash equivalents including investment comprise
30% of the asset side. Going ahead, we can easily expect strong cash flow in near future.
-4979.68
-2877.6
-2283.47 -2260.51
-1050.87
-6000
-5000
-4000
-3000
-2000
-1000
0
0
500
1000
1500
2000
2500
2010-11 2011-12 2012-13 2013-14 2014-15
Work
ing C
apital
FC
F &
Capex
FCF, WC & Capex
Free Cash Flow (₹ in Crores) CAPEX (₹ in Crores) Working Capital
27 | P a g e h t t p : / / w w w . l i n k e d i n . c o m / i n / n i t i n k o l a p k a r
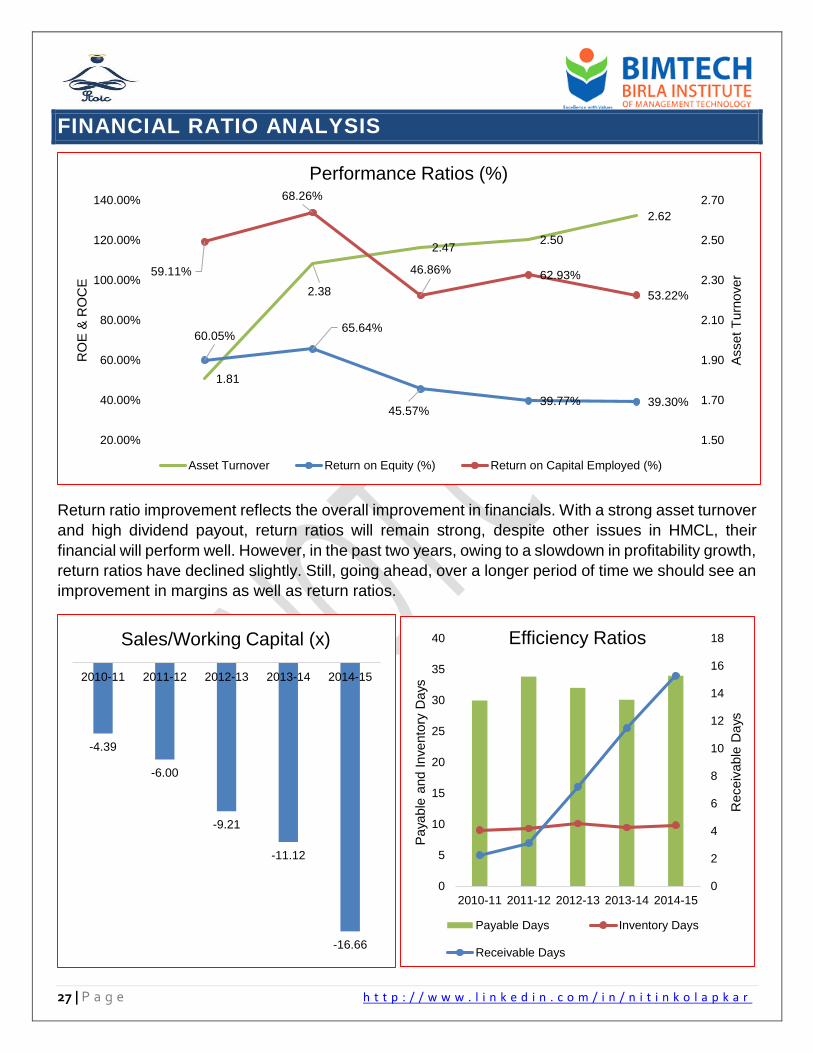
FINANCIAL RATIO ANALYSIS
Return ratio improvement reflects the overall improvement in financials. With a strong asset turnover
and high dividend payout, return ratios will remain strong, despite other issues in HMCL, their
financial will perform well. However, in the past two years, owing to a slowdown in profitability growth,
return ratios have declined slightly. Still, going ahead, over a longer period of time we should see an
improvement in margins as well as return ratios.
1.81
2.38
2.472.50
2.62
60.05%65.64%
45.57%39.77% 39.30%
59.11%
68.26%
46.86% 62.93%
53.22%
20.00%
40.00%
60.00%
80.00%
100.00%
120.00%
140.00%
1.50
1.70
1.90
2.10
2.30
2.50
2.70
RO
E &
RO
CE
Asset
Turn
over
Performance Ratios (%)
Asset Turnover Return on Equity (%) Return on Capital Employed (%)
-4.39
-6.00
-9.21
-11.12
-16.66
2010-11 2011-12 2012-13 2013-14 2014-15
Sales/Working Capital (x)
0
2
4
6
8
10
12
14
16
18
0
5
10
15
20
25
30
35
40
2010-11 2011-12 2012-13 2013-14 2014-15
Receiv
able
Days
Paya
ble
and I
nvento
ry D
ays
Efficiency Ratios
Payable Days Inventory Days
Receivable Days
28 | P a g e h t t p : / / w w w . l i n k e d i n . c o m / i n / n i t i n k o l a p k a r
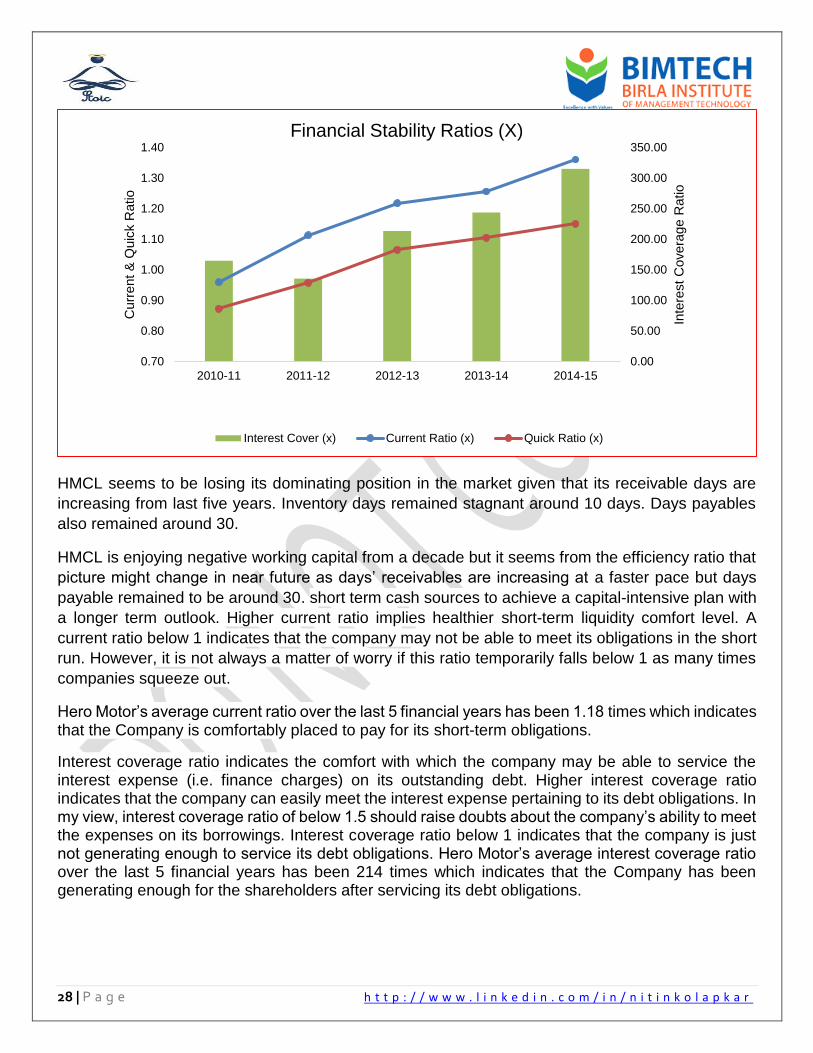
HMCL seems to be losing its dominating position in the market given that its receivable days are
increasing from last five years. Inventory days remained stagnant around 10 days. Days payables
also remained around 30.
HMCL is enjoying negative working capital from a decade but it seems from the efficiency ratio that
picture might change in near future as days’ receivables are increasing at a faster pace but days
payable remained to be around 30. short term cash sources to achieve a capital-intensive plan with
a longer term outlook. Higher current ratio implies healthier short-term liquidity comfort level. A
current ratio below 1 indicates that the company may not be able to meet its obligations in the short
run. However, it is not always a matter of worry if this ratio temporarily falls below 1 as many times
companies squeeze out.
Hero Motor’s average current ratio over the last 5 financial years has been 1.18 times which indicates that the Company is comfortably placed to pay for its short-term obligations.
Interest coverage ratio indicates the comfort with which the company may be able to service the interest expense (i.e. finance charges) on its outstanding debt. Higher interest coverage ratio indicates that the company can easily meet the interest expense pertaining to its debt obligations. In my view, interest coverage ratio of below 1.5 should raise doubts about the company’s ability to meet the expenses on its borrowings. Interest coverage ratio below 1 indicates that the company is just not generating enough to service its debt obligations. Hero Motor’s average interest coverage ratio over the last 5 financial years has been 214 times which indicates that the Company has been generating enough for the shareholders after servicing its debt obligations.
0.00
50.00
100.00
150.00
200.00
250.00
300.00
350.00
0.70
0.80
0.90
1.00
1.10
1.20
1.30
1.40
2010-11 2011-12 2012-13 2013-14 2014-15
Inte
rest
Covera
ge R
atio
Curr
ent
& Q
uic
k R
atio
Financial Stability Ratios (X)
Interest Cover (x) Current Ratio (x) Quick Ratio (x)
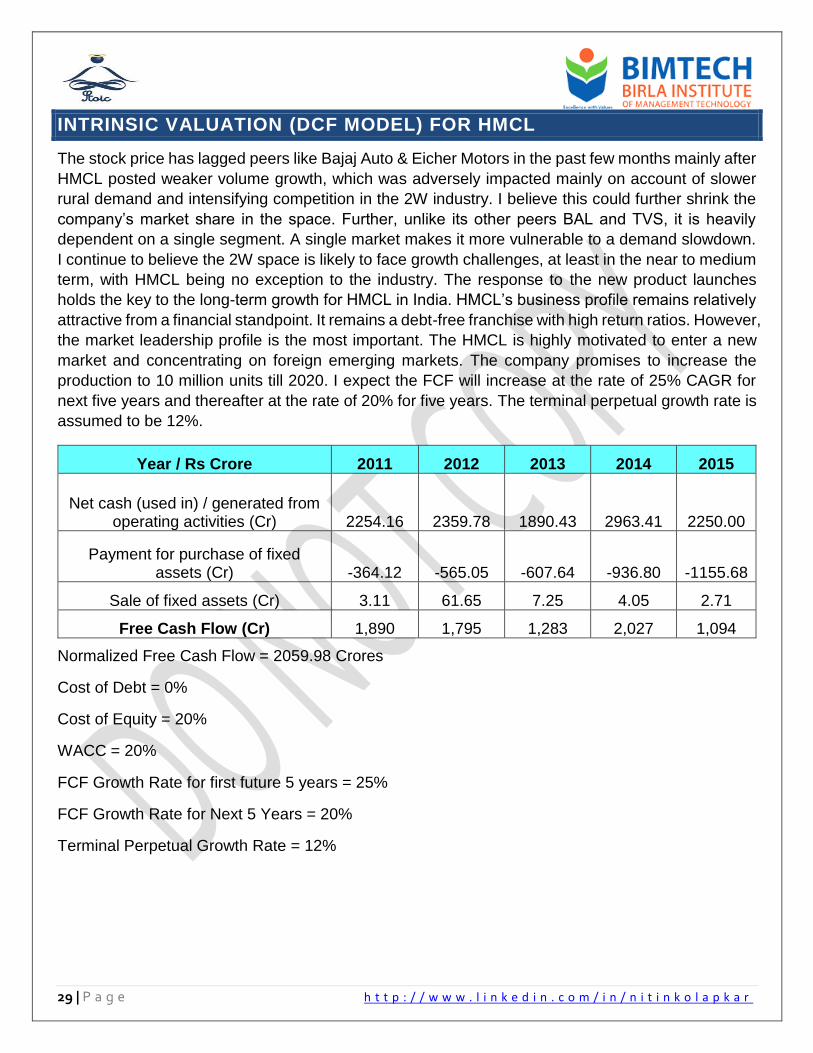
29 | P a g e h t t p : / / w w w . l i n k e d i n . c o m / i n / n i t i n k o l a p k a r
INTRINSIC VALUATION (DCF MODEL) FOR HMCL
The stock price has lagged peers like Bajaj Auto & Eicher Motors in the past few months mainly after
HMCL posted weaker volume growth, which was adversely impacted mainly on account of slower
rural demand and intensifying competition in the 2W industry. I believe this could further shrink the
company’s market share in the space. Further, unlike its other peers BAL and TVS, it is heavily
dependent on a single segment. A single market makes it more vulnerable to a demand slowdown.
I continue to believe the 2W space is likely to face growth challenges, at least in the near to medium
term, with HMCL being no exception to the industry. The response to the new product launches
holds the key to the long-term growth for HMCL in India. HMCL’s business profile remains relatively
attractive from a financial standpoint. It remains a debt-free franchise with high return ratios. However,
the market leadership profile is the most important. The HMCL is highly motivated to enter a new
market and concentrating on foreign emerging markets. The company promises to increase the
production to 10 million units till 2020. I expect the FCF will increase at the rate of 25% CAGR for
next five years and thereafter at the rate of 20% for five years. The terminal perpetual growth rate is
assumed to be 12%.
Year / Rs Crore 2011 2012 2013 2014 2015
Net cash (used in) / generated from operating activities (Cr) 2254.16 2359.78 1890.43 2963.41 2250.00
Payment for purchase of fixed assets (Cr) -364.12 -565.05 -607.64 -936.80 -1155.68
Sale of fixed assets (Cr) 3.11 61.65 7.25 4.05 2.71
Free Cash Flow (Cr) 1,890 1,795 1,283 2,027 1,094
Normalized Free Cash Flow = 2059.98 Crores
Cost of Debt = 0%
Cost of Equity = 20%
WACC = 20%
FCF Growth Rate for first future 5 years = 25%
FCF Growth Rate for Next 5 Years = 20%
Terminal Perpetual Growth Rate = 12%
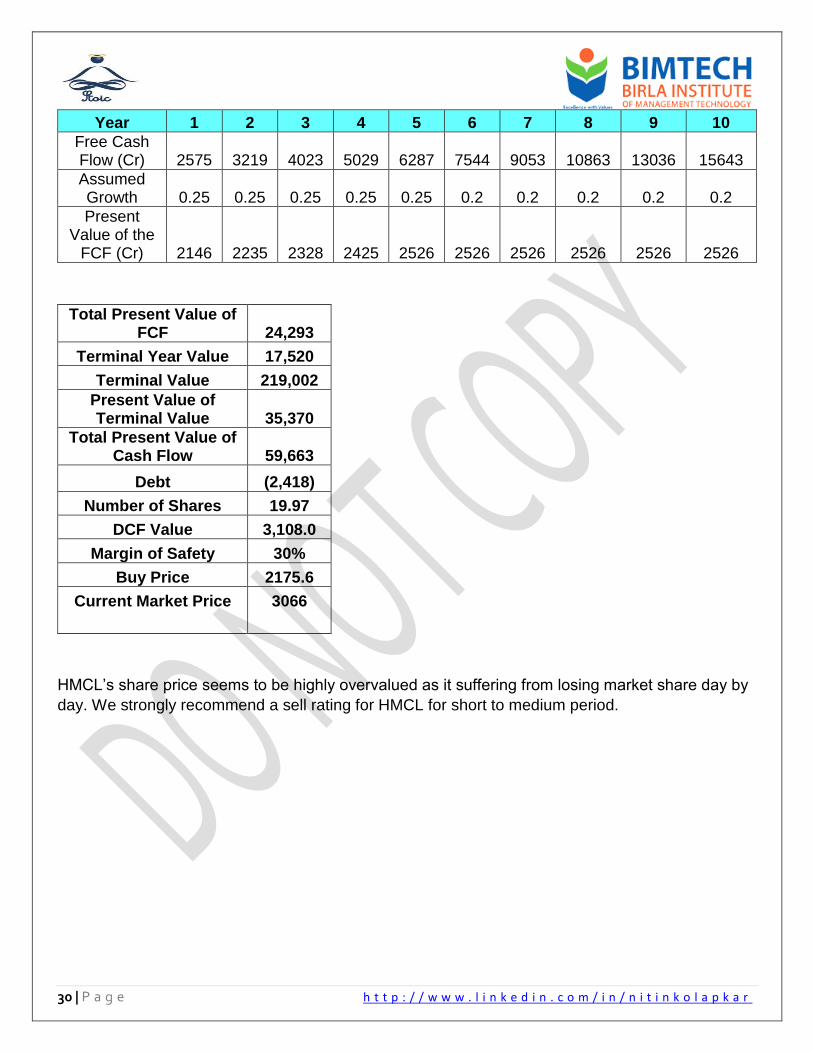
30 | P a g e h t t p : / / w w w . l i n k e d i n . c o m / i n / n i t i n k o l a p k a r
Year 1 2 3 4 5 6 7 8 9 10
Free Cash Flow (Cr) 2575 3219 4023 5029 6287 7544 9053 10863 13036 15643
Assumed Growth 0.25 0.25 0.25 0.25 0.25 0.2 0.2 0.2 0.2 0.2
Present Value of the
FCF (Cr) 2146 2235 2328 2425 2526 2526 2526 2526 2526 2526
Total Present Value of FCF 24,293
Terminal Year Value 17,520
Terminal Value 219,002
Present Value of Terminal Value 35,370
Total Present Value of Cash Flow 59,663
Debt (2,418)
Number of Shares 19.97
DCF Value 3,108.0
Margin of Safety 30%
Buy Price 2175.6
Current Market Price 3066
HMCL’s share price seems to be highly overvalued as it suffering from losing market share day by
day. We strongly recommend a sell rating for HMCL for short to medium period.
31 | P a g e h t t p : / / w w w . l i n k e d i n . c o m / i n / n i t i n k o l a p k a r
GLOSSARY OF ABBREVIATIONS
AP - Asian Paints
HMCL - Hero MotoCorp Ltd
MCAP - Market Capitalization
WACC – Weighted Average Cost of Capital
EBIT/PBIT – Earnings before Interest Tax
EBITDA – Earning before Interest Tax Depreciation Amortization
EPS – Earning per Share
CFO – Cash Flow from Operation
FCF – Free Cash Flow
WC- Working Capital
Capex- Capital Expenditure
2W- Two-Wheeler
DCF – Discounted Cash Flow
CAGR- Compounded Annual Growth Rate
FII – Foreign Institutional Investors
DII – Domestic Institutional Investors
FY – Financial Year
YOY – Year on Year
QOQ- Quarter on Quarter
GDP – Gross Domestic Period
CPI – Consumer Price Index
WPI – Wholesale Price Index
NPA – Non-Performing Asset
BREXIT – Britain Exit
TCS – Tata Consultancy Services
32 | P a g e h t t p : / / w w w . l i n k e d i n . c o m / i n / n i t i n k o l a p k a r
FMCG – Fast Moving Consumer Goods
TiO2 – Titanium Dioxide
JV – Joint Venture
ERP – Enterprise Resource Planning
FI – Financial Institutions
CAPM – Capital Asset Pricing Model
AR- Accounts Receivables
33 | P a g e h t t p : / / w w w . l i n k e d i n . c o m / i n / n i t i n k o l a p k a r
REFERENCES
1. Security Analysis by Benjamin Graham
2. Valuation by Aswath Damodaran
3. The intelligent Investors by Benjamin Graham ad David Doddsville
4. Financial Shenanigans by Dr. Howard M. Schilit
5. What has worked in investing- Studies of investment approaches and characteristics
associated with exceptional returns- Tweedy Browne Company LLC
6. Psychology of Human Misjudgment by Charlie Munger
7. Five rules of successful stock investing by Pat Dorsey
8. Value Investing: from Graham to Buffett and Beyond by Bruce Greenwald