Embed Size (px)
DESCRIPTION
IntraCavity Laser Absorption Spectroscopy. [email protected] Laboratoire de Spectrométrie Physique (CNRS UMR C5588) Université Joseph Fourier de Grenoble (France) M. Chenevier, F. Stoeckel, A. Kachanov and D. Romanini. Introduction: High Sensitive Absorption Techniques. - PowerPoint PPT Presentation
Citation preview
1
Laboratoire de Spectrométrie Physique (CNRS UMR C5588)Université Joseph Fourier de Grenoble (France)
M. Chenevier, F. Stoeckel, A. Kachanov and D. Romanini
IntraCavity Laser Absorption Spectroscopy
2
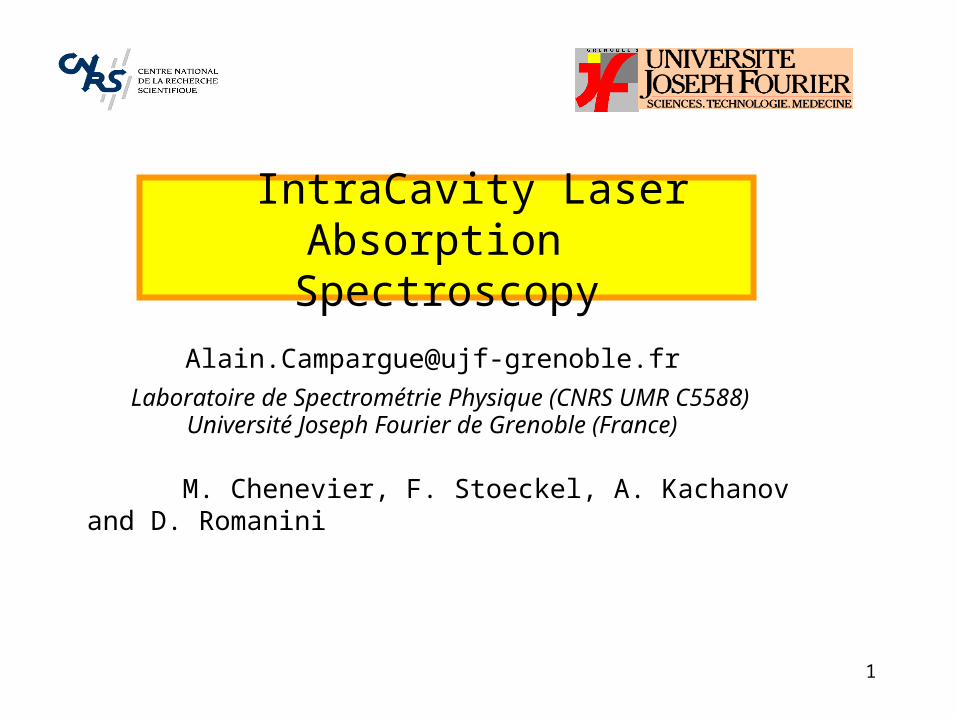
Introduction: High Sensitive Absorption Techniques
increase of l : multipass cell, ICLAS, CRDS decrease of the noise level : in particular FMDL and also CRDS, OA measurement of the absorbed energy
dark background methods: OA and OT
NB. If the absorption linewidth is limited by the instrumental resolution, sensitivity when the spectral resolution
I I l
I I l
lI
I
( ) ( ).exp[ ( ) ]
( ) ( )[ ( ) ]
( )min
min
0
0
0
1
1
3
absorber
l
v
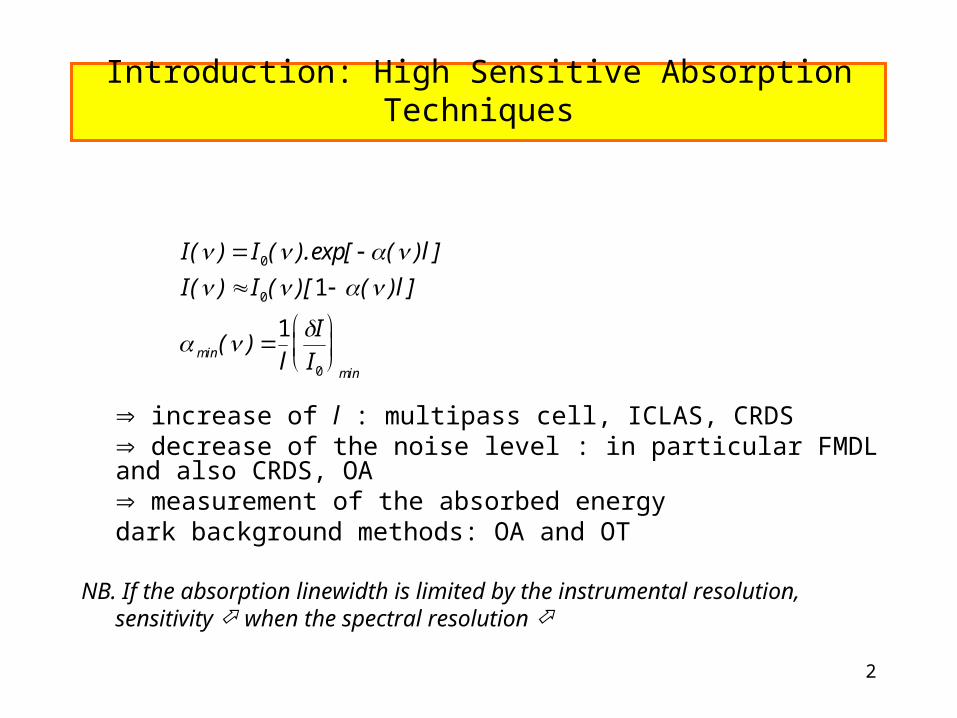
Principles of Intracavity Laser Absorption SpectroscopyPrinciples of Intracavity Laser Absorption Spectroscopy
emission spectrum
I
laser cavity L
mirrormirror
Є
laser gain
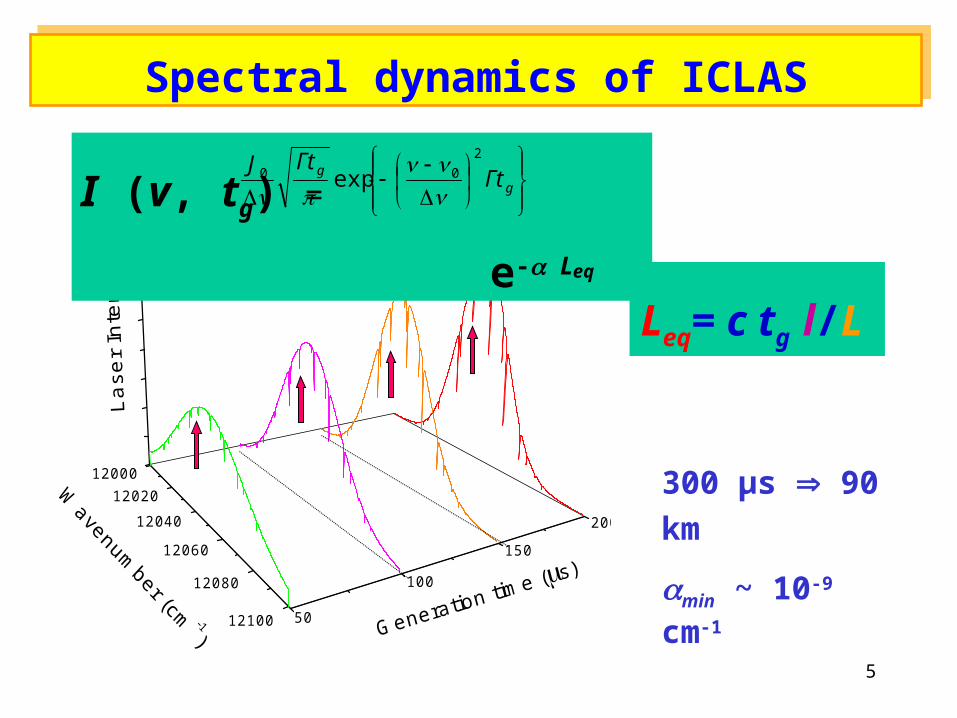
with c: speed of light , tg: generation time
Leq= c tg l/L

4
Principles of Intracavity Laser Absorption SpectroscopyPrinciples of Intracavity Laser Absorption Spectroscopy
qqq
qqqqqq
MBN
Pdt
dN
MBcMMdt
dM
)1(
Absorption Line
Losses
Cavity Modes
Detector
Amplification Medium
Absorption Cell
Spectrograph
5
1200012020
12040
12060
12080
12100 50
100
150
200
Spectral dynamics of ICLASSpectral dynamics of ICLAS
I (v, tg) = e- Leq
300 µs 90 km
min ~ 10-9 cm-1
Leq= c tg l/L
g
g ГtГtJ
2
00 exp
6
10640 10660 10680 10700 10720 10740 107600.010
0.015
0.020
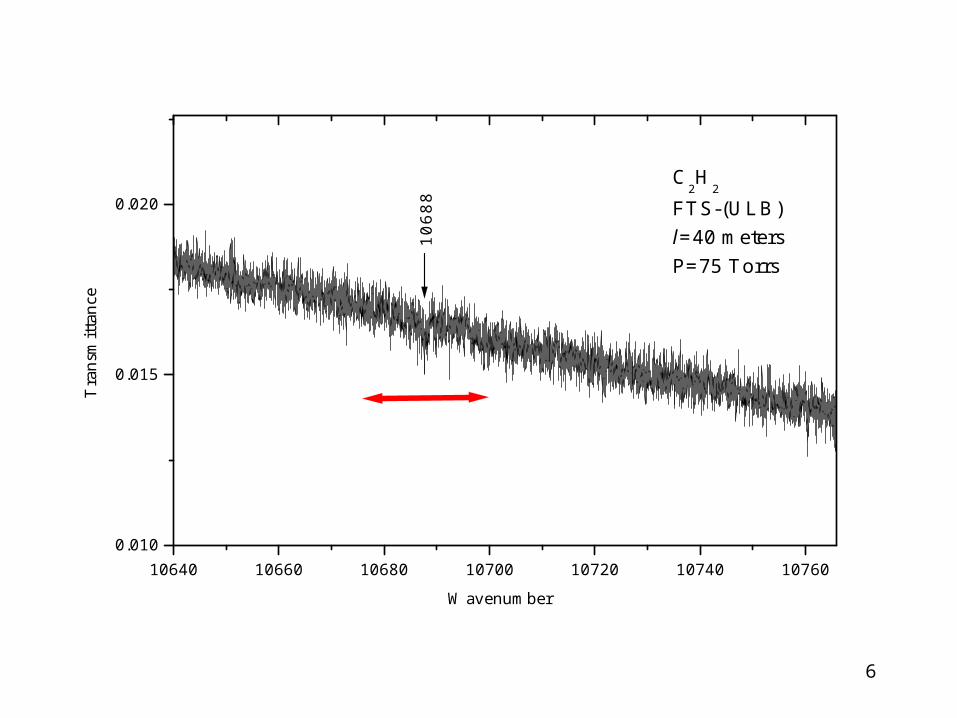
1068
8
C2H
2
FTS-(ULB)l=40 metersP=75 Torrs
Tra
nsm
ittan
ce
Wavenumber
7
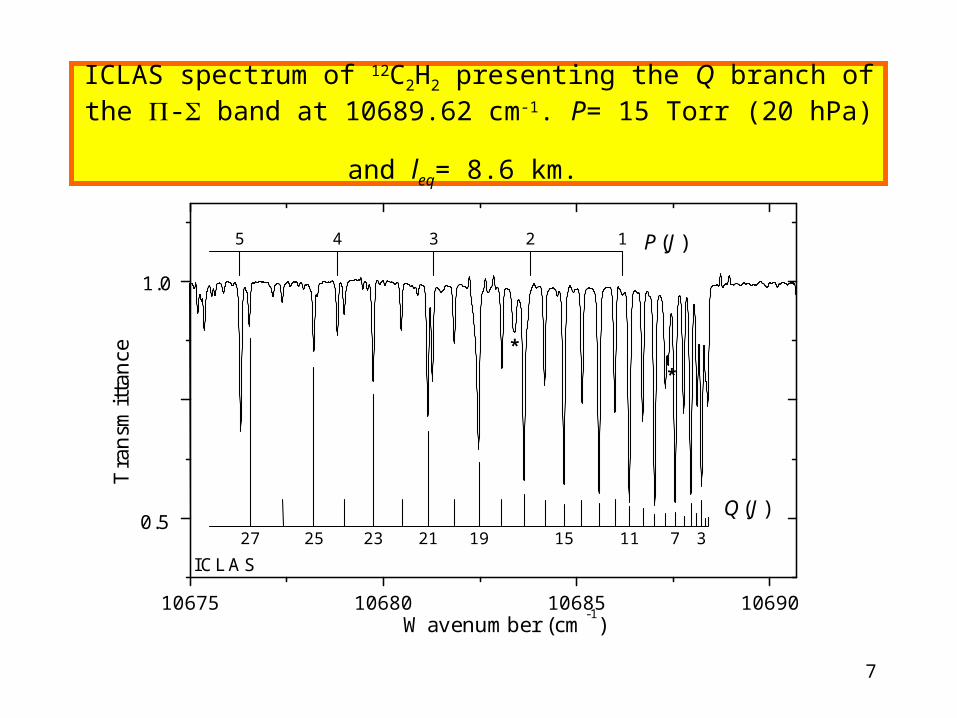
ICLAS spectrum of 12C2H2 presenting the Q branch of the - band at
10689.62 cm-1. P= 15 Torr (20 hPa) and leq= 8.6 km.
3711151921232527
12345
10675 10680 10685 10690
ICLAS
**
0.5
1.0
Q(J)
P(J)
Tra
nsm
ittan
ce
Wavenumber (cm-1)
8
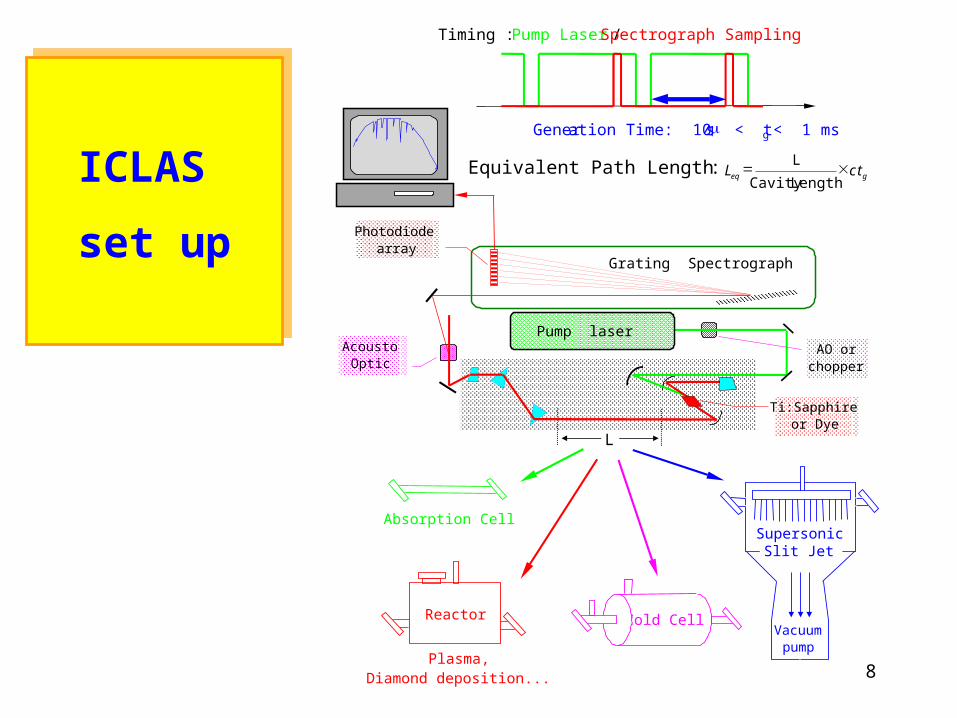
ICLAS
set up
ICLAS
set up
L
Cold Cell
Grating Spectrograph
Absorption Cell
Reactor
SupersonicSlit Jet
Plasma,Diamond deposition...
Photodiodearray
Pump laser
Ti:Sapphireor Dye
AcoustoOptic
AO orchopper
Gener ation Time : 10 s < t g < 1 ms
Equivalent Path Length : L c teq g L
CavityLength
Timing : Pump Laser / Spectrograph Sampling
Vacuumpump
9
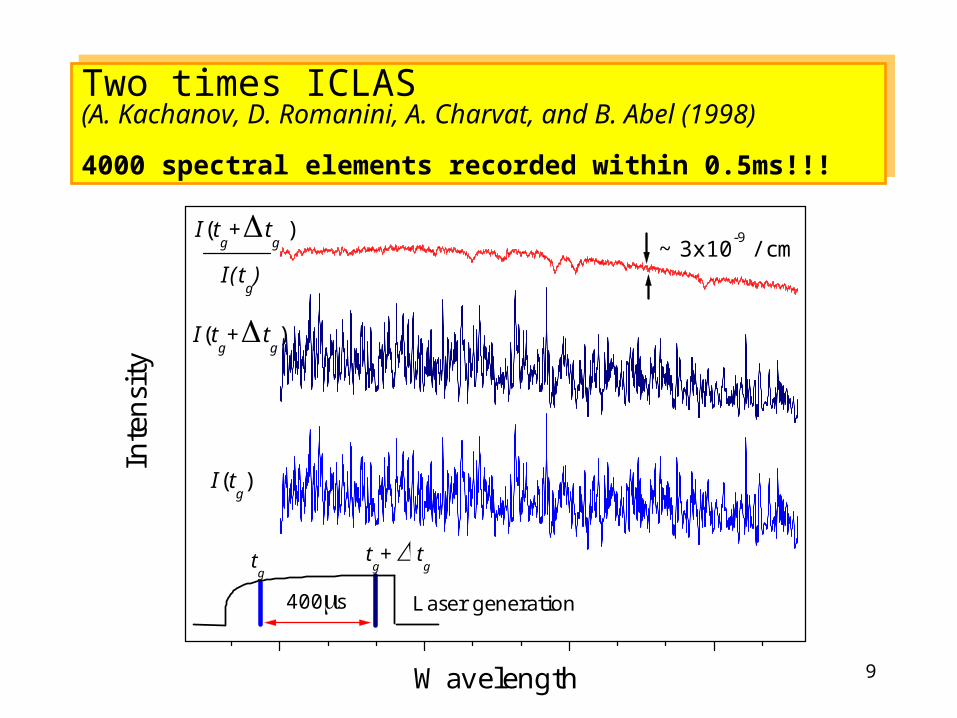
I(tg)
I(tg)
I(tg+ t
g )
I(tg+ t
g)
Inte
nsity
Laser generation
tg+ t
gtg
400s
~ 3x10⁻⁹ / cm
Wavelength
Two times ICLAS (A. Kachanov, D. Romanini, A. Charvat, and B. Abel (1998)
4000 spectral elements recorded within 0.5ms!!!
Two times ICLAS (A. Kachanov, D. Romanini, A. Charvat, and B. Abel (1998)
4000 spectral elements recorded within 0.5ms!!!

10
Correction of the Atmospheric Absorption Background
10732 10734 10736 107380
(c)
Wavenumber (cm-1)
0
(b)
0
(a)
Ratio
Intensity
(au)
12CO2
H2O + 12CO
2
H2O
Intensity
(au)
11
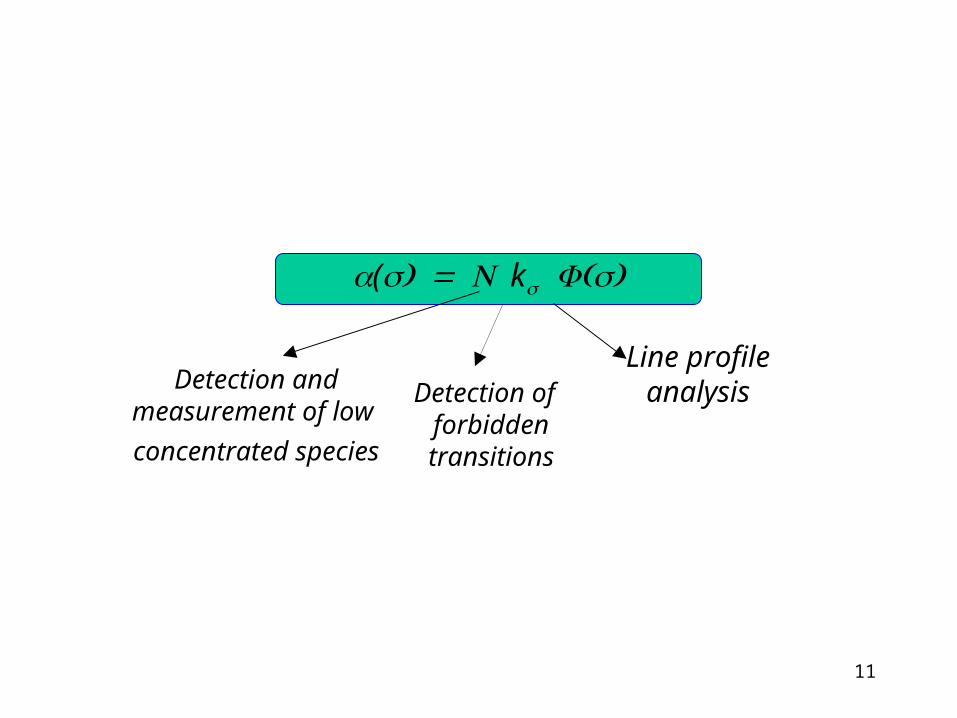
Detection and measurement of low
concentrated species
Detection of forbiddentransitions
Line profile analysis
(k
12
+
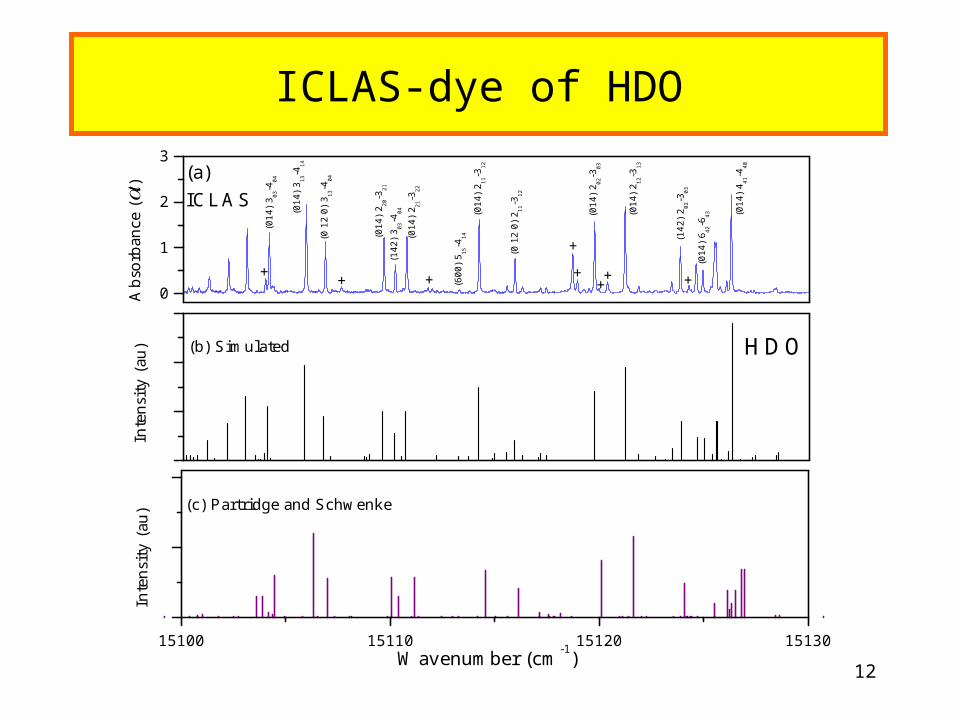
(b) Simulated
Wavenumber (cm-1)
0
1
2
3
(600
) 5 15
-414
(014
) 2 11
-312
(014
) 6 42
-643 (0
14)
4 41-4
40
(142
) 2 02
-303
(014
) 2 12
-313
(014
) 2 02
-303
(0 1
2 0)
211
-312
(142
) 3 03
-404
(014
) 2 21
-322
(014
) 2 20
-321
(0 1
2 0)
313
-404
(014
) 3 13
-414
(014
) 3 03
-404
++
+ ++
+
+
Inte
nsity
(au
)In
tens
ity (
au)
Abs
orba
nce
(l)
HDO
(a)ICLAS
15100 15110 15120 15130
(c) Partridge and Schwenke
ICLAS-dye of HDO

13
ICLAS- VECSEL of H2O Comparison with current databases
ICLAS- VECSEL of H2O Comparison with current databases
14
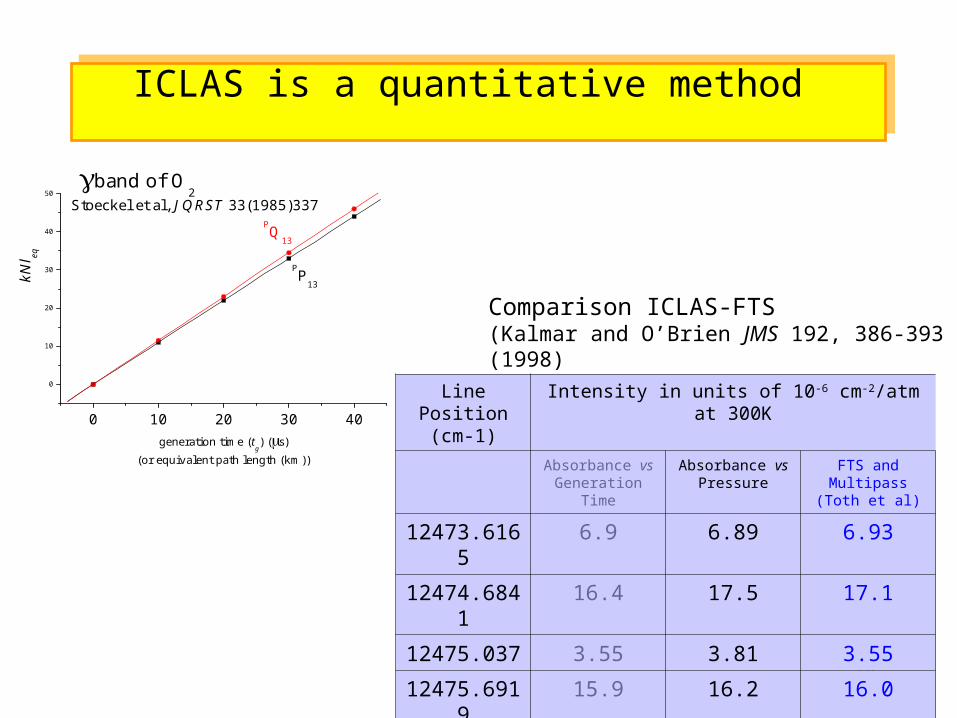
ICLAS is a quantitative method ICLAS is a quantitative method
Comparison ICLAS-FTS (Kalmar and O’Brien JMS 192, 386-393 (1998)
Line Position(cm-1)
Intensity in units of 10-6 cm-2/atm at 300K
Absorbance vs Generation Time
Absorbance vs Pressure
FTS and Multipass(Toth et al)
12473.6165 6.9 6.89 6.93
12474.6841 16.4 17.5 17.1
12475.037 3.55 3.81 3.55
12475.6919 15.9 16.2 16.0
12476.3955 46.4 49.4 50.6
12661.1102 60.8 62.4 59.3
0 10 20 30 40
0
10
20
30
40
50
Stoeckel et al, JQRST 33(1985)337 band of O
2
PQ13
PP13kN
l eq
generation time (tg) (s)
(or equivalent path length (km))
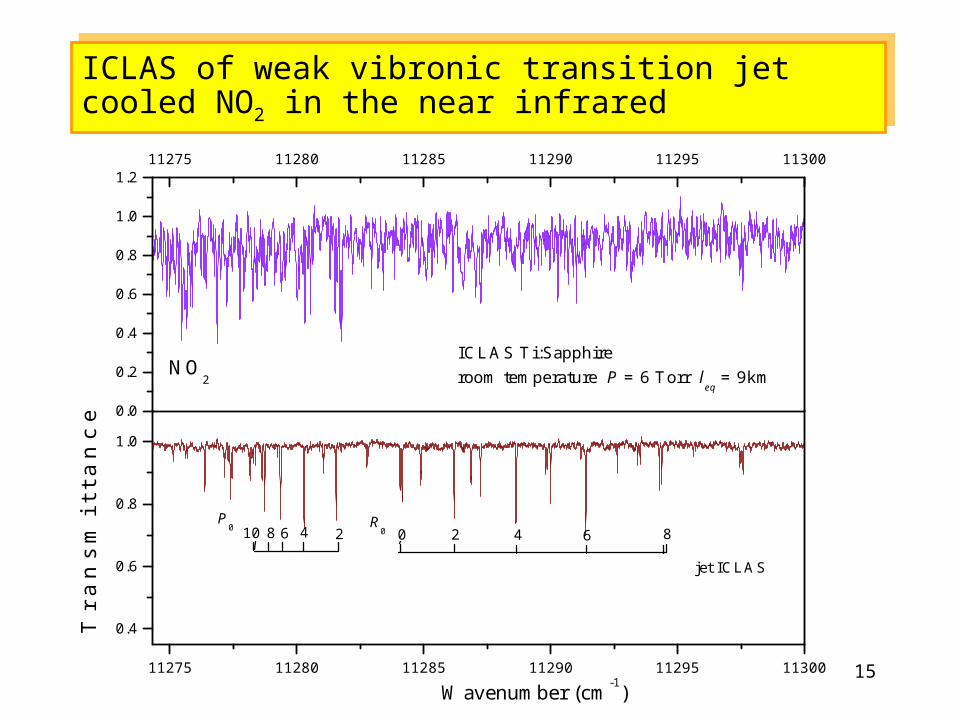
1511275 11280 11285 11290 11295 11300
0.4
0.6
0.8
1.0
R0 86420246810
P0
jet ICLAS
T r
a n
s m
i t t
a n
c e
Wavenumber (cm-1)
0.0
0.2
0.4
0.6
0.8
1.0
1.211275 11280 11285 11290 11295 11300
NO2
ICLAS Ti:Sapphireroom temperature P = 6 Torr l
eq = 9km
ICLAS of weak vibronic transition jet cooled NO2 in the near infrared
ICLAS of weak vibronic transition jet cooled NO2 in the near infrared
16
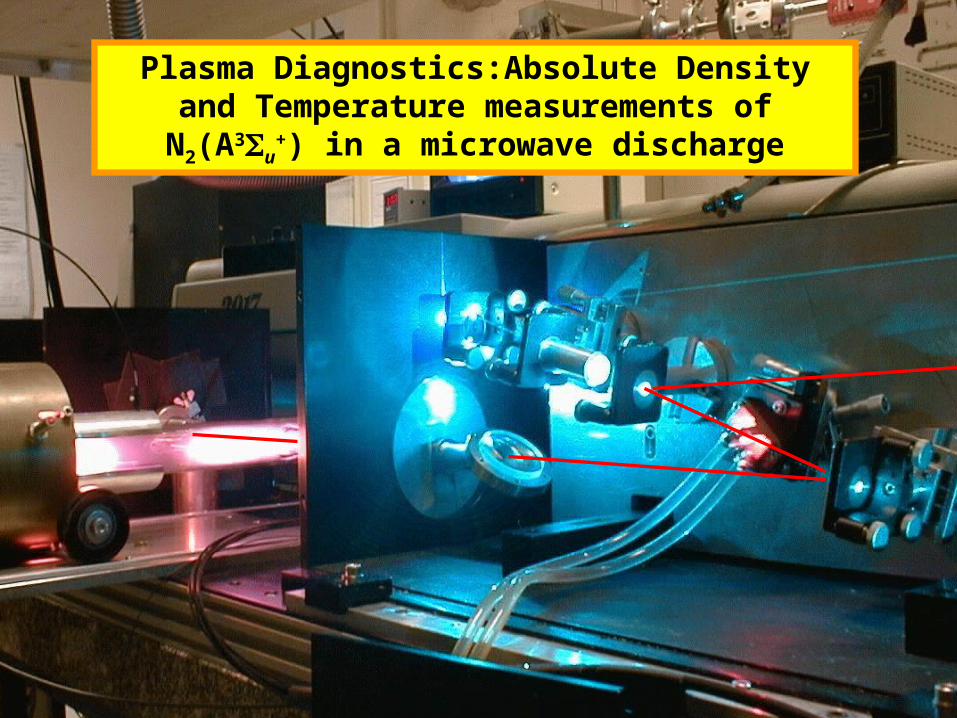
Plasma Diagnostics:Absolute Density and Temperature measurements of N2(A3u
+) in a microwave discharge
17
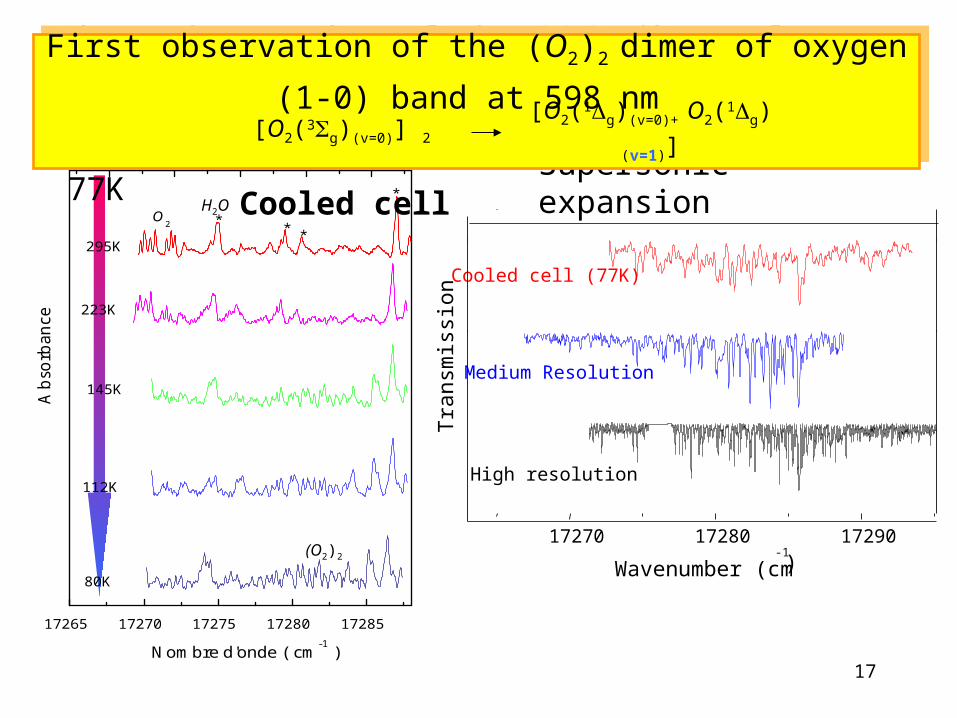
17270 17280 17290
Medium Resolution
High resolution
Cooled cell (77K)
Tra
nsm
issi
on
-1)
17265 17270 17275 17280 17285
Abs
orba
nce
O2
*
***
295K
Nombre d'onde ( cm-1 )
223K
145K
112K
H2O
Wavenumber (cm
Supersonic expansion
80K
(O2)2
Cell cooled down to 77K
First observation of the (O2)2 dimer of oxygen
(1-0) band at 598 nm First observation of the (O2)2 dimer of oxygen
(1-0) band at 598 nm [O2(1g)(v=0)+ O2(1g)(v=1)][O2(3g)(v=0)] 2
Cooled cell
18
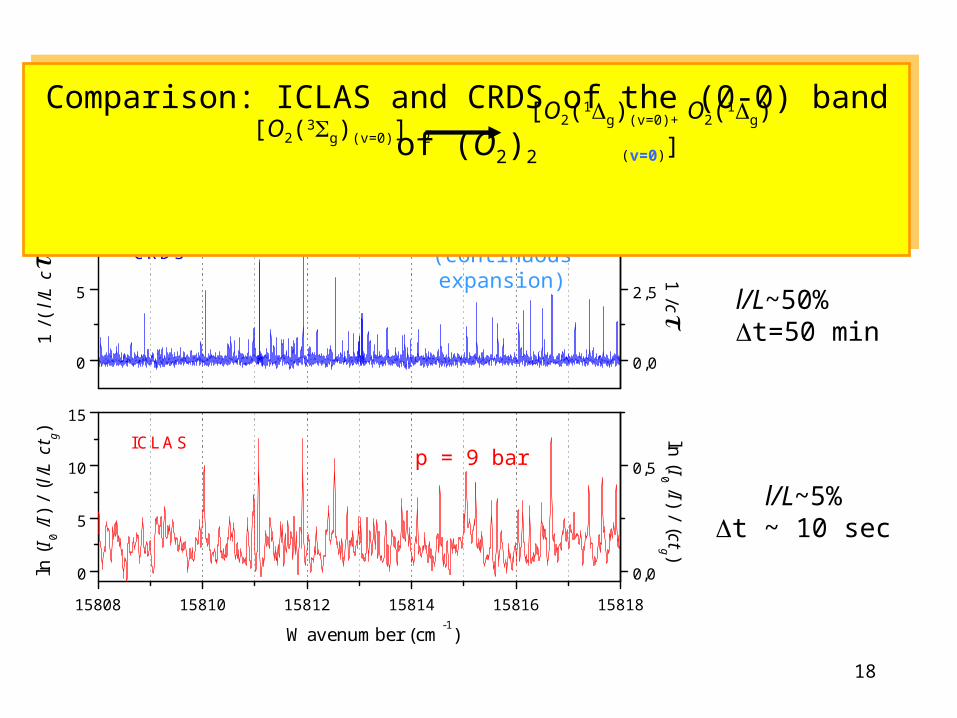
15808 15810 15812 15814 15816 15818
0
5
10
15
x 108
/cm
ln (
I 0 /I)
/ (
l/L c
t g)
1 /(
l/L
c )
1 /cln (I0 /I) / (ctg )
ICLAS
Wavenumber (cm-1)
0
5
10
CRDS
0,0
2,5
5,0
0,0
0,5
l/L~50%t=50 min
l/L~5%t ~ 10 sec
p = 2.7 bar(continuous expansion)
p = 9 bar
Comparison: ICLAS and CRDS of the (0-0) band of (O2)2Comparison: ICLAS and CRDS of the (0-0) band of (O2)2[O2(1g)(v=0)+ O2(1g)(v=0)][O2(3g)(v=0)] 2

19
Spectral regions accessible for ICLASSpectral regions accessible for ICLAS
Ti:Sa
Nd:glass
VECSEL
cm-1
dyes
0 5000 10000 15000 20000 VCH 1 2 3 4 5 6 7VSiH 1 2 3 4 5 6 7 8
20
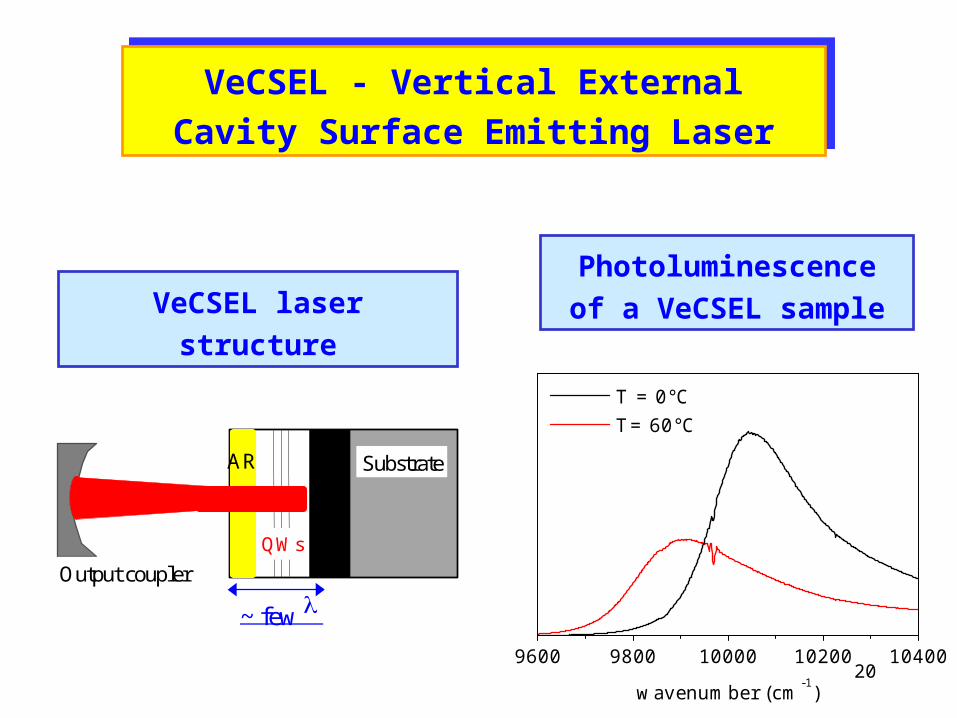
VeCSEL - Vertical External Cavity
Surface Emitting LaserVeCSEL - Vertical External Cavity
Surface Emitting Laser
9600 9800 10000 10200 10400
T = 0°C T= 60°C
wavenumber (cm-1)
Photoluminescence
of a VeCSEL sample
~ few
Substrate
QWs
HRAR
Output coupler
VeCSEL laser structure
21
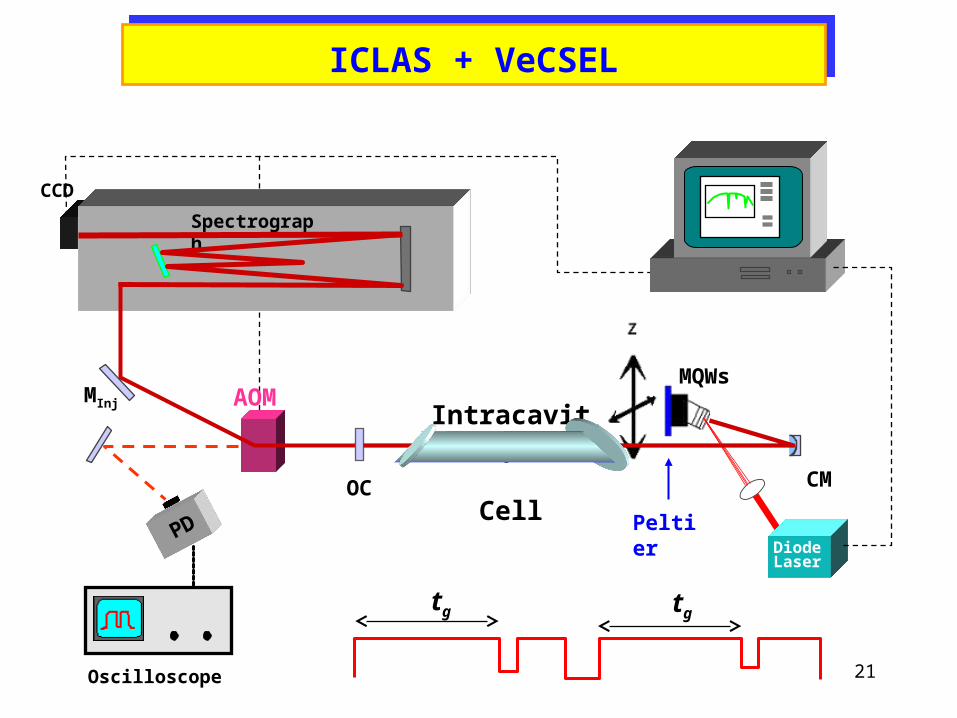
ICLAS + VeCSELICLAS + VeCSEL
AOM
CM
DiodeLaser
OC
CCD
Spectrograph
MInj
MQWs
PD
Oscilloscope
tg tg
Peltier
Intracavity
Cell

22
Head of VeCSELHead of VeCSELMQWs
SDL - diodepumping laser
Intracavity cell
Concave mirrorCooling Peltier element
Towards the outputmirror and spectrometer
23
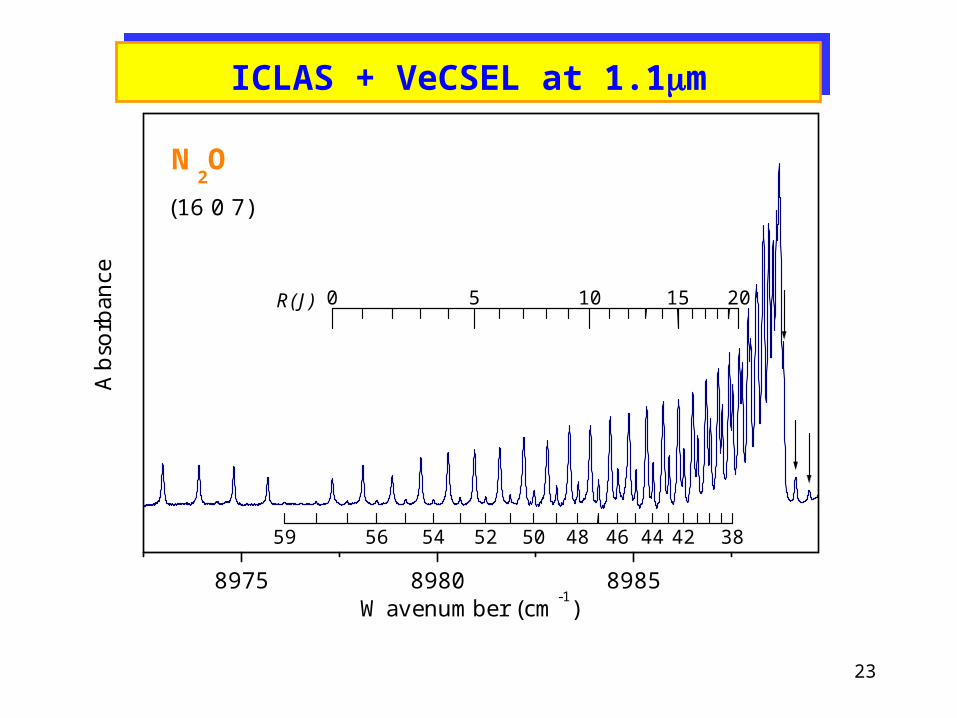
8975 8980 8985
0 5 10 15 20
38424446485052545659
N2O
R(J)
(16 0 7)
Abs
orba
nce
Wavenumber (cm-1)
ICLAS + VeCSEL at 1.1mICLAS + VeCSEL at 1.1m
24
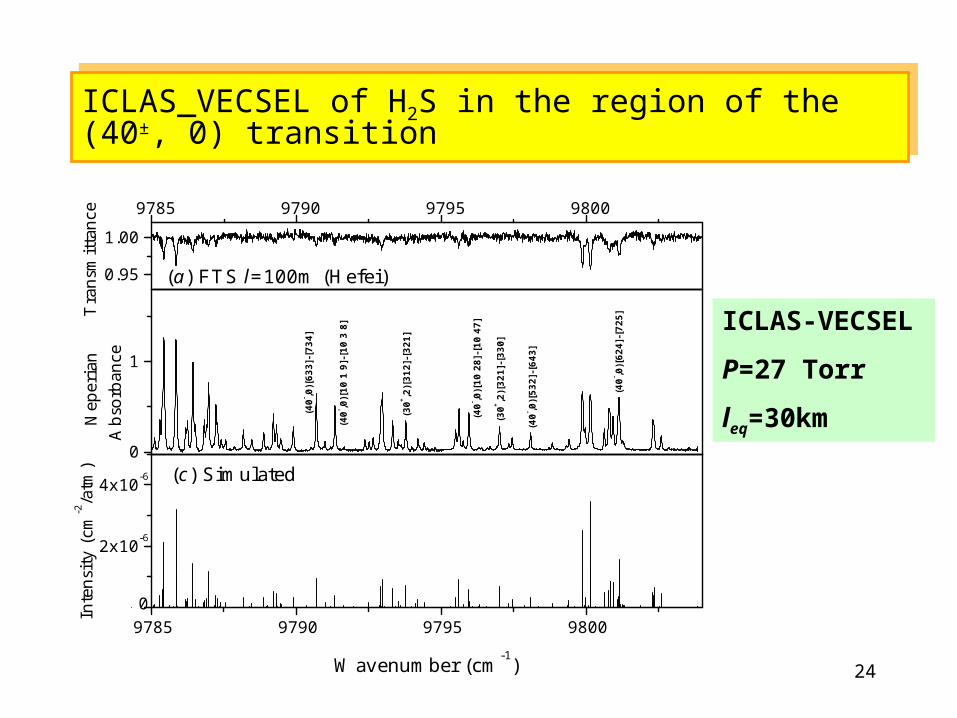
ICLAS_VECSEL of H2S in the region of the (40±, 0) transitionICLAS_VECSEL of H2S in the region of the (40±, 0) transition
0.95
1.00
9785 9790 9795 9800
Wavenumber (cm-1)
N
eper
ian
Abs
orba
nce
Inte
nsity
(cm
-2/a
tm)
Tra
nsm
ittan
ce
(a) FTS l=100m (Hefei)
0
1
(30+ ,2
)[32
1]-[
330]
(40- ,0
)[53
2]-[
643]
(30+ ,2
)[31
2]-[
321]
(40- ,0
)[10
28]
-[10
47]
(40- ,0
)[62
4]-[
725]
(40- ,0
)[10
1 9
]-[1
0 3
8]
(40- ,0
)[63
3]-[
734]
9785 9790 9795 98000
2x10⁻⁶
4x10⁻⁶ (c) Simulated
ICLAS-VECSEL
P=27 Torr
leq=30km
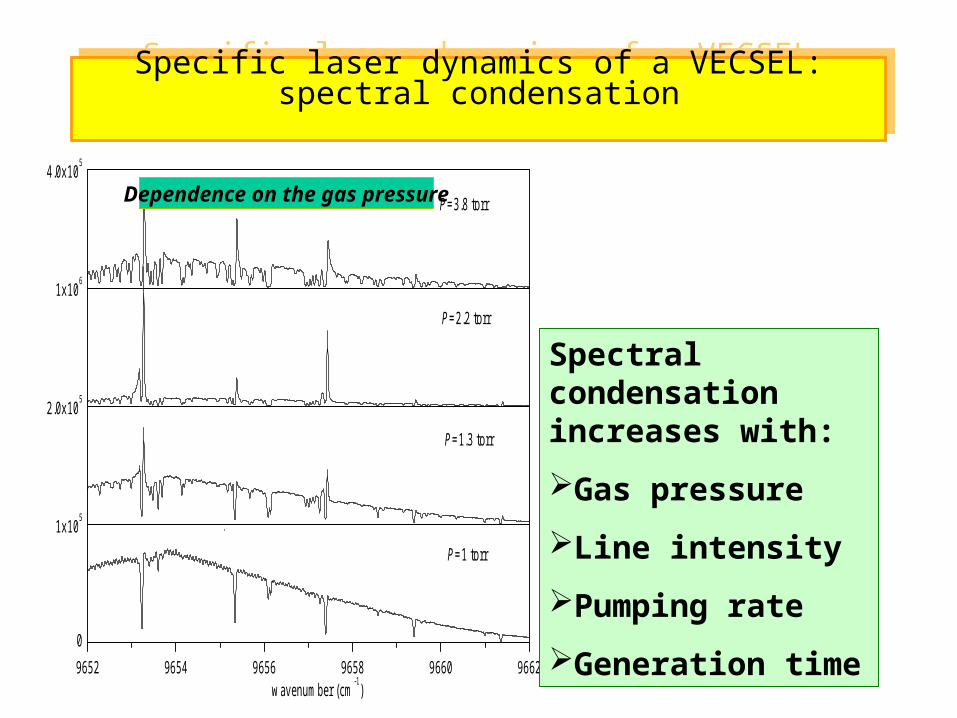
259652 9654 9656 9658 9660 96620
1x10⁵
P=1 torr
wavenumber (cm-1)
2.0x10⁵
P=1.3 torr
1x10⁶
P=2.2 torr
4.0x10⁵
P=3.8 torr
Specific laser dynamics of a VECSEL: spectral condensationSpecific laser dynamics of a VECSEL: spectral condensation
Spectral condensation increases with:
Gas pressure
Line intensity
Pumping rate
Generation time
Dependence on the gas pressure
26
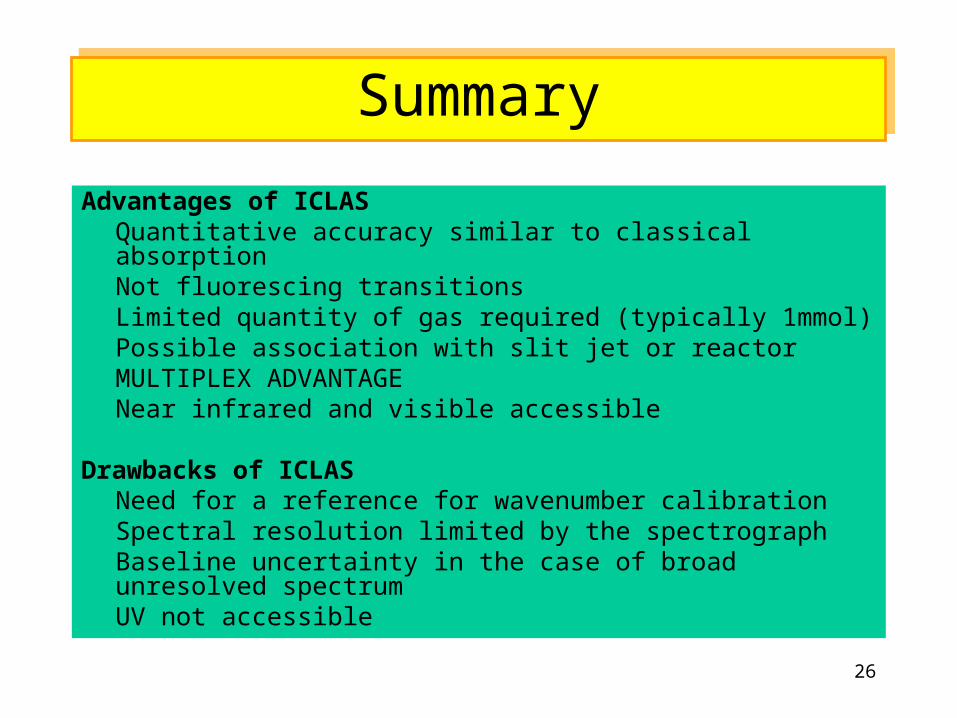
Advantages of ICLASQuantitative accuracy similar to classical absorptionNot fluorescing transitionsLimited quantity of gas required (typically 1mmol)Possible association with slit jet or reactorMULTIPLEX ADVANTAGENear infrared and visible accessible
Drawbacks of ICLASNeed for a reference for wavenumber calibrationSpectral resolution limited by the spectrograph Baseline uncertainty in the case of broad unresolved spectrumUV not accessible
SummarySummary