Embed Size (px)
Citation preview

03/11/2014
Agricoltura
Migliore output con minore input Fondazione Edmund Mach
AlimentazioneKieran Tuohy
Fondazione Edmund Mach, TN
Research & Innovation Centre
Intestinal microbiota, diet and health.
The human gut microbiota
Interactions with;
•Diet
•Drugs
•Immune system
•Gut physiology
•Bile acids/liver
•Systemic metabolism
•Adipose tissue
•Brain development & function
Up to 1000 species
70% unculturable
Closely co‐evolved microbial partners
03/11/2014
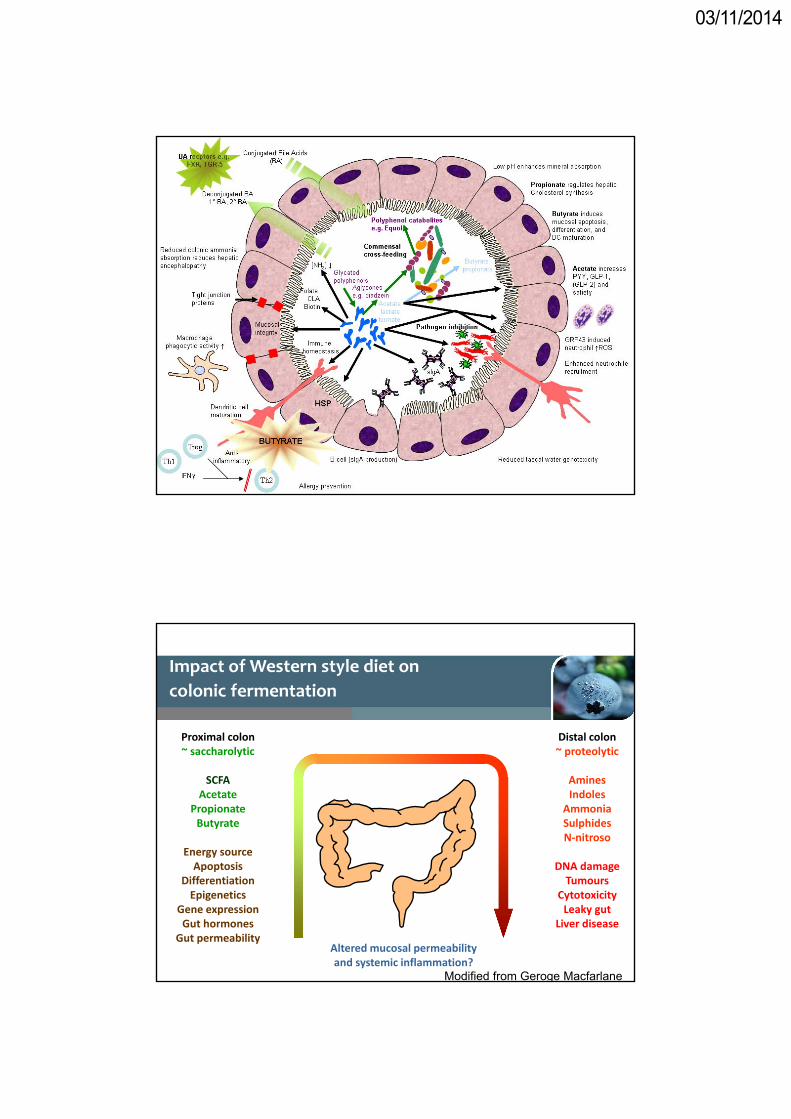
Impact of Western style diet on
colonic fermentation
Altered mucosal permeability and systemic inflammation?
Proximal colon~ saccharolytic
SCFAAcetate
PropionateButyrate
Energy sourceApoptosis
DifferentiationEpigenetics
Gene expressionGut hormones
Gut permeability
Distal colon~ proteolytic
AminesIndoles
AmmoniaSulphidesN‐nitroso
DNA damageTumours
CytotoxicityLeaky gut
Liver disease
Modified from Geroge Macfarlane
03/11/2014
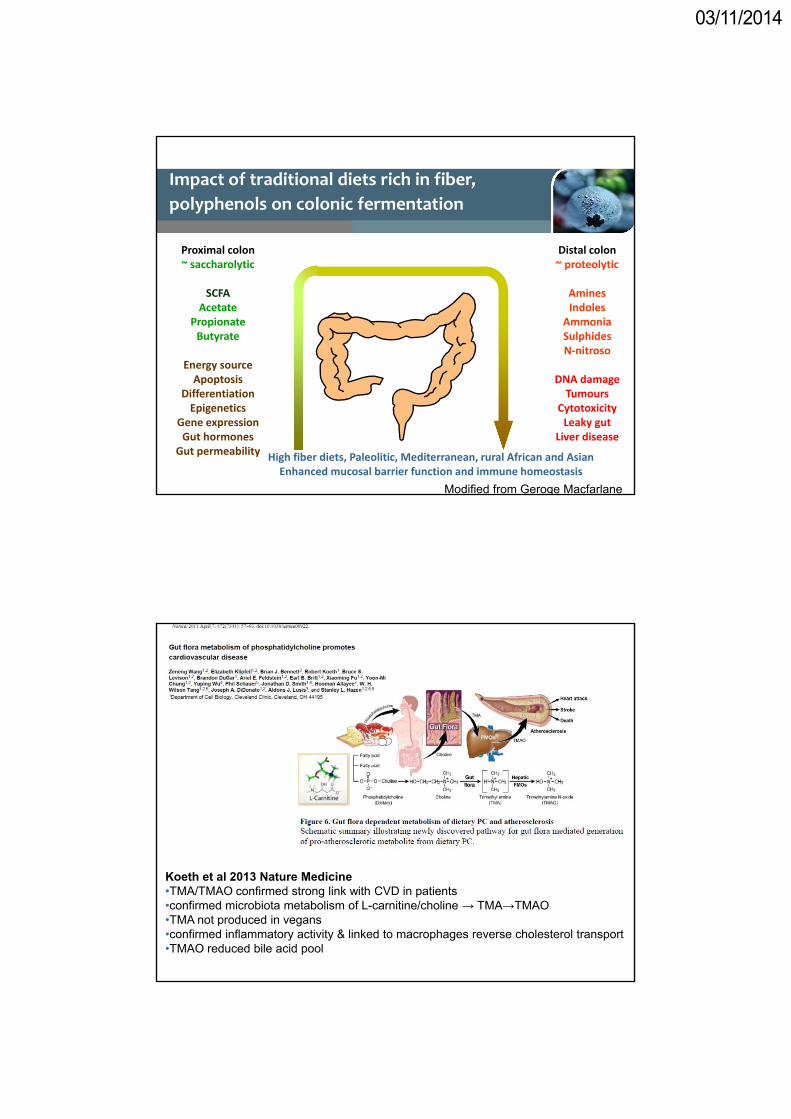
Impact of traditional diets rich in fiber,
polyphenols on colonic fermentation
High fiber diets, Paleolitic, Mediterranean, rural African and AsianEnhanced mucosal barrier function and immune homeostasis
Proximal colon~ saccharolytic
SCFAAcetate
PropionateButyrate
Energy sourceApoptosis
DifferentiationEpigenetics
Gene expressionGut hormones
Gut permeability
Distal colon~ proteolytic
AminesIndoles
AmmoniaSulphidesN‐nitroso
DNA damageTumours
CytotoxicityLeaky gut
Liver disease
Modified from Geroge Macfarlane
Koeth et al 2013 Nature Medicine•TMA/TMAO confirmed strong link with CVD in patients •confirmed microbiota metabolism of L-carnitine/choline → TMA→TMAO•TMA not produced in vegans•confirmed inflammatory activity & linked to macrophages reverse cholesterol transport •TMAO reduced bile acid pool

03/11/2014
birth weaningsbabies adultsinfants aged
2
4
6
8
10
12Bacteroids, Eubacterium, Peptococooccae
Group I
Group II
Group III
Bifidobacterium
Escherichia coli, Streptococcus
Lactobacillus
Clostridium perfringensLo
g c
ou
nt
of
bac
teri
a /g
fec
es
Human diet shaped our closely co-evolved human:microbe ecosystem
Dietary evolution
•Neolithic times: ~10,000 yrs BP (birth of agriculture)
•Agricultural/Industrial revolutions: Late 18th and early 19th century
•Recent changes: Over the last 50 yrs (Western-style diet)
Human microbiome evolution
03/11/2014
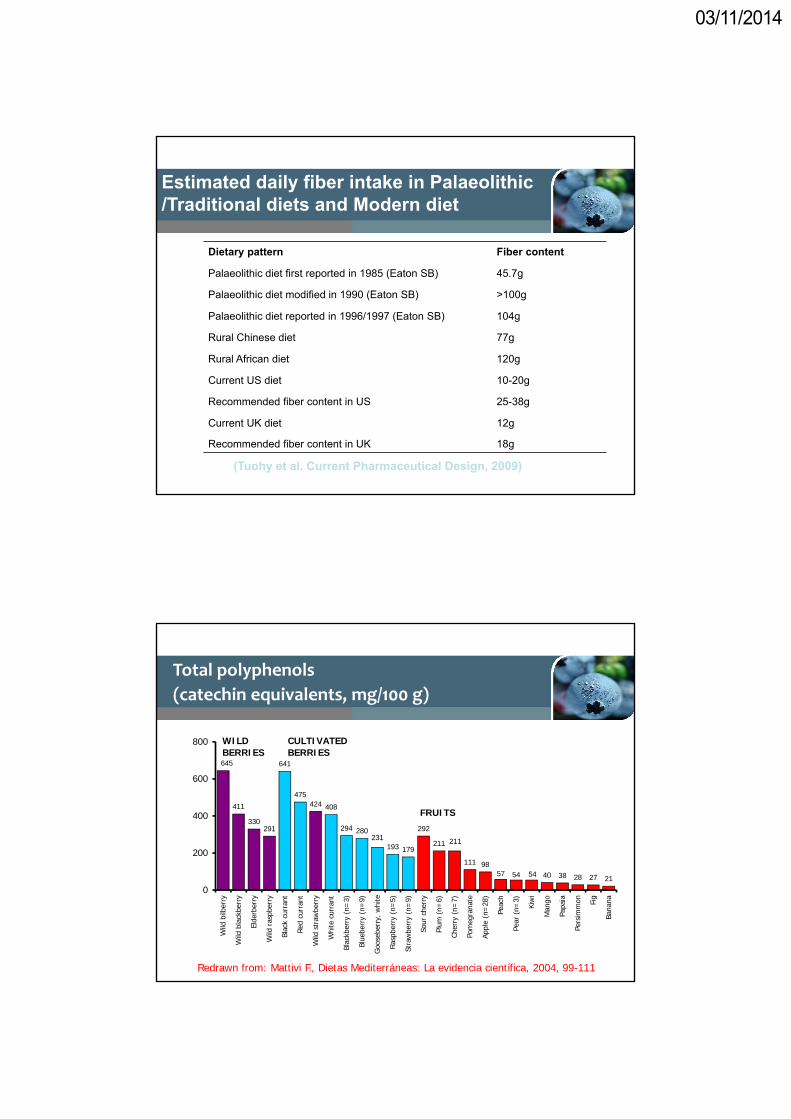
Estimated daily fiber intake in Palaeolithic /Traditional diets and Modern diet
Dietary pattern Fiber content
Palaeolithic diet first reported in 1985 (Eaton SB) 45.7g
Palaeolithic diet modified in 1990 (Eaton SB) >100g
Palaeolithic diet reported in 1996/1997 (Eaton SB) 104g
Rural Chinese diet 77g
Rural African diet 120g
Current US diet 10-20g
Recommended fiber content in US 25-38g
Current UK diet 12g
Recommended fiber content in UK 18g
(Tuohy et al. Current Pharmaceutical Design, 2009)
Total polyphenols
(catechin equivalents, mg/100 g)
Redrawn from: Mattivi F., Dietas Mediterráneas: La evidencia científica, 2004, 99-111
411
330291
641
475424 408
294 280
193 179
292
211
111 9840 38 28 27 21
645
57 54 54
231 211
0
200
400
600
800
Wild
bilb
erry
Wild
bla
ckbe
rry
Elde
rber
ry
Wild
ras
pber
ry
Blac
k cu
rran
t
Red
curr
ant
Wild
str
awbe
rry
Whi
te c
urra
nt
Blac
kber
ry (
n=3)
Blue
berr
y (n
=9)
Goo
sebe
rry,
whi
te
Rasp
berr
y (n
=5)
Stra
wbe
rry
(n=
9)
Sour
che
rry
Plum
(n=
6)
Cher
ry (
n=7)
Pom
egra
nate
Appl
e (n
=28
)
Peac
h
Pear
(n=
3)
Kiw
i
Man
go
Papa
ia
Pers
imm
on Fig
Bana
na
WILD BERRIES
CULTIVATED BERRIES
FRUITS
03/11/2014
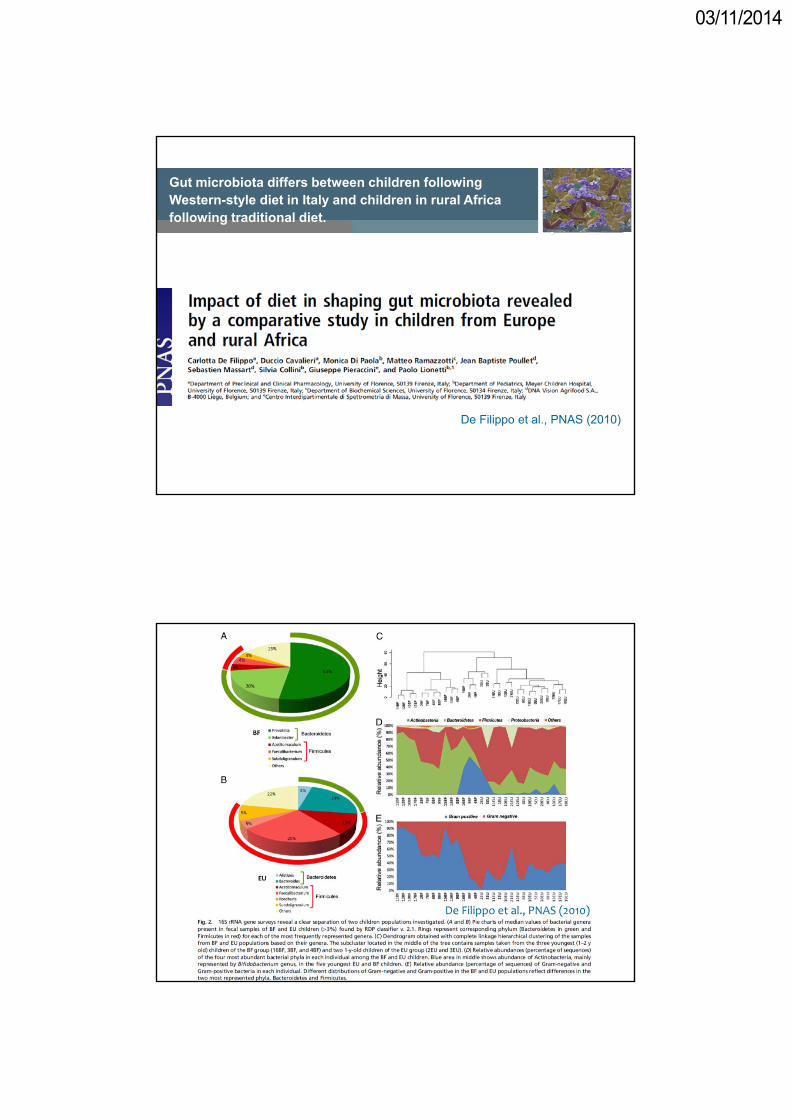
Gut microbiota differs between children following Western-style diet in Italy and children in rural Africa following traditional diet.
De Filippo et al., PNAS (2010)
Increasing
De Filippo et al., PNAS (2010)
03/11/2014
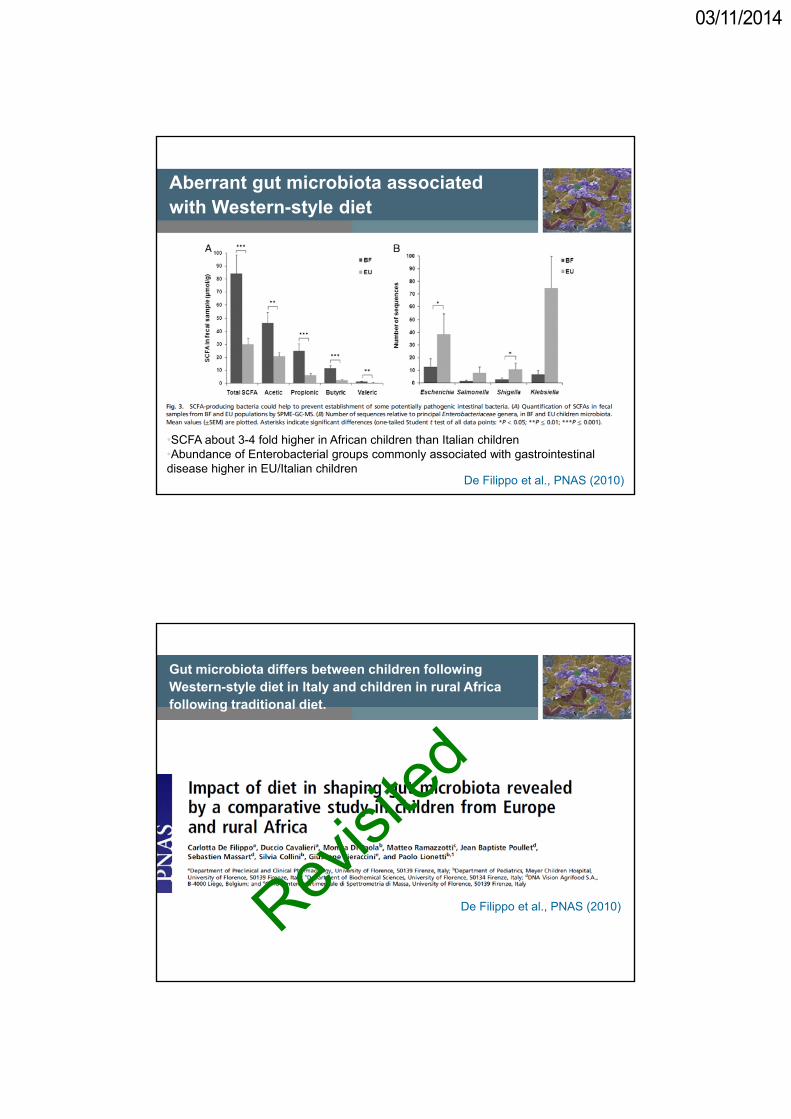
Aberrant gut microbiota associated with Western-style diet
British Journal of Nutrition 2011
•SCFA about 3-4 fold higher in African children than Italian children•Abundance of Enterobacterial groups commonly associated with gastrointestinal disease higher in EU/Italian children
De Filippo et al., PNAS (2010)
Gut microbiota differs between children following Western-style diet in Italy and children in rural Africa following traditional diet.
De Filippo et al., PNAS (2010)
03/11/2014
a.
e.
d.
c.
b.
f.
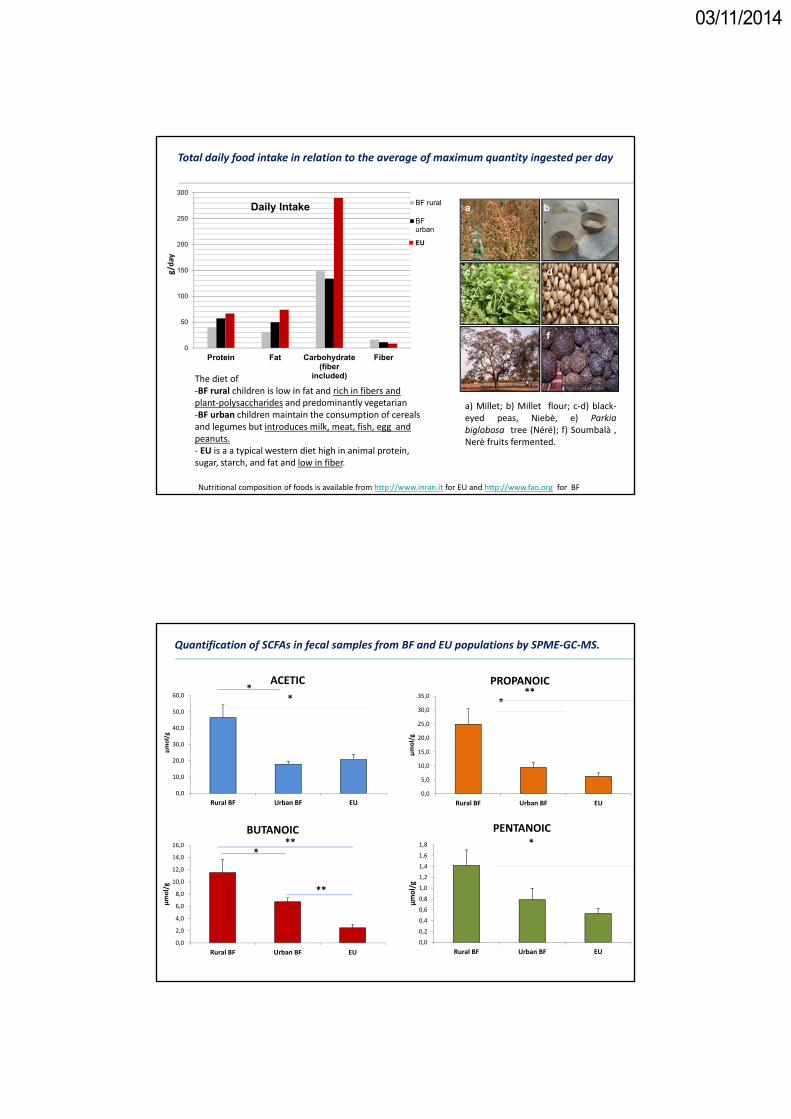
Total daily food intake in relation to the average of maximum quantity ingested per dayg/day
Nutritional composition of foods is available from http://www.inran.it for EU and http://www.fao.org for BF
a) Millet; b) Millet flour; c‐d) black‐eyed peas, Niebè, e) Parkiabiglobosa tree (Néré); f) Soumbalà ,Nerè fruits fermented.
The diet of ‐BF rural children is low in fat and rich in fibers and plant‐polysaccharides and predominantly vegetarian‐BF urban children maintain the consumption of cereals and legumes but introduces milk, meat, fish, egg and peanuts.‐ EU is a a typical western diet high in animal protein, sugar, starch, and fat and low in fiber.
0
50
100
150
200
250
300
Protein Fat Carbohydrate(fiber
included)
Fiber
Daily Intake BF rural
BFurban
EU
0,0
10,0
20,0
30,0
40,0
50,0
60,0
Rural BF Urban BF EU
µmol/g
ACETIC*
*
0,0
2,0
4,0
6,0
8,0
10,0
12,0
14,0
16,0
Rural BF Urban BF EU
µmol/g
BUTANOIC**
*
**
0,0
5,0
10,0
15,0
20,0
25,0
30,0
35,0
Rural BF Urban BF EU
µmol/g
PROPANOIC
***
0,0
0,2
0,4
0,6
0,8
1,0
1,2
1,4
1,6
1,8
Rural BF Urban BF EU
µmol/g
PENTANOIC*
Quantification of SCFAs in fecal samples from BF and EU populations by SPME‐GC‐MS.
03/11/2014
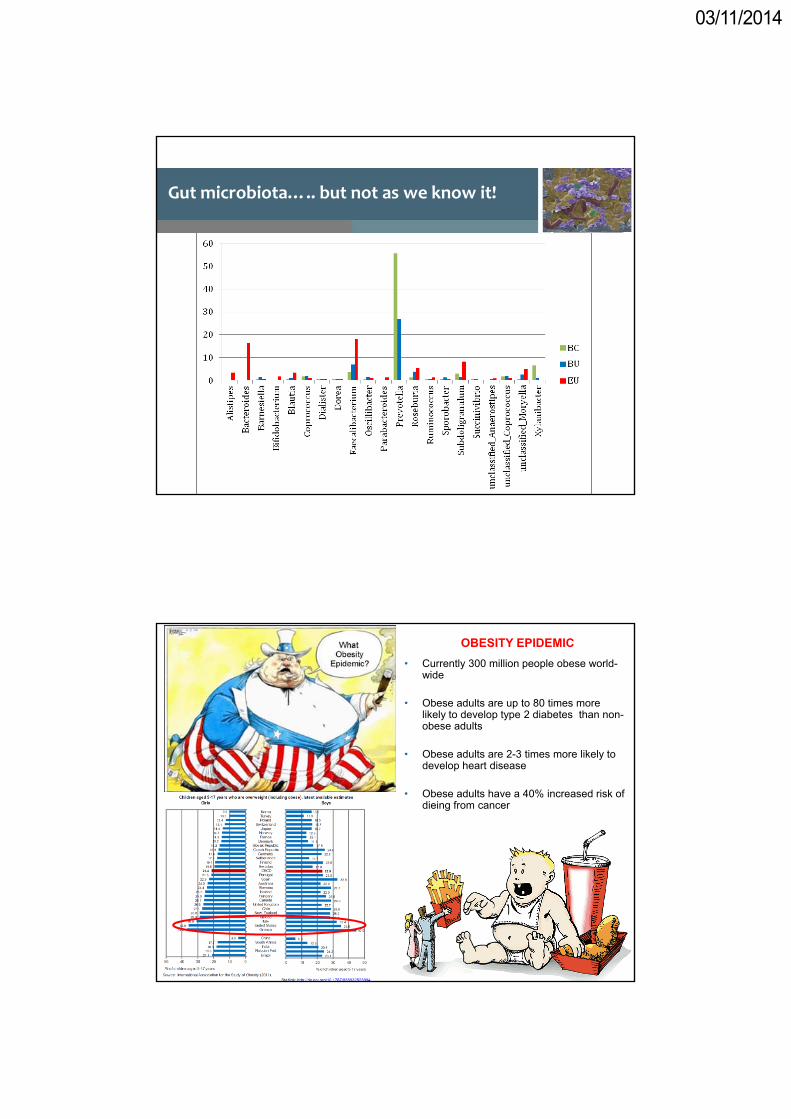
Gut microbiota….. but not as we know it!
• Currently 300 million people obese world-wide
• Obese adults are up to 80 times more likely to develop type 2 diabetes than non-obese adults
• Obese adults are 2-3 times more likely to develop heart disease
• Obese adults have a 40% increased risk of dieing from cancer
OBESITY EPIDEMIC
03/11/2014
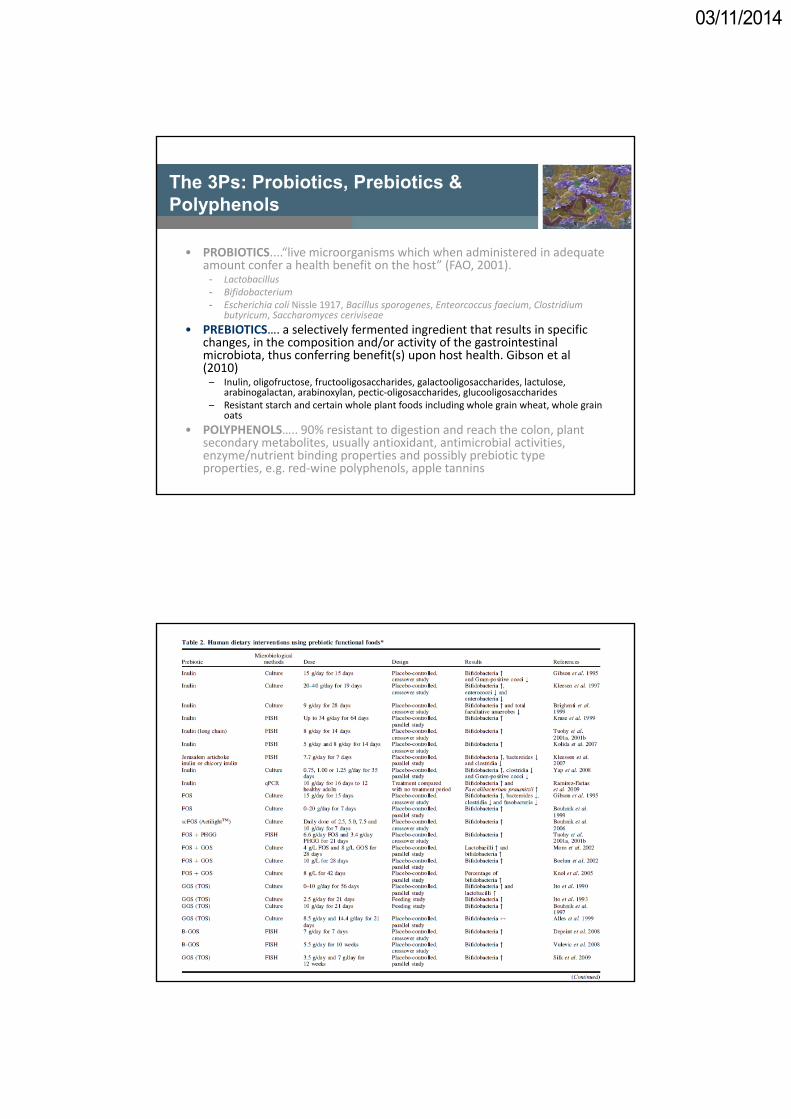
The 3Ps: Probiotics, Prebiotics & Polyphenols
• PROBIOTICS....“live microorganisms which when administered in adequate amount confer a health benefit on the host” (FAO, 2001).
- Lactobacillus- Bifidobacterium- Escherichia coli Nissle 1917, Bacillus sporogenes, Enteorcoccus faecium, Clostridium
butyricum, Saccharomyces ceriviseae
• PREBIOTICS…. a selectively fermented ingredient that results in specific changes, in the composition and/or activity of the gastrointestinal microbiota, thus conferring benefit(s) upon host health. Gibson et al (2010)– Inulin, oligofructose, fructooligosaccharides, galactooligosaccharides, lactulose,
arabinogalactan, arabinoxylan, pectic‐oligosaccharides, glucooligosaccharides– Resistant starch and certain whole plant foods including whole grain wheat, whole grain
oats
• POLYPHENOLS….. 90% resistant to digestion and reach the colon, plant secondary metabolites, usually antioxidant, antimicrobial activities, enzyme/nutrient binding properties and possibly prebiotic type properties, e.g. red‐wine polyphenols, apple tannins
Gut microbiota and systemic health
Obesity
LaxationLipid
metabolism
Diarrhoea/IBS
Cancer (CRC)
Blood glucose
Mineral absorption
IBD
Satiety
Immune function
Probiotics

03/11/2014
• Lb. reuteri selected for Bile Salt Hydrolase activity (2 capsules/day at 2 x 10⁹ CFU/capsule) for 9 weeks
• Randomized, double-blind, placebo-controlled, parallel-arm, multicenter study
• N=127 hypercholesterolemic patients• Probiotic reduced plasma
– TC by 9.14%– LDL-C by 11.64%– LDL-C/HDL-C ratio by 13.39%– Non-cholesterol plant sterols– Increased circulating deconjugated bile acids
• Proposed new cholesterol lowering activity of probiotics via modified absorption of lipids from the gut
Table 1. Cellular actions described for TGR5 in different cell types. ∗Macrophages include alveolar macrophages, Kupffer cells and THP-1 cells.
BA, fat & glucose homeostasisInflammation (NF-κB)
Enterohepatic BA circulationmicrobiota
(deconjugation, 1°→ 2°)
Journal of Hepatology (2011)
FXRα
VDR
PXR
03/11/2014
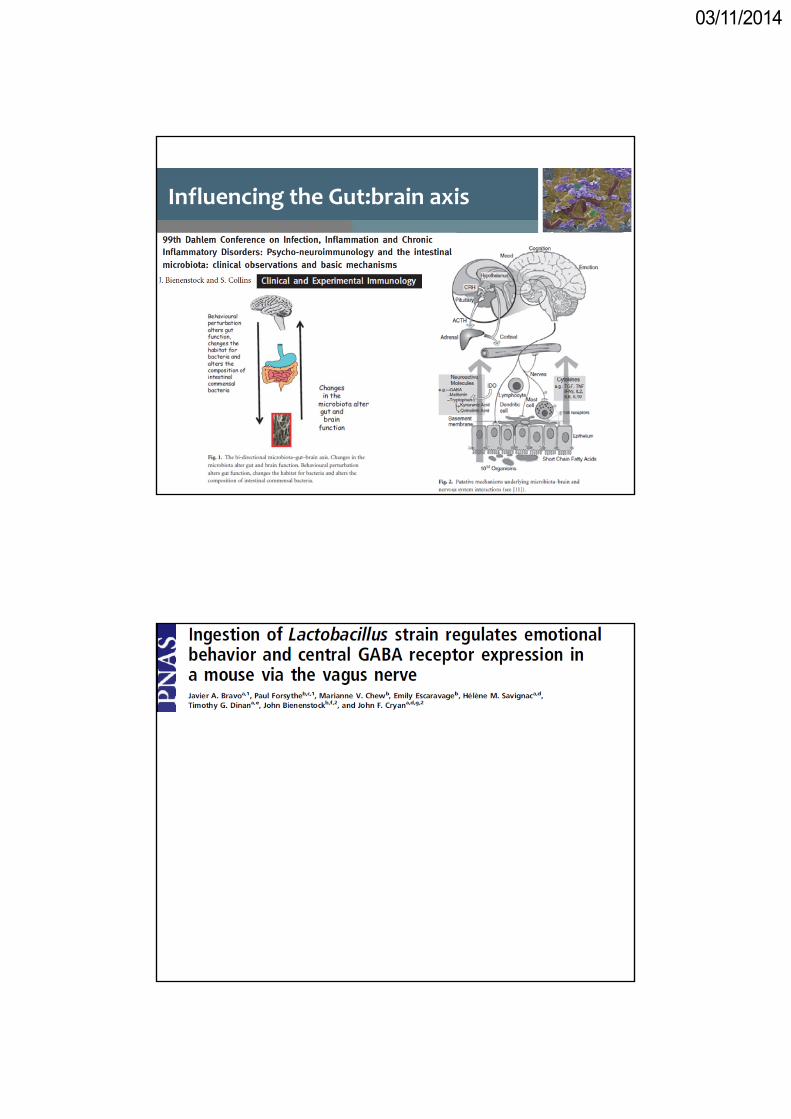
Influencing the Gut:brain axis
03/11/2014
03/11/2014
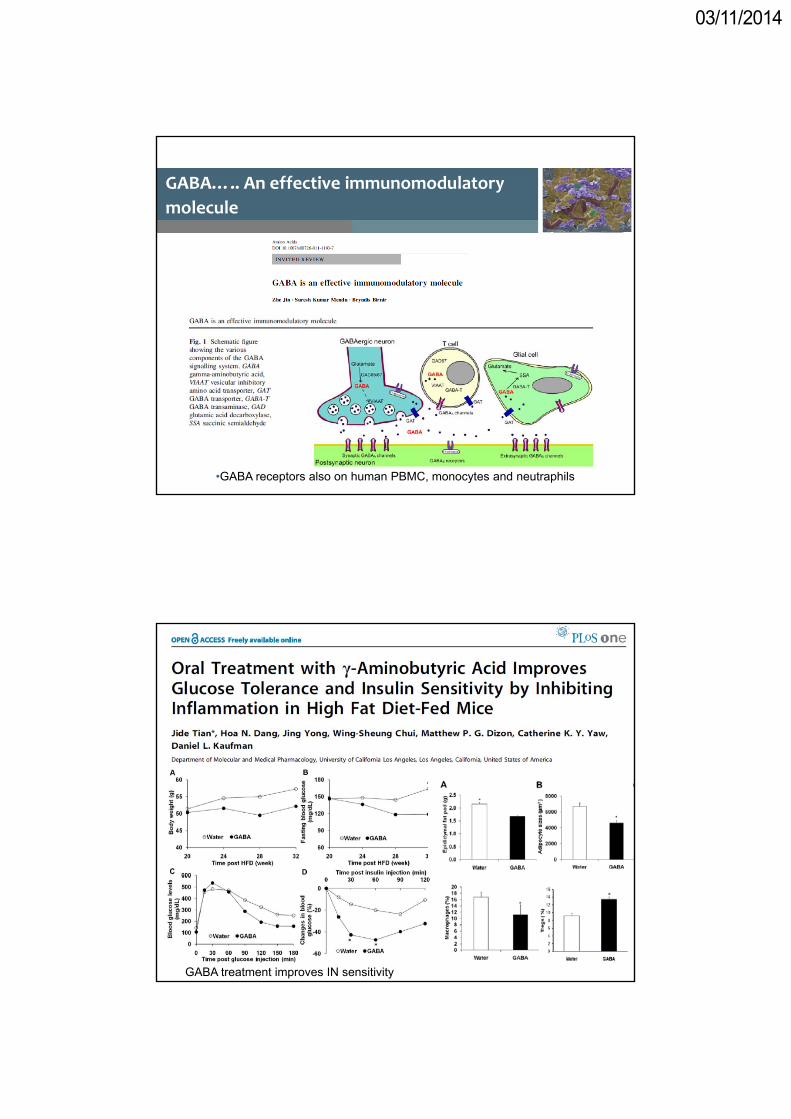
GABA….. An effective immunomodulatory
molecule
•GABA receptors also on human PBMC, monocytes and neutraphils
GABA treatment improves IN sensitivity
03/11/2014
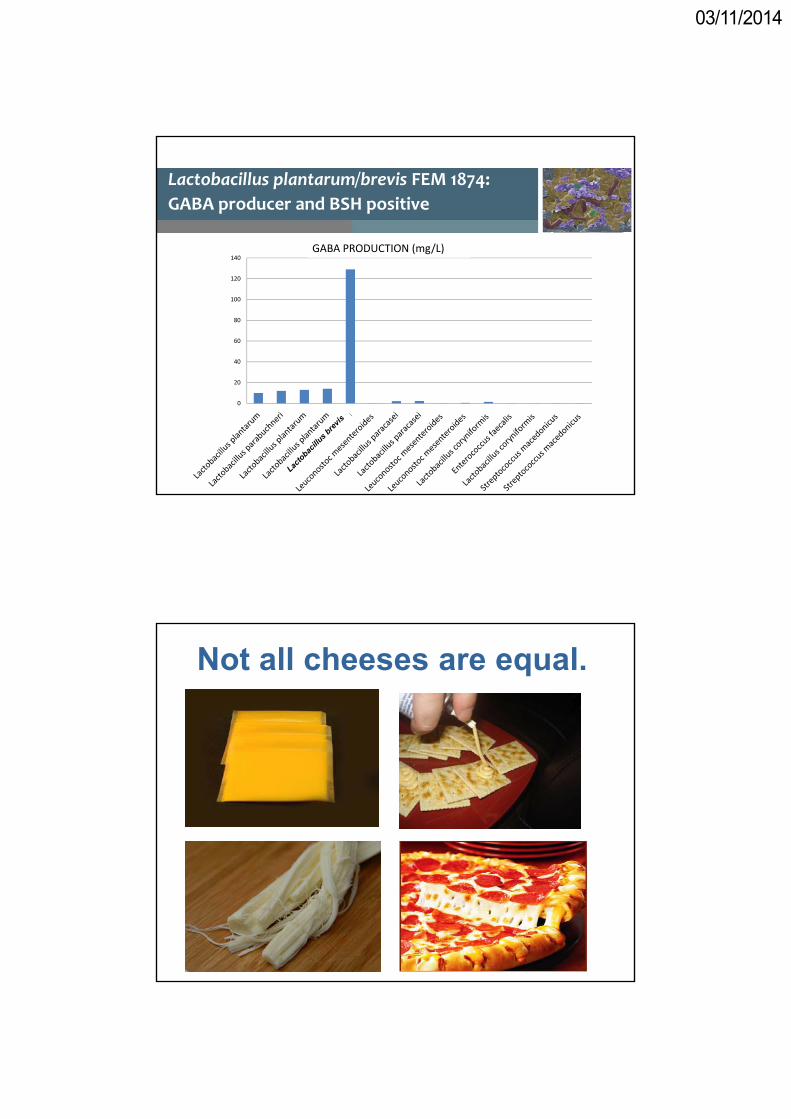
Lactobacillus plantarum/brevis FEM 1874:
GABA producer and BSH positive
0
20
40
60
80
100
120
140
High producers of GABA GABA PRODUCTION (mg/L)
Not all cheeses are equal.
03/11/2014
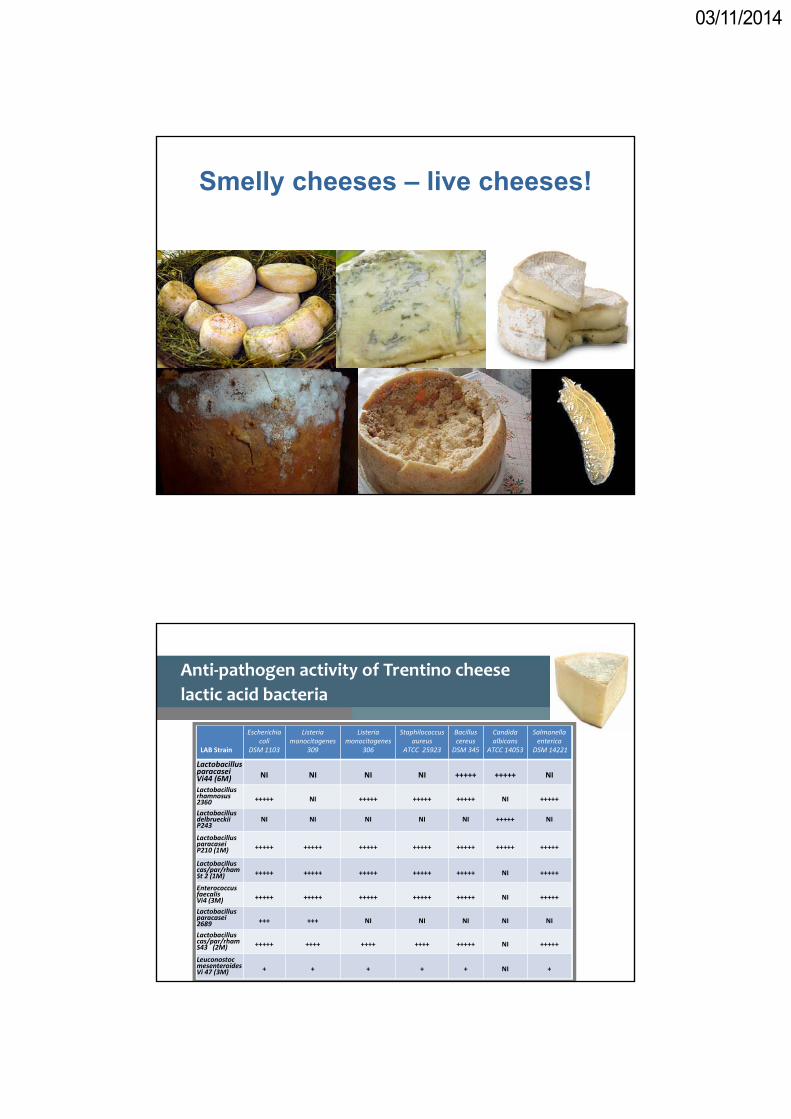
Smelly cheeses – live cheeses!
Anti‐pathogen activity of Trentino cheese
lactic acid bacteria
LAB Strain
Escherichiacoli
DSM 1103
Listeriamonocitogenes
309
Listeriamonocitogenes
306
Staphilococcusaureus
ATCC 25923
Bacilluscereus
DSM 345
Candidaalbicans
ATCC 14053
Salmonellaenterica
DSM 14221
LactobacillusparacaseiVi44 (6M) NI NI NI NI +++++ +++++ NI
Lactobacillusrhamnosus2360 +++++ NI +++++ +++++ +++++ NI +++++
LactobacillusdelbrueckiiP243
NI NI NI NI NI +++++ NI
Lactobacillusparacasei P210 (1M) +++++ +++++ +++++ +++++ +++++ +++++ +++++
Lactobacilluscas/par/rhamSt 2 (1M) +++++ +++++ +++++ +++++ +++++ NI +++++
EnterococcusfaecalisVi4 (3M) +++++ +++++ +++++ +++++ +++++ NI +++++
Lactobacillusparacasei 2689 +++ +++ NI NI NI NI NI
Lactobacilluscas/par/rhamS43 (2M) +++++ ++++ ++++ ++++ +++++ NI +++++
LeuconostocmesenteroidesVi 47 (3M) + + + + + NI +
03/11/2014
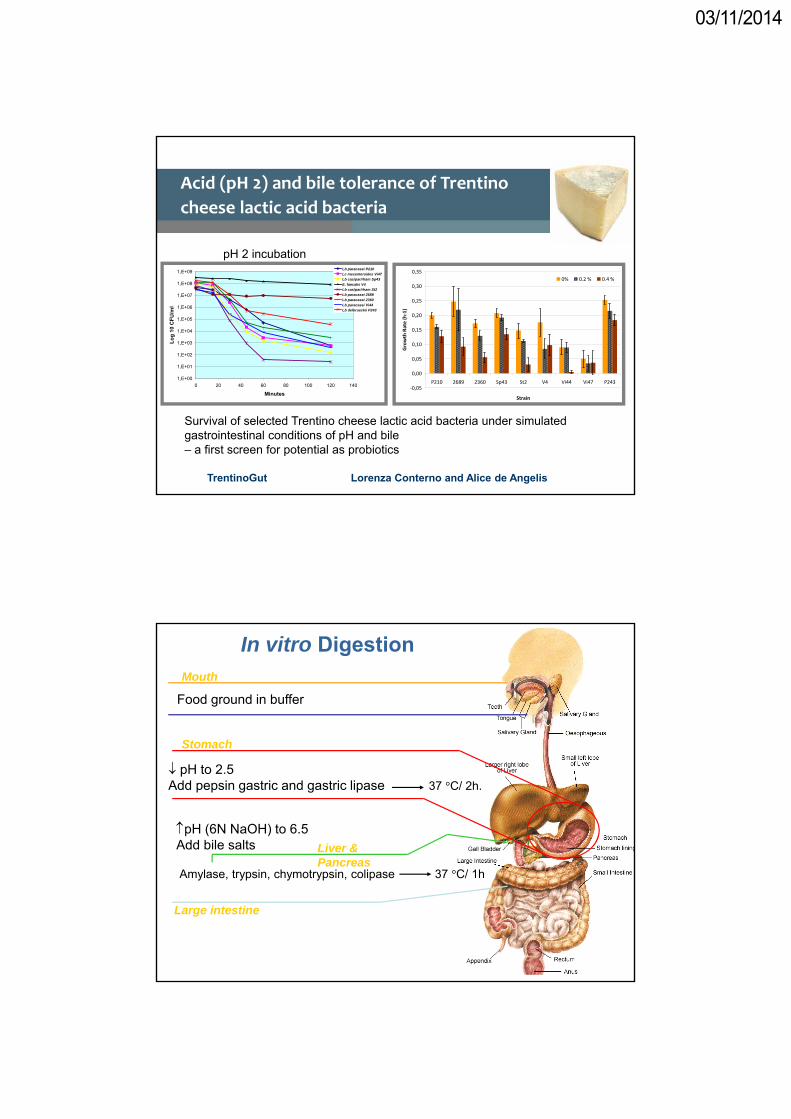
Acid (pH 2) and bile tolerance of Trentino
cheese lactic acid bacteria
1,E+00
1,E+01
1,E+02
1,E+03
1,E+04
1,E+05
1,E+06
1,E+07
1,E+08
1,E+09
0 20 40 60 80 100 120 140
Minutes
Lo
g 1
0 C
FU
/ml
Lb paracasei P210
Lc mesenteroides Vi47
Lb cas/par/rham Sp43
E. faecalis V4
Lb cas/par/rham St2
Lb paracasei 2689
Lb paracasei 2360
Lb paracasei Vi44
Lb delbrueckii P243
‐0,05
0,00
0,05
0,10
0,15
0,20
0,25
0,30
0,35
P210 2689 2360 Sp43 St2 V4 Vi44 Vi47 P243
StrainGrowth Rate (h‐1)
0% 0.2 % 0.4 %
Survival of selected Trentino cheese lactic acid bacteria under simulated gastrointestinal conditions of pH and bile – a first screen for potential as probiotics
TrentinoGut Lorenza Conterno and Alice de Angelis
pH 2 incubation
In vitro Digestion
pH to 2.5Add pepsin gastric and gastric lipase 37 °C/ 2h.
pH (6N NaOH) to 6.5Add bile salts
Food ground in buffer
Mouth
Stomach
Liver & Pancreas
Large intestine
Amylase, trypsin, chymotrypsin, colipase 37 °C/ 1h

03/11/2014
Selection of putative probiotics from lactic
acid bacteria isolated from Trentino cheeses
•….
•Aim: to select putative probiotics suitable for cheese applications from Trnetino dairy Microbiome
•TrentinoGut - Lorenza Conterno
•University of Camerino, Stefania Silvi and Alice de Angelis
•Strains kindly isolated and provided by Elena Franciosi
Putative Trentino probiotic survival under
gastrointestinal conditions in presence and
absernce of cheese matrix
0
10
20
30
40
50
60
70
2689 St2 2360Strain
Survival%
CultureBroth
CultureinModelCheese
2689 = Lactobacillus paracaseiSt2 = Lactobacillus casei paracasei rhamnosus2360 = Lactobacillus rhamnosus
TrentinoGut Lorenza Conterno and Alice de Angelis
03/11/2014
The 3Ps: Probiotics, Prebiotics & Polyphenols
• PROBIOTICS....“live microorganisms which when administered in adequate amount confer a health benefit on the host” (FAO, 2001).
- Lactobacillus- Bifidobacterium- Escherichia coli Nissle 1917, Bacillus sporogenes, Enteorcoccus faecium, Clostridium
butyricum, Saccharomyces ceriviseae
• PREBIOTICS…. a selectively fermented ingredient that results in specific changes, in the composition and/or activity of the gastrointestinal microbiota, thus conferring benefit(s) upon host health. Gibson et al (2010)– Inulin, oligofructose, fructooligosaccharides, galactooligosaccharides, lactulose,
arabinogalactan, arabinoxylan, pectic‐oligosaccharides, glucooligosaccharides– Resistant starch and certain whole plant foods including whole grain wheat, whole grain
oats
• POLYPHENOLS….. 90% resistant to digestion and reach the colon, plant secondary metabolites, usually antioxidant, antimicrobial activities, enzyme/nutrient binding properties and possibly prebiotic type properties, e.g. red‐wine polyphenols, apple tannins
CCC
03/11/2014
CCC
Gut microbiota and systemic health
Obesity
LaxationLipid
metabolism
Diarrhoea/IBS
Cancer (CRC)
Blood glucose
Mineral absorption
IBD
Satiety
Immune function
Prebiotics
03/11/2014
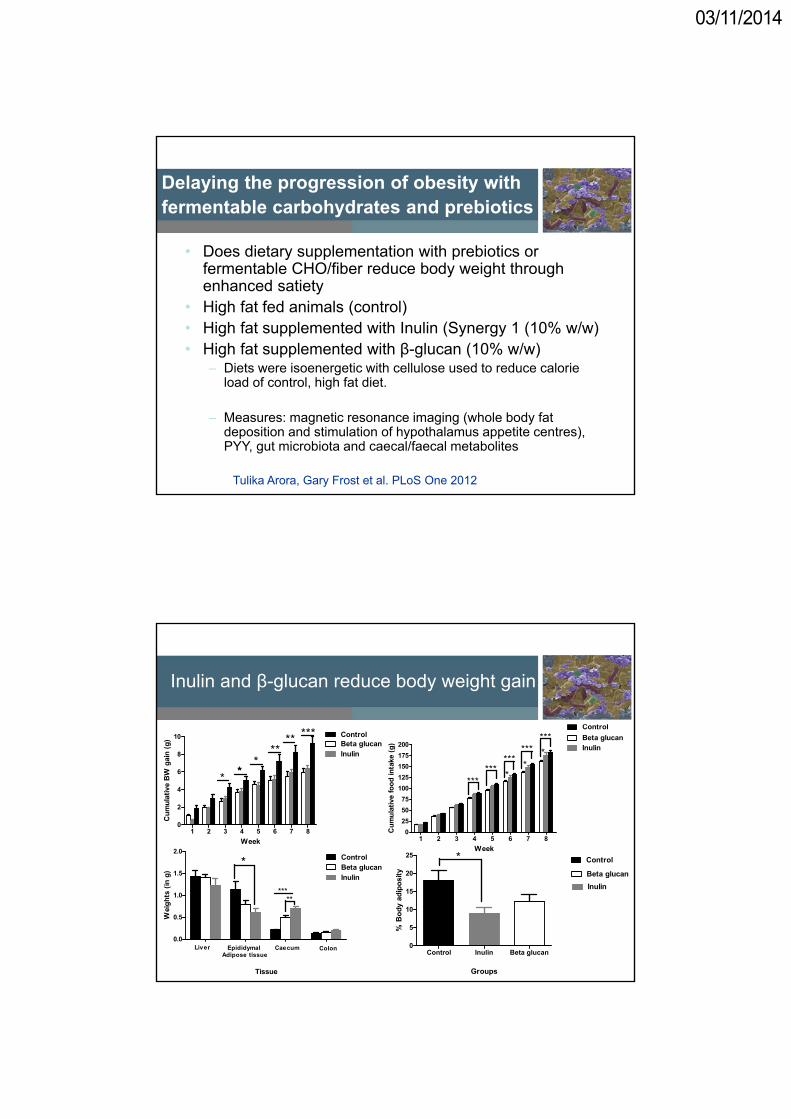
Delaying the progression of obesity with fermentable carbohydrates and prebiotics
• Does dietary supplementation with prebiotics or fermentable CHO/fiber reduce body weight through enhanced satiety
• High fat fed animals (control)• High fat supplemented with Inulin (Synergy 1 (10% w/w)• High fat supplemented with β-glucan (10% w/w)
– Diets were isoenergetic with cellulose used to reduce calorie load of control, high fat diet.
– Measures: magnetic resonance imaging (whole body fat deposition and stimulation of hypothalamus appetite centres), PYY, gut microbiota and caecal/faecal metabolites
Tulika Arora, Gary Frost et al. PLoS One 2012
1 2 3 4 5 6 7 80
2
4
6
8
10Beta glucanInulin
Control
**** ***
* ***
Week
Cu
mu
lati
ve B
W g
ain
(g
)
1 2 3 4 5 6 7 80
25
50
75
100
125
150
175
200Beta glucanInulin
Control
******
******
***
**
*
Week
Cu
mu
lati
ve f
oo
d in
take
(g
)
0.0
0.5
1.0
1.5
2.0ControlBeta glucanInulin
Liver EpididymalAdipose tissue
Caecum Colon
*
*****
Tissue
Wei
gh
ts (
in g
)
Control Inulin Beta glucan0
5
10
15
20
25 * Control
Inulin
Beta glucan
Groups
% B
od
y ad
ipo
sity
Inulin and β-glucan reduce body weight gain

03/11/2014
Effect of inulin and β-glucan supplementation on adiposity
parameters and PYY level in high fat fed mice.
The values with different superscripts letters are significantly different from each other
HFD-C HFD-I HFD-BG
Epididymal adipose tissue (g)
1.14±0.16a 0.59±0.10b 0.77±0.10a
Whole body adiposity (%) 18.03±2.72a 8.95±1.66b 12.17±1.92a
Liver lipid content (%) 6.30±1.62a 6.02±1.97a 6.02±1.36a
Muscle lipid content (%) 0.96±0.149a 0.72±0.05a 1.29±0.57a
Visceral fat (g) 2.17±0.46a 1.23±0.17a 1.49±0.27a
Subcutaneous fat (g) 3.40±0.53a 2.08±0.13a 2.44±0.28a
Adipocyte size (μm) 122.25±10.2a 72.95±8.72b
111.19±4.03 ac
Adipocyte number (x107) 1.43E+08a 1.31E+08a 1.86E+08a
Liver size (g) 1.43±0.13a 1.23±0.15a 1.40±0.06a
Caecum (g) 0.21±0.01a 0.69±0.05b 0.49±0.03c
Colon (g) 0.13±0.01a 0.19±0.02a 0.14±0.02a
PYY (pmol/ml) 0.10±0.012a 0.10±0.008a
0.13±0.016a
Colonic PYY 27.3 3.7 22.8 5.3 19.9 1.6
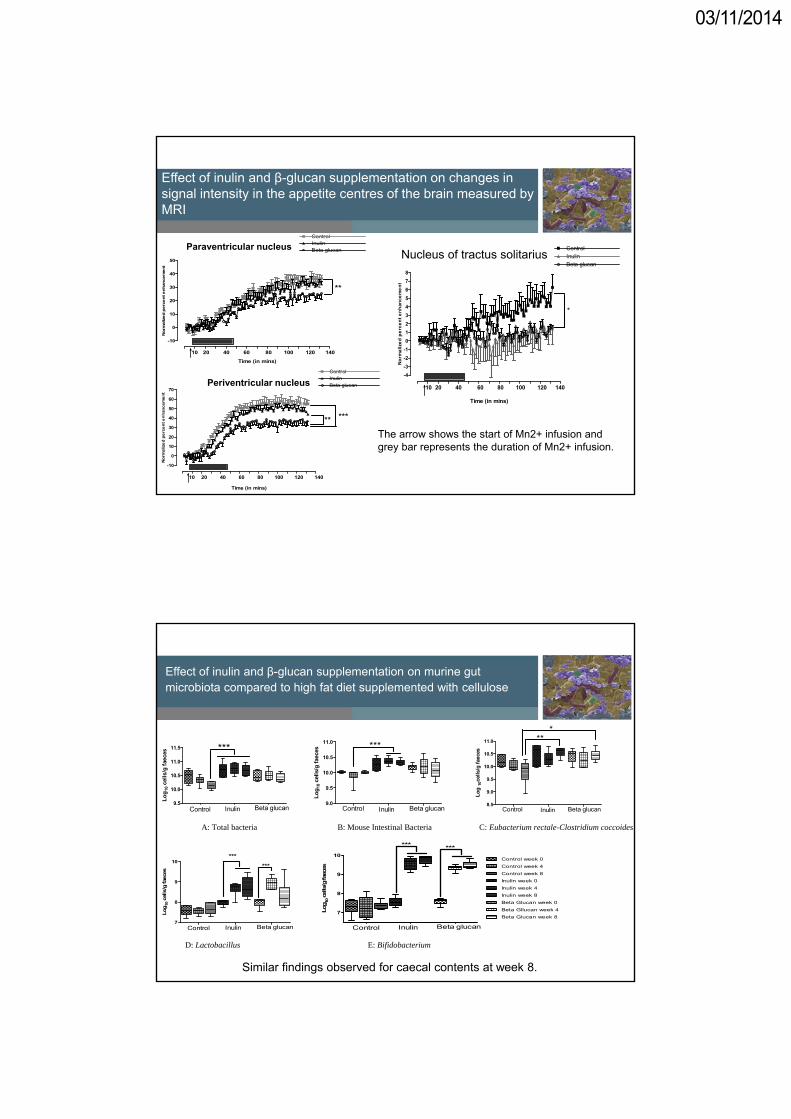
Effect of inulin and β-glucan supplementation on changes in signal intensity in the appetite centres of the brain measured by MRI
-10
0
10
20
30
40
50
60
70
80
ControlInulinBeta glucan
*
10 20 40 60 80 100 120 140
Time (in mins)
No
rma
lize
d p
erc
en
t e
nh
an
ce
me
nt
Arcuate nucleus
-10
0
10
20
30
40
50
60
ControlInulinBeta glucan
***
10 20 40 60 80 100 120 140
Time (in mins)
No
rma
lize
d p
erc
en
t e
nh
an
ce
me
nt
Ventromedial hypothalamic nucleus
The arrow shows the start of Mn2+ infusion and grey bar represents the duration of Mn2+ infusion.
03/11/2014
-10
0
10
20
30
40
50
ControlInulinBeta glucan
**
10 20 40 60 80 100 120 140
Time (in mins)
No
rmalize
d p
erc
ent e
nh
an
ce
me
nt
Paraventricular nucleus
-10
0
10
20
30
40
50
60
70
ControlInulinBeta glucan
*****
10 20 40 60 80 100 120 140
Time (in mins)
No
rmalize
d p
erc
en
t e
nh
an
ce
me
nt
Periventricular nucleus-4
-3
-2
-1
0
1
2
3
4
5
6
7
8
ControlInulinBeta glucan
10 20 40 60 80 100 120 140
*
Time (in mins)N
orm
ali
zed
pe
rce
nt
en
ha
nc
em
en
t
Nucleus of tractus solitarius
Effect of inulin and β-glucan supplementation on changes in signal intensity in the appetite centres of the brain measured by MRI
The arrow shows the start of Mn2+ infusion and grey bar represents the duration of Mn2+ infusion.
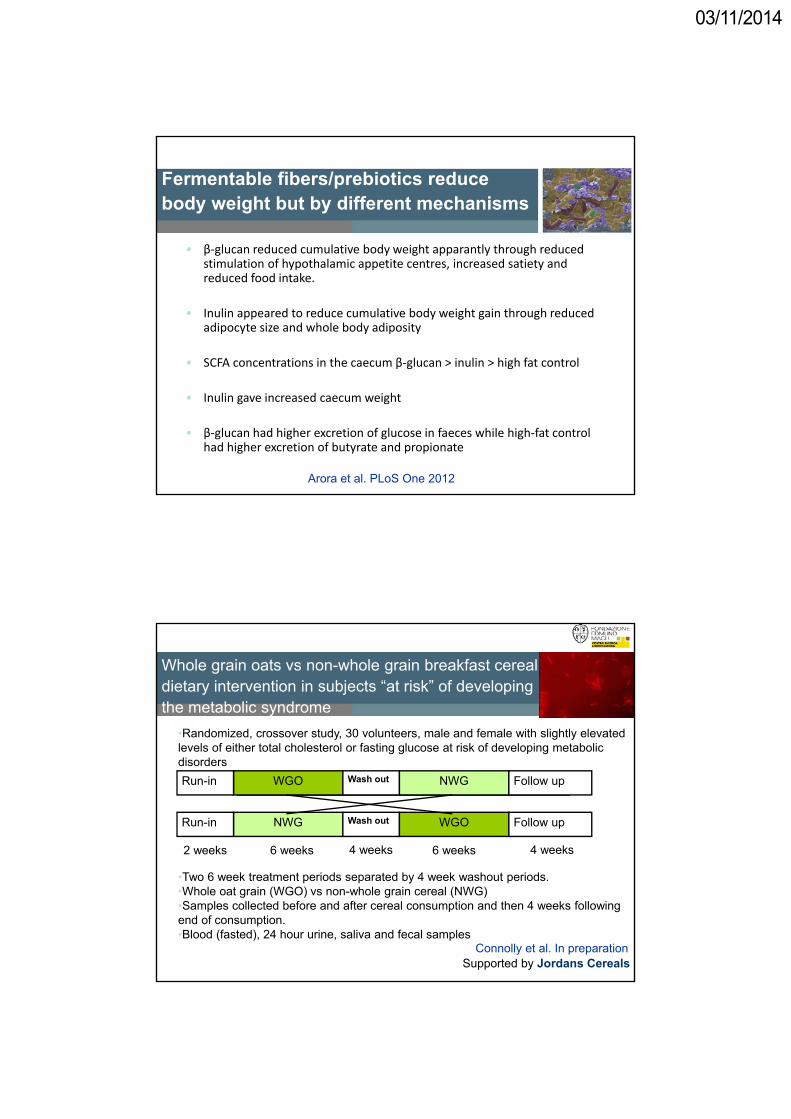
Effect of inulin and β-glucan supplementation on murine gut microbiota compared to high fat diet supplemented with cellulose
9.5
10.0
10.5
11.0
11.5
Control Inulin Beta glucan
***
Lo
g10
cell
s/g
fae
ces
9.0
9.5
10.0
10.5
11.0
Control Inulin Beta glucan
***
Lo
g10
cells/
g f
aece
s
8.5
9.0
9.5
10.0
10.5
11.0
Control Inulin Beta glucan
***
Lo
g10
cells/
g f
aece
s
A: Total bacteria B: Mouse Intestinal Bacteria C: Eubacterium rectale-Clostridium coccoides
7
8
9
10
Control Inulin Beta glucan
***
***
Log
10ce
lls/
g fae
ces
7
8
9
10
Control Inulin Beta glucan
*** ***
Control week 0
Control week 4
Control week 8
Inulin week 0
Inulin week 4
Inulin week 8
Beta Glucan week 0
Beta Gllucan week 4
Beta Glucan week 8
Log
10ce
lls/
g fae
ces
D: Lactobacillus E: Bifidobacterium
Similar findings observed for caecal contents at week 8.

03/11/2014
Effect of inulin and β-glucan supplementation on murine faecal metabolite profiles (NMR) compared to high fat diet supplemented with cellulose
NMR based metabolomics separates cellulose from inulin or β-glucan supplemented animals on high fat diets
PCA scores plot of fecel metabolite profiles showing clear clustering patterns for mice fed with HFD-C, HFD-BG and HFD-I groups.
03/11/2014
Fermentable fibers/prebiotics reduce body weight but by different mechanisms
• β‐glucan reduced cumulative body weight apparantly through reduced stimulation of hypothalamic appetite centres, increased satiety and reduced food intake.
• Inulin appeared to reduce cumulative body weight gain through reduced adipocyte size and whole body adiposity
• SCFA concentrations in the caecum β‐glucan > inulin > high fat control
• Inulin gave increased caecum weight
• β‐glucan had higher excretion of glucose in faeces while high‐fat control had higher excretion of butyrate and propionate
Arora et al. PLoS One 2012
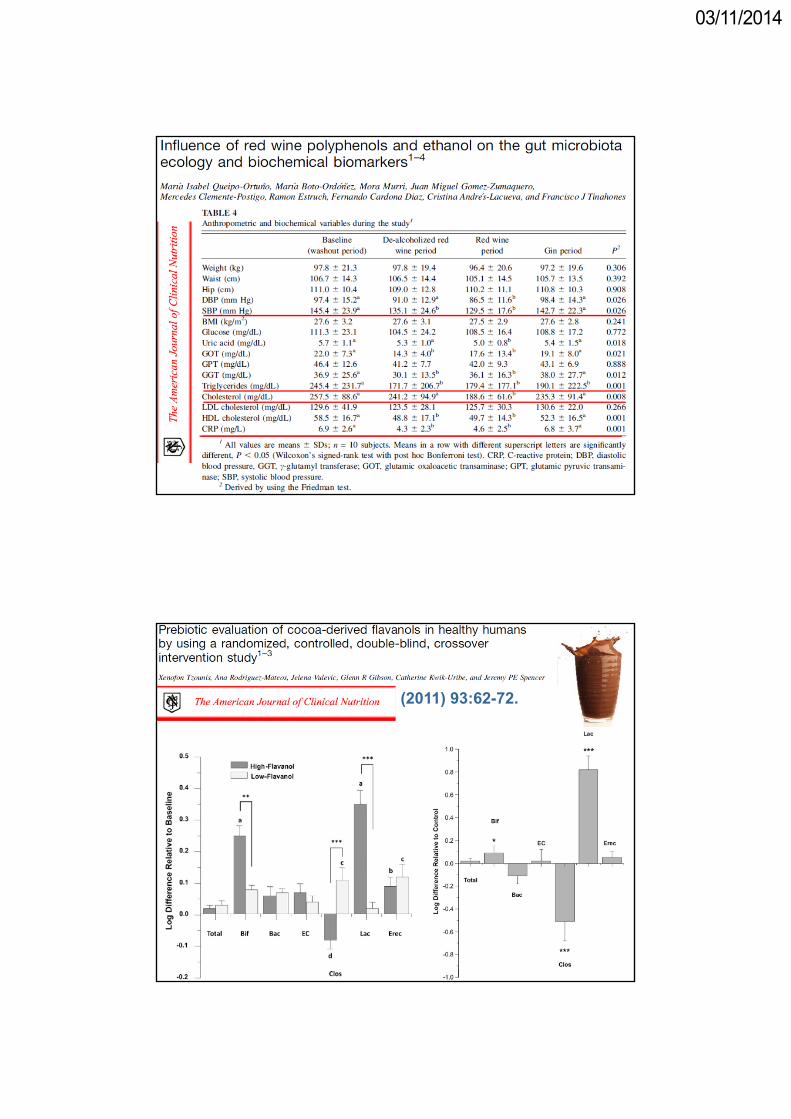
Whole grain oats vs non-whole grain breakfast cereal dietary intervention in subjects “at risk” of developing the metabolic syndrome
•Randomized, crossover study, 30 volunteers, male and female with slightly elevated levels of either total cholesterol or fasting glucose at risk of developing metabolic disorders
•Two 6 week treatment periods separated by 4 week washout periods.•Whole oat grain (WGO) vs non-whole grain cereal (NWG)•Samples collected before and after cereal consumption and then 4 weeks following end of consumption.•Blood (fasted), 24 hour urine, saliva and fecal samples
Connolly et al. In preparationSupported by Jordans Cereals
WGORun-in Wash out NWG
NWGRun-in Wash out WGO
Follow up
Follow up
2 weeks 6 weeks 4 weeks 6 weeks 4 weeks

03/11/2014
Whole grain oats modified gut microbiota in beneficial manner compared to non-whole grain cereal
Whole grain oats significantly increased faecal bifidobacteria and lactobacilli but no other bacterial groups measured.
WGO WGO
Whole grain oats improved blood cholesterol profiles
•Whole grain oats significantly reduced LDL and total cholesterol, reversing a trend towards elevated LDL and TC in the non-whole grainbreakfast cereal treatment.
WGOWGO
03/11/2014
Impact of wheat bran fibre (WBF) on gut microbiota & markers of CVD in overweight adults
WBF (bread, biscuits, breakfast cereals)Run-in
Cellulose (bread, biscuits, breakfast cereals)Run-in
2 weeks 8 weeks
•Subjects: n=80, BMI > 27
•FEM & Santa Chiara Hospital (Dr Carlo Pedrolli), APSS, Trento
•Biomarkers of CVD risk
•Gut microbiota (454-pyrosequencing, FISH, qPCR)
•MS based metabolomics (targeted and untargeted)
The 3Ps: Probiotics, Prebiotics & Polyphenols
• PROBIOTICS....“live microorganisms which when administered in adequate amount confer a health benefit on the host” (FAO, 2001).
- Lactobacillus- Bifidobacterium- Escherichia coli Nissle 1917, Bacillus sporogenes, Enteorcoccus faecium, Clostridium
butyricum, Saccharomyces ceriviseae
• PREBIOTICS…. a selectively fermented ingredient that results in specific changes, in the composition and/or activity of the gastrointestinal microbiota, thus conferring benefit(s) upon host health. Gibson et al (2010)– Inulin, oligofructose, fructooligosaccharides, galactooligosaccharides, lactulose,
arabinogalactan, arabinoxylan, pectic‐oligosaccharides, glucooligosaccharides– Resistant starch and certain whole plant foods including whole grain wheat, whole grain
oats
• POLYPHENOLS….. 90% resistant to digestion and reach the colon, plant secondary metabolites, usually antioxidant, antimicrobial activities, enzyme/nutrient binding properties and possibly prebiotic type properties, e.g. red‐wine polyphenols, apple tannins
03/11/2014
Gut microbiota and systemic health
Obesity
LaxationLipid
metabolism
Diarrhoea/IBS
Cancer (CRC)
Blood glucose
Mineral absorption
IBD
Satiety
Immune function
Polyphenols
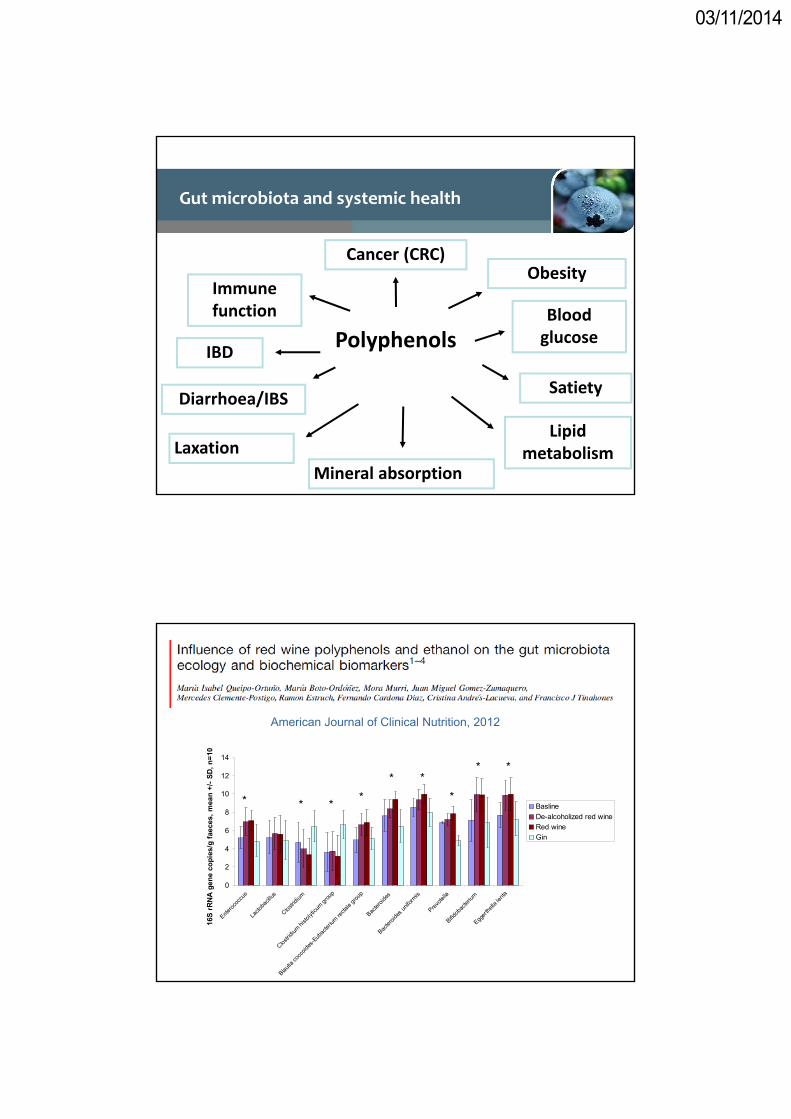
American Journal of Clinical Nutrition, 2012
0
2
4
6
8
10
12
14
Enter
ococ
cus
Lacto
bacil
lus
Clostri
dium
Clostri
dium
hist
olyti
cum
gro
up
Blautia
cocc
oide
s-Eub
acte
rium
recta
le g
roup
Bacte
roid
es
Bacte
roid
es u
nifor
mis
Prevo
tella
Bifidob
acte
rium
Egger
thell
a le
nta
16S
rR
NA
gen
e co
pie
s/g
fae
ces,
mea
n +
/- S
D,
n=
10
Basline
De-alcoholized red wine
Red wine
Gin
* * **
* *
*
* *
03/11/2014
(2011) 93:62-72.
03/11/2014
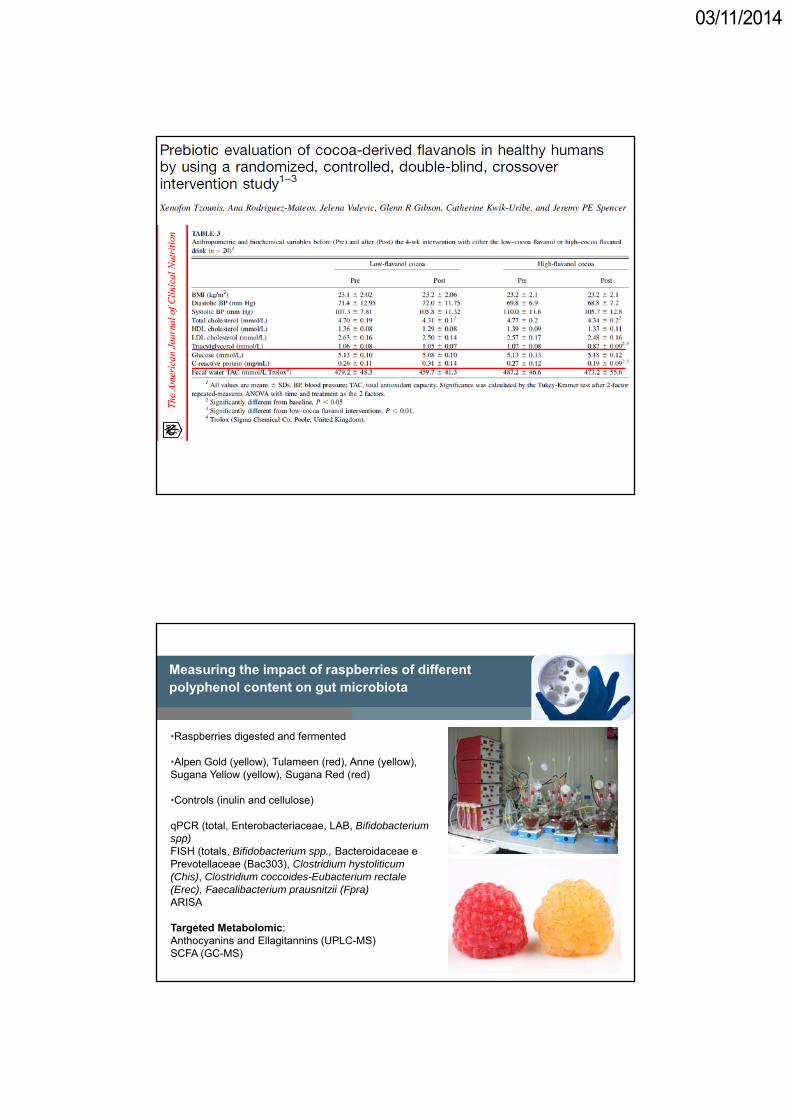
Measuring the impact of raspberries of different polyphenol content on gut microbiota
•Raspberries digested and fermented
•Alpen Gold (yellow), Tulameen (red), Anne (yellow), Sugana Yellow (yellow), Sugana Red (red)
•Controls (inulin and cellulose)
qPCR (total, Enterobacteriaceae, LAB, Bifidobacterium spp)FISH (totals, Bifidobacterium spp., Bacteroidaceae e Prevotellaceae (Bac303), Clostridium hystoliticum (Chis), Clostridium coccoides-Eubacterium rectale (Erec), Faecalibacterium prausnitzii (Fpra)ARISA
Targeted Metabolomic: Anthocyanins and Ellagitannins (UPLC-MS)SCFA (GC-MS)
03/11/2014
Significant increase in bifidobacterial
abundance as measured by FISH
6,4
6,6
6,8
7
7,2
7,4
7,6
7,8
8
8,2
8,4
Alpen
Gold
Tulamee
n
Anne
Sugan
aYellow
Sugan
a Red
Inuline
Cellulose
Log10
cel
ls/m
L
0
5
10
24
a a a a a a
HOURS
a: average of five significantly higher
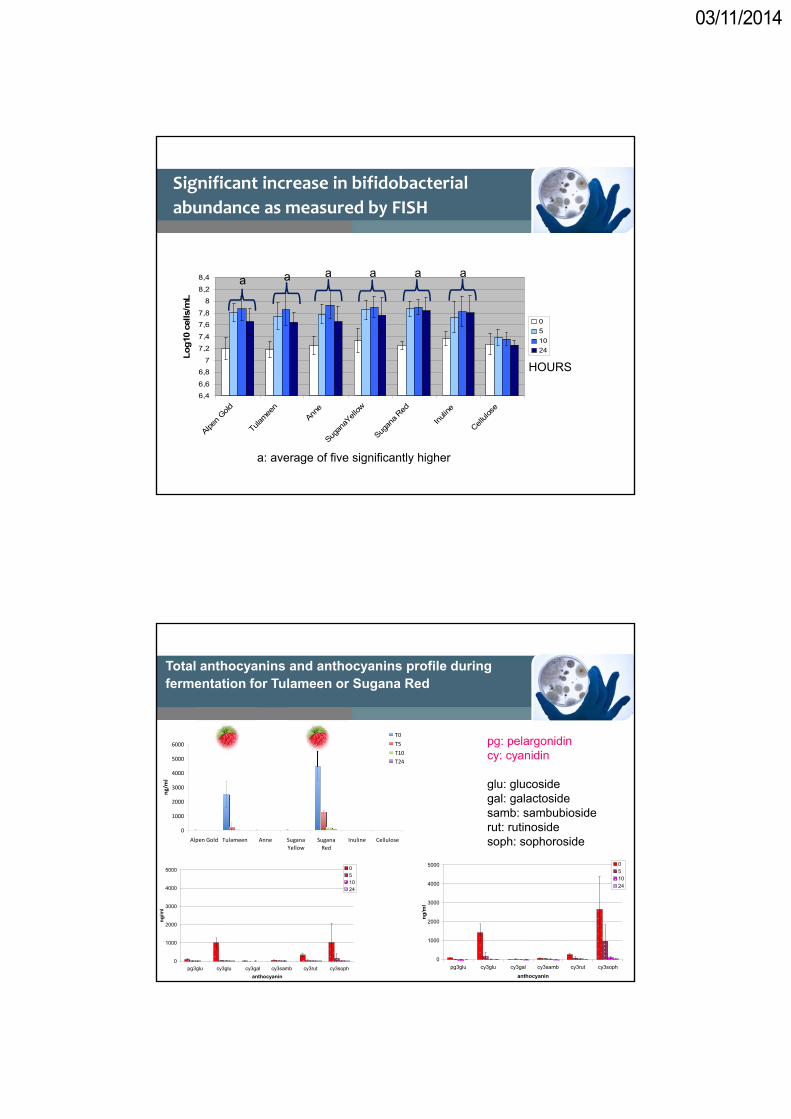
Total anthocyanins and anthocyanins profile during fermentation for Tulameen or Sugana Red
0
1000
2000
3000
4000
5000
6000
Alpen Gold Tulameen Anne Sugana
Yellow
Sugana
Red
Inuline Cellulose
ng/ml
T0
T5
T10
T24
0
1000
2000
3000
4000
5000
pg3glu cy3glu cy3gal cy3samb cy3rut cy3soph
anthocyanin
ng
/ml
051024
0
1000
2000
3000
4000
5000
pg3glu cy3glu cy3gal cy3samb cy3rut cy3soph
anthocyanin
ng
/ml
051024
pg: pelargonidincy: cyanidin
glu: glucosidegal: galactosidesamb: sambubiosiderut: rutinosidesoph: sophoroside
03/11/2014
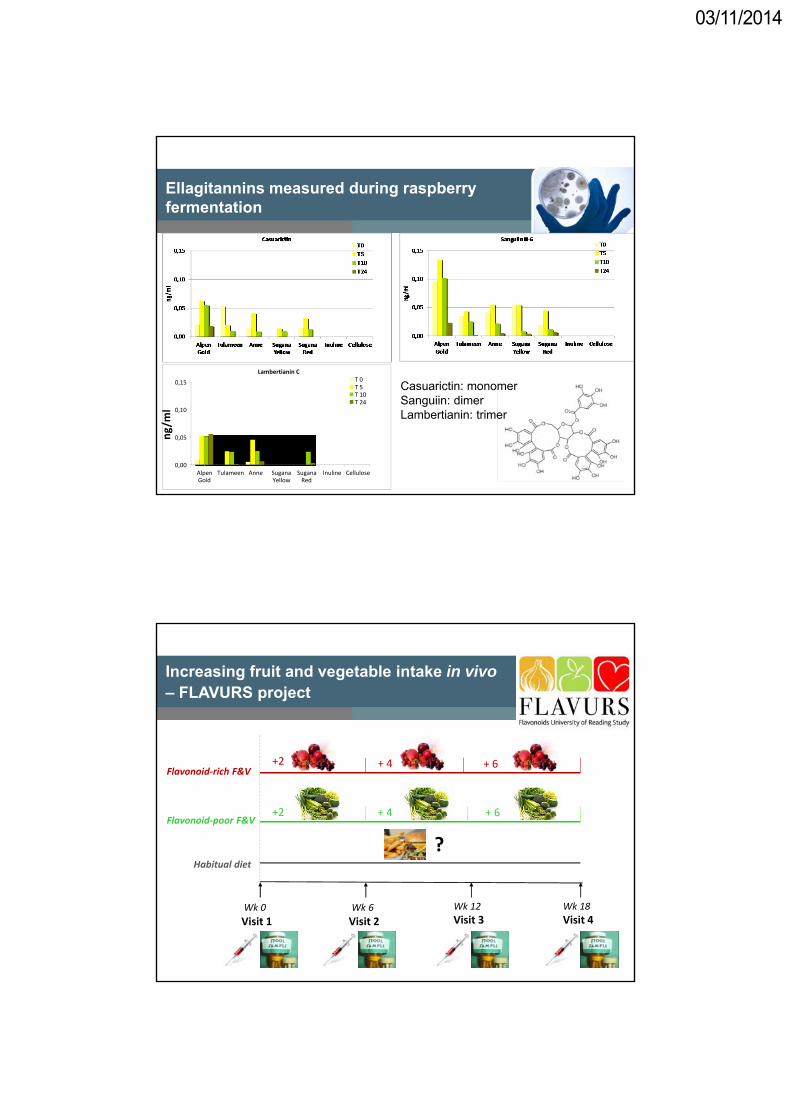
Ellagitannins measured during raspberry fermentation
Casuarictin: monomerSanguiin: dimerLambertianin: trimer
0,00
0,05
0,10
0,15
Alpen Gold
Tulameen Anne Sugana Yellow
Sugana Red
Inuline Cellulose
ng/ml
Lambertianin CT 0T 5T 10T 24
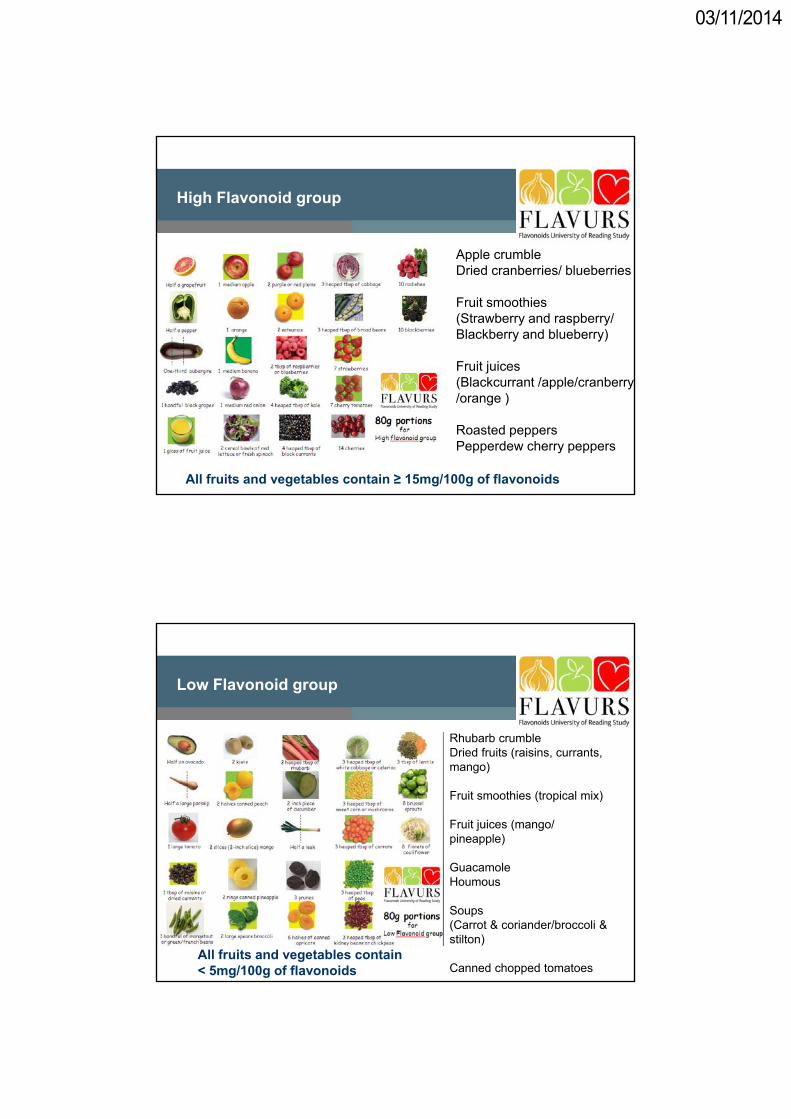
Increasing fruit and vegetable intake in vivo – FLAVURS project
Flavonoid‐poor F&V
Flavonoid‐rich F&V+2 + 4
+2
+ 6
+ 4 + 6
Habitual diet
Wk 0
Visit 1Wk 6
Visit 2
Wk 12
Visit 3Wk 18
Visit 4
?
03/11/2014
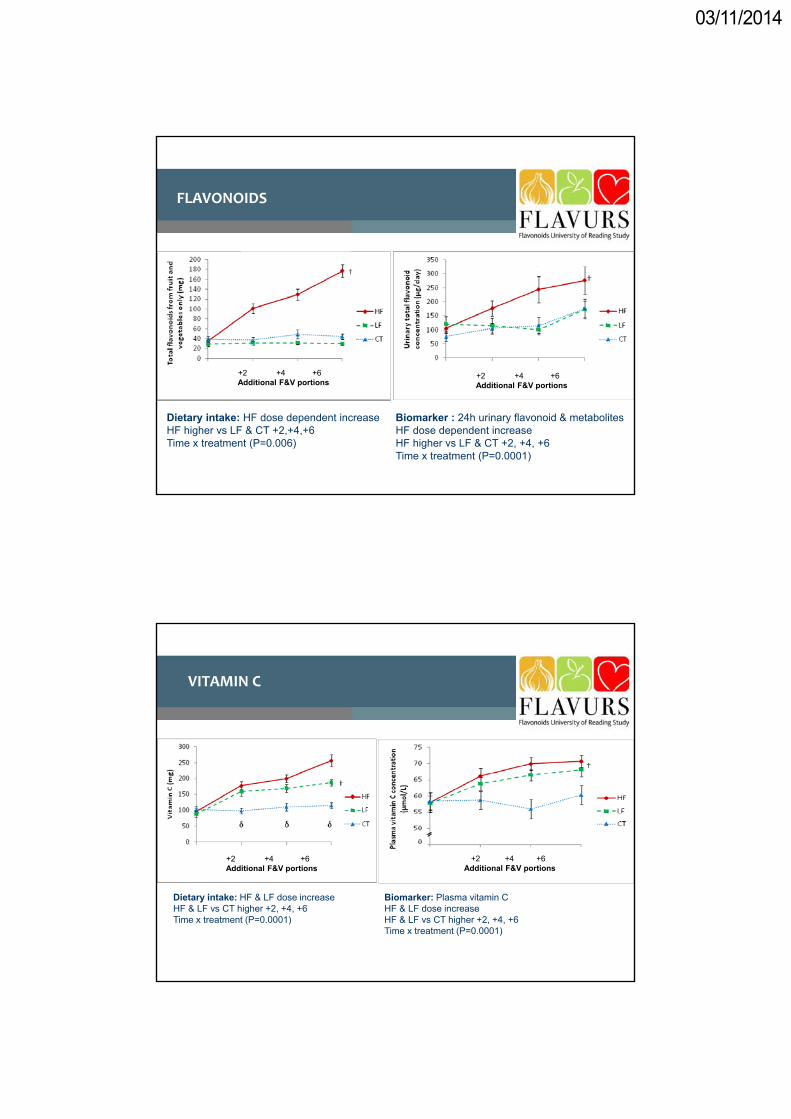
High Flavonoid group
Apple crumble Dried cranberries/ blueberries
Fruit smoothies (Strawberry and raspberry/ Blackberry and blueberry)
Fruit juices(Blackcurrant /apple/cranberry/orange )
Roasted peppers Pepperdew cherry peppers
All fruits and vegetables contain ≥ 15mg/100g of flavonoids
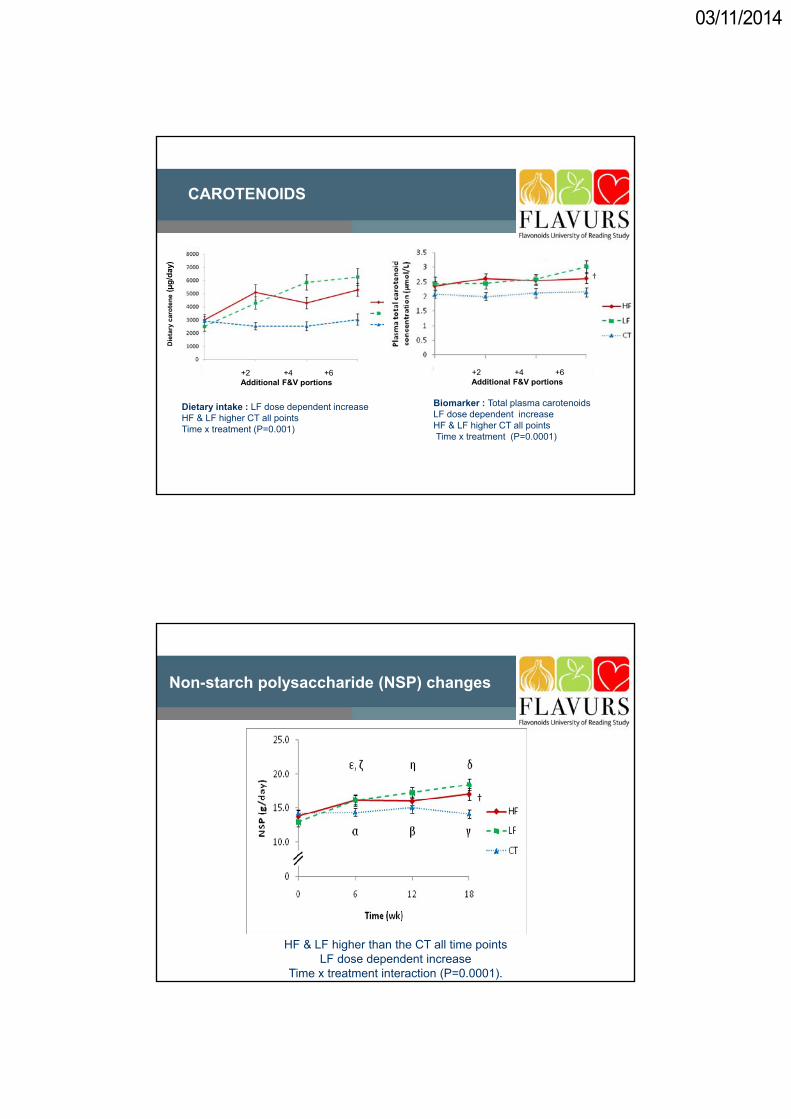
Low Flavonoid group
Rhubarb crumbleDried fruits (raisins, currants, mango)
Fruit smoothies (tropical mix)
Fruit juices (mango/pineapple)
GuacamoleHoumous
Soups (Carrot & coriander/broccoli & stilton)
Canned chopped tomatoesAll fruits and vegetables contain < 5mg/100g of flavonoids
03/11/2014
FLAVONOIDS
Dietary intake: HF dose dependent increaseHF higher vs LF & CT +2,+4,+6 Time x treatment (P=0.006)
Biomarker : 24h urinary flavonoid & metabolitesHF dose dependent increaseHF higher vs LF & CT +2, +4, +6Time x treatment (P=0.0001)
+2 +4 +6Additional F&V portions
+2 +4 +6Additional F&V portions
VITAMIN C
Dietary intake: HF & LF dose increaseHF & LF vs CT higher +2, +4, +6Time x treatment (P=0.0001)
Biomarker: Plasma vitamin CHF & LF dose increase HF & LF vs CT higher +2, +4, +6Time x treatment (P=0.0001)
+2 +4 +6Additional F&V portions
+2 +4 +6Additional F&V portions
03/11/2014
CAROTENOIDS
Dietary intake : LF dose dependent increaseHF & LF higher CT all pointsTime x treatment (P=0.001)
Biomarker : Total plasma carotenoidsLF dose dependent increaseHF & LF higher CT all pointsTime x treatment (P=0.0001)
Die
tary
car
ote
ne
(µg
/day
)
+2 +4 +6Additional F&V portions
+2 +4 +6Additional F&V portions
Non-starch polysaccharide (NSP) changes
HF & LF higher than the CT all time pointsLF dose dependent increase
Time x treatment interaction (P=0.0001).
03/11/2014
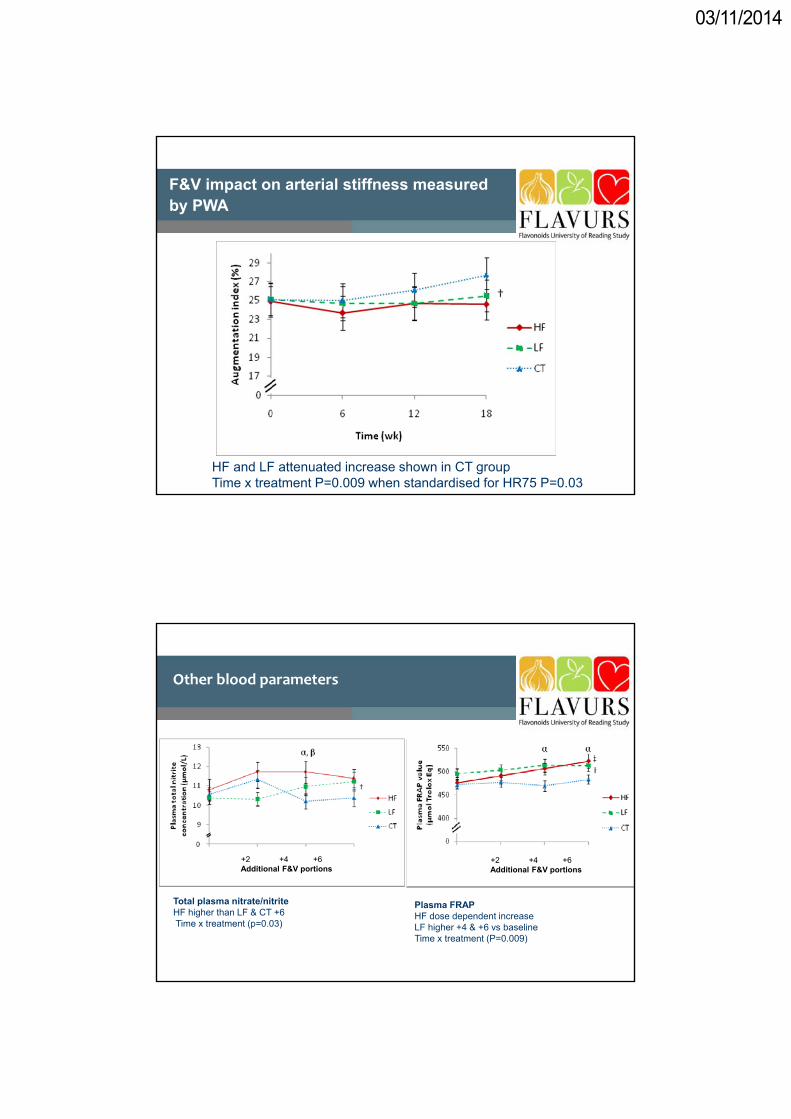
F&V impact on arterial stiffness measured by PWA
HF and LF attenuated increase shown in CT groupTime x treatment P=0.009 when standardised for HR75 P=0.03
Other blood parameters
+2 +4 +6Additional F&V portions
+2 +4 +6Additional F&V portions
Total plasma nitrate/nitriteHF higher than LF & CT +6Time x treatment (p=0.03)
Plasma FRAP HF dose dependent increaseLF higher +4 & +6 vs baseline Time x treatment (P=0.009)
03/11/2014
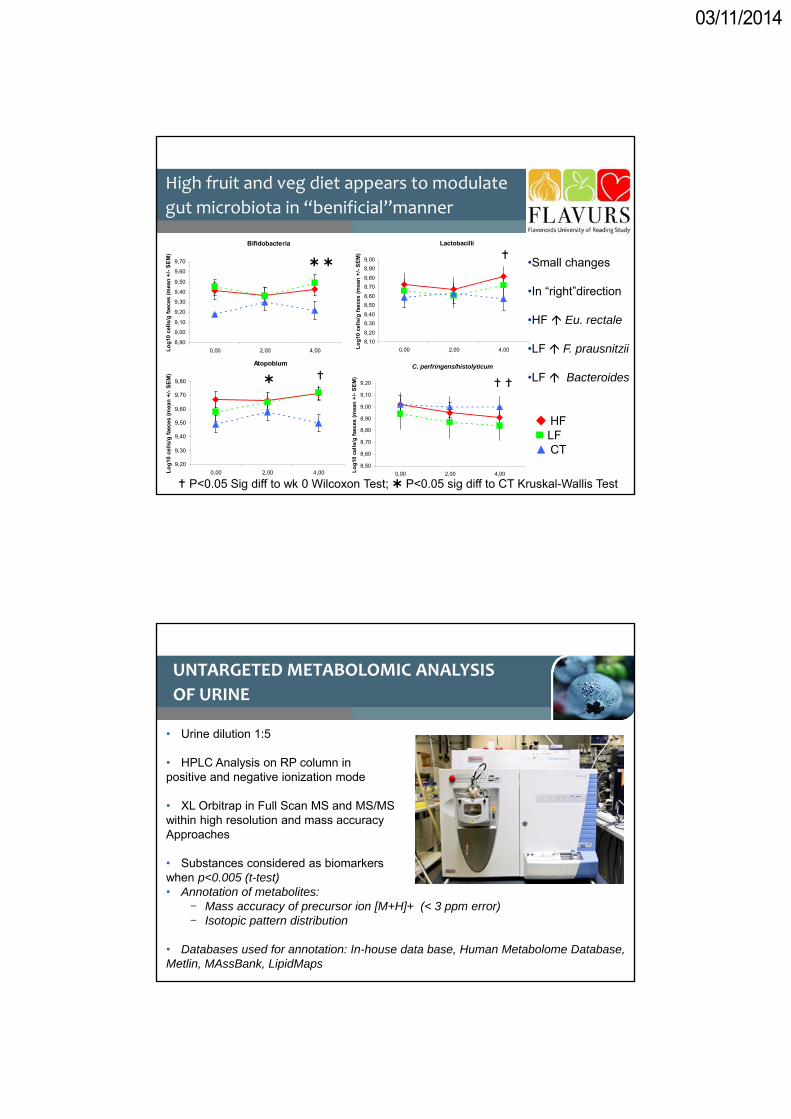
High fruit and veg diet appears to modulate
gut microbiota in “benificial”manner
Bifidobacteria
8,90
9,00
9,10
9,20
9,30
9,40
9,50
9,60
9,70
0,00 2,00 4,00Lo
g10
cel
ls/g
fae
ces
(mea
n +
/- S
EM
)
Lactobacilli
8,10
8,20
8,30
8,40
8,50
8,60
8,70
8,80
8,90
9,00
0,00 2,00 4,00Lo
g10
cel
ls/g
fae
ces
(mea
n +
/- S
EM
)Atopobium
9,20
9,30
9,40
9,50
9,60
9,70
9,80
0,00 2,00 4,00Lo
g10
cel
ls/g
fae
ces
(mea
n +
/- S
EM
)
C. perfringens/histolyticum
8,50
8,60
8,70
8,80
8,90
9,00
9,10
9,20
0,00 2,00 4,00Lo
g10
cel
ls/g
fae
ces
(mea
n +
/- S
EM
)
•Small changes
•In “right”direction
•HF Eu. rectale
•LF F. prausnitzii
•LF Bacteroides
HF LF▲ CT
P<0.05 Sig diff to wk 0 Wilcoxon Test; P<0.05 sig diff to CT Kruskal-Wallis Test
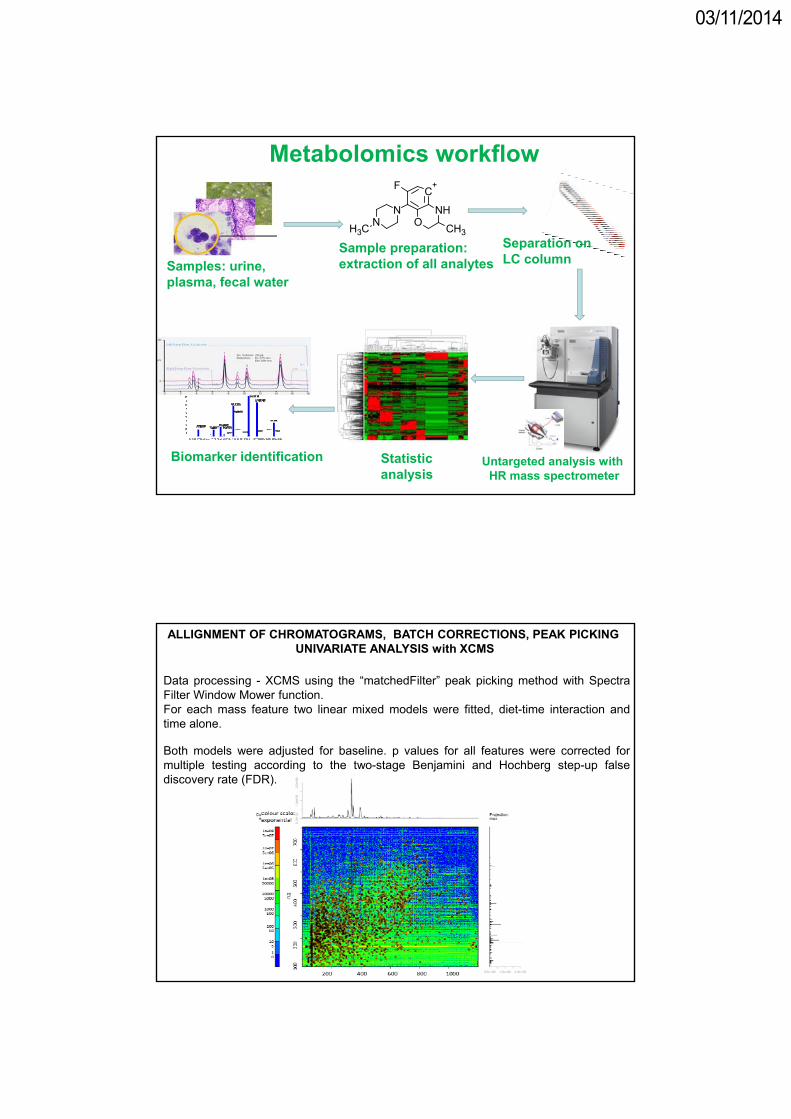
UNTARGETED METABOLOMIC ANALYSIS
OF URINE
• Urine dilution 1:5
• HPLC Analysis on RP column in positive and negative ionization mode
• XL Orbitrap in Full Scan MS and MS/MS within high resolution and mass accuracy Approaches
• Substances considered as biomarkers when p<0.005 (t-test)• Annotation of metabolites:
− Mass accuracy of precursor ion [M+H]+ (< 3 ppm error)− Isotopic pattern distribution
• Databases used for annotation: In-house data base, Human Metabolome Database, Metlin, MAssBank, LipidMaps
03/11/2014
Metabolomics workflow
Sample preparation: extraction of all analytes
Statistic analysis
Untargeted analysis withHR mass spectrometer
Biomarker identification
Samples: urine, plasma, fecal water
C+
NHO
F
CH3
NN
CH3
Separation on LC column
ALLIGNMENT OF CHROMATOGRAMS, BATCH CORRECTIONS, PEAK PICKING UNIVARIATE ANALYSIS with XCMS
Data processing - XCMS using the “matchedFilter” peak picking method with SpectraFilter Window Mower function.For each mass feature two linear mixed models were fitted, diet-time interaction andtime alone.
Both models were adjusted for baseline. p values for all features were corrected formultiple testing according to the two-stage Benjamini and Hochberg step-up falsediscovery rate (FDR).

03/11/2014
Rt Annotation; Elemental Composition, MW, adjusted p value
1.10 ProlineBetaine; MMW: 143.0946, p 0.002 ↑Diet A;
2.20 N-acetyl-S-(2-hydroxypropyl) cysteine, MMW: C8H15NO4S; p
3.80 Hydroxy Hippuric Acid (isomer); MMW: 195.0531, p 0.02 ↑Diet A;
4.40 Hydroxy Hippuric Acid (isomer); MMW: 195.0531, p 0.002 ↑Diet A,
4.82 Vanilloylglycine, MMW: 225.0637; p.0.03 ↑ Diet A, B;
5.70 Hippuric Acid, MMW: 179.0582; p 0.002 ↑Diet A
5.89 Phenylacetylglutamine, MMW: 264.1110, p 0.04 ↑Diet A;
6.15 FerulicAcid Sulfate , MMW: 274.0731, p 0.04; ↑Diet B
6.26 Dihydroxyphenyl-γ-valerolactone-O-sulphate MMW:288.0306 p 0.0003 ↑Diet A;
6.56 Dihydroxyphenyl-γ-valerolactone-O-methyl-O-GLC, p 0.01 ↑ Diet A;
7.14 Cresol-Glucuronide, MMW: 284.0896; p 0.001 ↓Diet A;
7.35 Hydroxy Hippuric Acid (isomer), MMW: 195.0531, p 0.01 ↑ Diet A;
7.76 Hydroxy-tridecenoic acid GLC, MMW: 404.2046, p 0.001 ↑ Diet A;
12.38 Iberin N-acetyl-cysteine MMW: p 0.0001 ↑ Diet A & p 0.001↑ Diet B
Alimentazione
Adding value to the food chain FOOD QUALITY AND NUTRITION DEPARTMENT
Apples Gut Microbiota Modulation
Nutrition and Nutrigenomics
Biological samples: Blood, Urine and Faecal samples
Measurements•% body fat composition, DEXA•blood pressure, •vascular stiffness (pulse wave analysis, PWA) •and vascular reactivity (laser Doppler imaging, LDI)•Gut microbiota (454‐pyrosequencing)•Untargeted metabolomics.
8 weeks
Group 1
Group 2
Visit 1 (V1)
0 week
Whole Apple (WA) Wash out Apple Juice (AJ)
Apple Juice (AJ) Wash out
Pre ‐
treatment
2 weeks
Habitual
diet
Whole Apple (WA)
8 weeks 4 weeks
Visit 2 (V2)
8 week
Visit 4 (V4)
21 week
Visit 3 (V3)
13 week
03/11/2014
“Conslusions: Adherence to an MD pattern is associated with better HRQL. Theassociation is stronger with mental health than with physical health. Dietary totalantioxidant and fibre content independently explain this relationship”.
Dietary patterns – Mediterranean diet & Gut
Microbiome “ecosystem support”
Barilla Centre for Food Nutrition: Double Pyramid: healthy food for people, sustainable food for the planet
http://www.barillacfn.com/en/position-paper/pp-doppia-piramide-alimentazione/
INRAN, FAO Double Pyramid
GUT MICROBIOTA PYRAMID
CHRONIC DISEASE PYRAMID
03/11/2014
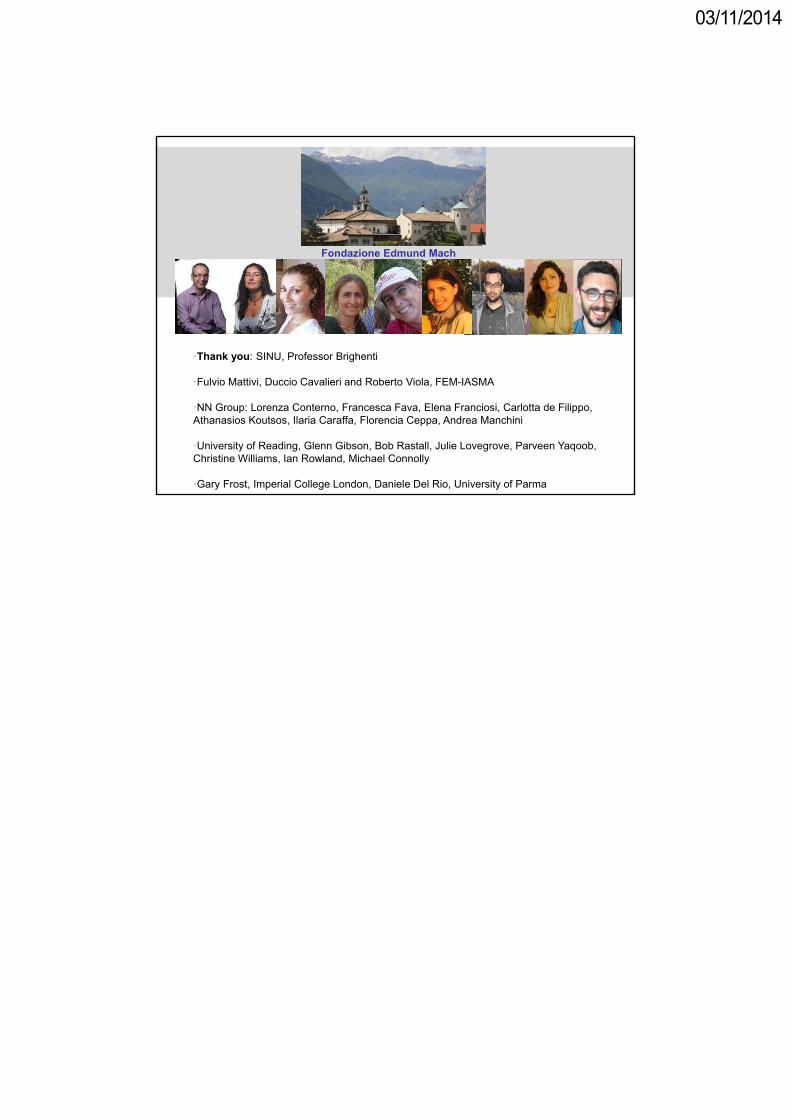
Fondazione Edmund Mach
•Thank you: SINU, Professor Brighenti
•Fulvio Mattivi, Duccio Cavalieri and Roberto Viola, FEM-IASMA
•NN Group: Lorenza Conterno, Francesca Fava, Elena Franciosi, Carlotta de Filippo, Athanasios Koutsos, Ilaria Caraffa, Florencia Ceppa, Andrea Manchini
•University of Reading, Glenn Gibson, Bob Rastall, Julie Lovegrove, Parveen Yaqoob, Christine Williams, Ian Rowland, Michael Connolly
•Gary Frost, Imperial College London, Daniele Del Rio, University of Parma