Embed Size (px)
Citation preview

Prepared by Mr Tan Kaiyuan Hwa Chong Institution CAA 110409 Sec3 SMTP
1
Name: _____________________________________ Date: ______________________ Class: 3SMTP____ INTERNET RESOURCES
1. Just Starting Out with Plants?
Photographs and pictures of plant structures with detailed caption. http://plantscienceimages.org.uk/pages/section.aspx?themeId=1§ionId=3
2. For the Intermediate Learner
http://www.educationalrap.com/62/photosynthesis.html Sing-along the Photosynthesis Rap. Can you understand the lyrics?
3. http://www-saps.plantsci.cam.ac.uk/records/rec106.htm More on stomata opening and closure.
4. http://plantphys.info/plant_physiology/photoeco.shtml On compensation points in sun and shade leaves.
5. For the Adventurous Learner
6. http://www.youtube.com/watch?v=hj_WKgnL6MI
The above video and animation show how light may be trapped by chlorophyll at the molecular level. Certainly more challenging.
http://www.johnkyrk.com/photosynthesis.html
7. More on plant pigments. http://www.ucmp.berkeley.edu/glossary/gloss3/pigments.html
8. More details on light stage and dark stage What are C3, C4 and CAM plants http://www.biologie.uni-hamburg.de/b-online/e24/24.htm
CHAPTER MAP & OVERVIEW
Plant Nutrition
5.1 Plant Structure & Function 5.2 Photosynthesis 5.3 Leaf Adaptation
& Photosynthesis
5.1.1 General Plant Anatomy
5.1.2 Leaf Structure and Function
5.1.3 Structural Diversity in Flowering Plants
5.2.1 The Importance of Photosynthesis
5.2.2 Essential Conditions for Photosynthesis
5.2.3 Plant pigments 5.2.4 Absorption and Action Spectra 5.2.5 Photosynthesis – The Process 5.2.6 Fate of the Products of
Photosynthesis 5.2.7 Factors Influencing the Rate of
Photosynthesis 5.2.8 Compensation Point 5.2.9 Role of Guard Cells 5.2.10 Water and Carbon Dioxide
Uptake
5.4.1 Nitrates 5.4.2 Magnesium
5.4 Plant Mineral Nutrition
5.3.1 Structural Adaptations
5.3.2 Sun and Shade Leaves
Hwa Chong Institution Sec3 (SMTP) Biology
Prepared by Mr Tan Kaiyuan Hwa Chong Institution CAA 110409 Sec3 SMTP
2
INTRODUCTION
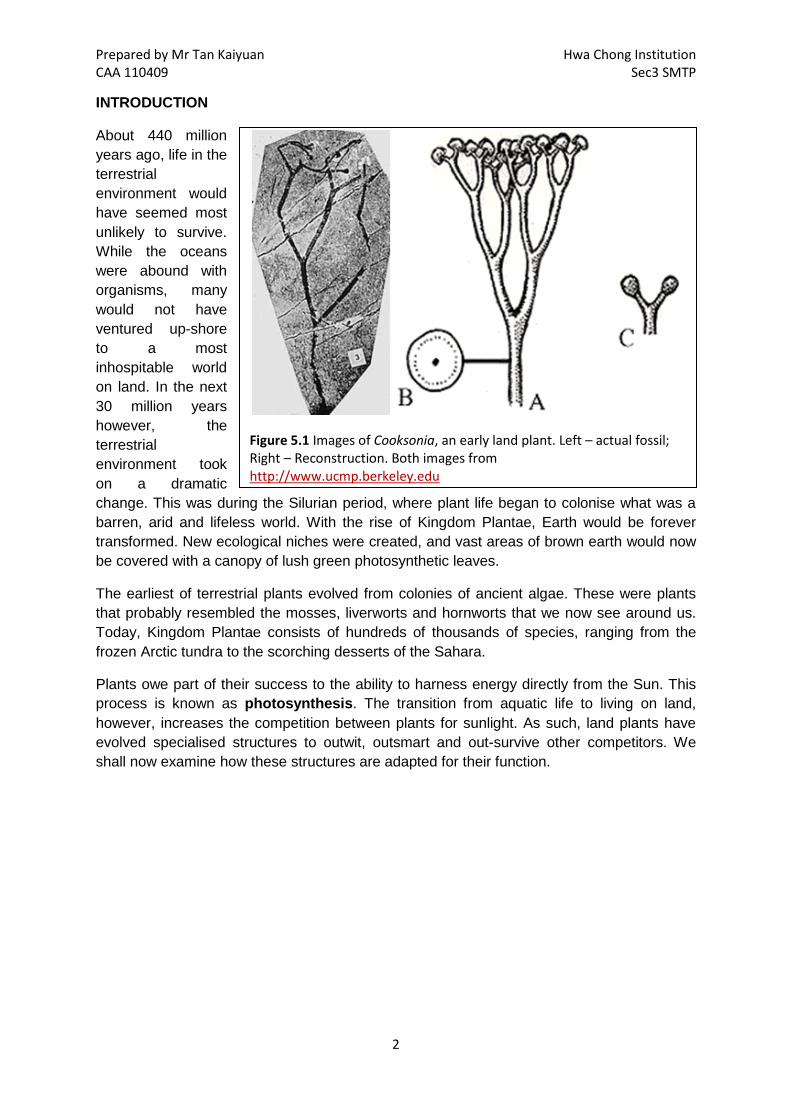
About 440 million years ago, life in the terrestrial environment would have seemed most unlikely to survive. While the oceans were abound with organisms, many would not have ventured up-shore to a most inhospitable world on land. In the next 30 million years however, the terrestrial environment took on a dramatic change. This was during the Silurian period, where plant life began to colonise what was a barren, arid and lifeless world. With the rise of Kingdom Plantae, Earth would be forever transformed. New ecological niches were created, and vast areas of brown earth would now be covered with a canopy of lush green photosynthetic leaves.
The earliest of terrestrial plants evolved from colonies of ancient algae. These were plants that probably resembled the mosses, liverworts and hornworts that we now see around us. Today, Kingdom Plantae consists of hundreds of thousands of species, ranging from the frozen Arctic tundra to the scorching desserts of the Sahara.
Plants owe part of their success to the ability to harness energy directly from the Sun. This process is known as photosynthesis. The transition from aquatic life to living on land, however, increases the competition between plants for sunlight. As such, land plants have evolved specialised structures to outwit, outsmart and out-survive other competitors. We shall now examine how these structures are adapted for their function.
Figure 5.1 Images of Cooksonia, an early land plant. Left – actual fossil; Right – Reconstruction. Both images from http://www.ucmp.berkeley.edu
Prepared by Mr Tan Kaiyuan Hwa Chong Institution CAA 110409 Sec3 SMTP
3
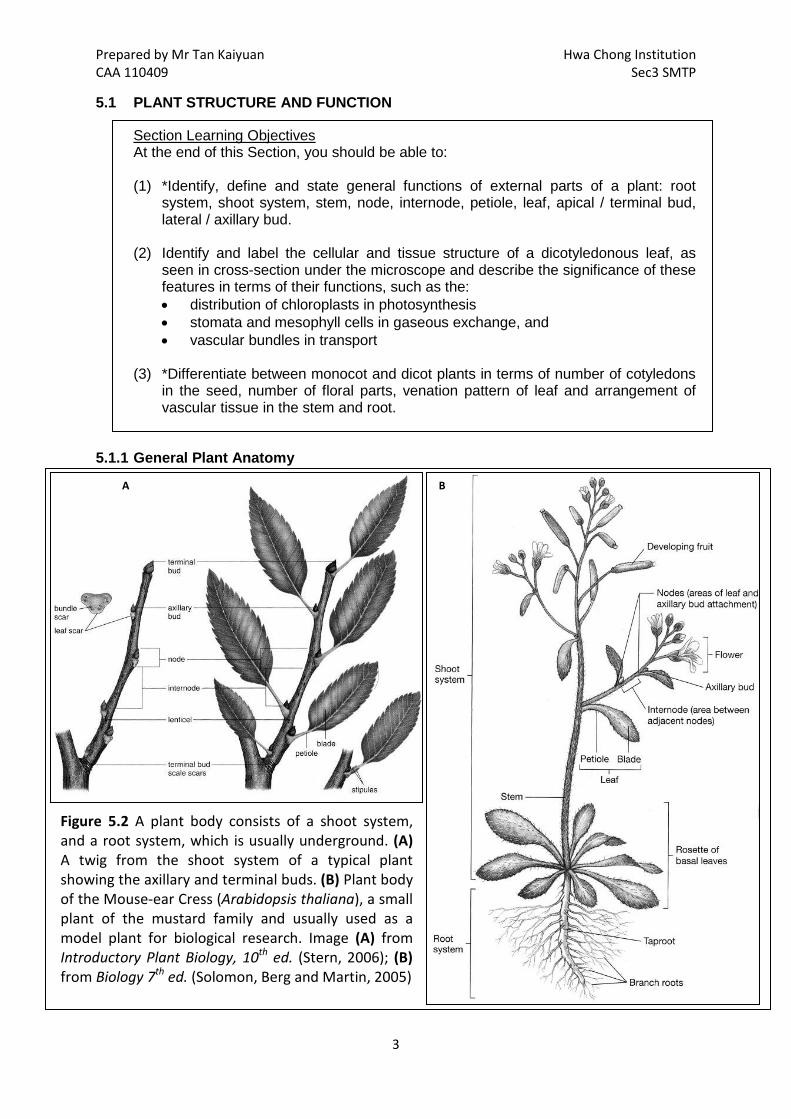
Figure 5.2 A plant body consists of a shoot system, and a root system, which is usually underground. (A) A twig from the shoot system of a typical plant showing the axillary and terminal buds. (B) Plant body of the Mouse-ear Cress (Arabidopsis thaliana), a small plant of the mustard family and usually used as a model plant for biological research. Image (A) from Introductory Plant Biology, 10th ed. (Stern, 2006); (B) from Biology 7th ed. (Solomon, Berg and Martin, 2005)
A B
5.1 PLANT STRUCTURE AND FUNCTION
(1) *Identify, define and state general functions of external parts of a plant: root system, shoot system, stem, node, internode, petiole, leaf, apical / terminal bud, lateral / axillary bud.
Section Learning Objectives At the end of this Section, you should be able to:
(2) Identify and label the cellular and tissue structure of a dicotyledonous leaf, as
seen in cross-section under the microscope and describe the significance of these features in terms of their functions, such as the: • distribution of chloroplasts in photosynthesis • stomata and mesophyll cells in gaseous exchange, and • vascular bundles in transport
(3) *Differentiate between monocot and dicot plants in terms of number of cotyledons
in the seed, number of floral parts, venation pattern of leaf and arrangement of vascular tissue in the stem and root.
5.1.1 General Plant Anatomy

Prepared by Mr Tan Kaiyuan Hwa Chong Institution CAA 110409 Sec3 SMTP
4
The table below lists the functions of some of the plant structures illustrated in Figure 5.2:
System Structure Definition / Function
Shoot System
Stem
The usually above-ground stalk of a vascular plant. It forms the axis of the plant. Stems serve primarily to support the rest of the plant body, and to conduct food , water and mineral salts. In other anatomically similar structures which are usually found underground are also modified stems such as corms, rhizomes, bulbs and tubers. They serve mainly to store food.
Node The point on a stem where a leaf, inflorescence, cone or branch of the stem attaches.
Internode The region of the stem between two successive nodes.
Petiole A slender stem or leaf stalk that connects the leaf to the stem. It serves to hold up the leaf against sunlight.
Leaf The above-ground plant organ specialized for photosynthesis. Leaves are usually thin and laminar in form.
Shoot Apical/ Terminal Bud
The embryonic shoot located at the end of a stem. It is the point where the stem may continue to grow and extend further in length.
Axillary/ Lateral Bud
The embryonic shoot that is located in the axils of a plant’s leaves.
Root System
Root
The usually below-ground plant organ which lacks leaves and nodes and serves to absorb water and mineral salts from the substrates. Roots also function to anchor the plant body to its substrates.
Root Hair Root hairs are tubular outgrowths of root epidermal cells of vascular plants, which serve to absorb moisture and mineral salts from the surrounding substrate.
Root Apical Mersitem
The terminal end of a root which continues to grow and extend.
Prepared by Mr Tan Kaiyuan Hwa Chong Institution CAA 110409 Sec3 SMTP
5
5.1.2 Leaf Structure and Function
Structure External Features of a Leaf
Form Function
Leaf Blade/ Lamina
Large surface are to volume ratio
Enables maximum amount of sunlight falling on it for photosynthesis.
Thin Rapid diffusion of carbon dioxide.
Veins
Repeated branching from a mid-rib, forming a network of veins.
Carry water and mineral salts to the cells in the lamina.
Carry food manufactured by these cells to other parts of the plant.
Petiole Usually rigid. Hold up the leaf against sunlight, away from the stem, to obtain sufficient sunlight and air.
Mid-Rib
Leaf Lamina
Network of Veins
Petiole
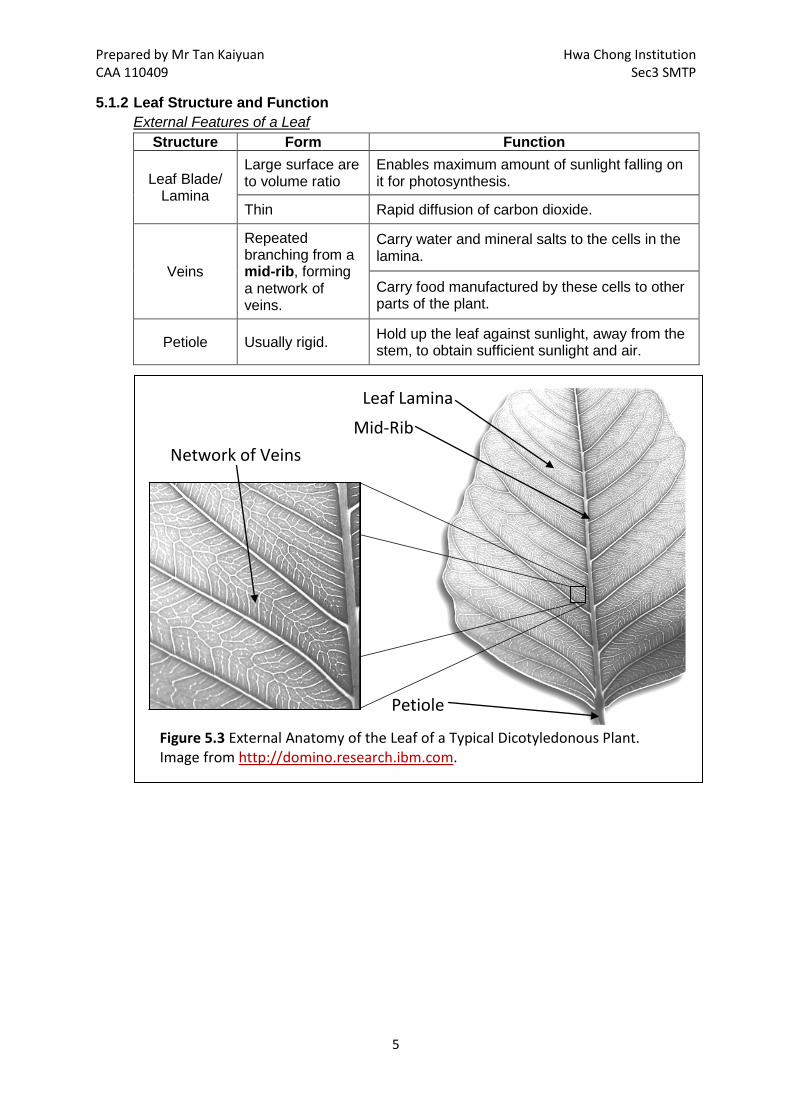
Figure 5.3 External Anatomy of the Leaf of a Typical Dicotyledonous Plant. Image from http://domino.research.ibm.com.
Prepared by Mr Tan Kaiyuan Hwa Chong Institution CAA 110409 Sec3 SMTP
6
There are three tissue systems in vascular plants. All plant organs are a complex organisation of these three types of tissue systems. These tissue systems are:
Internal of the Leaf Lamina
1) Ground tissue system
This forms the bulk of a herbaceous plant, and functions primarily for support and storage. The ground tissue system is further composed of three types of simple tissue: parenchyma tissue, collenchyma tissue and sclerenchyma tissue.
2) Vascular tissue system The vascular tissue system is embedded within the ground tissue, and serves mainly to transport materials around the plant body. It is made of two types of complex tissue: xylem and phloem.
3) Dermal tissue The dermal tissue system provides covering for the plant body, and regulates gaseous exchange. It is further composed of two complex tissue: epidermis and periderm.
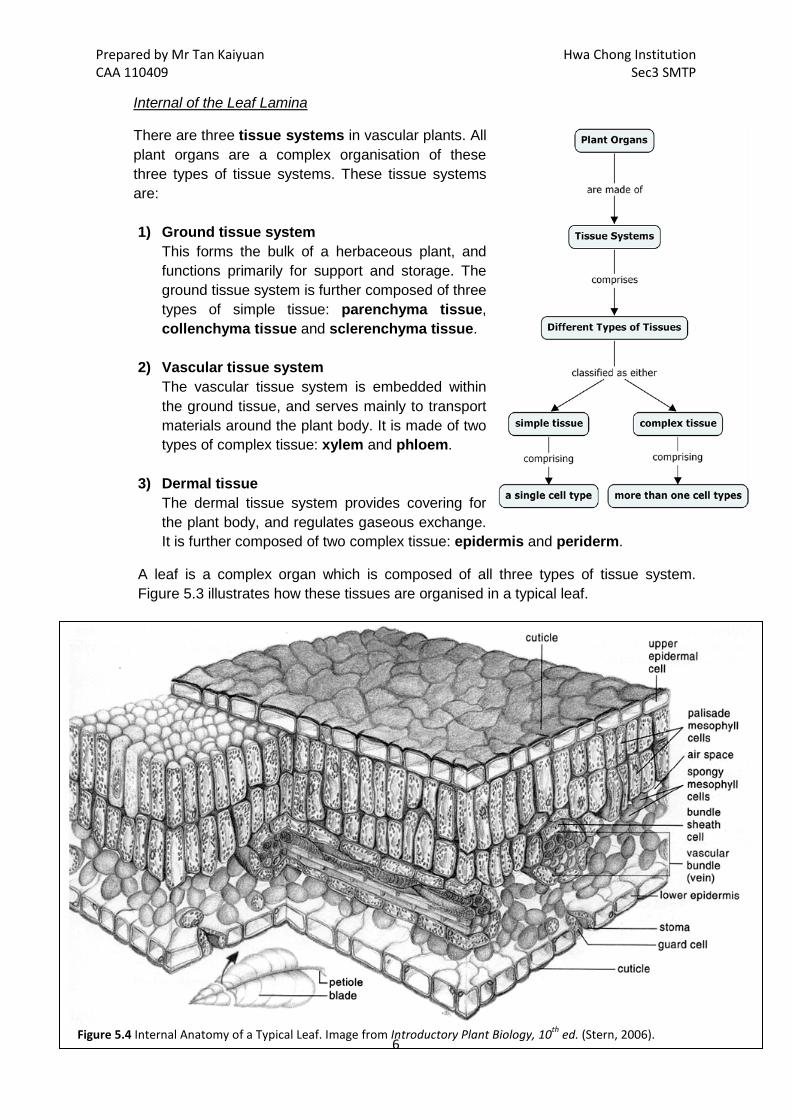
A leaf is a complex organ which is composed of all three types of tissue system. Figure 5.3 illustrates how these tissues are organised in a typical leaf.
Figure 5.4 Internal Anatomy of a Typical Leaf. Image from Introductory Plant Biology, 10th ed. (Stern, 2006).
Prepared by Mr Tan Kaiyuan Hwa Chong Institution CAA 110409 Sec3 SMTP
7
The table below describes the structure, form and function of a typical leaf.
Tissue System Structure Form Function
Dermal Tissue System
Upper Epidermis
Presence of waxy cuticle. Reduce water loss by evaporation.
Single, layer of closely packed epidermal cells. Protective covering.
Lower Epidermis
Also possess a waxy cuticle which may be thinner than the upper epidermis.
Reduce water loss by evaporation.
Consists of stomata pores with their associated guard cells.
Controls gaseous exchange with the atmosphere.
Ground Tissue System
Palisade Mesophyll
Consists of closely stacked, columnar parenchyma cells. These cells possess numerous chloroplasts.
Main site of photosynthesis.
Spongy Mesophyll
Consists of loosely arranged, and irregularly-shaped parenchyma cells with lots of intercellular air spaces in between.
Facilitates movement of oxygen, carbon dioxide and water vapour.
These cells also contains chloroplasts but in smaller numbers than the palisade mesophyll.
For photosynthesis.
Spongy mesophyll cells are covered with a thin film of moisture.
Moisture facilitates the dissolving of carbon dioxide and its subsequent diffusion into the cells for photosynthesis.
Vascular Tissue System
Vascular Bundle
Xylem tissue, arranged on the adaxial (upper part) of the vein.
Conducts water and mineral salts from the roots to the cells in the leaf.
Phloem tissue, arranged on the abaxial (lower part) of the vein.
Conducts sugars manufactured in the leaf to other parts of the plant.
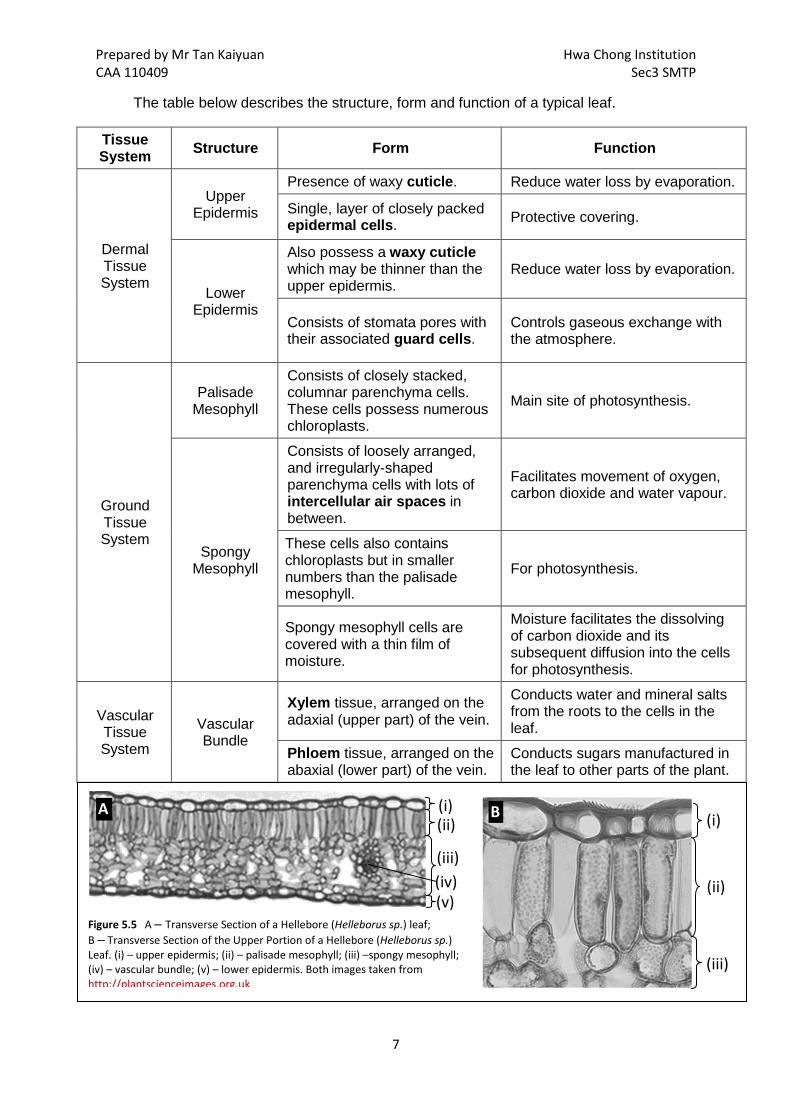
Figure 5.5 A – Transverse Section of a Hellebore (Helleborus sp.) leaf; B – Transverse Section of the Upper Portion of a Hellebore (Helleborus sp.) Leaf. (i) – upper epidermis; (ii) – palisade mesophyll; (iii) –spongy mesophyll; (iv) – vascular bundle; (v) – lower epidermis. Both images taken from http://plantscienceimages.org.uk
B (i)
(ii)
(iii)
A (i) (ii)
(iii) (iv) (v)

Prepared by Mr Tan Kaiyuan Hwa Chong Institution CAA 110409 Sec3 SMTP
8
Figure 5.6 Cross section of a monocot, corn (Zea mays) stem, showing the scattering of vascular bundles in the ground tissue (A); Close up of one individual vascular bundle (B). Image taken from Biology 7th ed. (Solomon, Berg and Martin, 2005).
A B
5.1.3 Structural Diversity in Flowering Plants • The flowering plants or angiosperms are the most successful plants today.
Traditionally, they may be divided into two classes: the monocots and the dicots. • Monocots include grasses, palms, orchids, irises, lilies and onions. • Dicots include oaks, roses, mustards, cacti, blueberries and sunflowers. • The table below illustrates some distinguishing characteristics between monocots
and dicots:
Feature Monocot Dicot
Leaf venation Usually parallel Usually reticulated, netted or branched
Vascular bundles in stem cross-section
Usually scattered or more complex arrangements
Arranged in a circle or ring with the xylem nearer the interior of the stem, and the phloem nearer the epidermis.
Flower parts Usually in threes Usually in fours or fives
Roots
Fibrous root system Taproot system
Pith located in the centre of the stele. Xylem vessels arranged in a ring nearer to central pith. Phloem cells located nearer to the endodermis.
Xylem vessels located in the centre of the stele. Xylem vessels form four or more extensions known as “xylem arms”. Phloem located in patches between xylem arms.
Seeds Embryo with one cotyledon Embryo with two cotyledons
Pollen grains One furrow or pore Three furrows or pores
Secondary growth (wood or bark) Absent Present

Prepared by Mr Tan Kaiyuan Hwa Chong Institution CAA 110409 Sec3 SMTP
9
A
B C
Figure 5.8 Cross-sections of the roots of a monocot and a dicot. A (monocot) – Greenbrier (Smilax sp.) root, showing the ring of xylem vessels around the pith, and an external ring of phloem vessels surrounding the xylem vessels. B (dicot) – Buttercup (Ranunculus sp.) root. C – Close up of the stele in the Buttercup root. Xylem elements with the “xylem arms” are visible. Phloem cells are localised in patches between the “xylem arms”. Images taken from Biology 7th ed. (Solomon, Berg and Martin, 2005).
Figure 5.7 Cross section of a dicot, sunflower (Helianthus annuus) stem, showing the ring arrangment of vascular bundles in the ground tissue (A); Close up of two individual vascular bundles (B). Notice that the xylem vessels are directed towards the pith, while the phloem is nearer to the epidermis. Images taken from Biology 7th ed. (Solomon, Berg and Martin, 2005).
A B
Prepared by Mr Tan Kaiyuan Hwa Chong Institution CAA 110409 Sec3 SMTP
10
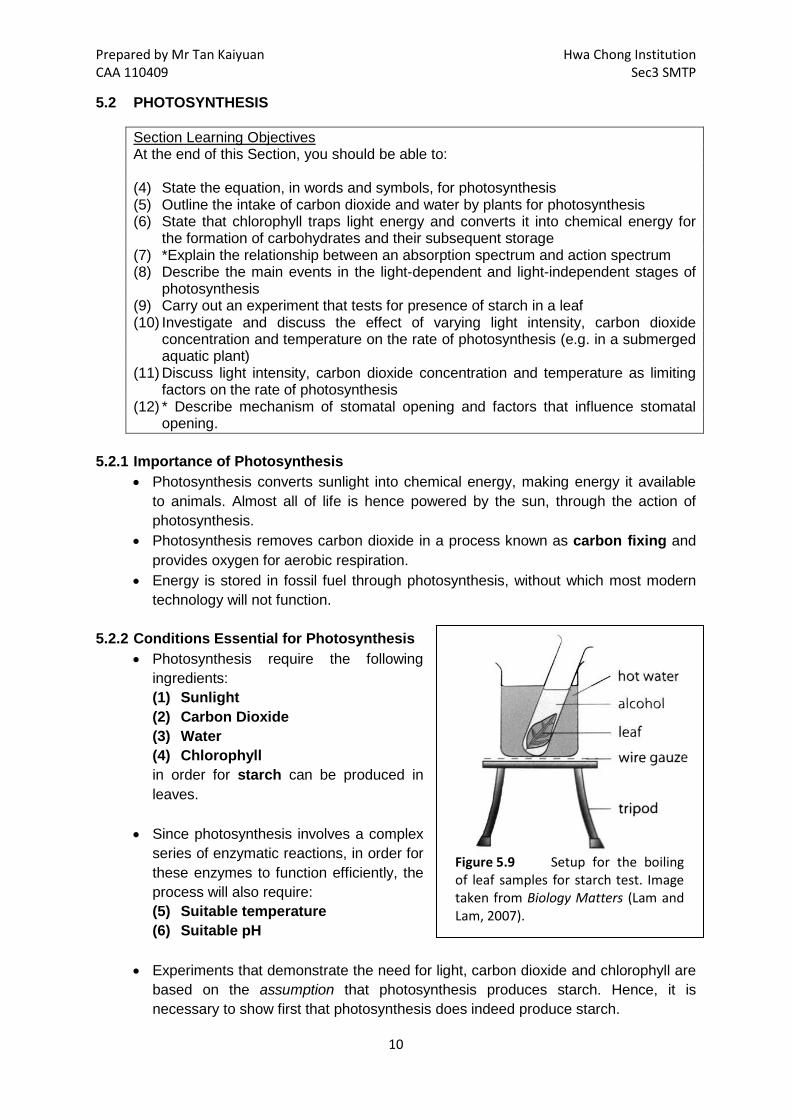
Figure 5.9 Setup for the boiling of leaf samples for starch test. Image taken from Biology Matters (Lam and Lam, 2007).
5.2 PHOTOSYNTHESIS
(4) State the equation, in words and symbols, for photosynthesis
Section Learning Objectives At the end of this Section, you should be able to:
(5) Outline the intake of carbon dioxide and water by plants for photosynthesis (6) State that chlorophyll traps light energy and converts it into chemical energy for
the formation of carbohydrates and their subsequent storage (7) *Explain the relationship between an absorption spectrum and action spectrum (8) Describe the main events in the light-dependent and light-independent stages of
photosynthesis (9) Carry out an experiment that tests for presence of starch in a leaf (10) Investigate and discuss the effect of varying light intensity, carbon dioxide
concentration and temperature on the rate of photosynthesis (e.g. in a submerged aquatic plant)
(11) Discuss light intensity, carbon dioxide concentration and temperature as limiting factors on the rate of photosynthesis
(12) * Describe mechanism of stomatal opening and factors that influence stomatal opening.
5.2.1 Importance of Photosynthesis
• Photosynthesis converts sunlight into chemical energy, making energy it available to animals. Almost all of life is hence powered by the sun, through the action of photosynthesis.
• Photosynthesis removes carbon dioxide in a process known as carbon fixing and provides oxygen for aerobic respiration.
• Energy is stored in fossil fuel through photosynthesis, without which most modern technology will not function.
5.2.2 Conditions Essential for Photosynthesis
• Photosynthesis require the following ingredients: (1) Sunlight (2) Carbon Dioxide (3) Water (4) Chlorophyll in order for starch can be produced in leaves.
• Since photosynthesis involves a complex series of enzymatic reactions, in order for these enzymes to function efficiently, the process will also require: (5) Suitable temperature (6) Suitable pH
• Experiments that demonstrate the need for light, carbon dioxide and chlorophyll are
based on the assumption that photosynthesis produces starch. Hence, it is necessary to show first that photosynthesis does indeed produce starch.
Prepared by Mr Tan Kaiyuan Hwa Chong Institution CAA 110409 Sec3 SMTP
11
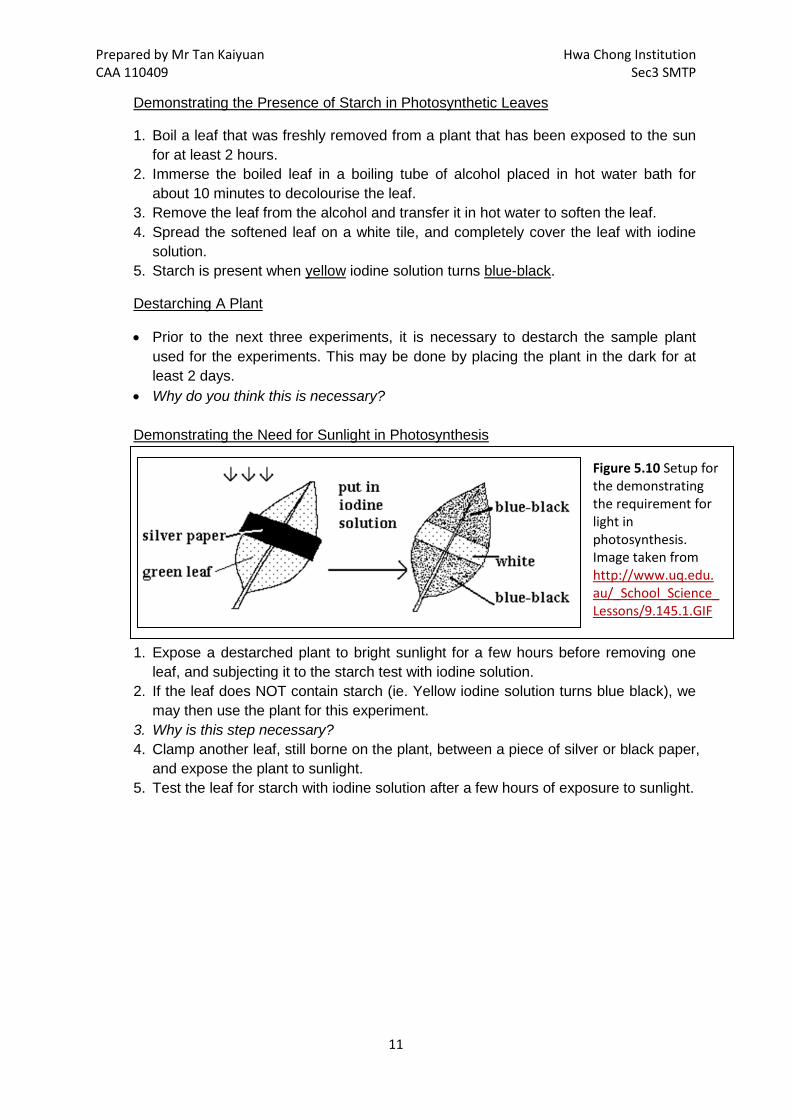
Figure 5.10 Setup for the demonstrating the requirement for light in photosynthesis. Image taken from http://www.uq.edu.au/_School_Science_Lessons/9.145.1.GIF
1. Boil a leaf that was freshly removed from a plant that has been exposed to the sun for at least 2 hours.
Demonstrating the Presence of Starch in Photosynthetic Leaves
2. Immerse the boiled leaf in a boiling tube of alcohol placed in hot water bath for about 10 minutes to decolourise the leaf.
3. Remove the leaf from the alcohol and transfer it in hot water to soften the leaf. 4. Spread the softened leaf on a white tile, and completely cover the leaf with iodine
solution. 5. Starch is present when yellow iodine solution turns blue-black.
• Prior to the next three experiments, it is necessary to destarch the sample plant used for the experiments. This may be done by placing the plant in the dark for at least 2 days.
Destarching A Plant
• Why do you think this is necessary?
1. Expose a destarched plant to bright sunlight for a few hours before removing one leaf, and subjecting it to the starch test with iodine solution.
Demonstrating the Need for Sunlight in Photosynthesis
2. If the leaf does NOT contain starch (ie. Yellow iodine solution turns blue black), we may then use the plant for this experiment.
3. Why is this step necessary? 4. Clamp another leaf, still borne on the plant, between a piece of silver or black paper,
and expose the plant to sunlight. 5. Test the leaf for starch with iodine solution after a few hours of exposure to sunlight.

Prepared by Mr Tan Kaiyuan Hwa Chong Institution CAA 110409 Sec3 SMTP
12
Figure 5.11(A) – Diagrammatic representation of a Coleus variegated leaf before (left) and after (right) the starch test with iodine solution. (B) – Images of the same Coleus leaves freshly cut (left), after decolourisation (centre) and after starch test (right). Images (Above) taken from http://www.uq.edu.au/_School_Science_Lessons/9.149.GIF ; Images on the (Left) taken from http://biology.uwsp.edu/courses/botlab/images/Lab11Light/11D%20Coleus%20Trtmt.jpg
A
B
Demonstrating the Need for Chlorophyll in Photosynthesis Variegated Leaves are leaves where certain regions on the leaf are green in colour. The regions that are green contain chlorophyll while the regions that are not, are usually pale yellow or whitish in appearance and lacks chlorophyll. 1. To demonstrate the need for chlorophyll for photosynthesis, expose a destarched
variegated plant to bright sunlight for a few hours, before removing one leaf and subjecting it to the starch test.
2. The regions that were initially green should be stained blue-black while the white or pale-yellow regions should be stained yellow.

Prepared by Mr Tan Kaiyuan Hwa Chong Institution CAA 110409 Sec3 SMTP
13
Figure 5.12 Experimental set-ups demonstrating the need for carbon dioxide for photosynthesis to take place. Images taken from Biology Matters (Lam and Lam, 2007)
Figure 5.13 Experimental setup to demonstrate that oxygen is produced during photosynthesis. Image taken from http://www.uq.edu.au/_School_Science_Lessons/9.145.1.GIF
Demonstrating the Need for Carbon Dioxide in Photosynthesis
1. Enclose the pots of destarched plants with polystyrene bags before setting up the apparatus as shown above.
2. In the experimental setup, soda lime and potassium hydroxide were used to remove carbon dioxide from the air surrounding the plant. Pebbles and water was used in the control set-up.
3. Remove one leaf from each plant after a few hours of exposure of both set-up to strong sunlight, and perform a starch test on the leaves.
4. Two plants were used in this experiment. Why do you think this may not be a fair test? Could you think of a way to improve this experiment?
Demonstrating Oxygen Production during Photosynthesis
1. Place some freshwater plants such as Hydrilla or Elodea under an inverted funnel, and submerged in dilute sodium bicarbonate solution, as shown in the figure below.
2. Provide a source of bright light and leave it on for a few hours. 3. Carefully remove the boiling tube from the set-up with your thumb over the mouth of
the tube to ensure that the gas collected does not escape. 4. Insert a glowing splint into the test-tube and it should relight if the gas collected was
oxygen.
Prepared by Mr Tan Kaiyuan Hwa Chong Institution CAA 110409 Sec3 SMTP
14
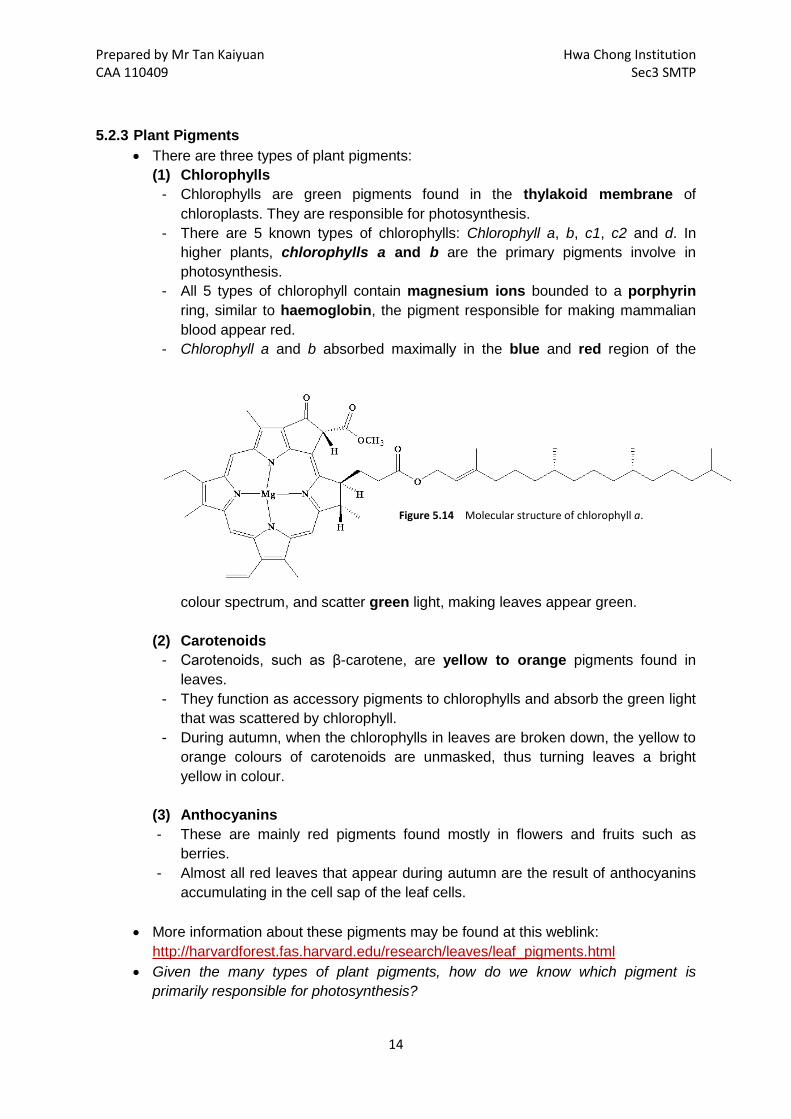
Figure 5.14 Molecular structure of chlorophyll a.
5.2.3 Plant Pigments • There are three types of plant pigments:
(1) Chlorophylls - Chlorophylls are green pigments found in the thylakoid membrane of
chloroplasts. They are responsible for photosynthesis. - There are 5 known types of chlorophylls: Chlorophyll a, b, c1, c2 and d. In
higher plants, chlorophylls a and b are the primary pigments involve in photosynthesis.
- All 5 types of chlorophyll contain magnesium ions bounded to a porphyrin ring, similar to haemoglobin, the pigment responsible for making mammalian blood appear red.
- Chlorophyll a and b absorbed maximally in the blue and red region of the
colour spectrum, and scatter green light, making leaves appear green.
(2) Carotenoids - Carotenoids, such as β-carotene, are yellow to orange pigments found in
leaves. - They function as accessory pigments to chlorophylls and absorb the green light
that was scattered by chlorophyll. - During autumn, when the chlorophylls in leaves are broken down, the yellow to
orange colours of carotenoids are unmasked, thus turning leaves a bright yellow in colour.
(3) Anthocyanins - These are mainly red pigments found mostly in flowers and fruits such as
berries. - Almost all red leaves that appear during autumn are the result of anthocyanins
accumulating in the cell sap of the leaf cells.
• More information about these pigments may be found at this weblink: http://harvardforest.fas.harvard.edu/research/leaves/leaf_pigments.html
• Given the many types of plant pigments, how do we know which pigment is primarily responsible for photosynthesis?
Prepared by Mr Tan Kaiyuan Hwa Chong Institution CAA 110409 Sec3 SMTP
15
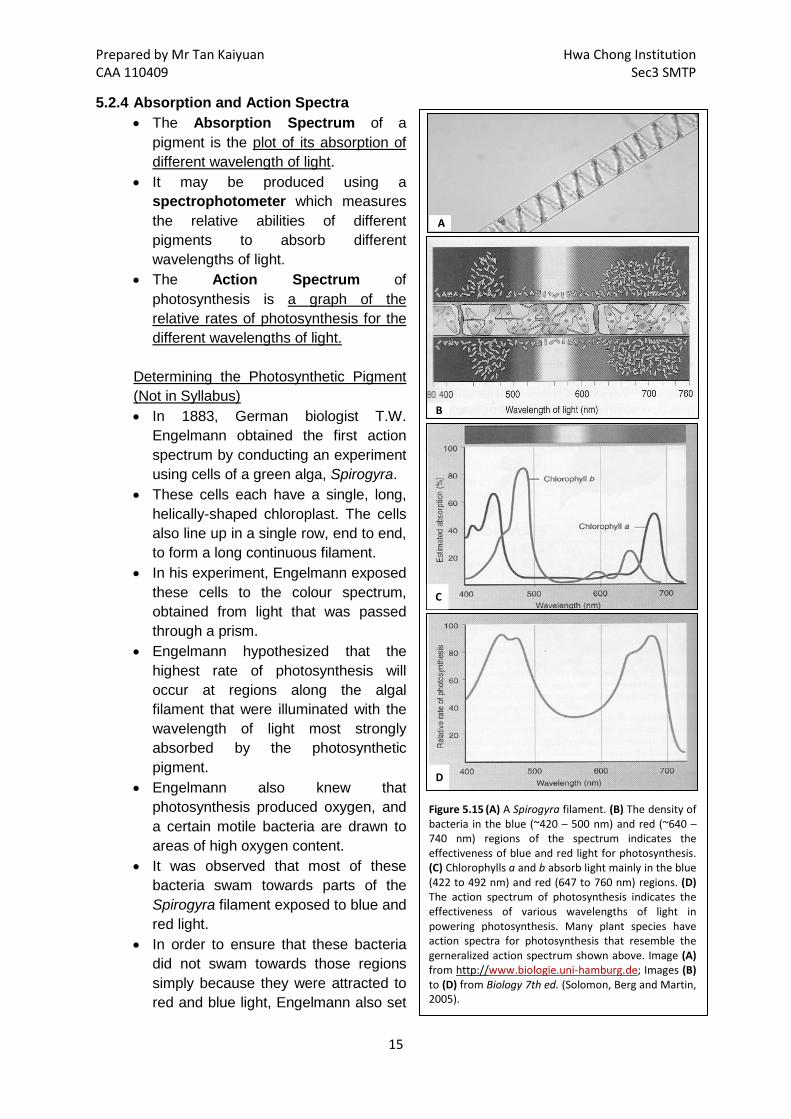
Figure 5.15 (A) A Spirogyra filament. (B) The density of bacteria in the blue (~420 – 500 nm) and red (~640 – 740 nm) regions of the spectrum indicates the effectiveness of blue and red light for photosynthesis. (C) Chlorophylls a and b absorb light mainly in the blue (422 to 492 nm) and red (647 to 760 nm) regions. (D) The action spectrum of photosynthesis indicates the effectiveness of various wavelengths of light in powering photosynthesis. Many plant species have action spectra for photosynthesis that resemble the gerneralized action spectrum shown above. Image (A) from http://www.biologie.uni-hamburg.de; Images (B) to (D) from Biology 7th ed. (Solomon, Berg and Martin, 2005).
A
B
C
D
5.2.4 Absorption and Action Spectra • The Absorption Spectrum of a
pigment is the plot of its absorption of different wavelength of light.
• It may be produced using a spectrophotometer which measures the relative abilities of different pigments to absorb different wavelengths of light.
• The Action Spectrum of photosynthesis is a graph of the relative rates of photosynthesis for the different wavelengths of light.
Determining the Photosynthetic Pigment (Not in Syllabus) • In 1883, German biologist T.W.
Engelmann obtained the first action spectrum by conducting an experiment using cells of a green alga, Spirogyra.
• These cells each have a single, long, helically-shaped chloroplast. The cells also line up in a single row, end to end, to form a long continuous filament.
• In his experiment, Engelmann exposed these cells to the colour spectrum, obtained from light that was passed through a prism.
• Engelmann hypothesized that the highest rate of photosynthesis will occur at regions along the algal filament that were illuminated with the wavelength of light most strongly absorbed by the photosynthetic pigment.
• Engelmann also knew that photosynthesis produced oxygen, and a certain motile bacteria are drawn to areas of high oxygen content.
• It was observed that most of these bacteria swam towards parts of the Spirogyra filament exposed to blue and red light.
• In order to ensure that these bacteria did not swam towards those regions simply because they were attracted to red and blue light, Engelmann also set

Prepared by Mr Tan Kaiyuan Hwa Chong Institution CAA 110409 Sec3 SMTP
16
up a control where the same bacteria were exposed to the colour spectrum in the absence of the algal filament. The bacteria exhibited no preference for the wavelengths of light exposed.
• Engelmann then compare this action spectrum with the absorption spectrum of chlorophyll and concluded from their similarity that chlorophyll was the leaf pigment responsible for photosynthesis.
• The absorption spectrum and the action spectrum however, do not match each other perfectly. Why?
Prepared by Mr Tan Kaiyuan Hwa Chong Institution CAA 110409 Sec3 SMTP
17
Chlorophy
b) 12 H2O 12 H + 6O2
c) 6 CO2 + 12 H C6H12O6 + 6 H2O
a) Sunlight
Chemical Energy
Dark Stage
Light Stage
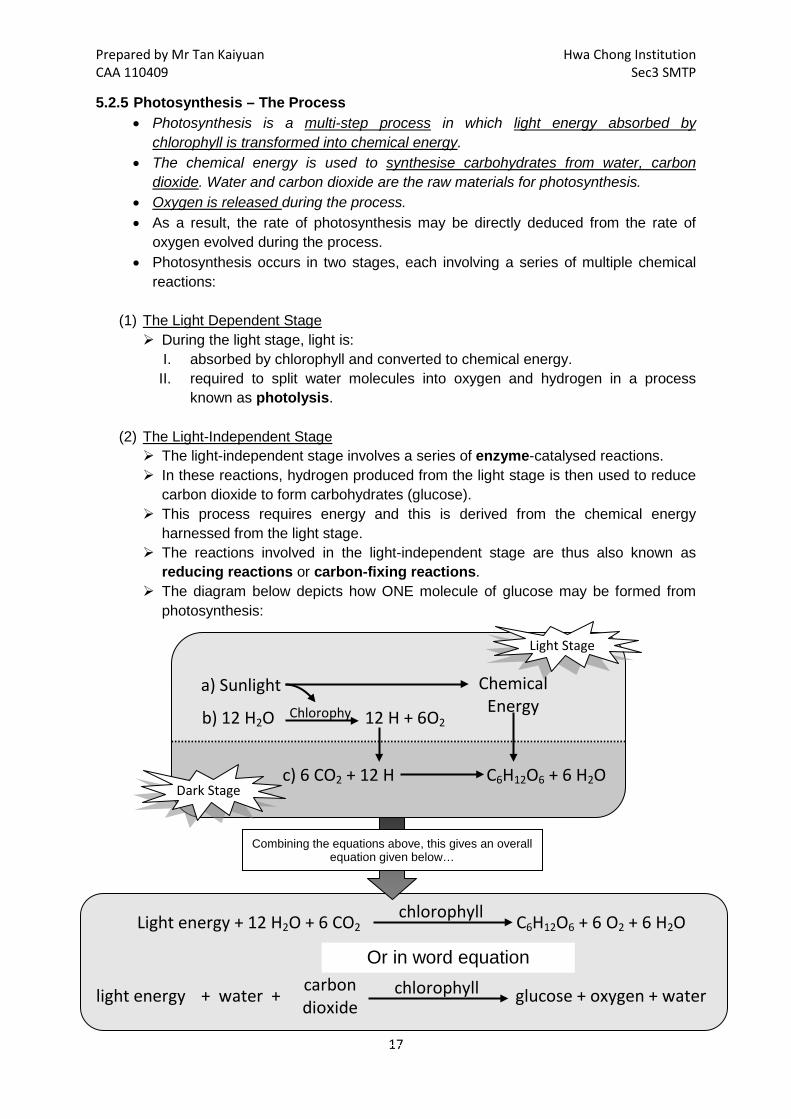
glucose + oxygen + water + water + light energy carbon dioxide
chlorophyll
Light energy + 12 H2O + 6 CO2 C6H12O6 + 6 O2 + 6 H2O
chlorophyll
Or in word equation
Combining the equations above, this gives an overall equation given below…
5.2.5 Photosynthesis – The Process • Photosynthesis is a multi-step process in which light energy absorbed by
chlorophyll is transformed into chemical energy. • The chemical energy is used to synthesise carbohydrates from water, carbon
dioxide. Water and carbon dioxide are the raw materials for photosynthesis. • Oxygen is released during the process. • As a result, the rate of photosynthesis may be directly deduced from the rate of
oxygen evolved during the process. • Photosynthesis occurs in two stages, each involving a series of multiple chemical
reactions:
(1) The Light Dependent Stage During the light stage, light is:
I. absorbed by chlorophyll and converted to chemical energy. II. required to split water molecules into oxygen and hydrogen in a process
known as photolysis.
(2) The Light-Independent Stage The light-independent stage involves a series of enzyme-catalysed reactions. In these reactions, hydrogen produced from the light stage is then used to reduce
carbon dioxide to form carbohydrates (glucose). This process requires energy and this is derived from the chemical energy
harnessed from the light stage. The reactions involved in the light-independent stage are thus also known as
reducing reactions or carbon-fixing reactions. The diagram below depicts how ONE molecule of glucose may be formed from
photosynthesis:

Prepared by Mr Tan Kaiyuan Hwa Chong Institution CAA 110409 Sec3 SMTP
18
Starch Glucose Maltose diastase maltase Sucrose converted to
for transport
Amino Acids Polypeptides pepsin erepsin Proteins
Fats
Glycerol
Fatty Acids
Figure 5.17 Digestion of starch, proteins and fats in plants.
Figure 5.16 Fate of glucose produced from photosynthesis.
5.2.6 Fate of the Products of Photosynthesis
• Glucose produced in photosynthesis is then converted to other substrates. This is summarised in the table below:
Utilising Stored Food • While the glucose formed during photosynthesis may be stored in various forms
such as carbohydrates, proteins and fats, plants may also mobilise these stored reserves for digestion, making energy available for use. The diagram below summarises how each food type is digested:
Substrate Function
Glucose For cellular respiration To form cellulose cell wall
Sucrose For transport out of leaf to storage organs to be stored as starch
Starch For temporary storage directly in leaf which produces the glucose
Amino Acids
For synthesis of new protoplasm Converted to proteins for storage
Proteins For synthesis of new protoplasm, esp. growing regions of plant
Fats
For storage in storage organs For cellular respiration For synthesis of new protoplasm eg. cell membrane
excess used as
used directly as
in daylight, excess converted to
forms
Glucose formed Reacts with Nitrates &
Mineral Salts to form
forms Amino Acids
in darkness, converts back to
Prepared by Mr Tan Kaiyuan Hwa Chong Institution CAA 110409 Sec3 SMTP
19
Light Intensity
0.03% CO2 at 20 °C
Rate
of P
hoto
synt
hesi
s
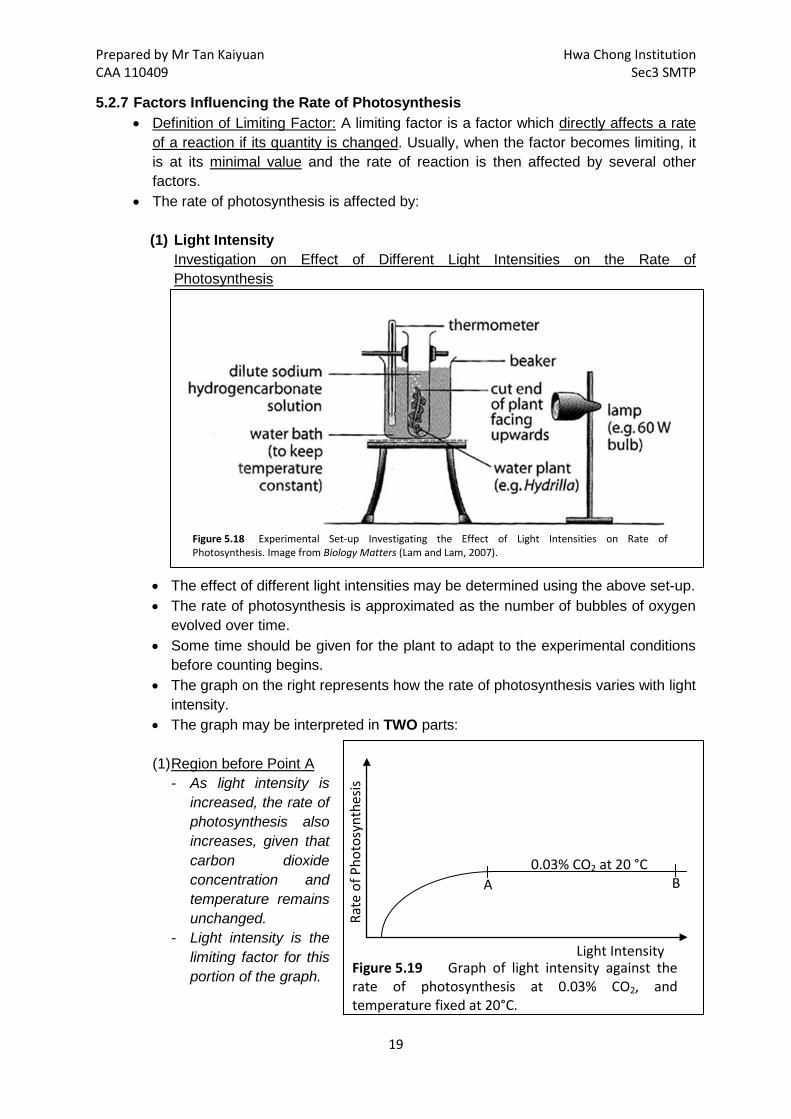
Figure 5.19 Graph of light intensity against the rate of photosynthesis at 0.03% CO2, and temperature fixed at 20°C.
A B
Figure 5.18 Experimental Set-up Investigating the Effect of Light Intensities on Rate of Photosynthesis. Image from Biology Matters (Lam and Lam, 2007).
5.2.7 Factors Influencing the Rate of Photosynthesis • Definition of Limiting Factor: A limiting factor is a factor which directly affects a rate
of a reaction if its quantity is changed. Usually, when the factor becomes limiting, it is at its minimal value and the rate of reaction is then affected by several other factors.
• The rate of photosynthesis is affected by: (1) Light Intensity
Investigation on Effect of Different Light Intensities on the Rate of Photosynthesis
• The effect of different light intensities may be determined using the above set-up. • The rate of photosynthesis is approximated as the number of bubbles of oxygen
evolved over time. • Some time should be given for the plant to adapt to the experimental conditions
before counting begins. • The graph on the right represents how the rate of photosynthesis varies with light
intensity. • The graph may be interpreted in TWO parts:
(1) Region before Point A
- As light intensity is increased, the rate of photosynthesis also increases, given that carbon dioxide concentration and temperature remains unchanged.
- Light intensity is the limiting factor for this portion of the graph.
Prepared by Mr Tan Kaiyuan Hwa Chong Institution CAA 110409 Sec3 SMTP
20
Changes are NOT significant at 0.03% CO2.
Light Intensity
0.03% CO2 at 20 °C
Rate
of P
hoto
synt
hesi
s
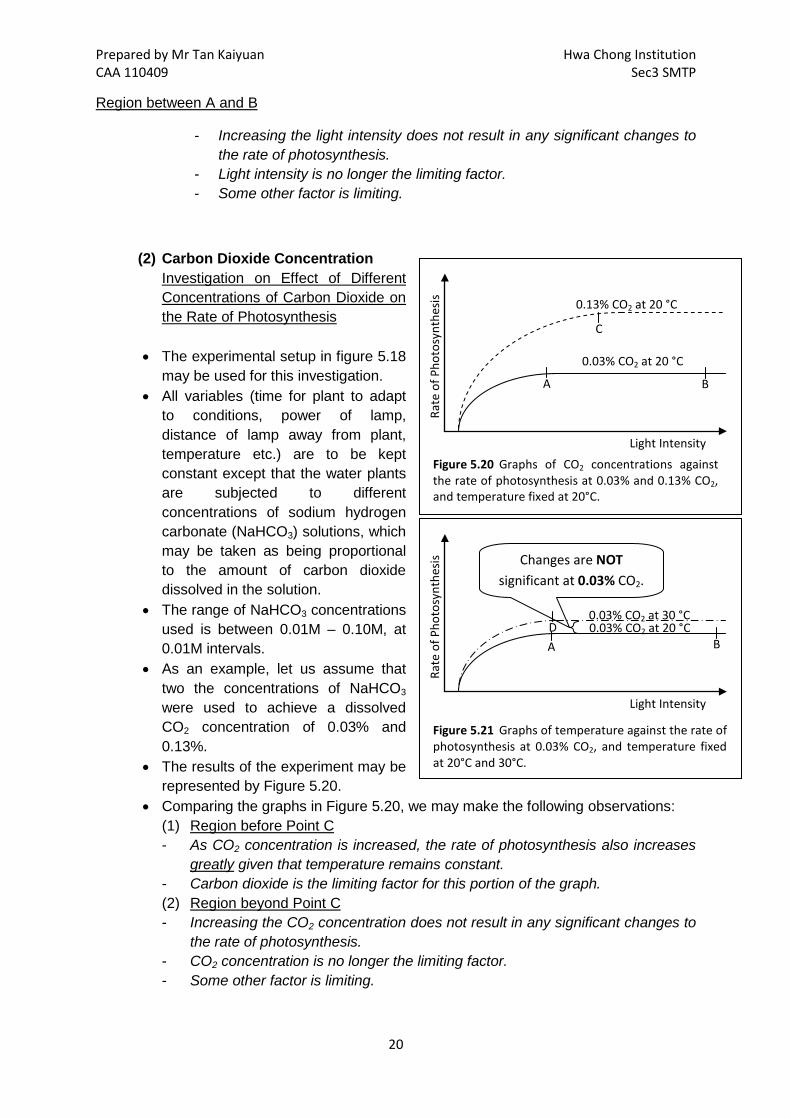
Figure 5.20 Graphs of CO2 concentrations against the rate of photosynthesis at 0.03% and 0.13% CO2, and temperature fixed at 20°C.
0.13% CO2 at 20 °C
B A
C
D
Light Intensity
0.03% CO2 at 20 °C
Rate
of P
hoto
synt
hesi
s
Figure 5.21 Graphs of temperature against the rate of photosynthesis at 0.03% CO2, and temperature fixed at 20°C and 30°C.
0.03% CO2 at 30 °C
A B
Region between A and B
- Increasing the light intensity does not result in any significant changes to the rate of photosynthesis.
- Light intensity is no longer the limiting factor. - Some other factor is limiting.
(2) Carbon Dioxide Concentration Investigation on Effect of Different Concentrations of Carbon Dioxide on the Rate of Photosynthesis
• The experimental setup in figure 5.18 may be used for this investigation.
• All variables (time for plant to adapt to conditions, power of lamp, distance of lamp away from plant, temperature etc.) are to be kept constant except that the water plants are subjected to different concentrations of sodium hydrogen carbonate (NaHCO3) solutions, which may be taken as being proportional to the amount of carbon dioxide dissolved in the solution.
• The range of NaHCO3 concentrations used is between 0.01M – 0.10M, at 0.01M intervals.
• As an example, let us assume that two the concentrations of NaHCO3 were used to achieve a dissolved CO2 concentration of 0.03% and 0.13%.
• The results of the experiment may be represented by Figure 5.20.
• Comparing the graphs in Figure 5.20, we may make the following observations: (1) Region before Point C - As CO2 concentration is increased, the rate of photosynthesis also increases
greatly given that temperature remains constant. - Carbon dioxide is the limiting factor for this portion of the graph. (2) Region beyond Point C - Increasing the CO2 concentration does not result in any significant changes to
the rate of photosynthesis. - CO2 concentration is no longer the limiting factor. - Some other factor is limiting.
Prepared by Mr Tan Kaiyuan Hwa Chong Institution CAA 110409 Sec3 SMTP
21
B
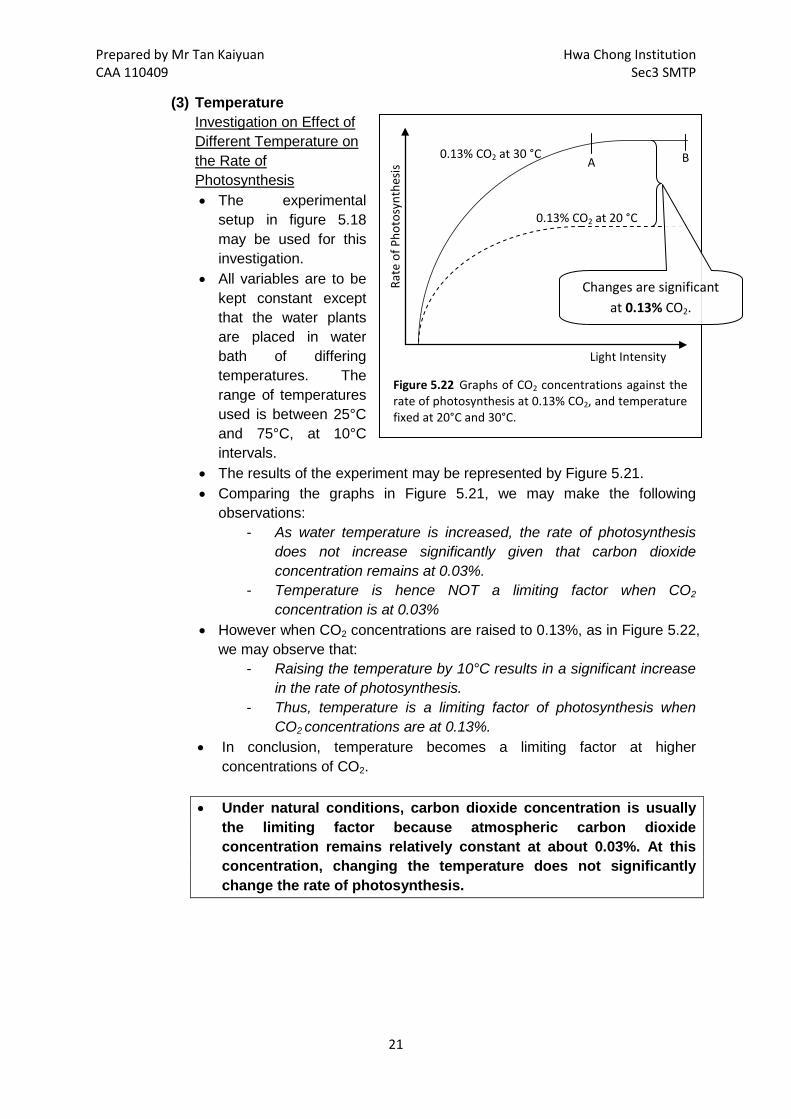
Figure 5.22 Graphs of CO2 concentrations against the rate of photosynthesis at 0.13% CO2, and temperature fixed at 20°C and 30°C.
Light Intensity
Rate
of P
hoto
synt
hesi
s
0.13% CO2 at 20 °C
0.13% CO2 at 30 °C A
Changes are significant at 0.13% CO2.
(3) Temperature Investigation on Effect of Different Temperature on the Rate of Photosynthesis • The experimental
setup in figure 5.18 may be used for this investigation.
• All variables are to be kept constant except that the water plants are placed in water bath of differing temperatures. The range of temperatures used is between 25°C and 75°C, at 10°C intervals.
• The results of the experiment may be represented by Figure 5.21. • Comparing the graphs in Figure 5.21, we may make the following
observations: - As water temperature is increased, the rate of photosynthesis
does not increase significantly given that carbon dioxide concentration remains at 0.03%.
- Temperature is hence NOT a limiting factor when CO2 concentration is at 0.03%
• However when CO2 concentrations are raised to 0.13%, as in Figure 5.22, we may observe that:
- Raising the temperature by 10°C results in a significant increase in the rate of photosynthesis.
- Thus, temperature is a limiting factor of photosynthesis when CO2 concentrations are at 0.13%.
• In conclusion, temperature becomes a limiting factor at higher concentrations of CO2.
• Under natural conditions, carbon dioxide concentration is usually the limiting factor because atmospheric carbon dioxide concentration remains relatively constant at about 0.03%. At this concentration, changing the temperature does not significantly change the rate of photosynthesis.
Prepared by Mr Tan Kaiyuan Hwa Chong Institution CAA 110409 Sec3 SMTP
22
At this light intensity, the oxygen produced
through photosynthesis
exactly matches the oxygen consumed by
respiration.
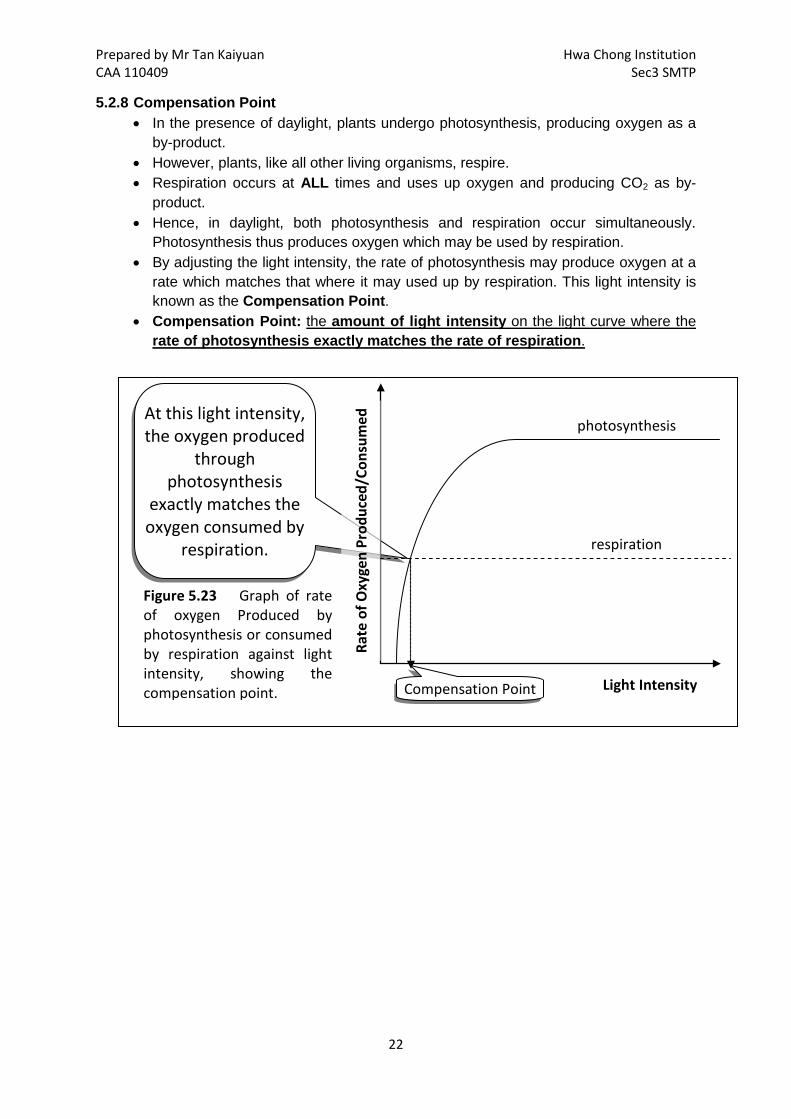
Figure 5.23 Graph of rate of oxygen Produced by photosynthesis or consumed by respiration against light intensity, showing the compensation point. Light Intensity
photosynthesis
Rate
of O
xyge
n Pr
oduc
ed/C
onsu
med
respiration
Compensation Point
5.2.8 Compensation Point • In the presence of daylight, plants undergo photosynthesis, producing oxygen as a
by-product. • However, plants, like all other living organisms, respire. • Respiration occurs at ALL times and uses up oxygen and producing CO2 as by-
product. • Hence, in daylight, both photosynthesis and respiration occur simultaneously.
Photosynthesis thus produces oxygen which may be used by respiration. • By adjusting the light intensity, the rate of photosynthesis may produce oxygen at a
rate which matches that where it may used up by respiration. This light intensity is known as the Compensation Point.
• Compensation Point: the amount of light intensity on the light curve where the rate of photosynthesis exactly matches the rate of respiration.
Prepared by Mr Tan Kaiyuan Hwa Chong Institution CAA 110409 Sec3 SMTP
23
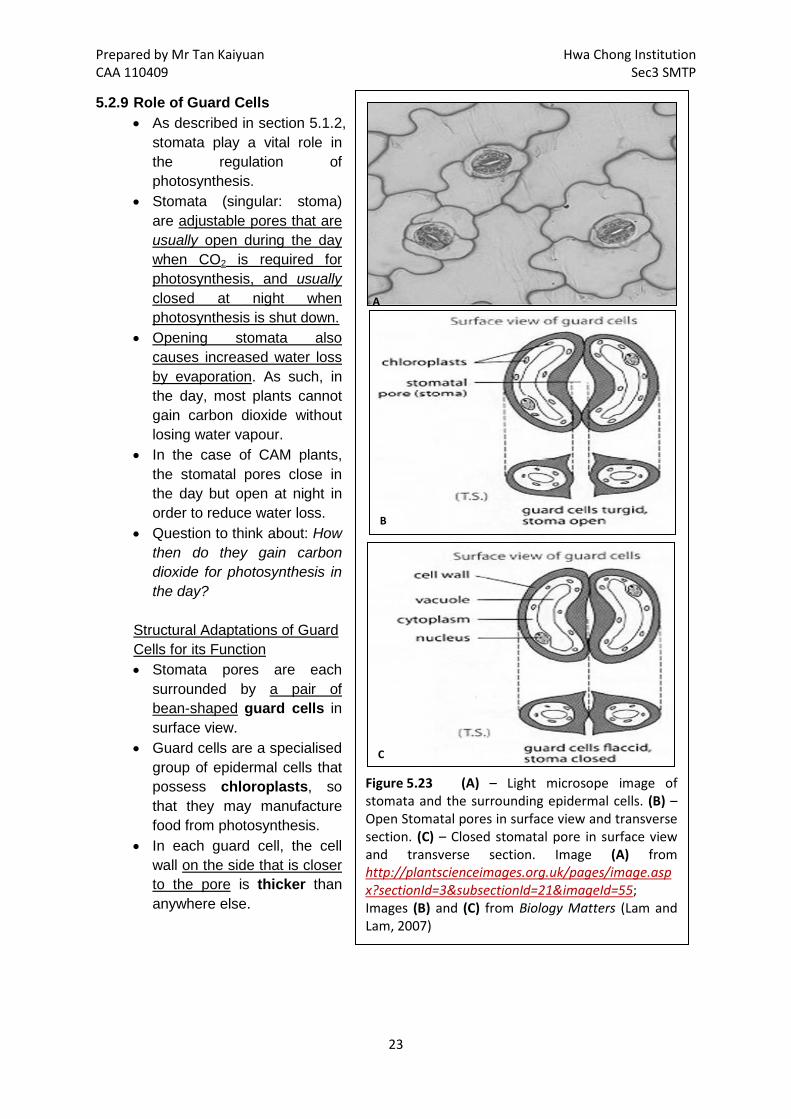
A
B
C
Figure 5.23 (A) – Light microsope image of stomata and the surrounding epidermal cells. (B) – Open Stomatal pores in surface view and transverse section. (C) – Closed stomatal pore in surface view and transverse section. Image (A) from http://plantscienceimages.org.uk/pages/image.aspx?sectionId=3&subsectionId=21&imageId=55; Images (B) and (C) from Biology Matters (Lam and Lam, 2007)
5.2.9 Role of Guard Cells • As described in section 5.1.2,
stomata play a vital role in the regulation of photosynthesis.
• Stomata (singular: stoma) are adjustable pores that are usually open during the day when CO2 is required for photosynthesis, and usually closed at night when photosynthesis is shut down.
• Opening stomata also causes increased water loss by evaporation. As such, in the day, most plants cannot gain carbon dioxide without losing water vapour.
• In the case of CAM plants, the stomatal pores close in the day but open at night in order to reduce water loss.
• Question to think about: How then do they gain carbon dioxide for photosynthesis in the day?
Structural Adaptations of Guard Cells for its Function • Stomata pores are each
surrounded by a pair of bean-shaped guard cells in surface view.
• Guard cells are a specialised group of epidermal cells that possess chloroplasts, so that they may manufacture food from photosynthesis.
• In each guard cell, the cell wall on the side that is closer to the pore is thicker than anywhere else.
Prepared by Mr Tan Kaiyuan Hwa Chong Institution CAA 110409 Sec3 SMTP
24
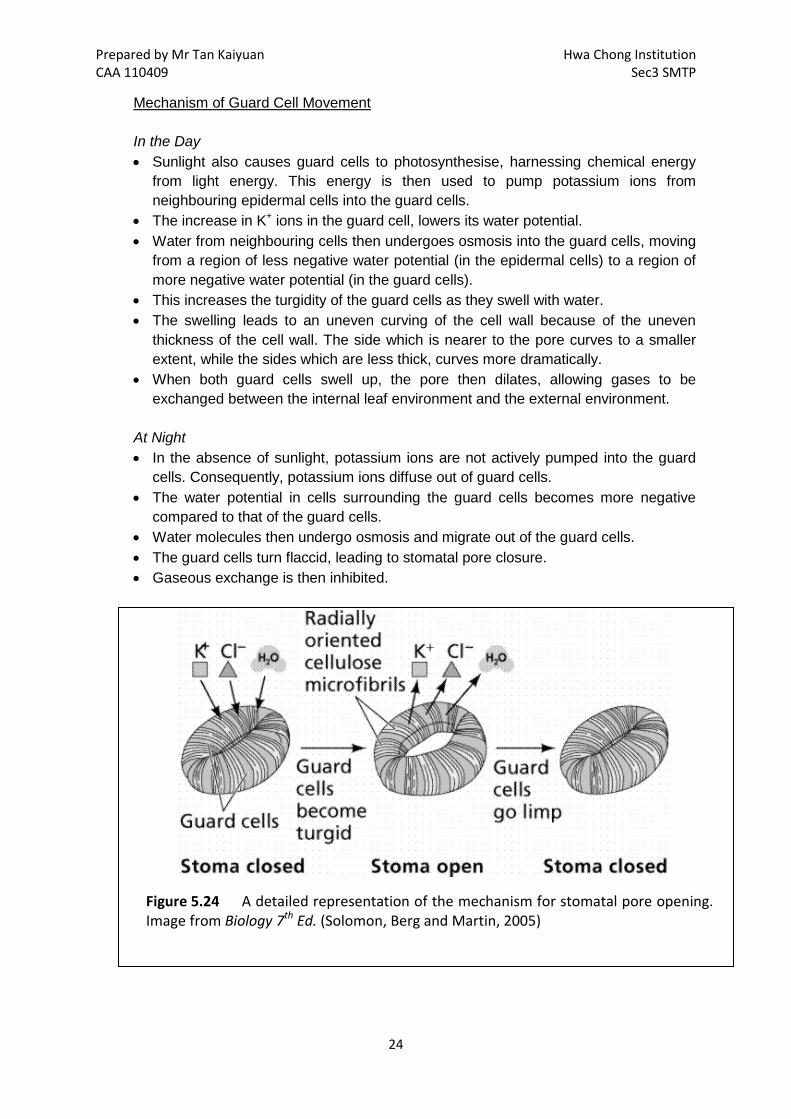
Figure 5.24 A detailed representation of the mechanism for stomatal pore opening. Image from Biology 7th Ed. (Solomon, Berg and Martin, 2005)
Mechanism of Guard Cell Movement In the Day • Sunlight also causes guard cells to photosynthesise, harnessing chemical energy
from light energy. This energy is then used to pump potassium ions from neighbouring epidermal cells into the guard cells.
• The increase in K+ ions in the guard cell, lowers its water potential. • Water from neighbouring cells then undergoes osmosis into the guard cells, moving
from a region of less negative water potential (in the epidermal cells) to a region of more negative water potential (in the guard cells).
• This increases the turgidity of the guard cells as they swell with water. • The swelling leads to an uneven curving of the cell wall because of the uneven
thickness of the cell wall. The side which is nearer to the pore curves to a smaller extent, while the sides which are less thick, curves more dramatically.
• When both guard cells swell up, the pore then dilates, allowing gases to be exchanged between the internal leaf environment and the external environment.
At Night • In the absence of sunlight, potassium ions are not actively pumped into the guard
cells. Consequently, potassium ions diffuse out of guard cells. • The water potential in cells surrounding the guard cells becomes more negative
compared to that of the guard cells. • Water molecules then undergo osmosis and migrate out of the guard cells. • The guard cells turn flaccid, leading to stomatal pore closure. • Gaseous exchange is then inhibited.
Prepared by Mr Tan Kaiyuan Hwa Chong Institution CAA 110409 Sec3 SMTP
25
Factors Influencing Stomatal Opening and Closure • 4 main factors influence stomatal opening and closure. This is summarised in the
table below:
Factor Effect
Light In most plants, stomata open in the presence of light, and close in darkness.
Water supply
Stomata open if there is sufficient water supply. Even in bright light, when there is insufficient supply of water or when water is lost in large amount, stomata will close.
Carbon dioxide concentration
A low CO2 concentration in the stomatal air chamber leads to stomata opening. Conversely, high CO2 concentrations lead to their closing.
Abscisic Acid concentration In the presence of high concentrations of abscisic acid, a plant growth regulator, stomatal pores will be closed.
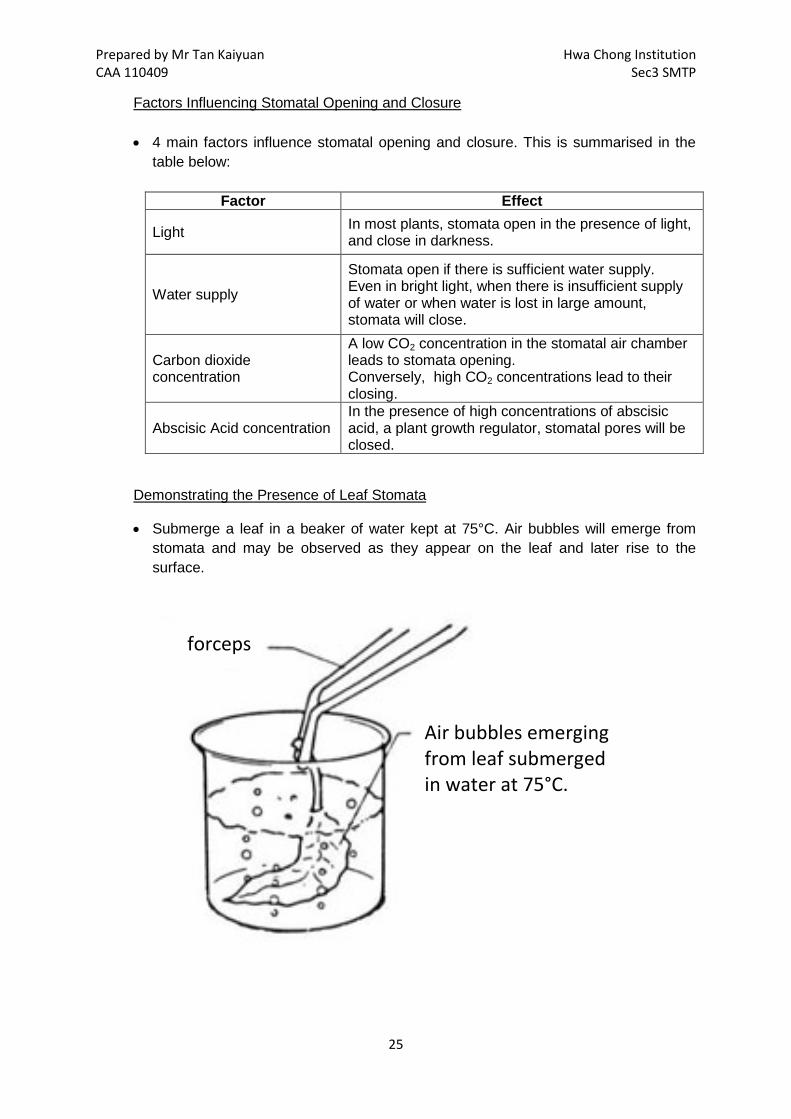
Demonstrating the Presence of Leaf Stomata
• Submerge a leaf in a beaker of water kept at 75°C. Air bubbles will emerge from stomata and may be observed as they appear on the leaf and later rise to the surface.
Air bubbles emerging from leaf submerged in water at 75°C.
forceps
Prepared by Mr Tan Kaiyuan Hwa Chong Institution CAA 110409 Sec3 SMTP
26
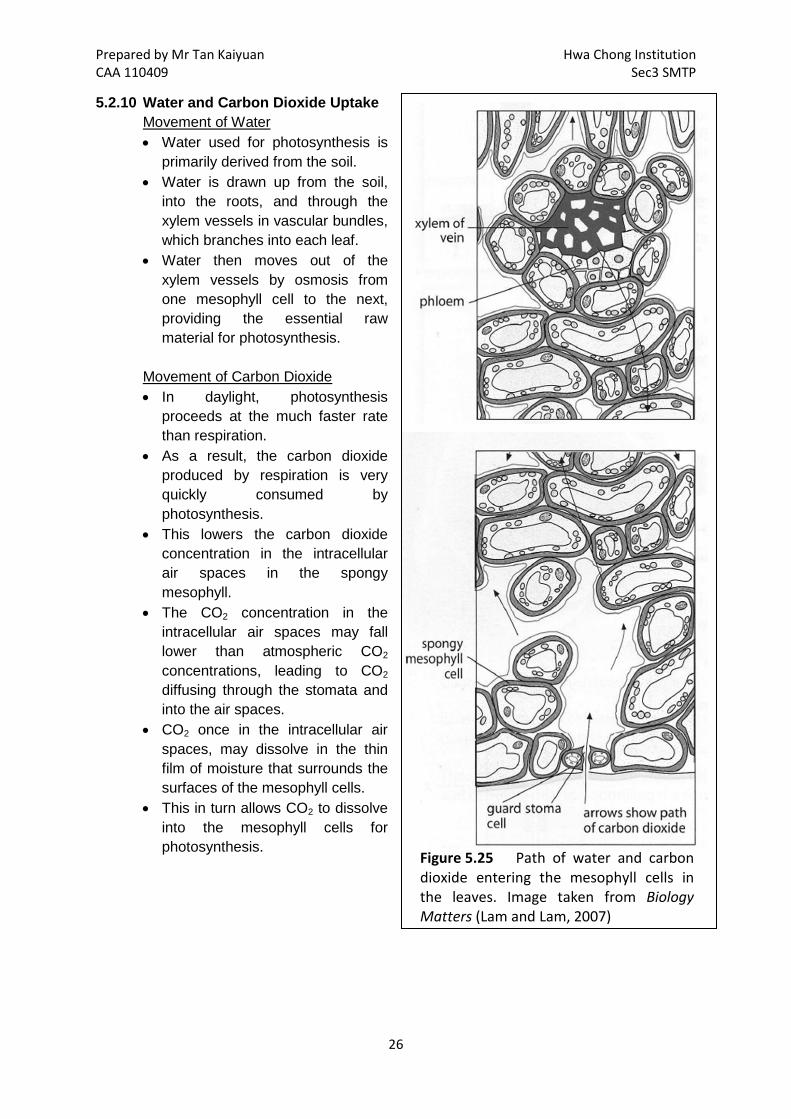
Figure 5.25 Path of water and carbon dioxide entering the mesophyll cells in the leaves. Image taken from Biology Matters (Lam and Lam, 2007)
5.2.10 Water and Carbon Dioxide Uptake Movement of Water • Water used for photosynthesis is
primarily derived from the soil. • Water is drawn up from the soil,
into the roots, and through the xylem vessels in vascular bundles, which branches into each leaf.
• Water then moves out of the xylem vessels by osmosis from one mesophyll cell to the next, providing the essential raw material for photosynthesis.
Movement of Carbon Dioxide • In daylight, photosynthesis
proceeds at the much faster rate than respiration.
• As a result, the carbon dioxide produced by respiration is very quickly consumed by photosynthesis.
• This lowers the carbon dioxide concentration in the intracellular air spaces in the spongy mesophyll.
• The CO2 concentration in the intracellular air spaces may fall lower than atmospheric CO2 concentrations, leading to CO2 diffusing through the stomata and into the air spaces.
• CO2 once in the intracellular air spaces, may dissolve in the thin film of moisture that surrounds the surfaces of the mesophyll cells.
• This in turn allows CO2 to dissolve into the mesophyll cells for photosynthesis.

Prepared by Mr Tan Kaiyuan Hwa Chong Institution CAA 110409 Sec3 SMTP
27
5.3 LEAF ADAPTATION & PHOTOSYNTHESIS
Section Learning Objectives At the end of this Section, you should be able to: (13) Describe the adaptations of leaves for photosynthesis (14) * Describe structural differences between a sun leaf and a shade leaf, and how
they are adapted to survive in their respective habitats. (15) * Explain how a low compensation point adapts a shade plant to live in places with
low light intensity
5.3.1 General Structural Adaptation
The table below (adapted from Lam and Lam, 2007) summarises the structural adaptations of leaves for photosynthesis:
Adaptation Function
Petiole (leaf stalk) Holds leaf in position to absorb maximum light energy.
Thin flat lamina Allows maximum absorption of light energy. Allows CO2 to reach inner cells rapidly. Enables sunlight to reach all mesophyll cells.
Waxy cuticle on upper and lower epidermis
Reduces water loss through evaporation from the leaf.
Stomata present in the epidermal layers
Open in sunlight, allowing CO2 to diffuse in and oxygen to diffuse out of the leaf.
Chloroplasts, with chlorophyll, in mesophyll cells
Chlorophyll absorbs and transforms light energy to chemical energy used in the manufacture of sugars.
Presence of more chloroplast in upper palisade tissue
More light energy can be absorbed near the leaf surface.
Interconnecting system of air spaces in spongy mesophyll
Allows rapid diffusion of carbon dioxide into mesophyll cells.
Veins containing xylem and phloem vessels
Xylem transports water and mineral salts to mesophyll cells. Phloem transports sugars away from the leaf.
5.3.2 Acclimatisation – Sun-Acclimated and Shade-Acclimated Leaves
• Plants adapt quickly to their environment. • In places where there is ample sunlight, plants produce sun-acclimated leaves.
Conversely, if a plant is placed in a shaded position for some time, the young leaves will develop into shade-acclimated leaves.
• The table on the following page compares the similarities and differences between sun-acclimated and shade-acclimated leaves:

Prepared by Mr Tan Kaiyuan Hwa Chong Institution CAA 110409 Sec3 SMTP
28
Figure 5.26 (A) – Transverse section of a sun leaf from a maple (Acer) plant. (B) – Transverse section of a shade leaf from a maple plant. Images from Introductory Plant Biology, 10th ed. (Stern, 2006).
Feature Sun-Acclimated Leaves Shade-Acclimated Leaves
Leaf thickness Thicker Thinner
Leaf surface area Smaller Larger
Organisation of mesophyll layer
Well-defined palisade and spongy mesophyll layers
Palisade and spongy mesophyll less well-defined with more intercellular air spaces
Number of chloroplasts More chloroplasts Fewer chloroplasts

Prepared by Mr Tan Kaiyuan Hwa Chong Institution CAA 110409 Sec3 SMTP
29
(1) Leaf thickness • Sun-acclimated leaves possess a much thicker palisade mesophyll layer to
absorb the large amount of sunlight that it is exposed to. • The thickness may occur as a result of much elongated palisade cells, or in
some species, more than one layer of palisade cells. • There is however an increased maintenance and construction cost for building
thick leaves, which limits how thick the leaves can develop. This cost may be compensated by the food the leaf produces from higher photosynthetic rates, due to higher light intensity.
• Shade-acclimated leaves do not develop thick leaves because the amount of light is not sufficient for sustaining an increased cost if the leaves are to get any thicker.
(2) Leaf Surface Area
• In low light intensity, shade-acclimated leaves may develop larger surface areas to capture every bit of light that may fall upon it.
(3) Organisation of mesophyll layer
• Typically shade-acclimated leaves have more intercellular air spaces which increases the scattering of light inside the leaves. Scattering light increases the chance of light falling on chloroplasts.
(4) Number of chloroplasts • In sun-acclimated leaves, there are more chloroplasts for capturing sunlight.
Conversely, shade leaves possess far lesser numbers of chloroplasts.

Prepared by Mr Tan Kaiyuan Hwa Chong Institution CAA 110409 Sec3 SMTP
30
Figure 5.27 Light response curves of a sun-acclimatised leaf and a shade-acclimatised leaf of the same plant. The sun leaf has a higher compensation point and a higher rate of photosynthesis at the same saturating light intensity as the shade leaf.
Higher Compensation Point
Light Intensity
Light response curve of a sun leaf
Rate
of O
xyge
n Pr
oduc
ed/C
onsu
med
respiration
Light response curve of a shade leaf
5.3.3 Sun and Shade Leaves Compensation Point • The light response curve of sun and shade-acclimated leaves are given below.
• Some notable physiological differences between a sun-acclimatised and a shade-acclimatised leaf are list below: (1) Sun leaves have a higher compensation point (2) At saturating light intensities ( the light intensity where photosynthesis proceeds
at maximum rate given all other conditions remain constant), sun-acclimated leaves have higher rates of photosynthesis than shade leaves.
• Advantage to shade leaves: Lower compensation points suggest that plants with shade leaves may reach their maximum rate of photosynthesis at very low light intensities. This also increases the photosynthetic efficiency of shade leaves.
• More information available at: http://plantphys.info/plant_physiology/photoeco.shtml

Prepared by Mr Tan Kaiyuan Hwa Chong Institution CAA 110409 Sec3 SMTP
31
5.4 MINERAL NUTRITION
Section Learning Objectives At the end of this Section, you should be able to: (16) State the effect of a lack of nitrate and of magnesium ions on plant growth.
• Plants require other elements for healthy development. • For instance, to make proteins, plants require nitrogen and sulphur. For the
production of more nucleic acids, plants also require phosphorus. More importantly, as highlighted earlier, in order to make chlorophyll, plants need magnesium.
• Elements that are necessary for healthy plant growth are called essential elements. • The table below lists some of these elements:
Non-metallic Some Functions Deficiency Symptoms
Nitrogen Part of protein, nucleic acids, chlorophyll
Relatively uniform loss of colour in leaves, occurring first on the oldest ones.
Phosphorus
Necessary for respiration and cell division; high-energy cell compounds (eg. adenosine triphosphate)
Plants stunted; Leaves darker green than normal; Lower leaves often purplish between veins.
Sulphur Part of some amino acids Leaves pale green with dead spots; Veins lighter in colour than the rest of the leaf area.
Boron Influences utilization of calcium ions, but specific function unknonwn
Petioles and stems brittle; Bases of young leaves break down.
Metallic Some Functions Deficiency Symptoms
Potassium
Activates enzymes; concentrates in meristems (growing points with active cell division)
Yellowing of leaves, beginning at the margins and continuing toward centre; Lower leaves mottled and often brown at the tip.
Calcium
Essential part of middle lamella; involve in movement of substances through cell membranes
Terminal bud often dead; young leaves often appearing hooked at tip; Tips and margins of leaves withered; Roots dead or dying.
Magnesium Part of chlorophyll molecules; activates enzymes.
Veins of leaves green but yellow between them. With dead spots appearing suddenly; Leaf margins curling.
Manganese Activates some enzymes
Dead spots scattered over leaf surface; All veins and veinlets remain green; Effects confined to youngest leaves.
Iron Needed to make chlorophyll and in respiration
Larger veins remaining green while rest of leaf yellows; Mainly in young leaves.

Prepared by Mr Tan Kaiyuan Hwa Chong Institution CAA 110409 Sec3 SMTP
32
5.4.1 Nitrates • Nitrogen is taken into plants in the form of nitrates. • Many plants form symbiotic relationships with nitrogen-fixing bacteria, which convert
atmospheric nitrogen into nitrates that may be readily taken up by plants. • Nitrogen may also be obtained from ammonia, a by-product produced by
decomposers as they remove faeces and urine, or dead organisms. The ammonia must however be converted to nitrates before uptake by the roots of plants.
~end~

![Evolutionary Divergence of Monocot and DicotEvolutionary Divergence of Monocot and Dicot Methyl-CpG-Binding Domain Proteins1[w] Nathan M. Springer2* and Shawn M. Kaeppler Department](https://img.dokumen.tips/doc/110x75/60f51fc70de7ee6d3f0954a2/evolutionary-divergence-of-monocot-and-evolutionary-divergence-of-monocot-and-dicot.jpg)


![[PPT]Monocot and Eudicot/Dicot Roots - cayugascience - …cayugascience.wikispaces.com/file/view/a+Monocot+and... · Web viewMonocot and Eudicot/Dicot Roots Eudicot/Dicot Root Monocot](https://img.dokumen.tips/doc/110x75/5af45d8b7f8b9a92718d732a/pptmonocot-and-eudicotdicot-roots-cayugascience-monocotandweb-viewmonocot.jpg)