Embed Size (px)
Citation preview
International Journal of Computer Applications (0975 – 8887)
Volume 133 – No.8, January 2016
13
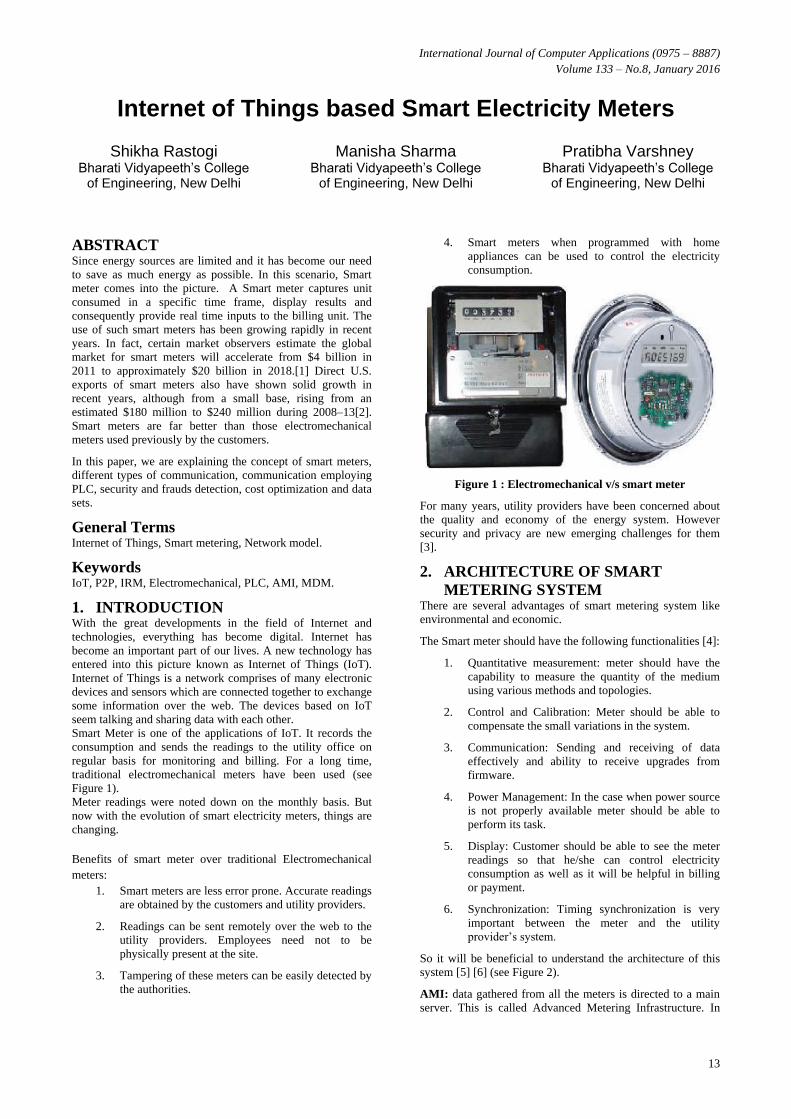
Internet of Things based Smart Electricity Meters
Shikha Rastogi Bharati Vidyapeeth’s College
of Engineering, New Delhi
Manisha Sharma Bharati Vidyapeeth’s College
of Engineering, New Delhi
Pratibha Varshney Bharati Vidyapeeth’s College
of Engineering, New Delhi
ABSTRACT
Since energy sources are limited and it has become our need
to save as much energy as possible. In this scenario, Smart
meter comes into the picture. A Smart meter captures unit
consumed in a specific time frame, display results and
consequently provide real time inputs to the billing unit. The
use of such smart meters has been growing rapidly in recent
years. In fact, certain market observers estimate the global
market for smart meters will accelerate from $4 billion in
2011 to approximately $20 billion in 2018.[1] Direct U.S.
exports of smart meters also have shown solid growth in
recent years, although from a small base, rising from an
estimated $180 million to $240 million during 2008–13[2].
Smart meters are far better than those electromechanical
meters used previously by the customers.
In this paper, we are explaining the concept of smart meters,
different types of communication, communication employing
PLC, security and frauds detection, cost optimization and data
sets.
General Terms
Internet of Things, Smart metering, Network model.
Keywords
IoT, P2P, IRM, Electromechanical, PLC, AMI, MDM.
1. INTRODUCTION With the great developments in the field of Internet and
technologies, everything has become digital. Internet has
become an important part of our lives. A new technology has
entered into this picture known as Internet of Things (IoT).
Internet of Things is a network comprises of many electronic
devices and sensors which are connected together to exchange
some information over the web. The devices based on IoT
seem talking and sharing data with each other.
Smart Meter is one of the applications of IoT. It records the
consumption and sends the readings to the utility office on
regular basis for monitoring and billing. For a long time,
traditional electromechanical meters have been used (see
Figure 1).
Meter readings were noted down on the monthly basis. But
now with the evolution of smart electricity meters, things are
changing.
Benefits of smart meter over traditional Electromechanical
meters:
1. Smart meters are less error prone. Accurate readings
are obtained by the customers and utility providers.
2. Readings can be sent remotely over the web to the
utility providers. Employees need not to be
physically present at the site.
3. Tampering of these meters can be easily detected by
the authorities.
4. Smart meters when programmed with home
appliances can be used to control the electricity
consumption.
Figure 1 : Electromechanical v/s smart meter
For many years, utility providers have been concerned about
the quality and economy of the energy system. However
security and privacy are new emerging challenges for them
[3].
2. ARCHITECTURE OF SMART
METERING SYSTEM There are several advantages of smart metering system like
environmental and economic.
The Smart meter should have the following functionalities [4]:
1. Quantitative measurement: meter should have the
capability to measure the quantity of the medium
using various methods and topologies.
2. Control and Calibration: Meter should be able to
compensate the small variations in the system.
3. Communication: Sending and receiving of data
effectively and ability to receive upgrades from
firmware.
4. Power Management: In the case when power source
is not properly available meter should be able to
perform its task.
5. Display: Customer should be able to see the meter
readings so that he/she can control electricity
consumption as well as it will be helpful in billing
or payment.
6. Synchronization: Timing synchronization is very
important between the meter and the utility
provider’s system.
So it will be beneficial to understand the architecture of this
system [5] [6] (see Figure 2).
AMI: data gathered from all the meters is directed to a main
server. This is called Advanced Metering Infrastructure. In
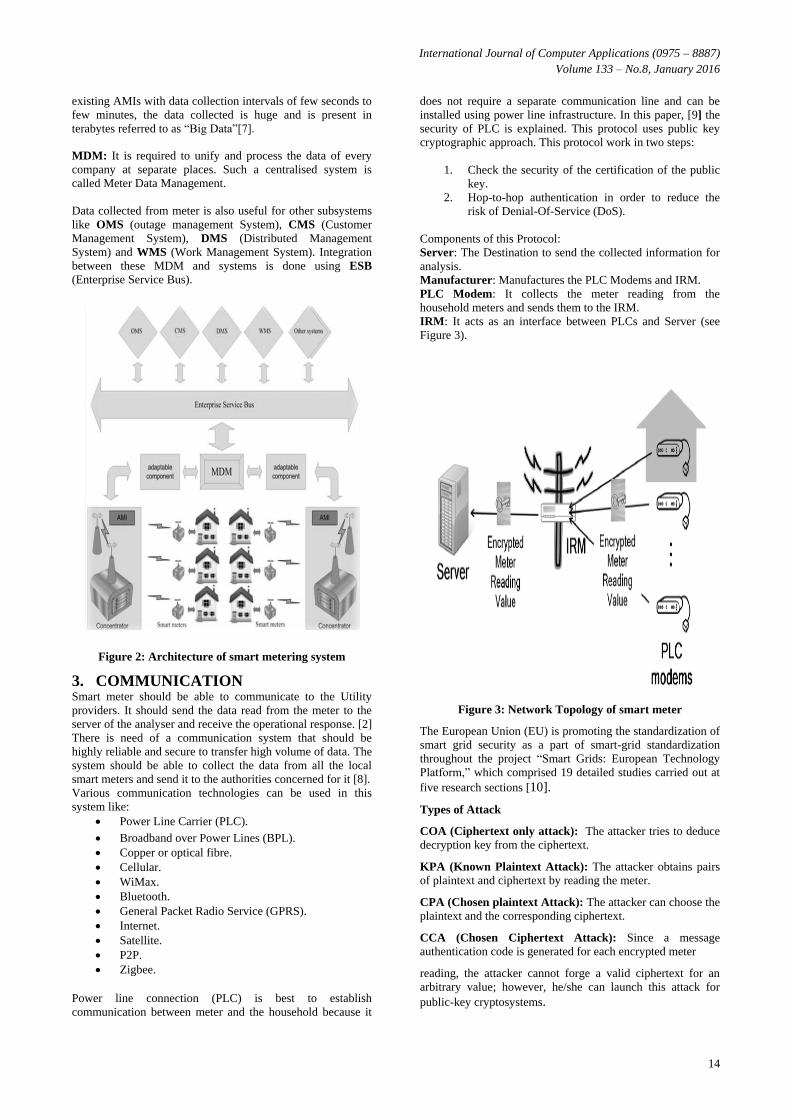
International Journal of Computer Applications (0975 – 8887)
Volume 133 – No.8, January 2016
14
existing AMIs with data collection intervals of few seconds to
few minutes, the data collected is huge and is present in
terabytes referred to as “Big Data”[7].
MDM: It is required to unify and process the data of every
company at separate places. Such a centralised system is
called Meter Data Management.
Data collected from meter is also useful for other subsystems
like OMS (outage management System), CMS (Customer
Management System), DMS (Distributed Management
System) and WMS (Work Management System). Integration
between these MDM and systems is done using ESB
(Enterprise Service Bus).
Figure 2: Architecture of smart metering system
3. COMMUNICATION Smart meter should be able to communicate to the Utility
providers. It should send the data read from the meter to the
server of the analyser and receive the operational response. [2]
There is need of a communication system that should be
highly reliable and secure to transfer high volume of data. The
system should be able to collect the data from all the local
smart meters and send it to the authorities concerned for it [8].
Various communication technologies can be used in this
system like:
Power Line Carrier (PLC).
Broadband over Power Lines (BPL).
Copper or optical fibre.
Cellular.
WiMax.
Bluetooth.
General Packet Radio Service (GPRS).
Internet.
Satellite.
P2P.
Zigbee.
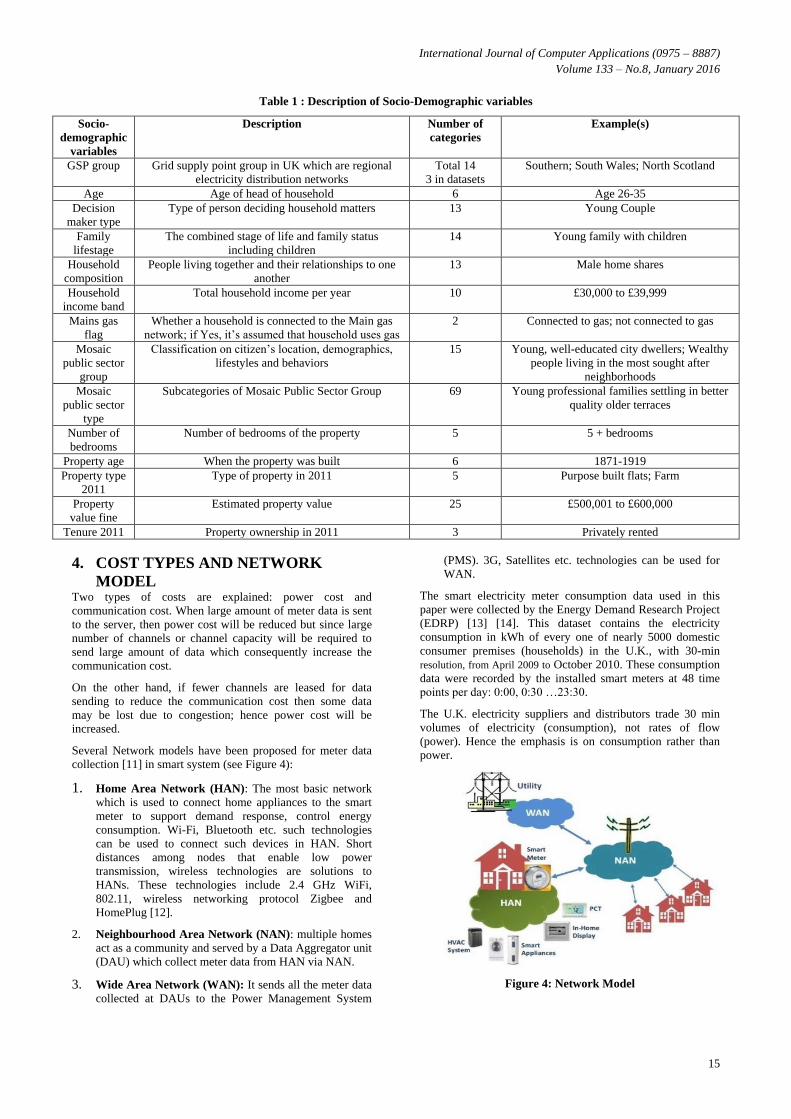
Power line connection (PLC) is best to establish
communication between meter and the household because it
does not require a separate communication line and can be
installed using power line infrastructure. In this paper, [9] the
security of PLC is explained. This protocol uses public key
cryptographic approach. This protocol work in two steps:
1. Check the security of the certification of the public
key.
2. Hop-to-hop authentication in order to reduce the
risk of Denial-Of-Service (DoS).
Components of this Protocol:
Server: The Destination to send the collected information for
analysis.
Manufacturer: Manufactures the PLC Modems and IRM.
PLC Modem: It collects the meter reading from the
household meters and sends them to the IRM.
IRM: It acts as an interface between PLCs and Server (see
Figure 3).
Figure 3: Network Topology of smart meter
The European Union (EU) is promoting the standardization of
smart grid security as a part of smart-grid standardization
throughout the project “Smart Grids: European Technology
Platform,” which comprised 19 detailed studies carried out at
five research sections [10].
Types of Attack
COA (Ciphertext only attack): The attacker tries to deduce
decryption key from the ciphertext.
KPA (Known Plaintext Attack): The attacker obtains pairs
of plaintext and ciphertext by reading the meter.
CPA (Chosen plaintext Attack): The attacker can choose the
plaintext and the corresponding ciphertext.
CCA (Chosen Ciphertext Attack): Since a message
authentication code is generated for each encrypted meter
reading, the attacker cannot forge a valid ciphertext for an
arbitrary value; however, he/she can launch this attack for
public-key cryptosystems.
International Journal of Computer Applications (0975 – 8887)
Volume 133 – No.8, January 2016
15
Table 1 : Description of Socio-Demographic variables
Socio-
demographic
variables
Description Number of
categories
Example(s)
GSP group Grid supply point group in UK which are regional
electricity distribution networks
Total 14
3 in datasets
Southern; South Wales; North Scotland
Age Age of head of household 6 Age 26-35
Decision
maker type
Type of person deciding household matters 13 Young Couple
Family
lifestage
The combined stage of life and family status
including children
14 Young family with children
Household
composition
People living together and their relationships to one
another
13 Male home shares
Household
income band
Total household income per year 10 £30,000 to £39,999
Mains gas
flag
Whether a household is connected to the Main gas
network; if Yes, it’s assumed that household uses gas
2 Connected to gas; not connected to gas
Mosaic
public sector
group
Classification on citizen’s location, demographics,
lifestyles and behaviors
15 Young, well-educated city dwellers; Wealthy
people living in the most sought after
neighborhoods
Mosaic
public sector
type
Subcategories of Mosaic Public Sector Group 69 Young professional families settling in better
quality older terraces
Number of
bedrooms
Number of bedrooms of the property
5 5 + bedrooms
Property age When the property was built 6 1871-1919
Property type
2011
Type of property in 2011 5 Purpose built flats; Farm
Property
value fine
Estimated property value 25 £500,001 to £600,000
Tenure 2011 Property ownership in 2011 3 Privately rented
4. COST TYPES AND NETWORK
MODEL Two types of costs are explained: power cost and
communication cost. When large amount of meter data is sent
to the server, then power cost will be reduced but since large
number of channels or channel capacity will be required to
send large amount of data which consequently increase the
communication cost.
On the other hand, if fewer channels are leased for data
sending to reduce the communication cost then some data
may be lost due to congestion; hence power cost will be
increased.
Several Network models have been proposed for meter data
collection [11] in smart system (see Figure 4):
1. Home Area Network (HAN): The most basic network
which is used to connect home appliances to the smart
meter to support demand response, control energy
consumption. Wi-Fi, Bluetooth etc. such technologies
can be used to connect such devices in HAN. Short
distances among nodes that enable low power
transmission, wireless technologies are solutions to
HANs. These technologies include 2.4 GHz WiFi,
802.11, wireless networking protocol Zigbee and
HomePlug [12].
2. Neighbourhood Area Network (NAN): multiple homes
act as a community and served by a Data Aggregator unit
(DAU) which collect meter data from HAN via NAN.
3. Wide Area Network (WAN): It sends all the meter data
collected at DAUs to the Power Management System
(PMS). 3G, Satellites etc. technologies can be used for
WAN.
The smart electricity meter consumption data used in this
paper were collected by the Energy Demand Research Project
(EDRP) [13] [14]. This dataset contains the electricity
consumption in kWh of every one of nearly 5000 domestic
consumer premises (households) in the U.K., with 30-min
resolution, from April 2009 to October 2010. These consumption
data were recorded by the installed smart meters at 48 time
points per day: 0:00, 0:30 …23:30.
The U.K. electricity suppliers and distributors trade 30 min
volumes of electricity (consumption), not rates of flow
(power). Hence the emphasis is on consumption rather than
power.
Figure 4: Network Model
International Journal of Computer Applications (0975 – 8887)
Volume 133 – No.8, January 2016
16
Some steps taken for the research: [15]
1. Smart meter data is obtained by local energy
provider.
2. Supervisor passes this received data to the analysing
team.
3. The received data contains:
a. Values from day 1 to 30/31 of the month. The
hourly price varies each day.
b. Smart meter consumption data values of some
households.
4. After reading the data, the data is interpreted and
cost, cumulative cost, overall data consumption etc.
fields are calculated.
5. CONCLUSION The 21st century has brought great discoveries and
advancements in the field of technology. These advancements
also brought many challenges and require approaches to
handle these challenges. Smart metering system is one such
approach. In this paper, we explained the basic architecture of
the smart metering system and a case study.
6. ACKNOWLEDGMENTS Our sincere thanks to Mrs. Shikha Rastogi, our teacher for
providing us her valuable guidance in developing this paper.
7. REFERENCES [1] Lisa Alejandro, Caitlin Blair, Laura Blood good ,
Mahnaz Khan ,Martha Lawless, Daniel Meehan, Patrick
Schneider ,Karl Tsuji “GLOBAL MARKET FOR
SMART ELECTRICITY METERS: GOVERNMENT
POLICIES DRIVING STRONG GROWTH” June 2014.
[2] Bagley, Chris. “Elster Work Done in Raleigh Moving to
Mexico.” Triangle Business Journal. January 31, 2013.
[3] Ramyar Rashed Mohassel, Alan Fung, Farah
Mohammadi, Kaamran Raahemifar ”ELECTRICAL
POWER AND ENERGY SYSTEMS” Department of
Electrical and Computer Engineering, Ryerson
University, Toronto, ON M5B 2K3, Canada’.Sannella,
M. J. 1994 Constraint Satisfaction and Debugging for
Interactive User Interfaces. Doctoral Thesis. UMI Order
Number: UMI Order No. GAX95-09398., University of
Washington.
[4] Silicon Laboratories, Inc. Smart metering brings
intelligence and connectivity to utilities, green energy
and natural resource management. Rev.1.0. [accessed
August, 2013].
[5] Lilijana Djukic Petromanjanc, Oliver Momcilovic, Livan
Scepanovic “SUGGESTED ARCHITECTURE OF
SMART METERING SYSTEM”.
[6] VUKMIROVIC S., LUKOVIC S., ERDELJAN A.,
KULIC F., A solution for CIM based integration of
Meter Data Management in Control Center of a power
system, 2010 IEEE Workshop on Environment, Energz
and Structural Monitoring Systems, Toronto, Italy, 9
September 2010.
[7] Deign J, Salazar CM. Data management and analytics for
utilities. FC Business Intelligence Ltd.; 2013.
[8] National Energy Technology Laboratory for the U.S.
Department of Energy. Advanced metering
infrastructure, NETL modern grid strategy; 2008.
[9] Sungwook Kim, Eun Young Kwon, Myungsun Kim,
Jung Hee Cheon, Seong-ho Ju, Yong-hoon Lim, and
Moon-seok Choi “A SECURE SMART METERING-
PROTOCOL OVER POWER LINE
COMMUNICATION”. IEEE Transactions On Power
Delivery, Vol. 26, No. 4, October 2011.
[10] SmartGrids: European Technology Platform. [Online].
Available: http://www.smartgrids.eu
[11] PENG LI (Member, IEEE), SONG GUO (Senior
Member, IEEE), AND ZIXUE CHENG (Member, IEEE)
"Joint Optimization of Electricity and Communication
Cost for Meter Data Collection in Smart Grid"Digital
Object Identier 10.1109/TETC.2013.2273890.
[12] US Department of Energy Communications requirements
of smart grid technologies; October 5, 2010.
[13] Nanlin Jin, Member, IEEE, Peter Flach, Tom Wilcox,
Royston Sellman, Joshua Thumim, and Arno Knobbe
"Subgroup Discovery in Smart Electricity Meter Data"
IEEE TRANSACTIONS ON INDUSTRIAL
INFORMATICS, VOL. 10, NO. 2, MAY 2014.
[14] G. Raw and D. Ross, “Energy demand research project,”
Office of Gas Elect. Markets, Tech. Rep. 60163857,
2011.
[15] Praveen Vadda, Sreerama Murthy Seelam "Smart
Metering for Smart Electricity Consumption" School of
Computing, Blekinge Institute of Technology, 37179
Karlskrona, Sweden May 2013.
IJCATM : www.ijcaonline.org


![Smartgrid Smart-Metering V2 [Kompatibilitätsmodus] file28.11.2014 Smart Metering Smart-Metering 1von 18 Energiepolitischen Ziele der Bundesregierung Reduktion des Stromverbrauchs](https://img.dokumen.tips/doc/110x75/5ce10d2288c993700d8b971c/smartgrid-smart-metering-v2-kompatibilitaetsmodus-smart-metering-smart-metering.jpg)