Embed Size (px)
Citation preview

International Institute for Applied Systems AnalysisSchlossplatz 1 • A-2361 Laxenburg • Austria
Telephone: (+43 2236) 807 342 • Fax: (+43 2236) 71313E-mail: [email protected] • Internet: www.iiasa.ac.at
Interim Reports on work of the International Institute for Applied Systems Analysis receive onlylimited review. Views or opinions expressed herein do not necessarily represent those of theInstitute, its National Member Organizations, or other organizations supporting the work.
Interim Report IR-00-51
Estimating Costs for Controlling Emissions of Volatile OrganicCompounds (VOC) from Stationary Sources in Europe
Zbigniew Klimont ([email protected]),Markus Amann ([email protected]),Janusz Cofala ([email protected])
Approved by
Markus Amann ([email protected])Leader, Transboundary Air Pollution
August 1, 2000

ii

iii
Contents
1 INTRODUCTION.............................................................................................................................1
1.1 THE OBJECTIVES OF AN EMISSION CONTROL COST MODULE WITHIN THE FRAMEWORK OF AN
INTEGRATED ASSESSMENT MODEL...........................................................................................................1
2 THE STRUCTURE OF THE VOC MODULE ..............................................................................3
2.1 AGGREGATION OF EMISSION SOURCES............................................................................................32.2 ACTIVITY UNITS AND EMISSION FACTORS.......................................................................................6
2.2.1 Activities Related to the Use of Fossil Fuels.........................................................................72.2.2 Solvent Use ...........................................................................................................................82.2.3 Organic and Inorganic Chemical Industry.........................................................................102.2.4 Miscellaneous Sources........................................................................................................10
2.3 FORECAST OF ACTIVITY LEVELS ...................................................................................................11
3 EMISSION CONTROL OPTIONS...............................................................................................13
3.1 GASOLINE EVAPORATION..............................................................................................................143.2 SOLVENT USE ...............................................................................................................................15
3.2.1 Surface Cleaning ................................................................................................................153.2.1.1 Dry Cleaning ................................................................................................................................ 153.2.1.2 Degreasing ................................................................................................................................... 16
3.2.2 Treatment of Vehicles .........................................................................................................183.2.3 Use of Solvents in the Domestic Sector...............................................................................183.2.4 Non-industrial Use of Paints ..............................................................................................19
3.2.4.1 Architectural Use of Paints .......................................................................................................... 193.2.4.2 Domestic Use of Paints ................................................................................................................ 20
3.2.5 Industrial Use of Paints ......................................................................................................203.2.5.1 Automobile Production ................................................................................................................ 203.2.5.2 Vehicle Refinishing...................................................................................................................... 213.2.5.3 Other Industrial Use of Paints ...................................................................................................... 22
3.2.6 Solvent Use in Chemical Industry.......................................................................................233.2.6.1 Products Incorporating Solvents .................................................................................................. 243.2.6.2 Products Not Incorporating Solvents (Excluding Pharmaceuticals) ............................................ 243.2.6.3 Pharmaceutical Industry.............................................................................................................. 25
3.2.7 Printing Industry.................................................................................................................263.2.7.1 Flexography and Rotogravure in Packaging ................................................................................ 263.2.7.2 Rotogravure in Publication .......................................................................................................... 273.2.7.3 Screen Printing............................................................................................................................. 273.2.7.4 Offset Printing.............................................................................................................................. 28
3.2.8 Other Use of Solvents in Industry .......................................................................................293.2.8.1 Application of Glues and Adhesives ............................................................................................ 293.2.8.2 Preservation of Wood................................................................................................................... 303.2.8.3 Other Industrial Use of Solvents .................................................................................................. 30
3.3 CHEMICAL INDUSTRY....................................................................................................................313.3.1 Production Processes in Inorganic Chemical Industry ......................................................313.3.2 Production Processes in Organic Chemical Industry.........................................................323.3.3 Storage and Handling of Chemical Products .....................................................................32
3.4 OIL AND GAS INDUSTRY................................................................................................................333.4.1 Fuel Extraction and Distribution........................................................................................33

iv
3.4.2 Refineries (Excluding Storage of Products)........................................................................343.4.3 Gasoline Distribution .........................................................................................................35
3.4.3.1 Transport and Depots ................................................................................................................... 353.4.3.2 Service Stations............................................................................................................................ 35
3.5 STATIONARY COMBUSTION ...........................................................................................................363.5.1 Commercial and Residential Combustion ..........................................................................37
3.6 TRANSPORTATION.........................................................................................................................373.6.1 Two-stroke Gasoline Engines .............................................................................................383.6.2 Shipping and Air Traffic .....................................................................................................38
3.7 MISCELLANEOUS SOURCES ...........................................................................................................393.7.1 Food and Drink industry ....................................................................................................393.7.2 Other Industrial Sources.....................................................................................................393.7.3 Remaining Sources .............................................................................................................40
3.7.3.1 Stubble Burning and Other Agricultural Waste ........................................................................... 403.7.3.2 Waste Treatment and Disposal..................................................................................................... 40
3.8 SUMMARY OF CONTROL OPTIONS’ CATEGORIES AND THEIR EFFICIENCIES...................................41
4 COST CALCULATION.................................................................................................................43
4.1 COST COMPONENTS ......................................................................................................................434.1.1 Investments .........................................................................................................................444.1.2 Fixed Operating Costs ........................................................................................................444.1.3 Variable Operating Costs ...................................................................................................45
4.2 CONSTRUCTING A COST CURVE ....................................................................................................454.3 SUMMARY OF ABATEMENT COSTS FOR THE MAJOR CONTROL OPTIONS .......................................48
5 REFERENCES................................................................................................................................51
6 ANNEX 1 .........................................................................................................................................57
7 ANNEX 2 .........................................................................................................................................67

v
Acknowledgments
The authors wish to express their thanks to Neil Passant and Mike Wenborn (AEATechnology, Culham, UK), Bernd Schärer (Umweltbundesamt, Berlin), Chris Bruijnes(Ministry of Housing, Spatial Planning and the Environment, Den Haag, TheNetherlands), Jeanette Beck (National Institute for Public Health and the Environment,Bilthoven, The Netherlands), Jürg Baumann (Federal Office of Environment, Forestsand Landscape, Bern, Switzerland), and Rachel Warren (Imperial College, London, UK)for their constructive contributions and thoughtful comments on the draft versions ofthis paper, and the Institute for Industrial Production, University of Karlsruhe, Germany,for providing information on emission control technologies.

vi

1
Estimating Costs for Controlling Emissions of Volatile OrganicCompounds (VOC) from Stationary Sources in Europe
Zbigniew Klimont, Markus Amann, Janusz Cofala
1 IntroductionIntegrated assessment models are tools to combine information and databases on theeconomic, physical and environmental aspects relevant for the design of strategies forreducing the impacts of air pollution. The Regional Air Pollution INformation andSimulation (RAINS) model developed at the International Institute for Applied SystemsAnalysis (IIASA, Laxenburg, Austria) provides a consistent framework for the analysisof emission reduction strategies, focusing at acidification, eutrophication andtropospheric ozone. RAINS comprises modules for emission generation (with databaseson current and future economic activities, energy consumption levels, animal livestocknumbers, fuel characteristics, etc.), for emission control options and costs, foratmospheric dispersion of pollutants and for environmental sensitivities (i.e., databaseson critical loads). In order to create a consistent and comprehensive picture of theoptions for simultaneously addressing the three environmental problems (acidification,eutrophication and tropospheric ozone), the model considers emissions of sulfur dioxide(SO2), nitrogen oxides (NOx), ammonia (NH3) and the volatile organic compounds(VOC). A schematic diagram of the RAINS model is displayed in Figure 1.
This paper provides documentation of the RAINS module that describes emissions,control potential and control costs of volatile organic compounds (VOC) from stationarysources. Section 2 introduces the sectoral structure of the VOC emission module forstationary and mobile sources; after this a brief characteristic of the various controlmeasures applicable to the individual emission sources is provided. Section 4 reviewsthe methodology for cost calculation for stationary sources.
1.1 The Objectives of an Emission Control Cost Module within theFramework of an Integrated Assessment Model
A central objective of integrated assessment models is the assistance in the cost-effective allocation of emission reduction measures across different pollutants, differentcountries and different economic sectors. Obviously, this task requires consistentinformation about the costs of emission control at the individual sources, and it is thecentral objective of this cost module to provide such information.

2
The optimal cross-country allocation of emission control measures is cruciallyinfluenced by differences in emission control costs for the individual emission sources.It is therefore of utmost importance to systematically identify the factors leading todifferences in emission control costs among countries, economic sectors and pollutants.Such differences are usually caused, inter alia, by variations in the composition of thevarious emission sources, the state of technological development and the extent towhich emission control measures are already applied.
In order to systematically capture these differences across Europe, a methodology hasbeen developed which estimates the emission control costs of standard technologiesunder the specific conditions characteristic for the various European countries. Based onthe basic assumption of the general availability of control technologies with equaltechnical properties and costs, a number of country-specific circumstances (level oftechnological advancement, installation size distribution, labor costs, etc.) are used toestimate the costs for the actual operation of pollution control equipment.
The results of this economic evaluation of the available VOC control options will notpredict costs for specific plants in individual countries, but will enable a generalcomparative analysis of different pollution control costs for different countries, sourcecategories and pollutants.
Energycombustion
Solvents, fuels,industry
Transport
Agriculture
SO2 emissions
NOx emissions
VOC emissions
NH3 emissions
SO2 control& costs
NOx/VOC control&costs
NH3 control& costs
NOx control& costs
Critical loadsf. acidification
Critical loads f. eutrophication
Critical levelsfor ozone
VOC control& costs
O3 formation
NH3 dispersion
S dispersion
NOx dispersion
Economicactivities
Emission controlpolicies
Emissioncontrol costs
Environmentalimpacts
Populationexposure
The RAINS Model of Acidification and Tropospheric Ozone
Figure 1: Schematic diagram of RAINS model

3
2 The Structure of the VOC ModuleThis section reviews three aspects important for modeling future costs for controllingVOC emissions across Europe. A methodological key question relates to the appropriatelevel of aggregation at which the international analysis is carried out best. Afterpresenting the main criteria for determining the appropriate level, Section 2.1 introducesthe sectoral aggregation level selected for the RAINS VOC module. Having decidedabout the aggregation level, the next question arises about the selection of meaningfulactivity levels, the availability of representative emission factors (Section 2.2), and thepossibilities for forecasting their future development (Section 2.3).
2.1 Aggregation of Emission Sources
Emissions of VOC are released from a large variety of sources with significant technicaland economic differences. Conventional emission inventory systems, such as theCORINAIR inventory of the European Environmental Agency, distinguish more than300 different processes causing VOC emissions.
In the ideal case, the assessment of the potential and costs for reducing emissions shouldbe carried out at the very detailed process level. In reality, however, the necessity toassess abatement costs for all countries in Europe as well as the focus on emission levelsin 10 to 20 years from now restrict the level of detail which can be maintained. Whiletechnical details can be best reflected for individual (reference) processes, the accuracyof estimates on an aggregated national level for future years will be seriously hamperedby a general lack of reliable projections of many of these process-related parameters(such as future activity rates, autonomous technological progress, etc.). For an integratedassessment model focusing on the pan-European scale it is therefore imperative to aimat a reasonable balance between the level of technical detail and the availability ofmeaningful data describing the future development and to restrict itself to a manageablenumber of sources categories and abatement options.
For the RAINS VOC module, an attempt was made to aggregate the emission producingprocesses into a reasonable number of groups with similar technical and economicproperties. Considering the intended purposes of integrated assessment, the majorcriteria for an aggregation were:
� Importance of the emission source. It was decided to target source categories with acontribution of at least 0.5 to 2 percent to the total anthropogenic emissions in aparticular country.
� Possibility to define uniform activity rates and emission factors.
� Possibility of constructing plausible forecasts of future activity levels. Since, in theRAINS model, the emphasis of the cost estimates is on future years, it is crucial thatreasonable projections of the activity rates could be constructed or derived.
� Availability and applicability of ‘similar’ control technologies.

4
� Availability of relevant data. Finally, the successful implementation of the modulewill only be possible if the required data are available. As far as possible, emissionrelated data should be compatible with the CORINAIR emission inventory.
Table 1 and Table 2 present the source structure selected for the RAINS VOC moduleand the contribution of the source categories to the total European NMVOC emissionsin 1990. This statistic is derived from the CORINAR’90 emission inventory. Note thatnatural sources as well as emissions from Cultures with and without fertilizers(CORINAIR’90 SNAP1 codes 100100 and 100200) are excluded. The RAINS sourcestructure distinguishes 10 emission categories for mobile and 34 groups for stationarysources.
The results presented in Table 1 are derived from the CORINAIR’90 inventory. The‘secondary sectors’ given in this table do not show all emission categories considered inthe RAINS model, however. Since one of the objectives of RAINS is to evaluate costsof emission control, the model sectoral structure has been adjusted accordingly, forexample, by distinguishing between four and two-stroke gasoline engines as well asbetween medium and large size vessels for shipping. A detailed description of thetransport related sectors in the model is presented in Cofala and Syri, 1998.
Similarly, Table 2 presents the aggregation scheme for stationary sources with theEuropean emissions derived from CORINAIR’90.Although not all European countriesreported data to the CORINAIR system (28 in total), the conclusions given below aboutthe importance of major emission categories will not change.
Table 1: Sectors included in RAINS VOC module2 for mobile sources and theircontributions to total European NMVOC emissions
Sectors Emissions Share in CountriesPrimary Secondary [kt/year] total [%] reporting
Road Light duty trucks 382 2.3 26Transport Passenger cars 3466 20.8 27
Gasoline evaporation 1550 9.3 25Trucks and busses 665 4.0 27Motorcycles and mopeds 701 4.2 26
Other Air traffic (LTO3) 71 0.4 23Transport Off-road vehicles 419 2.5 20
Railways 33 0.2 23Ships 155 0.9 20
In 1990, the main contributions to European VOC emissions came from transport (>40percent) and solvent use (~30 percent). Looking at the types of activities, about 50percent of European VOC emissions were related to the production, distribution and use
1 Selected Nomenclature for Air Pollution (SNAP).
2 This table is derived from CORINAIR’90 database. Complete relation between secondary sectors
distinguished in this table and CORINAIR’90 SNAP Code is given in Annex 1.
3 Landing and Take-Off (LTO)

5
of liquid fuels. Another 30 percent were caused by the use of solvents in various sectors,mainly surface coating (~11 percent) and other use in industry (~14 percent). Theremaining 15 percent originated from stationary combustion, chemical industry andfrom miscellaneous sources.
Table 2: Sectors distinguished in RAINS VOC module4 for stationary sources and theircontributions to total European NMVOC emissions
Sectors Emissions5 Share in CountriesPrimary Secondary [kt/year] total [%] reporting
Solvent Use Dry cleaning 125 0.7 22Metal degreasing 400 2.4 20Treatment of vehicles 74 0.4 10Domestic solvent use (excluding paint) 492 2.9 12Architectural painting 500 3.0 20Domestic use of paints 250 1.5 20Manufacture of automobiles 200 1.2 19Other industrial use of paints and Vehicle refinishing
973 5.8 25
Products incorporating solvents 267 1.6 24Products not incorporating solvents 291 1.7 26Pharmaceutical industry 115 0.7 16Printing industry6 278 1.7 17Application of glues & adhesives inindustry
187 1.1 16
Preservation of wood 136 0.8 10Other industrial use of solvents 632 3.8 20
Chemical Inorganic chemical industry 117 0.7 10Industry Organic chemical industry 400 2.4 21Refineries Refineries – processes 155 0.9 22Fuel Extractionand
Gaseous fuels: extraction, loading,distribution
258 1.5 16
Distribution Liquid fuels: extraction, loading,distribution
519 3.1 16
Gasoline Service stations 403 2.4 24Distribution Refineries (storage), transport, depots 288 1.7 22StationaryCombustion
Public power, co-generation, districtheating
55 0.3 27
Industrial combustion 154 0.9 27Commercial and residential combustion 989 5.9 26
Miscellaneous Stubble burning & other agricult. waste 435 2.6 13Food and drink industry 279 1.7 23Other industrial sources 176 1.1 25Waste treatment and disposal 105 0.6 23
4 This table is derived from CORINAIR’90 database. The complete relation between secondary sectors
distinguished in this table and the CORINAIR’90 SNAP code is given in Annex 1.5 Numbers printed in italic indicate that the estimates were derived from CORINAIR categories with someadjustments by the authors, e.g., splitting some of the emissions reported under SNAP level 2.
6 Includes separate categories for packaging, publishing, offset, and screen printing.

6
2.2 Activity Units and Emission Factors
The basic concept of the RAINS emission calculation is to estimate emissions, for eachof the source categories distinguished in the model, as a product of the activity rate, the(unabated) emission factor and the removal efficiency of applied emission controldevices (taking into account the penetration of emission controls).
XefAVOCEn
nmlknmlknmlmlkmlkml
k ∑∑∑ ××−××= ,,,,,,,,,,,, )1( )( αη (1)
where
k,l,m,n country/region, sector, fuel, abatement technology;E(VOC) emissions of NMVOC;A activity rate;ef (hypothetical) unabated emission factor ;η removal efficiency;α maximum application rate ( further referred to as applicability);X actual application rate of control technology n.
It is important to carefully define appropriate activity units that are detailed enough toprovide meaningful surrogate indicators for the actual operations of a variety of differenttechnical processes, and aggregated enough to allow a meaningful projection of theirfuture development with a reasonable set of general assumptions. As a general approach,RAINS uses country-specific emission factors derived from the information provided inthe CORINAIR’90 inventory and in other national studies and emission inventories (e.g.,Passant, 1993; SHI, 1994; McGettigan, 1993). Only in cases where no country-specificinformation is available, default emission factors derived from several internationalstudies are used (e.g., EEA, 1996; EC, 1994; BUWAL, 1995; IFARE, 1998; EPA, 1994;etc.).
Equation (1) represents the general formula for calculating emissions. However, asexplained later in the text, the RAINS sectors often contain a number of VOC emittingprocesses. It is often the case that for such aggregated sectors (l) some emission controloptions (n) are not necessarily applicable to all processes (emission sources) that arerepresented by the activity (A).
Note that in the calculation routine, for a given fraction of activity (A), the controloptions (n) are exclusive, i.e., that only one of the available control options can beapplied at the same time. If in a given sector several emission control options can beapplied simultaneously, then in the model a new control option is defined whichrepresents the combined application of several single control options. In such a case,removal efficiency (η) and applicability (α) for this new option are determinedreflecting the sector- and technology specific interactions of the single options.

7
2.2.1 Activities Related to the Use of Fossil Fuels
For some of the RAINS sectors it seems plausible to relate the activity levels to theconsumption of particular fuels, for which future projections are available as part of theenergy scenarios used as exogenous input to the model. This applies to stationarycombustion, refineries, gasoline distribution, gasoline evaporation from cars, and theextraction and loading of liquid and gaseous fuels (see Table 3).
Table 3: Activity units and default (unabated) emission factors for fuel-related sourcecategories
Sector Activity unit Default emission factorUnit Unit
Stationary combustion7 Use of hard and brown coal- existing power plants, industry- new power plants- residentialUse of heavy fuel- existing power plants, industry- new power plantsUse of light fuel oilUse of gasolineUse of natural gas- power plants, industry- residentialUse of biomass- power plants, industry- residential
PJPJPJ
PJPJPJPJ
PJPJ
PJPJ
0.01500.00150.2000
0.0050.0030.0030.002
0.0040.005
0.0480.600
kt/PJkt/PJkt/PJ
kt/PJkt/PJkt/PJkt/PJ
kt/PJkt/PJ
kt/PJkt/PJ
Refineries - process Input of crude oil Mt 2.34 kt/MtGasoline evaporation Use of gasoline PJ 0.1 - 0.58 kt/PJService stations Use of gasoline PJ 0.0643 kt/PJTransport and depots Use of gasoline PJ 0.07 kt/PJ
Use of diesel PJ 0.0012 kt/PJAir traffic (LTO) Emissions of NMVOC kt 1.0 kt/kt2-stroke gasoline engines Use of gasoline (mopeds)
Use of gasoline (off-road)PJPJ
8.010.0
kt/PJkt/PJ
Shipping Use of diesel and residual oil PJ 0.06 kt/PJExtraction, loading anddistribution of fossil fuels
Emissions of NMVOC kt 1.0 kt/kt
For reasons of simplicity, the activity rates for ‘extraction, loading and distribution offossil fuels’ relate to the emissions reported in the CORINAIR’90 inventory, assumingan uncontrolled situation. A possible refinement would be to distinguish individualemission generating activities (e.g., off-shore production of oil and/or natural gas, etc.)separately, if this turns out to be of crucial importance for the overall calculation results.
7 For the majority of countries country-specific data was available.
8 Values are determined based on the climatic zone, the shares of carburetor and direct injection enginesas well as assumptions about driving habits.

8
2.2.2 Solvent Use
Solvents are emitted by a large variety of activities, including the production and use ofpaints, cosmetics, rubber, chemicals, etc., and cleaning in industry and households.Since it is difficult to derive, at least for some of these specific activities, reliableprojections for their future development, a set of surrogate indicators have beenemployed. Such surrogate activity rates include the use of solvents or of solvent-containing products, the amount of manufactured goods, the area coated, other processinputs, value added in a specific industry, or even simply the population in a country(see Table 4 for details).
Nearly half of the NMVOC emissions from solvent use arises from the consumption ofpaint in industry, the commercial and domestic sector (>14 percent of total emissions).
For the architectural and domestic use of paint, many emission inventories use emissionfactors related to per capita or per kilogram paint applied (assuming a certain content ofsolvents), depending on the available information. RAINS uses paint consumption asthe activity unit for these activities as well as for vehicle refinishing and other industrialpainting. The corresponding emission factors assume a certain (country-specific)average solvent content of the paint and a particular application method (CORINAIR’90database; EEA, 1996; Hein et al., 1994; Passant, 1993; etc.).
For the use of paint in automobile production the number of vehicles produced is usedas activity rate. The emission factor is based on typical values of uncontrolledapplication taking into account country-specific production profiles and requirementsfor emission controls (EEA, 1996; Adler, 1993; Hein et al., 1994; IFARE, 1998;CITEPA, 1994).
For describing the activity levels for various industrial sectors (metal degreasing,pharmaceuticals production, preservation of wood) RAINS uses the consumption ofsolvents of these processes. Alternatively, for wood preservation, the volume of woodtreated can be used. Statistics on industrial roundwood are available from FAO (FAO,1997) but if country-specific information about the share of wood treated is notavailable, appropriate assumptions need to be made. For all printing categoriesrecognized in the model (packaging, publishing, offset, screen printing) consumption ofink is used as activity level.
Another important source of NMVOC emissions is the domestic use of solvents (otherthan paints). This category comprises a wide range of articles used in households, e.g.,household and personal care products, adhesives and glues as well as automotivemaintenance products. Due to the absence of reliable detailed information, RAINSapplies similar to many other emission inventories the simple approach based on per-capita emission factors. These emission factors were derived from informationcontained in the CORINAIR’90 inventory, the Emission Inventory Guidebook (EEA,1996), Passant and Vincent (1998) as well as Umweltministerium Baden-Württemberg(1993).
Lack of detailed information leads also to the use of simple per capita relations toestimate the emissions from the treatment of vehicles (de-waxing and undersealtreatment). Alternatively, data on new and total vehicle registrations can be used

9
assuming certain practices, i.e., a percentage of cars that undergo underseal treatment,etc. (compare Table 4).
Table 4: Activity units and default (unabated) emission factors for solvent useSector Activity Default emission factor
Unit UnitPaint application Architectural Paint used kt 0.30 kt/kt Domestic Paint used kt 0.41 kt/kt Vehicle refinishing Paint used kt 0.85/0.46 * kt/kt Automobile manufacturing Vehicles manufactured kveh No default value9 kt/kveh Other industrial Paint used kt 0.73 kt/ktDegreasing Solvent used kt 0.90/0.72 * kt/ktPrinting Packaging Ink used kt 2.1/0.42 * kt/kt Publishing Ink used kt 1.5/0.18 * kt/kt Offset printing Ink used kt 0.72/0.45 * kt/kt Screen printing Ink used kt 0.40/0.36 * kt/ktPreservation of wood Solvent used
Wood treatedktm3
0.73/0.44 *5 - 2010
kt/ktkg/m3
Pharmaceuticals Solvent used kt 0.15 kt/ktDomestic use of solvents Population mln 2.0/1.011 kg/capVehicle treatment Population mln No default value12 kg/capDry cleaning Textiles cleaned kt 0.125/0.05 * kt/ktProducts incorporatingsolvents (e.g., paint, inks)
Production kt 0.02513 kt/kt
Products not incorporatingsolvents (e.g., rubber)
Emission of NMVOC kt 1.0 kt/kt
Application of glues andadhesives in industry
Emission of NMVOC kt 1.0 kt/kt
Other industrial use of Emission of NMVOC kt 1.0 kt/kt
(*) - Value for existing and new installations, respectively.
Although some national inventories calculate emissions from dry-cleaning on the basisof per capita emission factors, the significant differences in lifestyles over Europesuggest the use of the amount of textiles cleaned per year as the general explanatoryvariable (activity rate). Thereby, alternative scenarios could include assumptions about
9 Depends on the proportion of passenger cars and trucks manufactured in a given country/region(typically, the value varies between 10-30 kg/vehicle).
10 Depends on the assumption about the proportion of wood preserved with creosote, organic solventsand water-based solvents as well as on the preservation method used.
11 If no country-specific information available, value for Western and Eastern Europe, respectively.
12 Per-capita factors can be estimated using information about car registration (new and total) andassuming a percentage of cars undergoing underseal treatment (emission factor 2.7 kg/vehicle) anddewaxing (default emission factor 3 kg/vehicle).
13 If information on production of paint, inks, etc. is available then this factor can be adjusted to take intoaccount different shares of products (typically the emission factor will vary between 15 and 40 kg/t ofproduct).

10
changes in lifestyles over time in different European countries. As far as possible,statistical data about the amount of textiles cleaned have been derived from theCORINAIR’90 inventory. For countries where this information was not availableassumptions about the per-capita demand for textiles cleaned were made.
For calculating VOC emissions from the production of paint and glues the amount ofmanufactured product is used as the explanatory variable.
For other industrial activities (production of rubber and inks, application of glues andadhesives, solvent use in the textile-, leather- and other industries) the data availabilityshows great differences over the various European countries and the relativecontribution of the individual activities is often unknown. Although in some instancesmore detailed information is available, it was decided, in the interest of maintaininginternational consistency, to simply use the (country-specific) average emission factorsreported for these activities for 1990.
2.2.3 Organic and Inorganic Chemical Industry
The manufacturing, storage and handling of more than 20 products in the organicchemical industry (as recognized in CORINAIR'90 inventory, see Annex 1 for details)contributes about 2.4 percent to total European NMVOC emissions. Another 0.7 percentarise from production processes in inorganic chemical industry. In the context of a pan-European analysis it does not seem worthwhile to distinguish all the individualprocesses, but to treat them on an aggregated level instead. A problem arises, however,when determining the appropriate emission factor related to the aggregated activity levelfor these processes. The relative shares of these activities vary greatly over Europe andthe identification of a single representative activity seems problematic. It was thereforedecided to represent the differences by using emissions, reported for 1990, as theactivity rate and let them change over time with different economic development.Additionally, for organic chemical industry, storage of products is recognized as aseparate category, since the control options are distinctly different from the ones appliedfor the process part.
Table 5: Activity units and default emission factors for the chemical industrySector Activity Default emission factor
Unit UnitOrganic chemical industry Emissions of NMVOC kt 1.0 kt/ktInorganic chemical industry Emissions of NMVOC kt 1.0 kt/kt
2.2.4 Miscellaneous Sources
The source categories discussed in previous sections leave out a number of ratherdifferent activities responsible for more than one million tons of NMVOC emissions in1990 in the whole of Europe. They comprise a wide spectrum of economic activitiesranging from agriculture and food industry to waste treatment, road paving with asphalt,and heavy industry (coke oven, iron and steel, pulp and paper, etc.). At this stageRAINS uses the 1990 emissions of NMVOC as explanatory variable for most of thesectors.

11
The only exception is the food and drink industry. In most countries, the majority ofemissions from this sector originate from bread manufacture; only in few cases spiritsproduction plays an important role. Therefore, it seems both plausible and feasible touse per capita emission factors with population as the activity levels. The defaultemission factor presented in Table 6 refers to the ‘typical’ situation, where about 80percent of the emissions are caused by bread manufacture.
Table 6: Activity units and default emission factors for miscellaneous sourcesSector Activity Default emission factor
Unit UnitFood and drink industry Population mln 0.3 kg/capStubble burning Emissions of NMVOC kt 1.0 kt/ktOther industrial sources Emissions of NMVOC kt 1.0 kt/ktWaste treatment and disposal Emissions of NMVOC kt 1.0 kt/kt
2.3 Forecast of Activity Levels
A central objective of the RAINS model is the estimate of emission control costs with atime perspective of 15 to 20 years into the future. Future costs in a country will beobviously determined by the costs for applying certain emission control technologies orreduction measures. Another, often more important, factor is the future rate of emissiongenerating activities in the country, such as industrial production, fuel consumption ortransport services. RAINS captures this aspect by modifying the present activity levelsaccording to exogeneously provided projections, e.g., for the year 2010. As a matter offact, reliable and consistent projections of future activity rates at the process level arehardly available; most economic long-term forecasts restrict themselves to a ratheraggregated level of economic activities and do rarely specify even the development ofthe main economic sectors. Therefore, a key question for modelling future abatementcosts is which generally available long-term forecasts (such as energy projections,sectoral GDP development, etc.) could be used to derive the temporal changes of theactivity rates employed for the emission calculation.
At present, RAINS applies four concepts for constructing forecasts of sectoral activityrates:
• The change of the activity rates for processing, distribution and combustion of fossilfuels is linked to changes in fuel consumption provided by the energy scenario inputto RAINS. Internal consistency with the energy scenario used for calculating SO2 andNOx emissions is maintained.
• Some other activity rates (dry cleaning, use of solvents in households, vehicletreatment, food and drink industry) are assumed proportional to populationdevelopment (possibly taking also into account changes in GDP per capita whichaffects lifestyles).
• The temporal development of a number of industrial activities (e.g., degreasing, paintuse, solvent use in chemical industry, printing, other industrial solvent use) is relatedto changes in the sectoral gross domestic product (often supplied with the energyscenario). In many cases, statistics suggest that these activities grow slower than the

12
value-added. To reflect this trend, sector-specific elasticities derived from statisticshave been applied.
• In absence of more information the activity rates for less important emission sectorsare kept constant. This was typically done (i) for sectors where current emissionsestimates are very uncertain (e.g., agriculture, waste treatment), (ii) where it isdifficult to identify meaningful relations with other economic activities, and (iii) forsectors where the increase in activity rates are expected to be offset by emissionreductions induced by autonomous technical improvements.

13
3 Emission Control OptionsThere is ample national and international literature documenting the application ofavailable options for reducing emissions of VOC. Comprehensive summaries can befound in Jourdan and Rentz, 1994; EPA, 1994; OECD,1990; EEC, 1990; Allemand etal., 1990; ERM, 1996; Bouscaren et al., 1990; Breihofer et al., 1991; Hein et al., 1994;Rentz et al., 1993; KWS 2000, 1996; CONCAWE, 1987-1993, IFARE, 1998).
Commonly employed methods of reducing VOC emissions from stationary sources canbe grouped into four basic classes:
• Basic emission management techniques, i.e., modification of the productionprocess, and/or improvement of the management practices (good housekeeping, leakmonitoring and repair programs, etc.).
• Reduction of storage losses from tanks including internal floating covers andsecondary seals.
• Solvent substitution (use of low solvent or solvent free products).
• Add-on techniques, such as thermal or catalytic incineration, adsorption, absorption,condensation/ refrigeration, biooxidation, and vapor recovery systems.
It is important to realize, for designing a VOC control strategy, that the choice of theappropriate measure will depend not only on costs or the availability of a certaintechnology, but also on the applicability and desirability. Unfortunately, it is difficult toaccurately estimate the application potential (the ‘applicability’), particularly since itdepends on a number of site-specific characteristics. There are a number of reasons forsignificant differences in the application potential of a given emission control option:
• In many cases the applicability will depend more on the characteristics of a specificpoint of emissions (e.g., drying oven) rather than on the source category (e.g.,automobile manufacturing/ surface coating).
• Some sectors (e.g., refineries) include several processes that release VOC emissionsand the applicability of a selected technology depends on the specific process.
• The size distribution of the installations in a given source category.
• Reformulated products may not be available for all applications within a givensource category or substitutes will not be accepted due to the resulting decrease inthe quality of finish.
• Variable parameters of emission streams, e.g., too low or too high concentrations ofVOC in the stream gas or too low or too high flow rates limiting the application ofparticular technique.
• Mixture of solvents used in the process, making it impossible to apply some of theadd-on technologies.
Another important factor concerning the applicability of a certain measure is thedistinction between existing and new sources, i.e., whether an emission control measurewill be retrofitted to an existing installation or integrated in the course of constructing a

14
&$5B(9$3
new (production) unit. Since the control of VOC emissions is currently a subject ofgeneral concern in Europe, it is assumed that some of the ‘integrated’ control options(especially process changes and substitution of raw materials) will become standard inthe near future and will slowly replace existing production processes with higher VOCemissions. It is further assumed that some of these ‘integrated’ control techniques,which form part of the new production technology, can be introduced at no extra cost.As a practical example, open circuit machines are currently used in many countries fordry cleaning. These machines, which are considered in RAINS as the ‘no-control’reference case, are now gradually replaced by closed circuit machines with internalrefrigerated condensers with lower VOC emissions. RAINS assumes that thisreplacement occurs at no extra costs attributable to VOC reduction.
Furthermore, the already installed control measures have an influence on theapplicability of the remaining options. RAINS takes this into account by considering the‘initial controls’, i.e., the control measures implemented in the base year.
3.1 Gasoline Evaporation
Evaporative emissions of NMVOC from gasoline powered vehicles(CORINAIR’90 and ‘94 SNAP code 070600) accounted for morethan 20 percent (~3.5 million tons) of total anthropogenic emissions in Europe in 1990.It should be noted that refueling losses are not included in this category but areestimated as part of the emissions from gasoline stations (see Section 3.4.3.2). The threemain sources of evaporative emissions from vehicles are:
• diurnal emissions - result from the vapor expansion inside the gasoline tank that isassociated with the daily variation in ambient temperature,
• hot soak emissions - occur when a hot engine is turned off and the heat from theengine and exhaust system raises the temperature of the fuel system, and
• running losses - during vehicle operation, high ambient temperature and heat fromthe exhaust system will contribute to the generation of vapor in the gasoline tank.
The magnitude of emissions from these sources will be affected by the volatility of thegasoline, the ambient temperature, temperature changes, vehicle design characteristicand driving habits. More details on the characteristics of evaporative emissions can befound in EEA (1996).
Control options include small and large on-board carbon canisters, which adsorbgasoline vapors and desorb them to the engine under appropriate conditions. Also, useof lower volatility gasoline results in reduction of emissions. Currently RAINS includessmall carbon canisters (SCC) as a control option with an efficiency of 85 percent. TheEU Directive 91/441/EEC requires the installation of carbon canisters in all newgasoline passenger car models since 1993.

15
'5<'5< 1(:
3.2 Solvent Use
Solvents are used in a variety of industrial processes. Since solvents are often alsocontained in the final product, they are not only emitted at the place of manufacturing,but also released later during use (application). In 1990, solvent use was the largestsource of NMVOC emissions from stationary sources contributing about 50 percent ornearly 30 percent of total anthropogenic emissions in Europe in 1990.
The methods of reducing VOC emissions resulting from solvent use can be grouped intothree broad categories:
• Process modification including the improvement of management practices.Examples are reducing or combining two steps of the production process, alteringthe temperature of a certain process, regular maintenance programs to identify andprevent leaks, etc.;
• Solvent substitution aiming at reduced solvent use (use of low-solvent or solvent-free products);
• Add-on technologies including thermal or catalytic oxidation, carbon adsorption,absorption, refrigeration/condensation and biooxidiation.
For non-industrial use of solvents as well as for ’non-enclosed’ industrial processessolvent substitution or process modification are viable control options. Add-ontechnologies are appropriate for ‘enclosed’ operations where solvents can be captured. Itis believed that there is a large potential to reduce NMVOC emissions applying the firstcategory of options.
3.2.1 Surface Cleaning
Surface cleaning, i.e., dry cleaning (CORINAIR’90 and ‘94 SNAP code 060202) anddegreasing (CORINAIR’90 and ‘9414 SNAP code 060201), contribute about 530 kt(~3 percent) to total anthropogenic VOC emissions. Most of the countries participatingin the CORINAIR’90 exercise reported emissions from these activities.
3.2.1.1 Dry Cleaning
Dry cleaning refers to any process to remove contamination fromfurs, leather, textiles, etc., using halogenated solvents (EEA, 1996).The halogenated hydrocarbons used can be divided into two groups:
• Chlorinated hydrocarbons, including perchloroethylene (PERC), trichloroethyleneand other solvents, and
• chlorofluorocarbons (CFC’s), including mostly trichlorotrifluoroethane (R113). The most important hydrocarbons are PERC and R113, with a market share of PERC ofabout 90 percent. More details can be found in Jourdan and Rentz (1991).
14 SNAP ’94 distinguishes also two additional categories in group 0602 [Degreasing, dry cleaning andelectronics], namely Electronic components manufacturing (060203) and Other industrial cleaning(060204).

16
'(*5'(*5 1(:
In the dry cleaning process four steps can be distinguished:
• cleaning in a solvent bath,• drying with a hot air,• deodorisation and• regeneration of solvents.
VOC emissions occur at all of these stages at a number of places, such as dryers,washers, solvent filtration systems, settling tanks, stills, and at the piping and ductworkassociated with the installation and operation of these devices. Emissions are highlydependent on the type of process, the solvent used, and on correct operation andmaintenance. For 1990, emissions from this sector are estimated in CORINAIR at about125 kt (~0.7 percent of total VOC).
It has to be noted that emissions of CFC’s (machines operating on R113) are notaccounted for in CORINAIR’90. Since, for the protection of the ozone layer, R113might be replaced in the future with PERC, the calculated NMVOC emissions may rise.
There are basically two types of machines used in the dry cleaning sector: machines withopen and closed circuit. Open circuit machines may be regarded as uncontrolledtechnology. The closed circuit machines can be subdivided into conventional and newgeneration types. The conventional type has internal refrigerated condensers (IRC); thelevel of emissions is comparable to open machines with activated carbon adsorption(ACA), or lower. It might be possible to control the emissions from these machines evenfurther.
In principle, conventional closed circuit machines could be treated as a control option ifthey replace open-circuit units; however, analysis suggests that the cost-effectiveness ofsuch a replacement seems to be lower than that of the new generation closed-circuitmachines which have the IRC and ACA units already integrated.
Based on information provided in several studies (Jourdan and Rentz, 1991; EPA, 1994;Passant, 1993; EEA, 1996; ECE, 1990 RAINS distinguishes three control options fordry cleaning:
• Activated carbon adsorption (ACA) and good housekeeping (HSE), applicable toexisting open-circuit machines operating on halogenated solvents, assumedefficiency 60%. It is important to determine what was the proportion of emissionsfrom open circuit machines in different countries in 1990.
• Conventional closed-circuit machines (CCCM) which in many countries becomethe “no control” technology for new installations, assumed efficiency 76 percent.
• New generation closed circuit systems (NCCM); an efficiency of around90 percent has been demonstrated.
3.2.1.2 Degreasing
Solvent cleaning (degreasing) uses organic solvents to remove water-insoluble impurities (e.g., grease, fats, waxes) from metal, plastic,fiberglass, and other surfaces. Organic solvents applied for this

17
purpose include petroleum distillates, chlorinated hydrocarbons, ketones, and alcohols.Degreasing is important in automobile manufacturing and in the production ofelectronics, appliances, furniture, aircraft and business (office) machines such ascomputers, photocopiers etc. For 1990, total European emissions (CORINAIR’90database) from this activity were estimated at about 400 kt of NMVOC, whichrepresents nearly 2.5 percent of total.
For degreasing, two basic types of machines (open-top and enclosed) can bedistinguished. Open-top machines are more popular due to their simple and robustdesign. However, they have higher VOC emissions than the more capital-intensiveenclosed machines. Actual emissions are strongly influenced by the design and theappropriate operation and maintenance, which is particularly important for open-topmachines. More details on degreasing operations can be found in Hein, et al., 1994;EPA, 1994; ECE, 1990; Heslinga, 1990.
It has to be stressed that this sector is characterized by a large variability in the size ofthe installations (measured by the amount of solvents used), typically with a largenumber of small units. This has an implication on the possibility of control in thissector.
The RAINS-VOC module distinguishes the following control options for this sector:
• Basic emission management techniques (BEMT). This group of measures includesgood housekeeping (proper operation and maintenance), improved containmentachieved by improved covers, and other primary measures like higher andrefrigerated freeboards. These measures are applicable to most of the existinginstallations and it is assumed that they will be (autonomously) integrated in newinstallations. Although it has been demonstrated that the combined efficiency ofsuch measures can reach 40 to 60 percent (EPA, 1994; ECE, 1990, Hein et al.,1994), RAINS assumes an average overall efficiency of about 20 percent.
• Substitution, i.e., switch to water-based systems (WBS), possibly involving somemodification. Elimination of solvents and replacing them by "water and soap" resultsin a 100 percent reduction of VOC emissions. Substitution is an option both forexisting and new installations. It is difficult to precisely estimate the applicationpotential, since it depends on a number of country-specific circumstances. Typicalestimates range from 50 percent to more than 70 percent in Germany.
• Activated carbon adsorption (ACA) can reduce VOC emissions by up to 80percent. It can be applied to most of the existing and new sources, particularly formedium and large installations. Some studies claim, however, that ACA is generallynot an economic option (ECE, 1990).
• Low temperature plasma process (LTPP). This technique is already applied insome sectors and its share is expected to grow further. Typical removal efficienciesare estimated at 98 percent (IFARE, 1998) with an applicability to 70 percent of thesources.
• Conveyorised degreasers with integrated carbon adsorption (CD-ACA). Thistype of enclosed degreasers is continuously loaded and is often combined with

18
'20B26
9(+75
carbon adsorption. The efficiency of 95 percent is assumed (IFARE, 1998) with anapplicability of up to 90 percent.
• Furthermore, a number of combinations of the above options are also considered inthe RAINS-VOC module (see Annex 2).
3.2.2 Treatment of Vehicles
This sector, in the RAINS-VOC module, includes twoCORINAIR’90 and ‘94 SNAP 3 categories, i.e., Underseal treatmentof vehicles (060407) and Vehicle de-waxing (060409). Although for1990 the overall contribution of this sector is only estimated at about 0.4 percent to totalEuropean VOC emissions, its true importance is most likely higher because only 10countries participating in CORINAIR’90 reported emissions from these activities.
For underseal treatment, substitution with a hot melt type of coating is a viable emissioncontrol option (Adler, 1993), but it is not considered in the model at this stage due tolack of appropriate data.
For de-waxing, possible control options include cleaning with hot water/soap incombination with an installation for the separation of the water/wax mixture and, iftransport conditions allow (e.g., if transported by trucks), no protective layer. Due toinsufficient data, these options are not considered in RAINS yet.
3.2.3 Use of Solvents in the Domestic Sector
Domestic solvent use is one of the very important sources of VOCemissions in Europe (CORINAIR SNAP’90 and ’94 code 060408). Itincludes the non-industrial use of solvent containing products(excluding paints), such as household and personal care products, adhesives and glues aswell as automotive maintenance products. In the CORINAIR’90 inventory emissionsfrom this sector amount to about 500 kt, which would be about three percent of totalemissions. However, only 12 countries reported emissions from this sector toCORINAIR'90. Since there is no doubt that these products are used in all countries, realemissions could be more than twice as high, which puts this sector among the mostimportant sources.
Options for reducing emissions from domestic solvent use include:
• A change in the application method (repackaging, e.g., roll-on, pump-spray, solidstick, etc.).
• Product substitution/reformulation (non-VOC or low VOC products). Thiscategory includes the substitution of glues by so-called ‘hot melts’. Only little isknown about the effectiveness of this option, so that several research programs ondeveloping low/non-VOC products have started, which are expected to producemore information in the future. However, total emissions from the use of glues aremost likely minor.
• ‘Propellant insert’, i.e., replacement of some or all of the propellant with an inertgas propellant (e.g., nitrogen) in a small pressure regulating cylinder which is

19
$5&+B3
inserted into the aerosol container during assembly. According to ERM (1996),‘propellant insert’ seems to be a promising technology with a realistic chance forcommercialization, although the figures given in the ERM study are disputed byindustry and there is lack of evidence supporting the ERM numbers on achievedreduction (Passant and Vincent, 1998).
• Directions for use, storage and disposal (product labeling and consumer’seducation).
Since for some of these options only insufficient information about the costs andefficiencies is available, only two options (propellant insert (P_INS) and productreformulation (REF)) are included in the RAINS database at the moment. Even for theseoptions the currently available data are rather uncertain, so that they are excluded fromthe present model calculation; these options are reserved for potential use in the future.Examples of detailed product inventories and discussion of abatement potential arepresented in Passant and Vincent (1998) and in Umweltministerium Baden-Württemberg (1993).
3.2.4 Non-industrial Use of Paints
VOC emissions during paint application are caused by evaporation of the solvent usedto modify the viscosity of the binder so the paint can be applied. Solvents are also usedfor cleaning of the equipment (brushes, spray guns, etc.). Nearly half of the totalemissions from the use of paints originate from non-industrial, i.e., architectural and do-it-yourself (DIY) applications. These categories are represented in CORINAIRSNAP’90 and ’94 by Paint application: Construction and buildings (060103) andDomestic use (060104). Since the penetration of certain low solvent paints is differentfor private (domestic) and professional (architectural) use, RAINS treats these twocategories separately.
3.2.4.1 Architectural Use of Paints
In principle, there are two possibilities to control VOC emissionsfrom the architectural use of paints, namely to modify the applicationtechnique and to use reformulated paint. Since the potential formodifying the application technique (reducing the over-spray, e.g., by using electrostaticsprays) is rather limited, only substitution is considered in RAINS at this stage.
Ongoing industrial research increases the number of available low-solvent paints andreduces the typical solvent contents to less than half of that of conventional paints.Further reductions are possible through advanced substitutes. When considering thereduction efficiencies (in the following examples relating to a conventional paint with asolvent content of 50 percent), it is also essential to take account of different coverageefficiencies of modified paint products. RAINS considers at the moment the followingthree options:
• Substitution with dispersions/emulsions (EMU) where feasible. These paints havelow solvent content (about 2-3%) and are already widely used for decorativepainting (available since the early 1970s) but have limited applicability to metalsurfaces due to poor protective capability for metal substrates.

20
'20B3
$872B3$872 3 1(:
• Substitution with water-based paints (WB) other than dispersion paints. Waterbased paints are applied with conventional techniques and have several health, safetyand environmental advantages over the organic solvent paints. There are, however, anumber of problems associated with their application in the construction andbuilding sector and in industrial applications (Section 3.2.5.3). A typical reductionefficiency of 70 to 80 percent is assumed in RAINS.
• Substitution with high solids paints (HS). Until now, such paints have not beenwidely applied in this sector due to limitations resulting from necessary applicationmethod, their toxicity, flammability, the extended drying time, etc. Reductionefficiencies between 40 to 60 percent are reported.
For estimating the emission reduction potential it is essential to assess the specificapplicability in a given country, taking into account socio-economic factors, currentpractices (shares of dispersion as well as water based paints used), and the policiesalready in place. Unfortunately, only insufficient information is available on theseaspects in many European countries.
3.2.4.2 Domestic Use of Paints
Since most do-it-yourself (DIY) applications rely on brushing androlling, some of the professional application techniques such as sprayguns are not considered as realistic options for private use.Therefore, substitution of conventional paints with water-based (WB), high solids (HS)and dispersions/emulsions (EMU) paints is considered as the most viable control option.The potential for such substitutions depends on the current situation, i.e., on the currentmarket share of dispersion and water based paints, and on country-specific parameterslike traditional construction materials, climate and policies already in place. Removalefficiencies are equal to those of professional paint applications (Section 3.2.4.1), butapplicabilities are different for domestic use.
3.2.5 Industrial Use of Paints
Important industrial activities involving significant paint use are automobile production,construction of ships, manufacture of metal and plastic articles, wood coating, coilcoating, and vehicle refinishing. In 1990 about 1.2 million tons of NMVOC wereaccounted from these sources, constituting 6.8 percent of total European emissions. Theimportance of this sector for VOC control strategies is further enhanced by its largepotential for reducing these emissions.
3.2.5.1 Automobile Production
This source category includes the coating of vehicle bodies whenthey are produced (CORINAIR SNAP’90 and ‘94 code 060101). As amulti-step operation, up to 80 percent of VOC emissions occurduring the application and curing of prime coat, guide coat andtopcoat (EEA, 1996; Hein et al., 1994). Emissions are strongly influenced by the VOCand volume solids content of the coating, the area coated per vehicle, and the transferefficiency.

21
9(+5B39(+5 3 1(:
For every country where automobile production is relevant, RAINS uses a country-specific emission factor taking into account the specific production structure and thealready applied control measures.
In principle, three types of measures can be undertaken to reduce emissions from carbody painting. They include substitution of the coating (by water based, high solids orpowder coating), modification of the process (spraying, oven, air supply system) andinstallation of add-on abatement equipment. Solvent management plans (SMP) canresult in VOC reductions ranging from few to several percent, depending on the plant.At this stage three options are recognized in the RAINS-VOC module:
• Process modification and coating substitution (PRM+SUB). Processmodifications leading to optimized solvent management and improved applicationefficiency can be applied to spraying, ovens, and to air supply systems. Coatingsubstitution includes the use of water-based primer and topcoat, and for special parts(fuel tanks and shock absorbers) powder paints. A 70 percent emission reductionefficiency is assumed. This option is fully applicable at existing plants (100% ofnon-controlled plants); new plants are assumed to apply this option by default at noextra costs.
• Add-on abatement techniques (A_INC) such as adsorption and incineration, withremoval efficiencies of up to 95 percent. In practice, however, add-on techniques areonly applicable to processes responsible for about 25 to 30 percent of VOCemissions in the sector.
• Furthermore, RAINS considers for existing plants a combination of the measuresmentioned above (PRM+SUB+A_INC). Taking into account the limited technicalapplicability of add-on options, the overall efficiency is estimated at about 80percent.
3.2.5.2 Vehicle Refinishing
It is estimated that in 1990 nearly 300 kt or three percent of totalNMVOC were caused by vehicle refinishing, i.e., car-repairworkshops where either whole or parts of vehicles (cars, trucks, etc.)are re-painted.
Since in the CORINAIR’90 this category is included in industrial painting, for manycountries disaggregated information is not available. The CORINAIR SNAP’94nomenclature recognizes vehicle refinishing as a separate category (060102). The mainreason for distinguishing this sector from other industrial painting is the fact that it has auniform application method (spraying), and that costs and efficiencies of the controloptions are distinctively different from the other industrial paint applications.
Emissions can be reduced by modifying the application method, good housekeeping,other primary measures and substitution (e.g., IFARE, 1998; Hein et al., 1994). RAINSconsiders the following control options:
• Good housekeeping and other primary measures (HAMP). This option includesthe use of high volume low pressure spray guns (HVLP), solvent management plan,good housekeeping and enclosed gunwash. HVLP typically results in a 20 percent

22
,1'B3
lower paint consumption. Also other measures lead to paint savings and result inlower emissions from the cleaning solvents. The overall efficiency is estimated atabout 24 percent. Expert judgement suggests that this option is applicable to most ofthe car repairing workshops.
• In addition, two combinations of the previous option (HAMP) with substitution bywater-based and high solids paints are considered. The first one (HAMP+SUB1)assumes that 50 percent of paint will be substituted by 25 % of WB and 25 % of HSpaints, resulting in an overall efficiency of around 45 percent. The secondcombination (HAMP+SUB2) considers full substitution with 40 % HS and 60 %WB paint with an estimated overall efficiency of about 72 percent.
It is also assumed that HAMP+SUB1 is standard for new workshops.
3.2.5.3 Other Industrial Use of Paints
In 1990, about 700 kt, i.e., about 35 percent of the VOC emissionsfrom paint originated from the ship building industry, manufacture ofplastic and metal articles, wood products industry (EEA, 1996).Since the CORINAIR’90 inventory did not distinguish between these industrialactivities (SNAP’90 code 060102)15 and since there is only limited information fromother sources, at this stage RAINS aggregates them into one sector. Consequently, thechoice of control options that are considered in RAINS had to compromise and, to acertain extent, ignore some of the characteristic differences of the individual sources(compare ERM, 1996: EEC, 1990; EEA, 1996; Hein et al., 1994; IFARE, 1998).
VOC emissions from other industrial paint use can be reduced by primary measures,substitution with water-based, high solids or powder paints, radiation curing, and withend-of-pipe measures. Technologically, the focus was put on primary measures and theuse of high solids and waterborne systems, while less attention was given to powderpaints and radiation cure systems. The applicability and acceptance of the substitutecoatings is still hampered by some known problems related to
• the application method, extended drying times, sticky overspray, property losses,flammability, toxicity - for high solids;
• substrate sensitivity (WB paints are less tolerant to surface contamination),application conditions, drying time, quality, environmental issues (e.g., waterpollution) - for waterborne systems;
• curing temperature, film thickness, quality - for powder coatings.
Also radiation cure systems are not trouble free; known problems include low durabilityand resistance to water and sunlight, health and safety issues, high material andequipment costs as well as restriction of application to flat work and thin coatings.
15 SNAP’94 introduces separate categories for coil coating (060105), boat building (060106), wood(060107), and other industrial paint application (060108).

23
RAINS considers the following groups of control options:
• A package of primary measures described as good housekeeping and otherprimary measures (HAM). This group includes good housekeeping, solventmanagement plans and the modification of spray application techniques (highvolume low pressure spray guns – HVLP) to improve the transfer efficiency fromabout 45 percent to 80 percent. With an average solvent content of conventionalpaints of 65 percent and assuming 25 to 30 percent fugitive losses, the overallemission reduction efficiency of this package (compared to the uncontrolled level) isestimated at about 65 percent. Due to the limited potential of spray operations, theapplicability is restricted to about 40-45 percent.
• Substitution with alternative coatings (SUB). Based on an average solvent contentof alternative coatings between 5 and 15 percent and assuming less use of cleaningsolvent, the VOC reduction efficiency of this option is estimated at 77 to 88 percent.The actual applicability depends strongly on a number of specific factors, such as theavailability of the substitute product (paint) for a particular process, the requiredquality of the finish, and the country-specific structure of the sector. It is presentlyestimated at 80 percent.
• Add-on techniques (A_INC) refer to thermal and catalytic incineration. With atypical removal efficiency of 95 percent, the applicability is critically influenced byflow rates and solvents concentrations of the air stream and the extent to whichprocesses are enclosed. Usually, the application potential is limited, since only afraction of the emissions from the entire plant can be treated. Activated carbonadsorption and ‘biological bed’ are further techniques belonging to this group; sincethe available literature suggests minimal applicability and high costs for these twooptions (ERM, 1996), they are, at the current stage, not included in the analysis.
Additionally, combinations of the above mentioned options are considered in the model.
3.2.6 Solvent Use in Chemical Industry
With data supplied by the majority of countries, CORINAIR’90 reports nearly 700 kt ofVOC emissions from this sector (4 percent of total). Large differences andinconsistencies in emission factors, however, question the reliability of at least some ofthe available information, so that it was decided to wait for further information beforeintroducing detailed sectoral distinctions into the RAINS-VOC module. For the timebeing, the sector was split into two broad categories distinguishing the different natureof processes:
• Chemical products incorporating solvents like paints, inks, glues;
• Products without solvents, such polyester, rubber, pharmaceuticals, etc. This sectorwas further subdivided into
à Pharmaceutical industry (although not significant on the European scale, it is animportant source of VOC emissions in a few countries), and
à Other industry.
The full list of activities included in the sectors is provided in Annex 1.

24
3,6
31,6
3.2.6.1 Products Incorporating Solvents
CORINAIR’90 reported about 300 kt (1.6 percent of total) of VOCemissions from activities included in this category, of which morethan half originated from the production of paints and glues(CORINAIR SNAP’90 and ‘94 code 060307 and 060309, respectively). Most of theother activities included in this category (compare Annex 1) contribute less than onepercent to total national emissions.
The options to control emissions from this sector include the reduction of fugitivelosses, reformulation of products, and a range of add-on techniques. Although variousmeasures have been already introduced due to the occupational health and safetyreasons, information on their efficiency and costs is scarce. RAINS considers thefollowing control options:
• Basic emission management techniques (BEMT). This group of measures includessolvent management plans (SMP) and process changes, such as improvedmaintenance and the introduction of continuous instead of batch process (wherepossible), which can result in a substantial reduction of fugitive losses. The availableliterature (ERM, 1996; IFARE, 1998) suggests that such options are widelyapplicable (from 50 to nearly 100 percent) with typical control efficiencies in therange of 10 percent.
• Potentially a very attractive option, at least in paint production, is the reformulation(REF) (e.g., water-based coatings), which can bring emissions down by 30 to 95percent (EPA, 1994). The applicability of this option is considered to be high,especially in the long term. In the past, some of the reformulated products did notmeet the requirements expected by the users in terms of the quality of the coatingand there still are problems related to the application of reformulated products forsome purposes (see also Section 3.2.5.3). Much progress has been made over the lastfew years, so that for the long run an applicability of up to 80 percent of paint andglue production seems reasonable. Typical removal efficiencies are around 50percent.
• Add-on techniques such as biological, catalytic and thermal oxidation. In principle,these options are characterized by high removal efficiencies (~95 percent) and couldbe widely applied. In practice, the achievable overall efficiency depends on the shareof emissions that can be captured. RAINS assumes a combination of primary andadd-on techniques (BEMT+A_INC) with an efficiency of 95 percent. An applicationpotential of up to 75 percent is presently used in RAINS, depending on the structureof the sector in a given country.
3.2.6.2 Products Not Incorporating Solvents (Excluding Pharmaceuticals)
This category covers a wide range of different processes,contributing in total about 300 kt (1.8 percent) to the European VOCemissions. The complete list of activities included in this category isprovided in Annex 1. The largest portion (nearly 200 kt) originates from rubber andpolyvinylchloride (PVC) processing (CORINAIR SNAP’90&’94 code 060305 and060302, respectively).

25
3+$50$
While polyurethane and polystyrene foam processing (CORINAIR SNAP’90&’94 code060303 and 060304, respectively) contributed in 1990 only about 10 percent, thereplacement of CFC’s by butane and pentane will increase their share in the future.Unfortunately, the control potential for these products is limited, because a substantialpart of the emissions do not occur during production, but later during application.
As with all sectors where a wide range of different activities is included, the definitionof a ‘typical’ or ‘representative’ control options is a difficult task. The values listedbelow refer to the average European situation, assuming fugitive losses of 20 percent. Inpractice, however, RAINS uses country-specific information to describe the actualsituation and application potential for each individual country. RAINS distinguishes thefollowing emission control options:
• Solvent management plans (SMP). The use of lids on tanks and/or improving thesolvent delivery and handling system can reduce VOC emissions by up to 10percent. The application potential varies between 25 to 80 percent across countries,depending on the state of technological development and legal requirements.
• Add-on techniques (A_INC), e.g., adsorption and thermal incineration, have provento achieve very high efficiencies, typically above 95 percent. They could be widelyapplied, although only to a part of the process. RAINS assumes applicabilities of upto 70 percent.
• Substitution (SUB) is a viable option for rubber processing only. Thus itsapplicability will depend not only on the limitations within the rubber industry(estimated at about 25 percent), but also on the contribution of this industry to totalemissions of this sector in a given country. Therefore, although the efficiency can beas high as 100 percent, the overall applicability will be typically around 5 to10 percent. Effectively, this option is used in combination with solvent managementplans (SMP+SUB) assuming an efficiency of 50 percent and an applicability to30 percent of the sector.
3.2.6.3 Pharmaceutical Industry
Although the pharmaceutical industry (CORINAIR SNAP’90 and ’94code 060306) does not make a major contribution to total EuropeanVOC emissions (about 0.7 percent), it is a non-negligible source forUnited Kingdom, Germany and Switzerland.
The only option for reducing VOC emission from this sector which is considered inRAINS is the combination of primary measures (good housekeeping and solventmanagement plans - HSE) with add-on technologies such as incineration or adsorption(INC/ACA). The efficiency of this package is estimated at 87 percent with fullapplicability to the entire sector. To get the abatement potential right, however, it isimportant to determine the country-specific situations (i.e., the already implementedcontrol measures) in the base-year.

26
357B3$&.357 3$&. 1(:
3.2.7 Printing Industry
VOC emissions from printing industry are caused by several activities such aspublication of newspapers, magazines, books, etc., packaging (cardboard, flexibleplastic, aluminum foils), and decoration (e.g., wallpapers). There are several techniquesused in printing: litography, rotogravure, flexography, and screen printing (EEA, 1996;EEC, 1990; IFARE, 1998; Allemand et al., 1990). Although the relative importance ofthese techniques for VOC emissions differs among countries, flexography androtogravure are usually the most important processes. Since different abatementtechniques will be used for various printing processes, four sub-sectors are distinguishedin the RAINS model.
VOC emissions from printing industry from the 17 countries that reported toCORINAIR’90 (SNAP’9016 code 060403) amount to nearly 300 kt (~1.7 percent of totalemission reported, see Table 2). Consequently, in reality the printing sector might beresponsible for a somewhat larger share of emissions.
3.2.7.1 Flexography and Rotogravure in Packaging
Printing of milk cartoons, multiwall bags, labels, tapes, envelopes,as well as laminates and corrugated paperboard is often done withflexography and rotogravure techniques. A variety of substrates canbe used, e.g., heavy paper, metal and plastic foil. For more detaileddescription of the processes see, e.g., IFARE, 1998; EEC, 1990; Allemand et al., 1990.
Emissions of VOC originate from solvents contained in inks and from solvents used forcleaning the equipment. Control options include good housekeeping, modification of theprocess, ink substitution and, since a large proportion of emission occurs at the dryer,end-of-pipe measures.
The following major options for reducing VOC emissions from this sector areconsidered in the RAINS model:
• Use of low solvent inks and enclosure of the printing facility (LSI+ENC) is a cost-effective option with high applicability (up to 95 percent) and an efficiencyestimated at about 65 percent.
• A substitution with water based inks (WBI). Characterized by an efficiency ofabout 90 percent, the application potential is severely limited (about 30 percent) bytechnical difficulties in flexible packaging.
• Enclosure and solvent recovery through carbon adsorption (ENC+ACA) proved tobe an effective option to reduce emissions from larger plants if a single solvent isused. For smaller facilities, i.e., with an ink consumption below 500 t, this option isbelieved to be far too expensive (IFARE, 1998). In some countries this techniquewas already in use before 1990 for economic or occupational health reasons. Forsingle plants, removal efficiencies around 90 percent are documented in theliterature. In the RAINS model, the average efficiency for the whole sector is
16 In SNAP’94, further subdivision into four major categories was introduced, i.e., flexography androtogravure in packaging, heat set offset, rotogravure in publication, and screen printing.

27
357B38%357 38% 1(:
357B6&5357 6&5 1(:
assumed at 75 percent, since only part of the emissions can be captured. Theapplicability is limited to about 20 percent, and it is assumed that this option willbecome part of new installations, as far as applicable.
• Enclosure and thermal incineration (ENC+INC) is characterized by high removalefficiency (90 to 95 percent) and can be widely applied (it is already in use in somecountries). However, owing to the fact that about 20 percent of emissions arefugitive losses, the overall efficiency is likely to be about 75 percent andapplicability up to 95 percent.
Also combinations of the above options are considered in the model.
3.2.7.2 Rotogravure in Publication
This process can be applied to print on various substrates, includingcoated and uncoated paper, film, foil, etc. It is widely used inpublication, especially in advertising, and printing magazines,catalogues, newspaper supplements. At present, mostly solventborne inks are used in publication. Details of process can be found in IFARE, 1998;EEC, 1990; Allemand et al., 1990.
Similarly to the sector described in the section above, emissions occur from the use ofinks and cleaning solvents. Since the process is similar, also the control options are ofthe same type.
The following categories are considered in the model:
• Use of low solvent inks and enclosure of the printing facility (LSI+ENC) is a cost-effective option with high applicability (up to 80 percent) and an efficiencyestimated at about 50 percent.
• Substitution with water based inks (WBI) can reduce VOC emissions by up to 90percent. While still under research, the application potential is rather small (about 20percent) due to the lower quality of the finish.
• Enclosure and solvent recovery through carbon adsorption (ENC+ACA) proved tobe an effective option to reduce emissions and has been successfully applied in somecountries already in the 90’s. RAINS assumes an efficiency of 75 percent andapplicability to nearly the entire capacity. Enclosing the process, reducing thesolvent content of inks and recovering solvents is assumed to be an integral part ofnew installations.
3.2.7.3 Screen Printing
This technique is applied especially for printing on paper of largeadvertisements, prospects, etc., as well as on other substrates likePVC (polyvinylchloride), textiles, glass, and plastics (EEA, 1996).
Emissions originate primarily from the printing inks (no dilution required) and from thesolvents used for cleaning. Control options include water based and ‘solvent-free’ inks,catalytic incineration as well as biofiltration.

28
357B2))6357 2))6 1(:
The following categories are distinguished in the RAINS model:
• Substitution with water based inks (WBI) has a wide application potential(assumed up to 90 percent) and an efficiency of 75 percent.
• Enclosure and catalytic incineration (ENC+INC) is characterized by highefficiency, i.e., 90 to 95 percent. However, owing to the fact that about 20 percent ofemissions are fugitive losses, the overall efficiency is likely to be about 75 percent.This option will be typically applicable to large and medium installations, so that itspotential is estimated at about 60 percent;
• Biological treatment (bio-filters, bio-scrubbers) (BIO) is a high efficiency option(about 95 percent) that can be applied in large plants. Due to the relatively largeshare of small plants in most countries, the potential of this control technique isestimated at only 30 percent.
The composition of ink can be also changed to allow UV, infra-red or radiation curing.These methods would often use inks that contain almost no solvents and could thereforecause only very little, if any, emissions of VOC (IFARE, 1998). It is expected that theseprocesses will penetrate with time and it is assumed in RAINS that up to 10 percent ofnew capacity >357B6&5B1(:@ will apply these techniques.
3.2.7.4 Offset Printing
Offset printing is used to print magazines, catalogues,newspapers, etc. Emissions can be reduced by various primarymeasures, solvent management plans, ‘solvent-free’ inks, andend-of-pipe measures (IFARE, 1998; Allemand et al., 1990). Three principal categoriesare distinguished in the model:
• Primary measures and enclosure (PMOF). This option includes goodhousekeeping (modified practices for handling, storage and cleaning of equipment),reduction of isopropanol consumption, optimization of the dampening system, use ofvegetable oil-based cleaning agents, as well as enclosure. It is assumed that suchmeasures are applicable to the whole sector and achieve removal efficiencies ofabout 30 percent.
• ‘Solvent free’ inks and solvent management plan (SF+SMP). ‘Solvent free’ inks(radiation curing) are characterized by a high efficiency reaching 95 percent, buthave limited applicability (assumed 10 percent).
• Enclosure and thermal incineration (ENC+INC) is a very effective option toreduce emissions of VOC and can be applied to many installations. RAINS assumesan average efficiency of 75 percent and an applicability of up to 80 percent.
Additionally, combinations of the techniques listed above are included in the model.
It is also assumed that up to 10 percent of the new constructed capacities will useradiation curing (thereby using ‘solvent free’ inks) and that all new installations willintroduce primary measures (see PMOF).

29
*/8(
3.2.8 Other Use of Solvents in Industry
This category includes several industrial activities that are grouped in RAINS into threemajor sectors, i.e., application of glues and adhesives, preservation of wood, and otherindustrial use of solvents. Details are provided in the text below as well as in Table 2and Annex 1.
For 1990, more than 900 kt of VOC emissions are reported from this sector, i.e., nearly6 percent of total anthropogenic emissions in Europe. Due to inconsistent reporting ofthe emissions from other use of solvents (CORINAIR SNAP’90 code 060400), it isdifficult to estimate the real emissions from the individual sectors. For this work it wasassumed that more than 30 percent of the emissions result from application of glues andadhesives, 20 percent from preservation of wood, and the rest from other sectorsclassified in this group, mostly fat edible and non-edible oil extraction. In somecountries other sectors like leather tanning, textile finishing or use of agrochemicalsmight be of some importance, which is reflected in control options available for thissector.
3.2.8.1 Application of Glues and Adhesives
This category (CORINAIR SNAP’90 and ‘94 code 060405) comprisesa wide range of processes and is characterized by many smallenterprises and only a few large and medium size companies (Jourdanand Rentz, 1994). VOC emissions of this sector are estimated at about two percent17.
The control options considered in RAINS are:
• Modification of the application technique (brushing, rolling, spraying) to improvethe transfer efficiency, and other housekeeping measures (HSE). The typicalreduction efficiency is estimated at 15 percent. The applicability will vary,depending on the size of plants.
• Substitution (SUB) with water-based adhesives or hot melts. The substitution withwater based products is expected to be applicable to about 60 percent of theactivities with an efficiency of about 85 percent. However, the use of water-basedadhesives might have, in some cases, adverse impact on the quality of the finishedproduct. Therefore, literature suggests hot melts as the more promising option withsimilar efficiency and applicability.
• Among the ‘add-on techniques’, thermal oxidation (INC) seems to be the mostappropriate one. The assumed reduction efficiency is about 80 percent. Theapplication potential is limited to continuously operating large installations.Currently an applicability of 40 percent is used in the model.
In addition, the model considers combinations of the above options.
Since the available information on some other options such as the atmospheric pressurenon-equilibrium technique is still scarce, they are not considered in RAINS at this stage.
17 Although Table 2 indicates that emissions from this category contribute only 1.1 percent to total, somecountries included emissions from this activity under SNAP level 2 (060400).

30
:22':22' 1(:
,1'B26
3.2.8.2 Preservation of Wood
Emissions of VOC from wood preservation (CORINAIR SNAP’90and ’94 code 060406) occur during handling, application and dryingstages, the latter usually done in the open air. These activitiesaccount for about 1.2 percent18 of total anthropogenic VOC emissions in Europe withthe largest contribution coming from the drying process.
Emissions can be reduced by solvent management plans (including measurementprograms monitoring the losses of solvents), enclosing the process wherever possibleand applying add-on techniques (condensation plant, carbon adsorption and regenerativethermal oxidizers), as well as using low solvent preservatives where applicable. Optionsconsidered in RAINS include:
• Double vacuum impregnation system (DVS) and enclosure of the drying stage(ENC). It is assumed that this combination is applicable to the whole sector and thatit will become an integral part of new-built plants. The efficiency of this option isestimated at about 40 percent as it applies to parts of the total process and to fugitiveemissions.
• Add-on techniques like incineration (INC) and adsorption (ACA) is applicable tomost of the sector, but only able to capture parts of total emissions. The overallefficiency is assumed at about 60 percent.
• Combinations of the above options, with reduction efficiencies of about 75 percent,applicable to the whole sector.
Literature indicates that abatement potentials and costs will vary substantially betweensmall and large installations (IFARE, 1998; ERM, 1996). Due to scarce information onsize distribution and the fact that the contribution to total emissions is at most 1.5percent, no further disaggregation of this sector is done at the moment.
3.2.8.3 Other Industrial Use of Solvents
This group comprises a number of processes with varyingimportance in different countries, in total responsible for emissionsof about 400 kt in 1990. In the majority of countries the mostimportant single activity is ‘Fat edible and non-edible oil extraction’ (CORINAIRSNAP’90 and ‘94 code 060404). In countries reporting emissions from this activity thecontribution to national total ranges between one and a few percent.
It is worth mentioning that in some cases countries reported to CORINAIR’90significant VOC emissions under ‘Other use of solvents and related activities’(CORINAIR SNAP’90 code 060400) and ‘Glass wool enduction’ (CORINAIR SNAP’90code 060401). It was not always possible to identify the real sources. In CORINAIR’90,the SNAP categories 060400 and 060401 were often used as surrogate categories toreport emissions from other sources like leather tanning, textile industry, paper
18 As in the case of application of glues and adhesives in industry the contribution of preservation of woodreported in Table 2 is lower (0.8%), the reason being aggregated reporting on the SNAP 2 level (see alsoprevious footnote).

31
,125*
production, etc. Only later, these activities received their ‘own’ codes, i.e. SNAP’94060312,13 for textile finishing and leather tanning, and use of agrochemicals (SNAP’94060412).
Emissions from ‘Fat edible and non-edible oil extraction’ can be controlled byimproving the efficiency of the solvent extraction and by adding abatement equipmentlike water scrubbers at the drying plant. RAINS distinguishes two categories of controloptions to this activity (the applicability depends on the relative contribution of thiscategory to total emissions in the sector):
• Primary measures (PRM) with an efficiency of about 70 percent.
• A combination of primary measures and add-on technology, e.g., bio-filtration(PRM+BIO) with an efficiency of 75 percent.
Additionally, two other options are included in this sector. They refer to the activitiesthat are important sources of emissions in some countries, namely leather tanning andthe use of agrochemicals.
• Reformulation of leather coatings, i.e., waterborne coating (WBC). This option hasalready been used by some operators in Europe (Passant and Vincent, 1998) and itsestimated reduction potential is around 60 percent.
• Introduction of new agrochemical products (NAGR) with lower solvent contentallowing lower application dosage rates (ERM, 1996). It is expected that solvent usein the sector will drop by 30 to 50 percent (assumed 40 percent).
3.3 Chemical Industry
The contribution of chemical industry (excluding solvent use) to total anthropogenicNMVOC emissions in 1990 was about 500 kt (~3 percent). In RAINS, this sector is splitinto two major categories: (i) production processes and (ii) storage and handling ofchemical products. Production processes are split further into inorganic (fertilizerproduction and other products) and organic chemical industry, the latter contributingthree-quarters of the process emissions.
3.3.1 Production Processes in Inorganic Chemical Industry
The inorganic chemical industry, particularly the production ofcarbon black, nitrogen fertilizers and nitric acid, caused about 120 ktof VOC emissions in 1990 (CORINAIR SNAP’90 and ’94 codes040402-09). There is some doubt about the reported emissions from fertilizerproduction; experts suggest somewhat lower figures to be realistic.
At the time of writing no information on options for reducing VOC emissions wasavailable.

32
25*B352&
25*B6725(
3.3.2 Production Processes in Organic Chemical Industry
Around 300 kt of NMVOC (~1.7 percent of total) were reported in1990 for the manufacturing of several chemicals (CORINAIRSNAP’90 and ’94 code 040501-21); for the complete list seeAnnex 1. Emissions occur through venting, storage, handling, leakage, sampling,spillage, etc. Nearly 70 percent of these emissions are caused by the production ofethylene, propylene, polypropylene, and polyethylene (low and high density). Theimportance of this sector in different countries varies from 0.5 to about 5 percent.
The control techniques applicable to this sector include process modifications, leakprevention programs, improved flare and add-on techniques like thermal and catalyticincineration, adsorption, absorption, and condensation. These techniques are groupedinto the following categories:
• Reduction of vent losses and regular monitoring and inspection programs toprevent equipment leaks (LK_I, LK_II). The efficiency of this package is estimatedat 60 to 70 percent. Country-specific information on applicability is scarce; for thetime being 20 percent is used in RAINS.
• Flaring (FLR) could reduce venting losses by about 85 to 90 percent. Theapplicability is determined by the amount of venting losses (between 20 and 40percent of total emissions from this sector).
• Add-on techniques include mainly thermal and catalytic incineration (INC) withreported efficiencies of typically 96 percent. Applicable only to a part (50 percent) ofthe process.
Combinations of these options are also considered in the model.
CORINAIR’90 does not report (or reports only inconsistently) emissions of individualprocesses (venting, storage, handling). It is difficult to exactly determine the applicationpotentials for individual countries. Based on information from the CORINAIR’90inventory there is a great variability in the types of chemicals manufactured and in thetechnical characteristics of the manufacture processes. A further complication arises forthe assessment of the current control level, since in many countries various controloptions are already integrated in the production process, following, for example,regulations related to occupational health. Finally, also the flow rates and VOCconcentrations of the gas streams, which significantly influence the applicable controloptions, are largely unknown.
3.3.3 Storage and Handling of Chemical Products
CORINAIR’90 reports about 80 kt of VOC emissions (0.5 percent)from storage and handling of chemical products (CORINAIRSNAP’90 and ’94 code 040522). However, this number only containssubmissions from about one third of the countries; it is believed that the other countriessubsumed the emissions either under the category ‘processing in organic chemicalindustry’ (SNAP level 2 - 0405) or included them in the emissions from processing ofchemicals. This makes it difficult to derive reliable estimates based on the currentsubmissions to CORINAIR inventory. It is, however, important to distinguish this

33
(;'B*$6(;' *$6 1(:
(;' /4(;' /4 1(:
source from the chemical industry since the applicable control options are quite differentfrom those used to abate emissions in the processing part.
For the countries reporting emissions under this category RAINS distinguishes twooptions for reducing emissions:
• Introduction of internal floating covers and secondary seals (IFC) with efficiencyof 90 percent and applicability varying typically between 10 and 20 percent;
• Vapor recovery units (VRU), efficiency 95 to 99 percent, depending if single stage(VRU_I) or double stage (VRU_II) recovery units are applied.
In addition, a combined application of both options is foreseen in the model.
3.4 Oil and Gas Industry
CORINAIR’90 reports about 1.5 million tons of VOC emissions from the oil and gasindustry, i.e., nine percent of total European VOC emissions. RAINS distinguishes threemajor categories (extraction and distribution of liquid and gaseous fuels, refineries, andgasoline distribution) which are further split into a total of seven sectors.
3.4.1 Fuel Extraction and Distribution
Losses during loading and transport operations, direct venting andfugitive losses are the major sources of VOC emissions from theextraction of oil and gas and gas distribution (CORINAIR SNAP’90and ’94 codes 0502-04,06). For all of Europe, these activitiescontribute about 4.5 percent to total emissions; however, this sharecan be significantly higher in individual countries, particularly in countries with off-shore activities.
RAINS assumes that emissions from the existing gas distribution network cannot becontrolled. However, as the mains will be gradually replaced the losses will be reducedby approximately 95 percent (ERM, 1996) at no extra cost.
Regular maintenance programs can reduce fugitive emissions; recovery systemsinstalled in, e.g., marine tankers can capture losses during loading and transport.Emissions from venting may be reduced by flaring, through recovery or by acombination of both measures. RAINS distinguishes between existing and newinstallations for oil and gas extraction and loading and characterizes them by differentemission factors. New loading and unloading procedures (assumed to become standardfor new installations, i.e., sector (;'B/4B1(:) can cut emissions from theseoperations by about 25 percent at no extra cost.
When evaluating the applicability of control options, it is important to consider that inmany cases adding extra equipment (e.g., flares) might prove difficult or impossible dueto space limitations and the inability to increase the topside weight of the platform.

34
5()B352&
The following control options are currently considered in RAINS:
• Vapor balancing (VBAL) on tankers and loading facilities with an efficiencyestimated at 78 percent. This option is applicable to shipping emissions whichtypically represent 40 to 80 percent of the total emissions from the sector.
• Venting alternatives and increased recovery (V_ALT). Literature suggests acontrol efficiency of 90 percent, but applicable to only 5-15 percent of the emissions.
• Improved ignition system on flares (F_IMP). Efficiency 62 percent but, similarlyto the previous option, applicable to a relatively small part of the emissions (few topossibly 20 percent, depending on the installation).
Combinations of the above options are also considered in the model.
3.4.2 Refineries (Excluding Storage of Products)
Emissions from refineries (CORINAIR SNAP’90 and ’94 code040101-03,05) can occur at nearly any part of the refinery productionincluding processing, flaring, waste water treatment, storage ofproducts, etc. The contribution of this sector to total European VOC emissions in 1990was estimated at around 160 kt (~0.9 percent), although about 25 percent of all countriesthat reported to CORINAIR have not reported emissions for this activity.
Potentially leaking equipment includes tanks, pumps, compressors, valves, pressure-relief devices, flanges, etc. To reduce the fugitive emissions, leak detection and repairprograms can be introduced. Its efficiency and cost will depend on the size of theinstallation, the monitoring method, frequency of inspection (quarterly, monthly), etc.Emissions from waste water separators can be reduced by minimizing the oil leakage tothe sewage system and by introduction of floating covers on the separators. The gasesand vapors that escape from the blowdown system and some process losses can be fed toa gas collecting system and consequently incinerated (IFARE, 1998).
RAINS distinguishes three main categories of options (and their combinations) forreducing emissions from refineries:
• Regular inspection and maintenance programs (LK_I and LK_II) with an assumedefficiency of 60 and 70 percent, respectively. These efficiencies are somewhat moreconservative than what is suggested in some studies for Germany (EEC, 1990). Theapplicability of this option is determined by the share of fugitive emissions, and ittypically varies from few to nearly 20 percent of total emissions.
• Covers on oil/water separators (COWS). Literature suggests efficiencies of about90 percent (ERM, 1996, IFARE, 1998). However only about two percent of theemissions from refineries originate from this part.
• Combustion of the non-condensable emissions from the blowdown systems in aflare (FLR) with an efficiency of 98 percent (IFARE, 1998).
• A combination of the above option with added incineration (FLR-I) of other non-condensable vent emissions with an overall efficiency of 99 percent.

35
'B*$667
'B5()'(3
3.4.3 Gasoline Distribution
NMVOC emissions can occur at nearly every stage of the gasoline distribution chain,i.e., at bulk storage tanks (border terminals, refinery, marketing depots), at servicestations, during transport and vehicle filling, and there is a range of possibilities wherefugitive emissions can occur (spillage, etc.). It was decided to include in this RAINSsector also emissions from the storage of products at the refinery. Together this activitiesaccount for about 700 kt of VOC emissions in Europe (4 percent of total).
RAINS divides this sector into two categories:
• Transport and depots, including storage at the refinery, dispatch station andmarketing installations, and
• service stations, including refueling.
3.4.3.1 Transport and Depots
This sector includes emissions from gasoline marketing and storageat refineries and dispatch stations (CORINAIR SNAP’90 and ‘94codes 040104, 050501, 050502).
Emissions from storage can be reduced for example by installation of internal floatingcovers for fixed roof tanks or secondary seals for tanks with external floating roofs. Toachieve higher reductions, vapor recovery systems need to be installed. Modification ofloading techniques (introduction of submerged top loading and bottom loading) andintroduction of vapor return/recovery lines can reduce emissions from tank trucks, railcars, barges, ships during loading operations. Combined vapor recovery systems andmodified loading techniques are often referred to as STAGE IA controls. The optionsconsidered in RAINS are listed below:
• Internal floating covers (IFC) for fixed roof tanks or secondary seals for tankswith external floating roof (EFR) with an assumed efficiency of 85 percent.
• Stage IA controls, i.e., vapor balance lines and vapor recovery units at the refineryterminals. Single stage (ST_IAS) achieves a 95 percent reduction, for double stage(ST_IAD) a 99 percent reduction is assumed.
Combinations of these options are also considered.
3.4.3.2 Service Stations
At the service station (CORINAIR SNAP’90 and ‘94 code 050503)emissions occur from storage tanks and can be controlled by vaporbalancing systems (referred to as Stage IB) with demonstrated efficiencies of 95 percent.
Another source of emissions at service stations is the refueling of cars, which can becontrolled by introduction of passive or active vapor balancing systems between theautomobile fuel tank during refueling and the service station tank, often referred to asStage II. The efficiency of this system depends on many technical and ‘human’ factors.If operated properly, efficiencies of up to 85 percent have been demonstrated(CONCAWE, 1990; Chem Systems, 1996). Investment and operating costs show strongrelations to the size of the installation (e.g., annual throughput less/above 2.5 million

36
5(6,'
33B(;B:%
,1B%2
33B1(:
33B(;B27+
,1B2&
&21B&20%
liters/year). To derive country-specific abatement costs, data on the average throughputof gasoline stations in several European countries provided by CONCAWE were takeninto account.
A viable alternative to Stage II controls is the installation of enlarged on-board carboncanisters in vehicles. It is expected that this measure can reduce refueling emissions byup to 95 percent. This option, however, is not included as yet in the model because theavailable literature is inconclusive, particularly about the transferability of Americanexperience (CONCAWE, 1988; Chem Systems, 1996). Its long implementation time is afurther disadvantage.
To summarize, the following technologies are recognized in RAINS:
• Stage IB controls (vapor balancing systems) with an efficiency of 95 percent.
• Stage II systems (vapor balancing system between a vehicle and service stationtank), assumed efficiency of 85 percent.
Also the combination of both options is considered.
3.5 Stationary Combustion
Emissions from stationary combustion sources accounted for about seven percent oftotal anthropogenic emissions of NMVOC in Europe in 1990. All countries reportedemissions of NMVOC from these activities to CORINAIR’90.
There are three major sectors distinguished in RAINS which are further subdivided intoemission categories that are consistent with structure of the RAINS modules for sulfurdioxide (SO2) and nitrogen oxides (NOx):
• Public power, cogeneration, district heating plants
à Existing plants, wet bottom boiler
à Existing plants, other types
à New plants
• Commercial and residential FRPEXVWLRQ
• Industrial combustion
à Boilers
à Other industrial combustion
à Combustion in conversion sector
No control options are considered for these sectors in the RAINS VOC model so far,except for residential combustion.

37
5(6,'
3.5.1 Commercial and Residential Combustion
The major source of VOC emissions from this sector (CORINAIRSNAP’90 and ’94 codes 0201, 0202, 0203) is the combustion offuelwood and coal, especially in small boilers (used in single-familyhouses) and stoves. CORINAIR’90 reports emissions of nearly one million ton of VOCin 1990 (~6 percent of total). This number is fairly uncertain since, in many countries,the quality of the statistical information on fuelwood consumption in residential sector ispoor. There is, however, no doubt that this sector is a significant source of VOC. In fact,policies of increasing the use of renewable energy sources might result in increasedconsumption of wood and thereby lead to higher emissions of VOC if, at the same time,the currently operated stoves and small single-family house and residential-commercialboilers will not be replaced by modern design facilities.
There is a number of ways in which the combustion efficiency could be increased andemissions reduced. A modern wood fired boiler with an accumulator tank has anefficiency of 75 to 85 percent compared to only 50 percent of the older installations, andthe best available boilers of this type could achieve efficiencies above 90 percent(IFARE, 1998; NUTEK, 1997). Replacing old with the new boilers can reduce VOC byup to 96 percent (NUTEK, 1997). To be on the conservative side, RAINS assumes alower average removal efficiency to reflect the variety of boilers currently used acrossEurope and provide for non-optimal operating conditions of the equipment in thedomestic sector (see also IFARE, 1998).
Other methods for improving the performance of old boilers include external furnaces,ceramic inserts and pellet burners (IFARE, 1998; NUTEK, 1997). Also secondarymeasures like oxidation catalysts can be applied, achieving VOC removal efficienciesbetween 30 and 80 percent (IFARE, 1998). It has to be stressed, however, that there arecertain problems that limit the applicability of this option to mostly low-emissionmodern boilers, e.g., dust deposition on the catalyst, deposits of tar from the raw gas andthe sensitivity of the catalyst to hydrochloric (HCl). Some of the problems have beensuccessfully solved in modern installations and this option is successfully used in theUSA.
Two categories of control options for installations where coal and fuelwood iscombusted are included at this stage in RAINS:
• Oxidation catalysts (CAT) with an efficiency of 50 percent.
• New boilers with accumulator tank (NB) with an average efficiency of 80 percent.
3.6 Transportation
In principle, options for reducing VOC emissions from transport activities are treated inthe separate RAINS module for mobile sources, since many of these optionssimultaneously reduce NOx and VOC emissions. There are, however, few transportcategories for which specific VOC control measures19 exist. For methodological 19 In fact, often other pollutants are also reduced, e.g., carbon monoxide (CO) in case ofoxidation catalyst, but they are not included in the RAINS model as yet.

38
75$B5'B/)�75$ 27 /)�
reasons, these control options are treated in the RAINS VOC module, despite its mainfocus on stationary sources.
Such sources include evaporative losses from cars (see Section 3.1), two-stroke gasolineengines, shipping and air traffic. Other traffic sectors, i.e., passenger cars, light-dutytrucks, heavy duty trucks, busses, etc., are included in the RAINS-NOx module anddescribed in Cofala and Syri, 1998.
3.6.1 Two-stroke Gasoline Engines
Uncontrolled two-stroke gasoline engines are characterized by veryhigh VOC emissions rates (compare Table 6 in Section 2.2.1). Thistype of engines are used in cars and mopeds and in some off-roadmachinery, i.e., lawn mowers, motor saws used in forestry, etc. It isdifficult to estimate the total emissions from these engines since detailed statisticalinformation on fuel consumption is not available and the CORINAIR inventory does notdistinguish this category separately. However, it can be assumed that most of theemissions reported in the category ‘motorcycles and mopeds’ (CORINAIR’90 and ’94code 0704) originate from two-stroke engines and include a small share of passengercars and off-road machinery. For 1990, VOC emissions from these sources wereestimated between 500 and 1000 kt, representing between 3 and 6 percent of totalanthropogenic emissions in Europe. The importance of this category varies from countryto country depending, i.a., on the number of mopeds as the main contributors.
RAINS distinguishes the following two sub-sectors:
• two-stroke engines used in road transport >75$B5'B/)�@ and
• two-stroke engines used in off-road machinery >75$B27B/)�@�
With oxidation catalysts tailpipe emissions of VOC from two-stroke engines can bereduced by up to 90 percent (OECD, 1995). Oxidation catalysts reduce hydrocarbon andcarbon monoxide emissions. Already in the 1970’s this technology was used in cars,mostly in the USA. Further reduction of hydrocarbons might be possible throughadvanced injection systems, i.e., direct-cylinder electronic fuel injection (OECD, 1995),although this technology is not yet considered in RAINS.
RAINS includes only one control technology for two-stroke engines, i.e., oxidationcatalysts (OX_CAT) that can be applied to both road and off-road engines. The averageefficiency of this option is assumed at 80 percent.
3.6.2 Shipping and Air Traffic
According to the CORINAIR’90 inventory, inland shipping (CORINAIR’90 and ’94SNAP code 0803) and air transport (CORINAIR’90 SNAP code 0805 and SNAP’94codes 080501,02) do not belong to the major sources of VOC emissions, contributing0.9 and 0.4 percent of total VOC in Europe in 1990, respectively.

39
,1'B25+
)22'
75$B276B0
75$B276B/
75$B$,5
RAINS distinguishes the following sub-sectors:
• Inland shipping
à medium size ships
à large size ships
• Air transport (landing and take-off only)
At this stage RAINS does not consider any control technologies for these categories.
3.7 Miscellaneous Sources
In 1990, miscellaneous sources (agriculture, waste treatment and disposal, food anddrink industry, and other industrial sources) accounted for one million tons of VOC.This represents about six percent of total anthropogenic emissions of NMVOC inEurope in 1990. About half of these emissions originated from burning of stubble andother agricultural waste.
3.7.1 Food and Drink industry
This sector includes emissions from the production of bread, beer,wine and spirits. Although some studies indicate that meat and otherfood processing might be an important source of emissions too, thisis not supported by data from the CORINAIR’90 inventory. In most countries between50 to 80 percent of these emissions come from bread manufacturing (CORINAIR’90 and‘94 SNAP code 040605). The production of alcoholic beverages (CORINAIR’90 and ‘94SNAP codes 040606-08) are reported as important sources in a few countries, e.g.,France and the UK.
Possibilities for controlling VOC emissions include good housekeeping, incinerationand for the food industry biological treatment. The efficiency of the add-on options ishigh (between 80 and 90 percent), but there are some limitations to the applicability.RAINS considers add-on measures (INC) with an average efficiency of 90 percent; theapplicability depends on the relative share of emissions from bread production.
Most of the emissions from alcohol beverages manufacturing result from maturation.They are usually not controlled and it is believed that emission controls might have animpact on the quality of the final product. Possible options include ducting emissionsfrom the warehouse either for adsorption and recovery or destruction. This, however,requires changes to the design that appear as practical only for new warehouses.
3.7.2 Other Industrial Sources
Other industrial sources are responsible for about one percent of totalanthropogenic NMVOC emissions; about 50 percent of them resultfrom wood and paper pulp production (CORINAIR’90 and ’94 SNAPcodes 040602,03). Iron and steel industries and collieries (CORINAIR’90 and ’94 SNAPcode 0402) contribute about 30 percent (mostly from coke oven and rolling mills), and

40
:$67(
$*5B%851
asphalt production and use (CORINAIR’90 and ’94 SNAP codes 040610,11) another 20percent. The contribution of the above industries varies from country to country.
There is only little experience with control options for these sectors, and there is hardlyany documentation about it. Since the majority of emissions from iron and steel industryis of fugitive nature, improved coke oven door operation, regular maintenance andreduced oil content of lubricants used in rolling mills will result in substantially lowerVOC emissions. Reduction efficiencies of this ‘good housekeeping’ options are reportedto vary between 40 and 80 percent (IFARE, 1998). In the paper and pulp industry mostlyend-of-pipe options would be applicable. To reduce emissions from asphalt application(road construction) substitution of cutback by emulsion bitumen is a possible option.Information on efficiency and costs of this option is given in ERM (1996), IFARE(1998), and Passant and Vincent (1998).
Options currently considered in RAINS include:
• Good housekeeping (HSE) with an efficiency between 30 to 60 percent and anapplicability of up to 70 percent depending on the structure of emissions in a givencountry.
• Bitumen substitution (BISUB) with an efficiency of 92 percent. The applicabilitydepends on the relative share of this sector to total emissions in a country. It isassumed that up to 70 percent of cutback bitumen can be substituted.
3.7.3 Remaining Sources
CORINAIR’90 reports 550 kt of NMVOC (~3.3 percent of total) from otheranthropogenic sources not listed in the sectors discussed before.
3.7.3.1 Stubble Burning and Other Agricultural Waste
For this sector (CORINAIR’90 and ‘94 SNAP codes 090700, 1003)about 2.6 percent of total NMVOC emissions were reported for1990. There are no technical control options available. A non-technical measure considered in the model is the introduction of a ban on strawburning (BAN). The applicability and enforcement of prohibiting waste burning in theopen field has to be evaluated in close relation to its practical consequences. It isassumed in the model that this option has a 100 percent efficiency (if enforced) and inthe long-term an applicability of 90 percent.
3.7.3.2 Waste Treatment and Disposal
The share of this sector (CORINAIR’90 codes 090100;090201,02,04,05; 0904 and ‘94 SNAP codes 090100;090201,02,04,05,06,08; 0904) in total VOC emissions is below onepercent (~100 kt). The main sources are landfills and wastewater treatment facilities.Emissions of NMVOC from landfills contribute about 50 percent and, potentially, theycan be controlled. It is assumed that ‘new landfill technologies’ (I_LAND), includingthe collection and utilization of landfill gas, can cut VOC emissions by 20 percent.
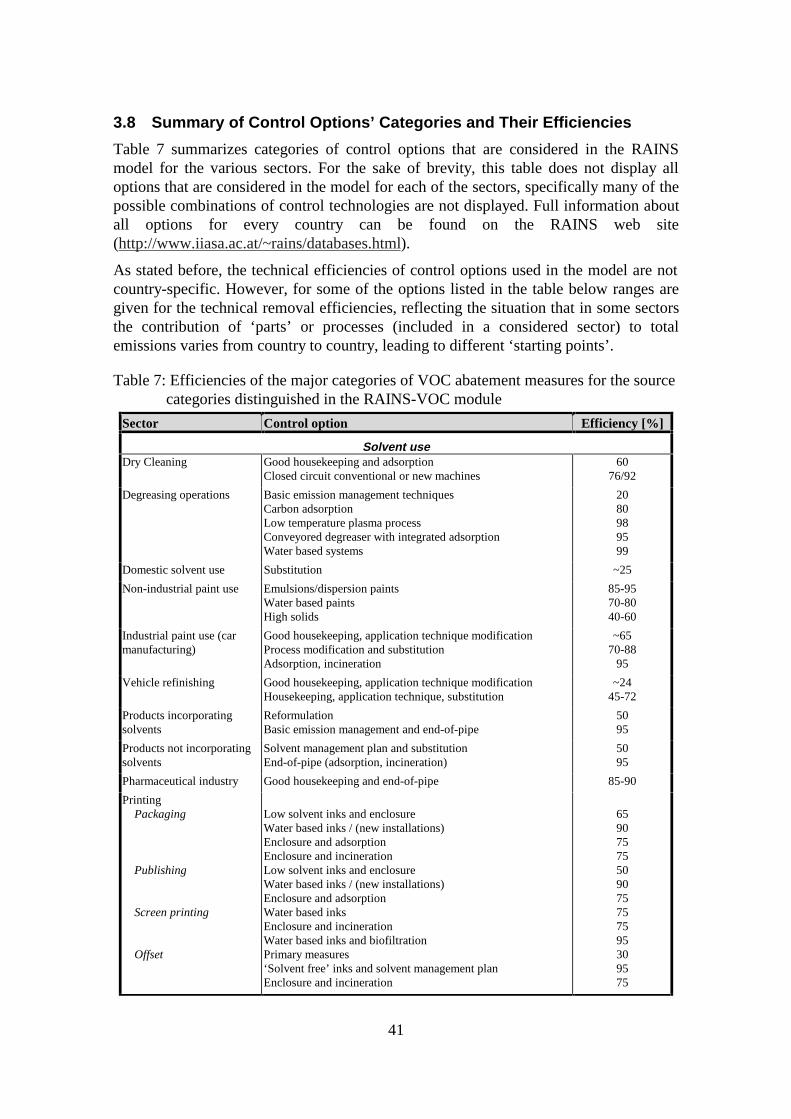
41
3.8 Summary of Control Options’ Categories and Their Efficiencies
Table 7 summarizes categories of control options that are considered in the RAINSmodel for the various sectors. For the sake of brevity, this table does not display alloptions that are considered in the model for each of the sectors, specifically many of thepossible combinations of control technologies are not displayed. Full information aboutall options for every country can be found on the RAINS web site(http://www.iiasa.ac.at/~rains/databases.html).
As stated before, the technical efficiencies of control options used in the model are notcountry-specific. However, for some of the options listed in the table below ranges aregiven for the technical removal efficiencies, reflecting the situation that in some sectorsthe contribution of ‘parts’ or processes (included in a considered sector) to totalemissions varies from country to country, leading to different ‘starting points’.
Table 7: Efficiencies of the major categories of VOC abatement measures for the sourcecategories distinguished in the RAINS-VOC module
Sector Control option Efficiency [%]
Solvent useDry Cleaning Good housekeeping and adsorption
Closed circuit conventional or new machines60
76/92
Degreasing operations Basic emission management techniquesCarbon adsorptionLow temperature plasma processConveyored degreaser with integrated adsorptionWater based systems
2080989599
Domestic solvent use Substitution ~25
Non-industrial paint use Emulsions/dispersion paintsWater based paintsHigh solids
85-9570-8040-60
Industrial paint use (carmanufacturing)
Good housekeeping, application technique modificationProcess modification and substitutionAdsorption, incineration
~6570-88
95
Vehicle refinishing Good housekeeping, application technique modificationHousekeeping, application technique, substitution
~2445-72
Products incorporatingsolvents
ReformulationBasic emission management and end-of-pipe
5095
Products not incorporatingsolvents
Solvent management plan and substitutionEnd-of-pipe (adsorption, incineration)
5095
Pharmaceutical industry Good housekeeping and end-of-pipe 85-90
Printing Packaging
Publishing
Screen printing
Offset
Low solvent inks and enclosureWater based inks / (new installations)Enclosure and adsorptionEnclosure and incinerationLow solvent inks and enclosureWater based inks / (new installations)Enclosure and adsorptionWater based inksEnclosure and incinerationWater based inks and biofiltrationPrimary measures‘Solvent free’ inks and solvent management planEnclosure and incineration
65907575509075757595309575

42
Sector Control option Efficiency [%]Glues and adhesives inindustry
Good housekeepingSubstitutionIncineration
1585
~80
Preservation of wood Double vacuum impregnation & dryer enclosureAs above plus end-of-pipe
4075
Other industrial use ofsolvents
Process modification and biofiltrationWater based coating (leather tanning)New agrochemical products
75~60~40
Chemical industryOrganic chemical industry,processing and storage
Quarterly, monthly inspection and maintenance programsFlaringIncinerationInternal floating covers and secondary sealsVapor recovery units
60/7085-90
9690
95/99
Liquid fuel extraction, processing and distributionFuel extraction, loading andtransport
Venting alternatives and increased recoveryImproved ignition system on flaresVapor balancing on tankers and loading facilities
906278
Refineries Quarterly, monthly inspection and maintenance programsCovers on oil/water separatorsFlaring / IncinerationInternal floating covers and secondary sealsVapor recovery units (Stage IA) - single/double stage systems
60/7090
98/9985
95/99
Fuel storage anddistribution
Internal floating covers and secondary sealsVapor recovery units (Stage IA) - single/double stage systemsStage IIStage IB
8595/99
8595
Transport and combustionGasoline evaporation Small carbon canister 852-stroke engines Oxidation catalyst 80Residential combustion New boilers
Catalyst8050
MiscellaneousFood and drink industry End-of-pipe 90Agriculture Ban on burning waste 100Other industrial Good housekeeping
Bitumen substitution30-60
92Waste disposal Improved landfills 20

43
4 Cost CalculationThis section introduces the methodology for calculating emission control costs in theRAINS-VOC module. The approach is in line with the methodologies currently appliedin RAINS for the calculations of SO2, NOx, and ammonia emissions (Cofala and Syri,1998ab, Klaassen, 1991).
The basic intention of the cost evaluation is to identify the values to society of theresources diverted in order to reduce VOC emissions in Europe. In practice, these valuesare approximated by estimating costs at the production level, rather than prices to theconsumers. Therefore, any mark-ups charged over production costs by manufacturers ordealers do not represent actual resource use, and are ignored. Certainly, there will betransfers of money with impacts on the distribution of income or on the competitivenessof the market, but these should be removed from a consideration of the efficiency ofresource. Any taxes added to production costs are similarly ignored as transfers.
The specific cost data as well as other parameters used in cost calculation for theconsidered control options are derived from several international and national projectsand studies (IFARE, 1998; ERM, 1996; Allemand et al., 1990; DFIU, 1996; Bouscarenet al., 1998; Chem Systems, 1996; EPA, 1994; Hein et al., 1994; NUTEK, 1997;OECD, 1992; Oonk, 1995; Passant and Vincent, 1998; VROM/DGM, 1995, 1997;Wenborn et al., 1995) and from information provided by many national experts.
The following sections introduce principles of cost calculation in RAINS and explainthe construction of the cost curves that are further used in the optimization module ofthe RAINS model. The actual parameter values used to calculate country-specific costsand the national cost curves are provided on the RAINS web site(http://www.iiasa.ac.at/~rains/databases.html). Section 4.3 gives an overview of therange of unit costs calculated in RAINS for the major categories of control options.
4.1 Cost Components
Expenditures are differentiated into
• investments,
• fixed operating costs, and
• variable operating costs.
It should be mentioned that the methodology considers some of the parameters ascountry-specific while others are common for all the countries. Country-specificparameters include, i.a., the average size of installations in a given sector/class, pricesfor labor and electricity, prices of material inputs as well as the value of recovered‘materials/inputs’. Common parameters include the interest rate and technology-specificdata, e.g., lifetime, removal efficiency, investments, maintenance costs, specific demandfor labor, energy, specific savings of materials, etc. The methodology considers the

44
application potential of a technology to a given sector by introducing an applicabilityparameter. For a discussion of the applicability parameter see Section 2.2 in thisdocument.
4.1.1 Investments
Investments include the expenditures accumulated until the start-up of an installation,e.g., delivery of the installation, construction, engineering and consulting, land costs,etc. If there is a size dependency of the unit investments (I), it is taken into accountusing the function shown in Equation 2. If an existing installation is retrofitted, higherinvestments can be taken into account through the retrofit cost factor (r).
(2)
where:
i,j,k country, sector, and abatement technology, respectively;cif, civ coefficients of the investment function;si,j an average size of the installation in the sector;r retrofit factor.
The investment costs are annualized over the technical lifetime (lt), using the interestrate (q).
(3)
4.1.2 Fixed Operating Costs
Annual fixed operating costs (OMfix) include costs of maintenance, taxes andadministrative overhead. They are not related to the actual use of the installation. Thesecosts are presented as a fixed percentage (f) of the total investments.
(4)
where
i,j,k country, sector, and abatement technology, respectively;I investment cost for a given technology;f fixed percentage of total investments for technology.
( )rs
ciciI
ji
vkjf
kjkji +×
+= 1
,
,,,,
( )( ) 11
1,,,,
−+×+×= lt
lt
kjikjian
q
qqII
kjkjikjifix fIOM ,,,,, ×=

45
4.1.3 Variable Operating Costs
Variable operating costs (OMvar) are related to the operation of the installation and mayinclude the following elements:
• additional labor demand,
• electricity use,
• additional fuel demand (e.g. gas, oil…),
• saving of solvents, gasoline, etc.,
• other.
In the model some of the parameters (e.g., labor demand, fuel demand) are related to theinput and other (e.g., savings of gasoline or solvents) to the removed VOC. Any savings,either lower labor demand or solvent saved, are associated with a negative sign.
To estimate variable operating costs, country specific prices (p) are taken into account,see Equation 5.
(5)
where
i,j,k,r country, sector, abatement technology, and parameters related to theoperation of the installation (see above), respectively;
E listed above parameters specific for the considered process;
p country-specific price for (E) parameter of operating costs.
4.2 Constructing a Cost Curve
With the investments, the fixed and the variable operating cost calculated as describedabove, for a given technology (k) in sector (j) total annual costs (Ci,j,k) could be derived:
(6)
with
i,j,k country, sector, and abatement technology, respectively;Ian annualized investment costs;OMfix fixed operating costs;OMvar variable operating costs.
( )∑=
×=n
rrkjirkkji pEOM
1,,,,,,
var
var,,,,,,,, kji
fixkji
ankjikji OMOMIC ++=

46
The unit costs (Uc) of a control option are calculated using its removal efficiency(Equation 7). They are expressed in ECU/ton of VOC removed.
(7)
where:
i,j,k country, sector, and abatement technology, respectively;C total annual cost;ef unabated emission factor;η removal efficiency of the abatement option;α applicability of a given option.
Based on these unit cost, a cost curve is constructed first for every sector and then forthe whole region (country), employing the principle that technologies with higher costsand lower reduction efficiency are considered not cost-efficient and are excluded fromfurther analysis. Marginal costs (Mc), i.e., the costs of removing an additional unit ofVOC by a given control technology, are calculated for each sector (j) along Equation 8.Finally, the remaining (cost-efficient) abatement options are ordered according toincreasing marginal costs and thus form the cost curve for the considered region (i).
(8)
where:
k abatement technology in sector (j) and country (i);
Uc unit cost (see Equation 7);
δ ‘effective’ removal efficiency of considered option (k) that takes intoaccount the applicability factor, i.e., δ = ηCα , where η is the removalefficiency and α its applicability in a given sector and country.
An example cost curve is presented in Table 8 and Figure 2. The first row in Table 8shows initial emissions for a given year and in a given country. The codes of sectors andcontrol technologies are explained in Annex 2. The amount of VOC reduced by aparticular technology can be derived comparing emissions given for this option incolumn "Remaining emissions" with the preceding value. The "Total cost" columndisplays cumulative costs. This means that for any emission level a cost value in thiscolumn represents total costs incurred to achieve this level of emissions. The examplepresented in Table 8 contains only a part of a cost curve, which typically includes some60 to 80 control options ordered according to increasing marginal costs.
A graphical interpretation of Table 8 is presented in Figure 2. Remaining emissions ofVOC are on the x-axis and the total cost on the y-axis. The highest emission value is
kjikjiji
kjikji ef
CUc
,,,,,
,,,, αη ××
=
1
11
−
−−
−−=
kk
kkkkk
UcUcMc
δδδδ

47
called the initial emissions and the lowest level is often referred to as maximum feasiblereduction (MFR). Often in literature a cost curve is presented in different ways whereinstead of remaining emissions, the amount of pollutant reduced is shown on the x-axis.
Table 8: Example of a VOC cost curve
Sector codeControltechnology
Marginal cost[ECU/t VOC]
Reminingemissions
[kt]Total cost[Mio ECU]
1840.5PIS REF 10 1836.6 0.04GLUE HSE 10 1829.3 0.11PRINT_NEW HSE 10 1828.1 0.12PRINT HSE 10 1827.7 0.13REF_PROC LK_I 12 1802.2 0.44PRINT_NEW WBI 59 1796.7 0.76AGR_BURN BAN 60 1765.0 2.67IND_OTH HSE 60 1758.7 3.05IND_P HAM 66 1742.5 4.12PRINT WBI 67 1741.6 4.17D_REFDEP IFC 129 1722.8 6.60DEGR BEMT 144 1718.8 7.17EXD_LQ_NEW VBAL 169 1667.8 15.78REF_PROC LK_I+COWS 211 1662.0 17.02PRINT WBI+HSE+ACA 233 1660.4 17.38D_GASST ST_IB 312 1607.0 34.06
… … … … …
Figure 2: Example of the VOC cost curve for stationary sources
0.0
500.0
1000.0
1500.0
2000.0
2500.0
0.0 200.0 400.0 600.0 800.0 1000.0 1200.0 1400.0 1600.0 1800.0 2000.0
Emissions of NMVOC [kt]
Total costs [Mio ECU]

48
4.3 Summary of Abatement Costs for the Major Control Options
Since the RAINS model includes data for nearly forty countries in Europe and there is agreat variety in values of parameters used to derive costs for these countries, Table 9 canonly present a summary with typical cost ranges for the major control option. The datasets containing detailed information for every region/country is available at the RAINSweb site (http://www.iiasa.ac.at/~rains/databases.html).
Table 9: Typical unit abatement costs of the major categories of VOC abatementmeasures for the source categories distinguished in the RAINS-VOC module
Sector Technology Unit cost range[ECU/t VOC]
Solvent useDry Cleaning Good housekeeping and adsorption
Closed circuit conventional or new machines600-1300
0.5-3/1.2-4.5*103
Degreasing operations Basic emission management techniquesCarbon adsorptionLow temperature plasma processConveyored degreaser with integrated adsorptionWater based systems
< 1501300-22001000-47001700-24001800-4100
Domestic solvent use Substitution ~ 4300
Non-industrial paint use Emulsions/ dispersion paintsWater based paintsHigh solids
~ 0400-800
1000-4000
Industrial paint use /carmanufacturing
Good housekeeping, application technique modificationProcess modification and substitutionAdsorption, incineration
< 2000.6-0.9/1-6.5*103
1.5-2.1/1.3-9*103
Vehicle refinishing Good housekeeping, application technique modificationHousekeeping, application technique, substitution /new inst.
≤ 0< 1000/~3000
Products incorporatingsolvents
ReformulationBasic emission management and end-of-pipe
< 20300-1200
Products not incorporatingsolvents
Solvent management plan and substitutionEnd-of-pipe (adsorption, incineration)
~ 2001200-2500
Pharmaceutical industry Good housekeeping and end-of-pipe 2500-6000
Printing Packaging
Publishing
Screen printing
Offset
Low solvent inks and enclosureWater based inks / (new installations)Enclosure and adsorptionEnclosure and incinerationLow solvent inks and enclosureWater based inks / (new installations)Enclosure and adsorptionWater based inksEnclosure and incinerationWater based inks and biofiltrationPrimary measures‘Solvent free’ inks and solvent management planEnclosure and incineration
20-3030-50/100-300
150-3001150-1650
20-5030-70/350-750
1000-2000500-600
8700-9700750-850
< 20~ 0
1100
Glues and adhesives inindustry
Good housekeepingSubstitutionIncineration
< 20~ 350~ 600

49
Sector Technology Unit cost range[ECU/t VOC]
Preservation of wood Double vacuum impregnation & dryer enclosureAs above plus end-of-pipe
~ 28003800-7400
Other industrial use ofsolvents
Process modification and biofiltrationWater based coating (leather tanning)New agrochemical products
~ 600~ 350
~ 0
Chemical industryOrganic chemical industry,processing and storage
Quarterly / monthly inspection and maintenance programsFlaringIncinerationInternal floating covers and secondary sealsVapor recovery units
~ 1600 / ~ 5800~ 350~ 800
~ 28005600-6200
Liquid fuel extraction, processing and distributionFuel extraction, loading andtransport
Venting alternatives and increased recoveryImproved ignition system on flaresVapor balancing on tankers and loading facilities
1800-22004500-5600
40-300
Refineries Quarterly/ monthly inspection and maintenance programsCovers on oil/water separatorsFlaring / IncinerationInternal floating covers and secondary sealsVapor recovery units (Stage IA) - single/double stage systems
< 100/300-1300200-400200-300
< 1000.7-2.9/0.8-3.3*103
Fuel storage anddistribution
Internal floating covers and secondary sealsVapor recovery units (Stage IA) - single/double stage systemsStage IIStage IB
< 1000.7-2.9/0.8-3.3*103
1500-3300300-800
Transport and combustionGasoline evaporation Small carbon canister 50-6002-stroke engines Oxidation catalyst 900Residential combustion New boilers (fuelwood)
New boilers (other solid fuel)Catalyst (fuelwood)Catalyst (other solid fuel)
100-300100-800
1700-50001800-10000
MiscellaneousFood and drink industry End-of-pipe 10000Agriculture Ban on burning waste 60Other industrial Good housekeeping
Bitumen substitution< 100< 20
Waste disposal Improved landfills 400

50

51
5 ReferencesAAMA (American Automobile Manufacturers Association) (1997) World MotorVehicle Data - 1997 Edition. AAMA, Washington, 1997.
Adler, P. (1993) Reductions of VOC emissions from painting of car bodies in theSwedish car industry. Swedish Environmental Protection Agency, November 1993.
Allemand, N., R. Bouscaren, D. Heslinga, I. Marlowe, C.J. Potter, M. Woodfield, K. H.Zierock (1990) A Costed Evaluation of Options for the Reduction of PhotochemicalOxidant Precursors, Volume 2. - Abatement Technology and Associated Costs. ReportNo. EUR 12537/II EN, Commission of the European Communities, Brussels -Luxembourg.
Bouscaren, R., N. Allemand, W. F. J. M. Engelhard, S. C. Wallin, K.-H. Zierock (1988)Volatile Organic Compounds and Nitrogen Oxides - Cost Effectiveness of MeasuresDesigned to Reduce the Emissions of Precursors of Photochemical Oxidants, Phase 1 -Final Report. Commission of the European Communities, Report No. EUR 11856 EN,May 1988.
Breihofer, D., Mielenz, Rentz, O. (1991) Emission Control of SO2, NOx and VOC atStationary Sources in the Federal Republic of Germany. Institute of IndustrialProduction, University of Karlsruhe. Karlsruhe, May 1991.
BUWAL (Bundesamt für Umwelt, Wald und Landschaft) (1993) Handbuch - für dieKontrolle von Tankstellen mit Gasrückführung. Ausgabe 1993. BUWAL, Bern,Switzerland, 1993 [in German].
BUWAL (Bundesamt für Umwelt, Wald und Landschaft) (1995) Handbuch -Emissiondfaktoren für stationäre Quellen. Ausgabe 1995. BUWAL, Bern, Switzerland,1995 [in German].
Capros, P., Manztos L., Kokkolakis E. and Antoniou Y. (1997) Business as usualscenario for the EU Energy System 1995-2020. Final Report to European Commission,DG-XVII/A2. National Technical University of Athens.
Chem Systems (1996) Further Research into Costs of the Proposed Stage II Controlsand On-board Vapour Recovery. A report prepared for the Department of theEnvironment. London, March 1996.
CITEPA (Centre Interprofessionnel Technique D’etudes de la Pollution Atmospherique)(1994) CORINAIR France 1990, Estimation des Emissions de PollutantsAtmospheriques - rapport final. CITEPA, Paris, June 1994 [in French].
Cofala J., Kurz R., Amann M. (1997) Application of the Current EU Air EmissionsStandards to the Central and Eastern European Countries - An Integrated Assessmentof the Environmental Effects. Draft Final Report to the European Environmental Agency(EEA). IIASA, Laxenburg, Austria, July 1997

52
Cofala, J. and Syri, S. (1998) Nitrogen Oxides Emissions, Abatement Technologies andRelated Costs for Europe in the RAINS Model Database. IIASA Interim Report, IR-98-88. Laxenburg, Austria
Cofala, J. and Syri, S. (1998) Sulfur Dioxide Emissions, Abatement Technologies andRelated Costs for Europe in the RAINS Model Database. IIASA Interim Report, IR-98-89. Laxenburg, Austria
CONCAWE (1988) The control of vehicle evaporative and refuelling emissions - the“on-board” system. Report no. 88/62. The Hague, November 1988.
CONCAWE (1990) Closing the Gasoline System - Control of Gasoline Emissions fromthe Distribution System and Vehicles. Report No. 3/90, CONCAWE, Brussels.
DFIU (Deutsch-Französisches Institut für Umweltforschung) (1996) Proceedings of theWorkshop on VOC Abatement Options and their Costs for Use in Integrated AssessmentModeling. October 28-30, 1996, Karlsruhe, Germany.
EC (European Commission DG-XI) (1994) CORINAIR - Technical annexes, Volume 2 -Default emission factors handbook. EUR 12586/2 EN, Brussels-Luxembourg
EEC (Economic Commission for Europe VOC Task Force) (1990) Emissions of VolatileOrganic Compounds (VOC) from Stationary Sources and Possibilities of their Control.Karlsruhe, July 1990.
EEA (European Environmental Agency) (1996) Joint EMEP/CORINAIR AtmposphericEmission Inventory Guidebook, First Edition. Copenhagen, 1996
EPA (U.S. Environmental Protection Agency) (1992) Control of VOC Emissions fromInk and Paint Manufacturing Processes. EPA-450/3-92-013, April 1992.
EPA (U.S. Environmental Protection Agency) (1994) Control Techniques for VolatileOrganic Compound Emissions from Stationary Sources. Government Institutes, Inc.,Rockville, Maryland, January 1994.
ERM Economics (1996) Costs and Benefits of the Reduction of VOC Emissions fromIndustry. ERM Economics, CHEM Systems, London, May 1996
FAO (1997) Forest products yearbook 1995. FAO Forestry Series No. 30. FAOStatistics Series No. 137. Rome.
Foster, F. O., R. H. Lilie, W. G. Roberts, G. A. van Ophem (1987) Cost-Effectiveness ofHydrocarbon Emission Controls in Refineries from Crude Oil Receipt to ProductDispatch. Report No. 87/52, CONCAWE, Den Haag, January 1987.
Giddings, T.J., Marlowe, I.T., Richardson, S.J. (1991) Reduction of Volatile OrganicCompound Emissions from Industrial Coating and Impregnation of Wooden Surfaces.Final report to the Commission of the European Communities. Report No: IR 313 (PA),28 November, 1991.
Giddings, T.J., Marlowe, I.T., Richardson, S.J., Macdonald, E.K., Okeke, O. (1994)Reduction of Volatile Organic Compound Emissions from Industrial Coating ofMetallic Surfaces Using Carbon Based Materials. Final report to the Commission of theEuropean Communities. Report No: IR 323 (PA), 2 October 1991. Brussels-Luxembourg, 1994.

53
Hein, J., Kippeln, C, Schultmannn, F., Rentz, O. (1994) Assessment of the cost involvedwith the Commission’s draft proposal for a Directive on the limitation of the organicsolvent emissions from the industrial sectors. Final Report: Appendix. Karlsruhe,August 1994.
Heslinga, D.C. (1990) Emission reduction of volatile organic compounds in the metalcleaning and degreasing sector. Final report 90-361, TNO Division of Technology forSociety, Apeldoorn, The Netherlands, December 1990.
IEA (International Energy Agency) (1993) Energy Prices and Taxes - Fourth Quarter1992. OECD/IEA, Paris 1993.
IFARE (French-German Institute for Environmental Research) (1998) Task Force onthe Assessment of Abatement Options/Techniques for Volatile Organic Compounds fromStationary Sources (Part 1 and 2). Draft BAT background document. University ofKarlsruhe, Germany, April 2, 1998
IMF (International Monetary Fund) (1995) International Financial Statistics Yearbook1995. Vol. XLVIII, Washington, 1995.
IRF (International Road Federation) (1993) World Road Statistics 1988-1992 - Edition1993. IRF, Geneva, Switzerland, November 1993.
Jourdan, M., Rentz, O. (1991) Reduction of Volatile Organic Compunds from DryCleaning Facilities. Reprt to the CEC, DG XI. Final Report, Karlsruhe, November1991.
Klaassen, G. (1991) Costs of Controlling Ammonia Emissions in Europe. Status Report(SR-91-02), International Institute for Applied Systems Analysis (IIASA), Laxenburg,Austria, April 1991.
KWS 2000 (1989) Control Strategy for Emissions of Volatile Organic Compounds.Project Group Hydrocarbons 2000. Ministry of Housing, Physical Planning andEnvironment. The Hague, February 1989
KWS 2000 (1993) Strategie 1992-2000. Ministerie van Volkshuisvesting, RuimtelijkeOrdening en Milieubeheer. [in Dutch]
KWS 2000 (1997) Annual Report 1995. InfoMil, Den Haag, March 1997
McArragher, J. S. et. al (1987) An Investigation Into Evaporative HydrocarbonEmissions from European Vehicles. Report No. 87/60, CONCAWE, The Hague.
McGettigan, M. F. (1993): CORINAIR 1990 Emission Inventory for Ireland - FinalReport. Environmental Research Unit, Department of the Environment. Dublin, July1993.
Ministry of Public Works, Transport and the Environment, Secretary of State forEnvironment and Housing, Directorate-General for Environmental Policy (1995)CORINAIR Spain 1990 - Inventory of Emission of Pollutants into the Atmosphere.Volume 2: Analysis by SNAP Emitting Activities. Analysis Estadistico de Datos, S.A.,Madrid, July 1995.
Ministry of Public Works, Transport and the Environment, Secretary of State forEnvironment and Housing, Directorate-General for Environmental Policy (1996)

54
CORINAIR Spain 1991, 1992, 1993 (and revision of 1990) - Inventory of Emission ofPollutants into the Atmosphere. Volume 1: Approach, General Methodology andSynthesis of Results. Volume 2: Analysis by SNAP Emitting Activities. AnalysisEstadistico de Datos, S.A., Madrid, October 1996.
MVMA (Motor Vehicle Manufacturers Association of the United States, Inc.) (1992)World Motor Vehicle Data - 1992 Edition. Washington, 1992.
NUTEK (Swedish National Board for Industrial and Technical Development) (1997)Environmentally-Adapted Local Energy Systems. Report No. B 1997:5. NUTEK,Stockholm, Sweden.
OECD (Organization for Economic Co-operation and Development) (1990) Emissionsof Volatile Organic Compounds from Solvents Usage Operations. Environmentmonographs No. 23. Paris, August 1990
OECD (Organization for Economic Co-operation and Development) (1992) EmissionControl for Nitrogen Oxides and Volatile Organic Compounds - Technology and CostsCompendium. Environment monographs No. 22. Paris, January, 1992
OECD (Organization for Economic Co-operation and Development) (1995) MotorVehicle Pollution. Reduction strategies beyond 2010. OECD, Paris, France
Oonk, J., Jol, A. (1995) Cost-effectiveness of environmental measures in industry -Extended summary. TNO-MEP-R95/335, TNO Institute of Environmental Sciences,Energy Research and Process Innovation. Appledoorn, Netherlands, 23 October 1995.
Passant, N. R. (1993) Emissions of Volatile Organic Compounds from StationarySources in the UK. Warren Spring Laboratory LR990. Stevenage, UK, December 1993
Passant, N. R. and Vincent, K. (1998) Review of the Efficiency and Cost of ControlMeasures for Sulphur Dioxide and Volatile Organic Compounds. Draft final reportAEAT-3851. AEA Technology, Culham, United Kingdom, July 1998
Rentz O., Röll C., Oertel D., Holtman T., Hein J., Karl U. (1993) Minderung der VOC-Emissionen in der Bundesrepublik Deutschland. UBA-FB 104 04 167, May 1993. [inGerman]
Schürmann (1994) Study on the Detailed Methodology of the Determination of VOC-Emissions in Gasoline Distribution (DRAFT). Weyer Verfahrenstechnik, Basel,Switzerland. December 19, 1994. Study on request of Federal Office of Environment,Forests and Landscape, Section Air Pollution Control, Bern, Switzerland.
SHI (Slovak Hydrometeorological Institute) (1994) CORINAIR 90 - Emissions Inventoryfor Slovakia - final report. SHI, Bratislava, 1994.
Umweltministerium Baden-Württemberg (1993) Konzeption zur Minderung der VOC-Emissionen in Baden-Württemberg - Bericht der VOC-Landeskommission. Luft, Boden,Abfall - Heft 21. Karlsruhe, January 1993 [in German].
VROM (Ministerie van Volkshuisvesting, Ruimtelijke Ordening en Milieubeheer)(1995) Emission Reduction by Internal Floating Roofs. Projectbureau KWS 2000. May1995

55
VROM/DGM (Ministerie van Volkshuisvesting, Ruimtelijke Ordening en Milieubeheer- Directoraat-General Milieubeheer) (1995) Kosteneffectiviteit van milieumaatregelen inde industrie - beschrijving van de methodiek, deel A. No. 119. VROM, Den Haag,December 1995. [in Dutch]
VROM/DGM (Ministerie van Volkshuisvesting, Ruimtelijke Ordening en Milieubeheer- Directoraat-General Milieubeheer) (1997) Vervolgonderzoek Kosteneffectiviteit vanMilieumaatregelen in de Industrie - Eindrapportage. VROM, Den Haag, March 1997.[in Dutch]
Wenborn, M. J., Marlowe, I.T., Woodfield, M.J., Passant, N. R., Richardson, S.J.,Emmott, M.A., Warren, R.F., Leggett, S.M., ApSimon, H.M., Smith, S. (1995) VOCEmissions in Europe: An Assessment of the Potential for Abatement and an Estimate ofthe Associated Costs. AEA/CS/20011001/REMA-167/Issue 1. AEA Technology,November 1995.
Williams, L. J., D. Beardshall, P. G. Edgington, F.O. Foster, R.H. Lilie, H.D. Richards(1986): Hydrocarbon Emissions from Gasoline Storage and Distribution Systems.Report No. 85/54, CONCAWE, DenHaag, September 1986.

56

57
6 ANNEX 1
Relation between SNAP nomenclature usedin CORINAIR’90 and RAINS model forNMVOC

58

RAINS 7 - CORINAIR '90 sectors relation (VOC Emission Module)
TRARD Road Transport
LDV Light Duty TrucksCARTRARD7 2 0 ROAD TRANSPORT - LIGHT DUTY VEHICLES < 3.5 t7 2 1 ROAD TRANSPORT - LIGHT DUTY VEHICLES < 3.5 t : HIGHWAY DRIV.7 2 2 ROAD TRANSPORT - LIGHT DUTY VEHICLES < 3.5 t : RURAL DRIVING7 2 3 ROAD TRANSPORT - LIGHT DUTY VEHICLES < 3.5 t : URBAN DRIVING
PASS Passenger CarsCARTRARD7 1 0 ROAD TRANSPORT - PASSENGER CARS7 1 1 ROAD TRANSPORT - PASSENGER CARS : HIGHWAY DRIVING7 1 2 ROAD TRANSPORT - PASSENGER CARS : RURAL DRIVING7 1 3 ROAD TRANSPORT - PASSENGER CARS : URBAN DRIVING
Gasoline EvaporationEVAPTRARD7 6 0 ROAD TRANSPORT - GASOLINE EVAPORATION FROM VEHICLES
Trucks and BussesHDTTRARD7 3 0 ROAD TRANSPORT - HEAVY DUTY VEHICLES > 3.5 t AND BUSES7 3 1 ROAD TRANS. - HEAVY DUTY VEHIC. AND BUSES : HIGHWAY DRIVING7 3 2 ROAD TRANS. - HEAVY DUTY VEHIC. AND BUSES : RURAL DRIVING7 3 3 ROAD TRANS. - HEAVY DUTY VEHIC. AND BUSES : URBAN DRIVING
Motorcycles and MopedsMBIKETRARD7 4 0 ROAD TRANSPORT - MOPEDS AND MOTORCYCLES < 50 CM37 5 0 ROAD TRANSPORT - MOTORCYCLES > 50 CM37 5 1 ROAD TRANSPORT - MOTORCYCLES > 50 CM3 : HIGHWAY DRIVING7 5 2 ROAD TRANSPORT - MOTORCYCLES > 50 CM3 : ROAD DRIVING7 5 3 ROAD TRANSPORT - MOTORCYCLES > 50 CM3 : URBAN DRIVING
TROTH Other Transport
Air Transport (LTO only)AIRTROTH8 5 0 OTHER MOB. SOURCES - AIRPORTS (LTO cycles and ground act.)
Off-Road VehiclesOFFTROTH8 1 0 OTHER MOB. SOURCES - OFF ROAD VEHICLES AND MACHINES8 1 1 OTHER MOB. SOURCES - OFF ROAD VEHIC. AND MACHINES: AGRICULT.8 1 2 OTHER MOB. SOURCES - OFF ROAD VEHIC. AND MACHINES: FORESTRY8 1 3 OTHER MOB. SOURCES - OFF ROAD VEHIC. AND MACHINES: INDUSTRY8 1 4 OTHER MOB. SOURCES - OFF ROAD VEHIC. AND MACHINES: MILITARY8 1 5 OTHER MOB. SOURCES - HOUSEHOLD / GARDENING8 2 0 OTHER MOB. SOURCES - RAILWAYS
ShipsSHIPTROTH8 3 0 OTHER MOB. SOURCES - INLAND WATERWAYS8 4 0 OTHER MOB. SOURCES - MARINE ACTIVITIES8 4 1 OTHER MOB. SOURCES - MARINE ACTIVITIES: HARBOURS8 4 2 OTHER MOB. SOURCES - MARINE ACTIVITIES: NATIONAL SEA TRAFFIC8 4 3 OTHER MOB. SOURCES - MARINE ACTIVITIES: NATIONAL FISHING
08/09/00 Page 1klimont d:\corindat\voc_sr7.qpr

RAINS 7 - CORINAIR '90 sectors relation (VOC Emission Module)
SOLV Solvent Use
Solvent Use in Chemical IndustryCHEMSOLV6 3 0 SOLVENT USE - CHEMICALS PRODUCTS MANUFACTURING OR PROCESSING
PHARM Pharmaceutical IndustryCHEMSOLV6 3 6 SOLVENT USE - CHEMICAL PRODUCTS : PHARMACEUTICAL PROD. MANU.
PIS Products Incorporating SolventsCHEMSOLV6 3 10 SOLVENT USE - CHEMICAL PRODUCTS : ASPHALT BLOWING6 3 11 SOLVENT USE - CHEMICAL PRODUCTS : ADHESIVE TAPES MANUFACT.6 3 7 SOLVENT USE - CHEMICAL PRODUCTS : PAINTS MANUFACTURING6 3 8 SOLVENT USE - CHEMICAL PRODUCTS : INKS MANUFACTURING6 3 9 SOLVENT USE - CHEMICAL PRODUCTS : GLUES MANUFACTURING
PNIS Products not Incorporating SolventsCHEMSOLV6 3 1 SOLVENT USE - CHEMICAL PRODUCTS : POLYESTER PROCESSING6 3 2 SOLVENT USE - CHEMICAL PRODUCTS : POLYVINYLCHLORIDE PROCESS.6 3 3 SOLVENT USE - CHEMICAL PRODUCTS : POLYURETHANE PROCESSING6 3 4 SOLVENT USE - CHEMICAL PRODUCTS : POLYSTYRENE FOAM PROCESS.6 3 5 SOLVENT USE - CHEMICAL PRODUCTS : RUBBER PROCESSING
Surface CleaningCLEANSOLV6 2 0 SOLVENT USE - DEGREASING AND DRY CLEANING
DEGR Metal DegreasingCLEANSOLV6 2 1 SOLVENT USE - METAL DEGREASING
DRY Dry CleaningCLEANSOLV6 2 2 SOLVENT USE - DRY CLEANING
DOM Domestic Solvent Use (other than paint)OTHERSOLV6 4 8 SOLVENT USE - DOMESTIC SOLVENT USE (other than paint appl.)
GLUE Application of Glues, Ahesives in IndustryOTHERSOLV6 4 5 SOLVENT USE - APPLICATION OF GLUES AND ADHESIVES
IND Other Use of Solvents in IndustryOTHERSOLV6 4 0 SOLVENT USE - OTHER USE OF SOLVENTS AND RELATED ACTIVITIES6 4 1 SOLVENT USE - GLASS WOOL ENDUCTION6 4 2 SOLVENT USE - MINERAL WOOL ENDUCTION6 4 4 SOLVENT USE - FAT EDIBLE AND NON EDIBLE OIL EXTRACTION
VEHTR Treatment of VehiclesOTHERSOLV6 4 7 SOLVENT USE - UNDERSEAL TREATMENT OF VEHICLES6 4 9 SOLVENT USE - VEHICLES DEWAXING
WOOD Preservation of WoodOTHERSOLV6 4 6 SOLVENT USE - PRESERVATION OF WOOD
Paint ApplicationPAINTSOLV6 1 0 SOLVENT USE - PAINT APPLICATION
08/09/00 Page 2klimont d:\corindat\voc_sr7.qpr

RAINS 7 - CORINAIR '90 sectors relation (VOC Emission Module)
SOLV Solvent Use
ARCH Architectural paintingPAINTSOLV6 1 3 SOLVENT USE - PAINT APPLICATION : CONSTRUCTION AND BUILDINGS
AUTO Manufacture of AutomobilesPAINTSOLV6 1 1 SOLVENT USE - PAINT APPLICATION : MANUFACTURE OF AUTOMOBILES
DOM Domestic UsePAINTSOLV6 1 4 SOLVENT USE - PAINT APPLICATION : DOMESTIC USE
IND Industrial UsePAINTSOLV6 1 2 SOLVENT USE - PAINT APPLICATION : OTHER INDUS. APPLICATION
Printing IndustryPRINTSOLV6 4 3 SOLVENT USE - PRINTING INDUSTRY
CHEM Chemical Industry
Inorganic Chemical IndustryINORGCHEM4 4 0 PRODUCTION PROC. - INORGANIC CHEMICAL INDUSTRY4 4 1 PRODUCTION PROC. - SULFURIC ACID4 4 2 PRODUCTION PROC. - NITRIC ACID4 4 3 PRODUCTION PROC. - AMMONIA4 4 4 PRODUCTION PROC. - AMMONIUM SULPHATE4 4 7 PRODUCTION PROC. - NPK FERTILISERS4 4 8 PRODUCTION PROC. - UREA4 4 9 PRODUCTION PROC. - CARBON BLACK
Organic Chemical Industry - Processing and StorageORGANCHEM4 5 0 PRODUCTION PROC. - ORGANIC CHEMICAL INDUSTRY
PROC Organic Chemical Industry - ProcessingORGANCHEM4 5 1 PRODUCTION PROC. - ETHYLENE4 5 10 PRODUCTION PROC. - STYRENE4 5 11 PRODUCTION PROC. - POLYSTYRENE4 5 12 PRODUCTION PROC. - STYRENE BUTADIENE4 5 13 PRODUCTION PROC. - STYRENE-BUTADIENE LATEX4 5 14 PRODUCTION PROC. - STYRENE-BUTADIENE RUBBER (SBR)4 5 15 PRODUCTION PROC. - ACRYLONIT. BUTADIENE STYRENE (ABS) RESINS4 5 16 PRODUCTION PROC. - ETHYLENE OXYDE4 5 17 PRODUCTION PROC. - FORMALDEHYDE4 5 18 PRODUCTION PROC. - ETHYLBENZENE4 5 19 PRODUCTION PROC. - PHTALIC ANHYDRIDE4 5 2 PRODUCTION PROC. - PROPYLENE4 5 20 PRODUCTION PROC. - ACRYLONITRILE4 5 21 PRODUCTION PROC. - ADIPIC ACID4 5 3 PRODUCTION PROC. - 1,2 DICHLOROETHANE (except 040505)4 5 4 PRODUCTION PROC. - VINYLCHLORIDE (except 040505)4 5 5 PRODUCTION PROC. - 1,2 DICHLOROETH.+VINYLCHL.(balanced proc)4 5 6 PRODUCTION PROC. - POLYETHYLENE LOW DENSITY4 5 7 PRODUCTION PROC. - POLYETHYLENE HIGH DENSITY4 5 8 PRODUCTION PROC. - POLYVINYLCHLORIDE4 5 9 PRODUCTION PROC. - POLYPROPYLENE
08/09/00 Page 3klimont d:\corindat\voc_sr7.qpr

RAINS 7 - CORINAIR '90 sectors relation (VOC Emission Module)
CHEM Chemical Industry
STORE Storage and Handling of Chemical ProductsORGANCHEM4 5 22 PRODUCTION PROC. - STORAGE AND HANDLING OF CHEMICAL PRODUCTS
REF Refineries
RefineriesREF4 1 0 PRODUCTION PROCESSES - PETROLEUM INDUSTRIES
Refineries - ProcessPROCREF4 1 1 PRODUCTION PROC. - PETROLEUM PRODUCTS PROCESSING4 1 2 PRODUCTION PROC. - FLUID CATALYTIC CRACKING - CO BOILER4 1 3 PRODUCTION PROC. - SULPHUR RECOVERY PLANTS
GDIST Gasoline Distribution
Gasoline DistributionGDIST5 5 0 GASOLINE DISTRIBUTION
Service StationsGASSTGDIST5 5 3 GASOLINE DISTRIBUTION - SERVICE STATIONS (incl. refuelling)
Refinery (storage), Transport, DepotsREFDPGDIST4 1 4 PRODUCTION PROC. - STORAGE & HANDL. OF PRODUCTS IN REFINERY5 5 1 GASOLINE DISTRIBUTION - REFINERY DISPATCH STATION5 5 2 GASOLINE DISTRIB. - TRANSP. AND DEPOTS (exc. serv. station)
COMB Stationary Combustion
Industrial CombustionINDCOMB3 1 0 INDUS. COMBUS. IN BOILERS, GAS TURBINES AND STATION. ENGINES3 1 1 INDUSTRIAL COMBUSTION - PLANTS = 300 MW3 1 2 INDUSTRIAL COMBUSTION - PLANTS = 50 MW AND < 300 MW3 1 3 INDUSTRIAL COMBUSTION - PLANTS < 50 MW3 1 4 INDUSTRIAL COMBUSTION - GAS TURBINES3 1 5 INDUSTRIAL COMBUSTION - STATIONARY ENGINES3 2 0 INDUSTRIAL COMBUSTION - PROCESS FURNACES WITHOUT CONTACT3 2 1 INDUSTRIAL COMBUSTION - REFINERY PROCESSES FURNACES3 2 2 INDUSTRIAL COMBUSTION - COKE OVEN FURNACES3 2 3 INDUSTRIAL COMBUSTION - BLAST FURNACES COWPERS3 2 4 INDUSTRIAL COMBUSTION - PLASTER FURNACES3 3 0 INDUSTRIAL COMBUSTION - PROCESSES WITH CONTACT3 3 1 INDUSTRIAL COMBUSTION - SINTER PLANT3 3 10 INDUSTRIAL COMBUSTION - SECONDARY ALUMINIUM PRODUCTION3 3 11 INDUSTRIAL COMBUSTION - CEMENT3 3 12 INDUSTRIAL COMBUSTION - LIME3 3 13 INDUSTRIAL COMBUSTION - ASPHALT CONCRETE PLANTS3 3 14 INDUSTRIAL COMBUSTION - FLAT GLASS3 3 15 INDUSTRIAL COMBUSTION - CONTAINER GLASS3 3 16 INDUSTRIAL COMBUSTION - GLASS WOOL3 3 17 INDUSTRIAL COMBUSTION - OTHER GLASS3 3 18 INDUSTRIAL COMBUSTION - MINERAL WOOL3 3 19 INDUSTRIAL COMBUSTION - BRICKS AND TILES
08/09/00 Page 4klimont d:\corindat\voc_sr7.qpr

RAINS 7 - CORINAIR '90 sectors relation (VOC Emission Module)
COMB Stationary Combustion
Industrial CombustionINDCOMB3 3 2 INDUSTRIAL COMBUSTION - REHEATING FURNACES STEEL AND IRON3 3 20 INDUSTRIAL COMBUSTION - FINE CERAMICS MATERIALS3 3 21 INDUSTRIAL COMBUSTION - PAPER MILL INDUSTRY (DRYING PROCES.)3 3 22 INDUSTRIAL COMBUSTION - ALUMINA PRODUCTION3 3 23 INDUSTRIAL COMBUSTION - MAGNESIUM (DOLOMITE TREATMENT)3 3 3 INDUSTRIAL COMBUSTION - GRAY IRON FOUNDRIES3 3 4 INDUSTRIAL COMBUSTION - PRIMARY LEAD PRODUCTION3 3 5 INDUSTRIAL COMBUSTION - PRIMARY ZINC PRODUCTION3 3 6 INDUSTRIAL COMBUSTION - PRIMARY COPPER PRODUCTION3 3 7 INDUSTRIAL COMBUSTION - SECONDARY LEAD PRODUCTION3 3 8 INDUSTRIAL COMBUSTION - SECONDARY ZINC PRODUCTION3 3 9 INDUSTRIAL COMBUSTION - SECONDARY COPPER PRODUCTION
Public Power, Cogeneration and District HeatingPPCOMB1 1 0 PUBLIC POWER AND COGENERATION PLANTS1 1 1 PUBLIC POWER AND COGENERATION - COMBUSTION PLANTS = 300 MW1 1 2 PUBLIC POWER AND COGENER. - COMBUS. PLANTS = 50 AND < 300 MW1 1 3 PUBLIC POWER AND COGENERATION - COMBUSTION PLANTS < 50 MW1 1 4 PUBLIC POWER AND COGENERATION - GAS TURBINES1 1 5 PUBLIC POWER AND COGENERATION - STATIONARY ENGINES1 2 0 DISTRICT HEATING PLANTS1 2 1 DISTRICT HEATING - COMBUSTION PLANTS = 300 MW1 2 2 DISTRICT HEATING - COMBUSTION PLANTS = 50 MW AND < 300 MW1 2 3 DISTRICT HEATING - COMBUSTION PLANTS < 50 MW1 2 4 DISTRICT HEATING - GAS TURBINES1 2 5 DISTRICT HEATING - STATIONARY ENGINES
Commercial and Residential CombustionRESIDCOMB2 0 1 COMMERCIAL, INSTIT. AND RESID. - COMBUSTION PLANTS = 50 MW2 0 2 COMMERCIAL, INSTIT. AND RESID. - COMBUSTION PLANTS < 50 MW2 0 3 COMMERCIAL, INSTIT. AND RESID. - GAS TURBINES2 0 4 COMMERCIAL, INSTIT. AND RESID. - STATIONARY ENGINES
MISC Miscellaneous sources
BURN Stubble Burning and Other Agr. WasteAGRMISC10 3 0 AGRICULTURE - STUBBLE BURNING9 7 0 W.T.D. - OPEN BURNING OF AGRICULTURAL WASTES (except 10.03)
Food and Drink IndustryFOODMISC4 6 5 PRODUCTION PROC. - BREAD4 6 6 PRODUCTION PROC. - WINE4 6 7 PRODUCTION PROC. - BEER4 6 8 PRODUCTION PROC. - SPIRITS
Other Industrial SourcesINDMISC4 2 0 PRODUCTION PROC. - IRON AND STEEL INDUSTRIES AND COLLIERIES4 2 1 PRODUCTION PROC. - COKE OVEN4 2 2 PRODUCTION PROC. - BLAST FURNACE CHARGING4 2 3 PRODUCTION PROC. - PIG IRON TAPPING4 2 4 PRODUCTION PROC. - SOLID SMOKELESS FUEL4 2 5 PRODUCTION PROC. - OPEN HEARTH FURNACE STEEL PLANT
08/09/00 Page 5klimont d:\corindat\voc_sr7.qpr

RAINS 7 - CORINAIR '90 sectors relation (VOC Emission Module)
MISC Miscellaneous sources
Other Industrial SourcesINDMISC4 2 6 PRODUCTION PROC. - BASIC OXYGEN FURNACE4 2 7 PRODUCTION PROC. - ELECTRIC FURNACE STEEL PLANT4 2 8 PRODUCTION PROC. - ROLLING MILLS4 3 0 PRODUCTION PROC. - NON FERROUS METAL INDUSTRY4 3 1 PRODUCTION PROC. - ALUMINIUM PRODUCTION (electrolysis)4 3 2 PRODUCTION PROC. - FERRO ALLOYS4 3 3 PRODUCTION PROC. - SILICIUM PRODUCTION4 6 0 PRODUCTION PROC. - WOOD,PAPER PULP,FOOD,DRINK & OTHER IND.4 6 1 PRODUCTION PROC. - CHIPBOARD4 6 10 PRODUCTION PROC. - ASPHALT ROOFING MATERIALS4 6 11 PRODUCTION PROC. - ROAD PAVING WITH ASPHALT4 6 12 PRODUCTION PROC. - CEMENT4 6 13 PRODUCTION PROC. - GLASS4 6 14 PRODUCTION PROC. - LIMES4 6 2 PRODUCTION PROC. - PAPER PULP (kraft process)4 6 3 PRODUCTION PROC. - PAPER PULP (acid sulfite process)4 6 4 PRODUCTION PROC. - PAPER PULP (neutral sulphite semi-chemi.)4 7 0 PRODUCTION PROC. - COOLING PLANTS
Waste Treatment and DisposalWASTEMISC9 1 0 WASTE TREATMENT AND DISPOSAL - WASTE WATER TREATMENT9 2 0 WASTE TREATMENT AND DISPOSAL - WASTE INCINERATION9 2 1 WASTE TREAT. AND DISP. - INCINER. DOMESTIC/MUNICIPAL WASTES9 2 2 WASTE TREAT. AND DISP. - INCINERATION OF INDUSTRIAL WASTES9 2 3 WASTE TREATMENT AND DISPOSAL - FLARING IN OIL INDUSTRY9 2 4 WASTE TREAT. AND DISP. - FLARING IN CHEMICAL INDUSTRIES9 2 5 WASTE TREAT. AND DISP. - INCINER. OF SLUDGES FROM WATER TR.9 3 0 WASTE TREATMENT AND DISPOSAL - SLUDGE SPREADING9 4 0 WASTE TREATMENT AND DISPOSAL - LAND FILLING9 6 0 WASTE TREATMENT AND DISPOSAL - BIOGAS PRODUCTION
NAT Nature
NatureVOCNAT11 1 0 NATURE - DECIDUOUS FORESTS11 1 1 NATURE - DECIDUOUS FORESTS : HIGH ISOPRENE EMITTERS11 1 2 NATURE - DECIDUOUS FORESTS : LOW ISOPRENE EMITTERS11 1 3 NATURE - DECIDUOUS FORESTS : NON ISOPRENE EMITTERS11 10 0 NATURE - HUMANS11 2 0 NATURE - CONIFEROUS FORESTS11 3 0 NATURE - FOREST FIRES11 4 0 NATURE - NATURAL GRASSLAND
08/09/00 Page 6klimont d:\corindat\voc_sr7.qpr

RAINS 7 - CORINAIR '90 sectors relation (VOC Emission Module)
NA Not Applicable
Not ApplicableVOCNA10 1 0 AGRICULTURE - CULTURES WITH FERTILIZERS except animal manure10 1 1 AGRICULTURE - CULTURES WITH FERTILIZERS : PERMANENT CROPS10 1 2 AGRICULTURE - CULTURES WITH FERTILIZERS : ARABLE LAND CROPS10 1 3 AGRICULTURE - CULTURES WITH FERTILIZERS : RICE FIELD10 1 4 AGRICULTURE - CULTURES WITH FERTILIZERS : MARKET GARDENING10 1 5 AGRICULTURE - CULTURES WITH FERTILIZERS : GRASSLAND10 1 6 AGRICULTURE - CULTURES WITH FERTILIZERS : FALLOWS10 2 0 AGRICULTURE - CULTURES WITHOUT FERTILIZERS10 2 1 AGRICULTURE - CULTURES WITHOUT FERTILIZERS : PERMANENT CROPS10 2 2 AGRICULTURE - CULTURES WITHOUT FERTILIZ. : ARABLE LAND CROPS10 2 3 AGRICULTURE - CULTURES WITHOUT FERTILIZERS : RICE FIELD10 2 4 AGRICULTURE - CULTURES WITHOUT FERTILIZ. : MARKET GARDENING10 2 5 AGRICULTURE - CULTURES WITHOUT FERTILIZERS : GRASSLAND10 2 6 AGRICULTURE - CULTURES WITHOUT FERTILIZERS : FALLOWS10 4 0 AGRICULTURE - ANIMAL BREEDING (enteric fermentation)10 4 1 AGRICULTURE - ANIMAL BREEDING (enteric ferm.) : DAIRY COWS10 4 2 AGRICULTURE - ANIMAL BREEDING (enteric ferm.) : OTHER CATTLE10 4 3 AGRICULTURE - ANIMAL BREEDING (enteric fermentat.) : OVINES10 4 4 AGRICULTURE - ANIMAL BREEDING (enteric fermentation) : PIGS10 4 5 AGRICULTURE - ANIMAL BREEDING (enteric fermentat.) : HORSES10 4 6 AGRICULTURE - ANIMAL BREEDING (enteric fermentation) : ASSES10 4 7 AGRICULTURE - ANIMAL BREEDING (enteric fermentation) : GOATS10 5 0 AGRICULTURE - ANIMAL BREEDING (excretions)10 5 1 AGRICULTURE - ANIMAL BREEDING (excretions) : DAIRY COWS10 5 10 AGRICULTURE - ANIMAL BREEDING (excretions) : FUR ANIMALS10 5 2 AGRICULTURE - ANIMAL BREEDING (excretions) : OTHER CATTLE10 5 3 AGRICULTURE - ANIMAL BREEDING (excretions) : FATTENING PIGS10 5 4 AGRICULTURE - ANIMAL BREEDING (excretions) : SOWS10 5 5 AGRICULTURE - ANIMAL BREEDING (excretions) : SHEEP10 5 6 AGRICULTURE - ANIMAL BREEDING (excretions) : HORSES10 5 7 AGRICULTURE - ANIMAL BREEDING (excretions) : LAYING HENS10 5 8 AGRICULTURE - ANIMAL BREEDING (excretions) : BROILERS10 5 9 AGRICULTURE - ANIMAL BREEDING (excretions) : OTHER POULTRY11 5 0 NATURE - HUMID ZONES11 5 1 NATURE - HUMID ZONES : UNDRAINED AND BRACKISH MARSHES11 5 2 NATURE - HUMID ZONES : DRAINED MARSHES11 5 3 NATURE - HUMID ZONES : RAISED BOGS11 6 0 NATURE - WATERS11 6 1 NATURE - LAKES11 6 2 NATURE - SHALLOW SALTWATERS11 6 3 NATURE - GROUND WATERS11 6 4 NATURE - DRAINAGE WATERS11 6 5 NATURE - RIVERS11 6 6 NATURE - DITCHES AND CANALS11 6 7 NATURE - OPEN SEA (> 6m)11 7 0 NATURE - ANIMALS11 7 1 NATURE - ANIMALS : TERMITES11 7 2 NATURE - ANIMALS : MAMMALS11 8 0 NATURE - VOLCANOES11 9 0 NATURE - NEAR SURFACE DEPOSITS4 3 4 PRODUCTION PROC. - MAGNESIUM4 4 10 PRODUCTION PROC. - TITANIUM DIOXIDE
08/09/00 Page 7klimont d:\corindat\voc_sr7.qpr

RAINS 7 - CORINAIR '90 sectors relation (VOC Emission Module)
NA Not Applicable
Not ApplicableVOCNA4 4 11 PRODUCTION PROC. - GRAPHITE4 4 12 PRODUCTION PROC. - CALCIUM CARBIDE4 4 5 PRODUCTION PROC. - AMMONIUM NITRATE4 4 6 PRODUCTION PROC. - AMMONIUM PHOSPHATE4 6 9 PRODUCTION PROC. - BARK GASIFIER5 1 0 EXTRACTION AND 1ST TREATMENT OF SOLID FUELS5 1 1 EXTRACT. AND 1ST TREAT. OF SOLID FUELS - OPEN CAST MINING5 1 2 EXTRACT. AND 1ST TREAT. OF SOLID FUELS - UNDERGROUND MINING5 1 3 EXTRACT. AND 1ST TREAT. OF SOLID FUELS - STORAGE9 5 0 WASTE TREATMENT AND DISPOSAL - COMPOST PRODUCTION FROM WASTE9 8 0 WASTE TREATMENT AND DISPOSAL - LATRINES
08/09/00 Page 8klimont d:\corindat\voc_sr7.qpr

67
7 ANNEX 2
Explanation of abbreviations (codes) usedin RAINS-VOC model

68

69
Types of explanatory variables used in RAINS-VOC model
Name Code UnitBrown coal/lignite, high grade BC1 PJ
Brown coal/lignite, low grade BC2 PJ
Hard coal, high quality HC1 PJ
Hard coal, medium quality HC2 PJ
Hard coal, low quality HC3 PJ
Derived coal (coke, briquettes) DC PJ
Other solid-low S (biomass, waste, wood) OS1 PJ
Other solid-high S (incl. high S waste) OS2 PJ
Heavy fuel oil HF PJ
Medium distillates (diesel,light fuel oil) MD PJ
Light fractions (gasoline,kerosen,naphta,LPG) LF PJ
Natural gas (incl. other gases) GAS PJ
Renewable (solar, wind, small hydro) REN PJ
Hydro HYD PJ
Nuclear NUC PJ
Electricity ELE PJ
Heat (steam, hot water) HT PJ
Textiles (clothing) TEX kt
Solvents SLV kt
Population POP mln cap
Paint use PNT kt
Vehicles VEH kveh
Paint and glue produced PG kt
Emissions of NMVOC EMI kt
Crude oil CRU Mt

70
Sectors distinguished in the RAINS-VOC model
Code NameCAR_EVAP Evaporative emissions from cars
EXD_GAS Extraction, processing and distribution of gaseous fuelsEXD_GAS_NEW Distribution of gaseous fuels - new mains
EXD_LQ Extraction, processing and distribution of liquid fuelsEXD_LQ_NEW Extraction, processing, distribution of liquid fuels
(including new Loading and Unloading practices)REF_PROC Refineries - process
D_GASST Gasoline distribution - service stationsD_REFDEP Gasoline distribution - transport and depots (including storage at refinery)
DRY Dry cleaningDRY_NEW Dry cleaning (new installations)
DEGR DegreasingDEGR_NEW Degreasing (new installations)
VEHTR Treatment of vehicles (underseal treatment and dewaxing)DOM_OS Domestic use of solvents (other than paint)ARCH_P Architectural use of paintsDOM_P Domestic use of paints
AUTO_P Manufacture of automobilesAUTO_P_NEW Manufacture of automobiles (new installations)
VEHR_P Vehicle refinishingVEHR_P_NEW Vehicle refinishing (new installations)
IND_P Other industrial use of paintsPIS Products incorporating solvents
PNIS Products not incorporating solventsPHARMA Pharmaceutical industry
PRT_PACK Flexography and rotogravure in packagingPRT_PACK_NEW Flexography and rotogravure in packaging (new installations)
PRT_OFFS Printing, offsetPRT_OFFS_NEW Printing, offset (new installations)
PRT_PUB Rotogravure in publicationPRT_PUB_NEW Rotogravure in publication (new installations)
PRT_SCR Screen printingPRT_SCR_NEW Screen printing (new installations)
IND_OS Other industrial use of solventsWOOD Preservation of wood
WOOD_NEW Preservation of wood (new installations)GLUE Application of glues and adhesives in industry
INORG Inorganic chemical industryORG_PROC Organic chemical industry, process
ORG_STORE Organic chemical industry, storagePP_EX_WB Power plants, existing wet bottom
PP_EX_OTH Power plants, existing otherPP_NEW New power plants
CON_COMB ConversionIN_BO Industrial boilersIN_OC Other industrial combustionRESID Combustion in residential and commercial sector

71
Sectors distinguished … continued
Code NameFOOD Food and drink industry
AGR_BURN Stubble burning and other agricultural wasteIND_OTH Other industrial sources
WASTE Waste treatment and disposalTRA_OTS_M Transport other, medium size shipsTRA_OTS_L Transport other, large size ships
TRA_RD_LF2 Transport road - two-stroke enginesTRA_OT_LF2 Transport other - two-stroke engines
TRA_AIR Air transport (LTO)

72
Codes of control technologies distinguished in RAINS-VOC model
Name of control option CodeNo control NoC
Quarterly inspection and maintenance programs LK_IMonthly inspection and maintenance programs LK_II
Covers on oil/water separators COWSIncineration of emissions in a flare and incinerator FLR-I
Quarterly inspection, covers on oil/water separators, flaring LK_I+CS+FLRMonthly inspection, covers on oil/water separators, flaring LK_II+CS+FLR
Quarterly inspection, covers on oil/water separator, flaring, incineration LK_I+CS+FLR-IMonthly inspection, covers on oil/water separator, flaring, incineration LK_II+CS+FLR-I
Small carbon canister (in cars) SCCStage II controls at service stations ST_II
Stage IB controls at service stations ST_IBStage II and IB at service station ST(II+IB)
Internal floating covers or secondary seals IFCStage IA (single stage) at gasoline depots ST_IAS
Stage IA (double stage) at gasoline depots ST_IADIFC and Stage IA (single stage) controls IFC+ST_IAS
IFC and Stage IA (double stage) controls IFC+ST_IADVapor balancing on tankers and loading facilities VBAL
Alternatives and increased recovery for venting V_ALTImproved ignition systems on flares F_IMP
Vapor balancing and alternatives for venting VBAL+V_ALTVapor balancing and alternatives for venting and flaring VBAL+VF_ALT
Good housekeeping and carbon adsorption HSE+ACAConventional closed circuit machine CCCM
New generation closed circuit machine NCCMActivated carbon adsorption ACA
Basic emissions management techniques BEMTWater-based system, degreasing WBS
Low temperature plasma process LTPPConveyored degreaser with integrated carbon adsorption CD_ACA
Basic emissions management techniques and carbon adsorption BEMT+ACABasic emissions management techniques and water-based system BEMT+WBS
Basic emissions management, conveyored degreaser with ACA BEMT+CD_ACABasic management, water system, conveyored degreaser with ACA BEMT+WBS+CD_ACA
Basic management, water system, adsorption BEMT+WBS+ACAPlasma process, water system, basic emission management LTPP+WBS+BEMT
Water-based system, adsorption WBS+ACAConveyored degreaser with ACA, water-based system WBS+CD_ACA
Water-based system, plasma process WBS+LTPPProduct reformulation REF
Propellant insert - e.g. replacement with nitrogen P_INSProduct reformulation and propellant insert REF+P_INS
Water-based paints (not emulsions) WBHigh-solids paints HS
Emulsions, water-based dispersion paints EMUEmulsions and high-solids paints EMU+HS

73
Codes of control technologies… continued
Name of control option CodeEmulsions and water-based paints EMU+WB
Emulsions, water-based and high-solid paints EMU+WB+HSProcess modification and substitution PRM+SUB
Adsorption, incineration A_INCProcess modification, substitution, adsorption, incineration PRM+SUB+A_INC
High volume low pressure spray guns HVLPImproved application (HVLP) and other primary (SMP, gunwash) HAMP
Primary measures and 25% of high solids and water based paints HAMP+SUB1Substitution with 40% high solids, 60% water based paints SUB2
Primary measures and 40% high solids, 60% water based paints HAMP+SUB2Good housekeeping and improved application (primary measures) HAM
Substitution of high solvent with low solvent products SUBGood housekeeping, improved application and substitution HAM+SUBGood housekeeping, improved application and end-of-pipe HAM+A_INC
Primary measures, end-of-pipe and substitution on remaining capacity HAM+A_INC-SUBBasic emission management measures, adsorption or incineration BEMT+A_INCEmission management, reformulation, adsorption or incineration REF+BEMT+A_INC
Solvent management plan and substitution SMP+SUBSolvent management, substitution, adsorption or incineration SMP+SUB+A_INC
Good housekeeping HSEIncineration INC
Good housekeeping and catalytic or thermal incineration HSE+INCSwitch from cutback to emulsion bitumen (road paving) BISUB
Good housekeeping in steel industry and switch to emulsion bitumen HSE+BISUBBan of stubble burning BAN
Improved landfills I_LANDFlaring FLR
Quarterly inspection and maintenance programs and flaring LK_I+FLRQuarterly inspection and maintenance programs and incineration LK_I+INC
Quarterly inspection and maintenance, flaring, incineration LK_I+FLR+INCMonthly inspection and maintenance programs and flaring LK_II+FLR
Monthly inspection and maintenance programs and incineration LK_II+INCMonthly inspection and maintenance, flaring, incineration LK_II+FLR+INC
Vapor recovery unit (single stage) VRU_IVapor recovery unit (double stage) VRU_II
Internal floating covers or secondary seals, vapor recovery (single stage) IFC+VRU_IInternal floating covers or secondary seals, vapor recovery (double stage) IFC+VRU_II
Good housekeeping and substitution HSE+SUBGood housekeeping, substitution, thermal or catalytic incineration HSE+SUB+INC
Process modification PRMProcess modification and biofilatration PRM+BIO
Waterborne coating for leather WBCAgrochemicals - new products NAGR
Primary, biofiltration, waterborne coating and new agrochemical P_BIO+WBC+NAGRDouble vacuum impregnation system and enclosure of the dryer DVS+ENC
Double vacuum impregnation, dryer enclosure, adsorption DVS+ENC+ACADouble vacuum impregnation, dryer enclosure, incineration DVS+ENC+INC

74
Codes of control technologies… continued
Name of control option CodeLow solvent inks LSIWater based inks WBI
Low solvent or water based inks LSWBILow solvent inks and enclosure LSI+ENC
Enclosure and incineration ENC+INCEnclosure and adsorption ENC+ACA
Low solvent inks, enclosure and incineration LSI+ENC+INCLow solvent inks, enclosure and adsorption LSI+ENC+ACA
Water based inks, enclosure and incineration WBI+ENC+INCWater based inks, enclosure and adsorption WBI+ENC+ACA
Low solvent/water based inks, enclosure and incineration LSWBI+ENC+INCLow solvent/water based inks, enclosure and adsorption LSWBI+ENC+ACA
Low solvent inks, enclosure and incineration or adsorption LSI+ENC+INC-ACAWater based inks, enclosure and incineration or adsorption WBI+ENC+INC-ACALow solvent/water based inks and incineration/adsorption LSWBI+ENC+INC-A
Water based inks, incineration (for new installations with enclosure) WBI+INCPrimary measures in offset printing, including enclosure PMOF
Solvent free inks and solvent management plant SF+SMPPrimary measures (offset) and incineration PMOF+INC
Primary measures (offset) and solvent free inks PMOF+SFPrimary measures (offset), solvent free inks, incineration PMOF+SF-INC
Water based inks and biofiltration (large installations) WBI+BIOWater based inks, enclosure and incineration or biofltration WBI+ENC+INC-BIO
New, improved small (residential) boiler with accumulator tank NBOxidation catalyst for small (residential) combustion boilers CAT
New boiler and oxidation catalyst NB+CATOxidation catalyst for two-stroke engines OX_CAT