Embed Size (px)
Citation preview

INTERIM MANAGEMENT REPORTFOR THE PERIOD ENDED JUNE 30, 2019
2019

#1FASHION & LIFESTYLE DESTINATION IN GROWTH MARKETS.
GFG was founded in 2014. Since then we have been dedicated to being the #1 fashion and lifestyle destination in our markets. Over the years we have grown into a truly diverse workforce that’s focused on creating inspiring and seamless customer experiences. Through our own technology enabled platform and infrastructure and partnerships with over 10,000 fashion & lifestyle brands, we offer relevant and curated products in an environment that’s tailored to local market needs.
H1 IN
TERI
M M
ANAG
EMEN
T RE
PORT
| G
LOBA
L FA
SHIO
N GR
OUP
INTERIM GROUP MANAGEMENT REPORT 41. Background to the Group 5
2. Report on Economic Position 7
3. Subsequent Events 17
4. Risk and Opportunity Report 17
5. Outlook 20
6. Cautionary statement regarding forward- looking statements 21
INTERIM CONDENSED CONSOLIDATED FINANCIAL STATEMENTS 22Interim condensed consolidated statement of profit or loss 24
Interim condensed consolidated statement of comprehensive income 25
Interim condensed consolidated statement of financial position 26
Interim condensed consolidated statement of changes in equity 28
Interim condensed consolidated statement of cash flows 30
Selected explanatory notes to the interim condensed consolidated financial statements 32
Responsibility statement by the Management Board 50
Review opinion 51
SUPPLEMENTARY INFORMATION 52
KPI and financial definitions 53
Financial Calendar 54
Information resources 54
1
H1 IN
TERI
M M
ANAG
EMEN
T RE
PORT
| G
LOBA
L FA
SHIO
N GR
OUP
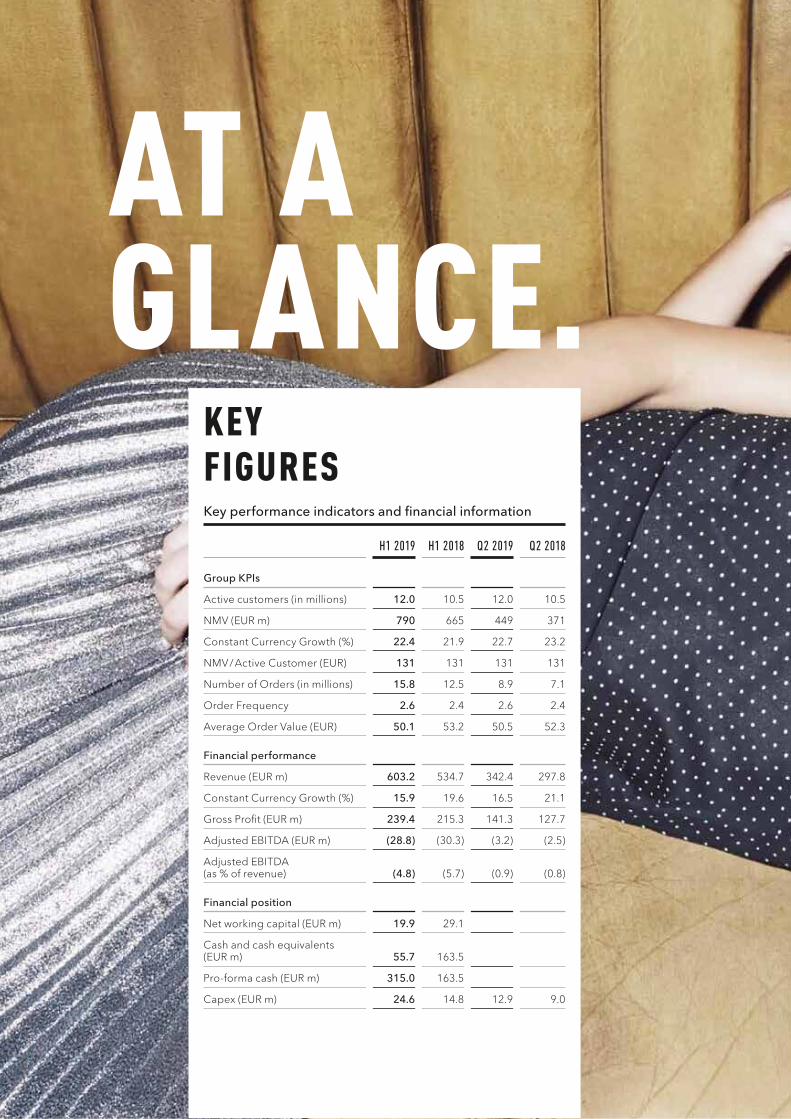
AT AGLANCE.
KEY FIGURES Key performance indicators and financial information
H1 2019 H1 2018 Q2 2019 Q2 2018
Group KPIs
Active customers (in millions) 12.0 10.5 12.0 10.5
NMV (EUR m) 790 665 449 371
Constant Currency Growth (%) 22.4 21.9 22.7 23.2
NMV / Active Customer (EUR) 131 131 131 131
Number of Orders (in millions) 15.8 12.5 8.9 7.1
Order Frequency 2.6 2.4 2.6 2.4
Average Order Value (EUR) 50.1 53.2 50.5 52.3
Financial performance
Revenue (EUR m) 603.2 534.7 342.4 297.8
Constant Currency Growth (%) 15.9 19.6 16.5 21.1
Gross Profit (EUR m) 239.4 215.3 141.3 127.7
Adjusted EBITDA (EUR m) (28.8) (30.3) (3.2) (2.5)
Adjusted EBITDA (as % of revenue) (4.8) (5.7) (0.9) (0.8)
Financial position
Net working capital (EUR m) 19.9 29.1
Cash and cash equivalents (EUR m) 55.7 163.5
Pro-forma cash (EUR m) 315.0 163.5
Capex (EUR m) 24.6 14.8 12.9 9.0

3
H1 IN
TERI
M M
ANAG
EMEN
T RE
PORT
| G
LOBA
L FA
SHIO
N GR
OUP
Key
figu
res

INTERIM GROUP MANAGEMENT REPORT
4
H1 IN
TERI
M M
ANAG
EMEN
T RE
PORT
| G
LOBA
L FA
SHIO
N GR
OUP
Inte
rim G
roup
Man
agem
ent R
epor
t
1. BACKGROUND TO THE GROUP
1.1 Business Model
Global Fashion Group (“GFG” or “the Group”) is the lead-ing online fashion and lifestyle destination in growth markets. GFG operates in 17 countries across three main geographic regions: Asia Pacific (APAC), Latin America (LATAM) and the Commonwealth of Independent States (CIS). Covering the entire value chain of an online retailer, GFG provides its customers with an inspiring and seam-less shopping experience from discovery to delivery.
GFG connects a population of one billion potential con-sumers in its markets with thousands of global, local and own brands via its four established e-commerce platforms. Each platform is operated under an individual brand name: THE ICONIC (in Australia and New Zealand), ZALORA (in Singapore, Hong Kong, Indonesia, the Philip-pines, Malaysia, Taiwan and Brunei), dafiti (in Brazil, Argen-tina, Chile and Colombia) and lamoda (in Russia, Belarus, Kazakhstan and Ukraine). Our vision is to be the number one fashion and lifestyle destination in our markets, and this forms the basis of our business model and culture. Every day, we empower our customers to express them-selves through fashion by connecting them with a diverse range of fashion and lifestyle brands.
Our customers are young, diverse and highly engaged. They are predominantly female, and those who are millen-nials or younger comprise the largest age group. We focus on this customer segment because of their demonstrated openness to purchasing products online, their high level of engagement, their high rate of mobile adoption, and their expected brand loyalty as they mature and their purchasing power grows. With approximately 43m social media followers across the top five social media platforms combined for all regions, our customers love interacting with our apps and content.
GFG offers customers an assortment that is both expan-sive and relevant, reflecting the scale and diversity of its markets. It covers all key fashion and lifestyle categories
such as apparel, footwear, accessories, kids and sports-wear, across a mix of thousands of global, local and own brands tailored to meet the aesthetic, cultural, sizing and price preferences of our diverse customers. Our assort-ment includes high-profile product lines that are co-devel-oped with celebrities and local influencers.
We source our products from brand partners via two business models: Retail, where we own the inventory of products sold to our customers, and Marketplace, where our brand partners hold the inventory and list products on our apps and websites. As the only online fashion and lifestyle platform of scale in our markets, GFG facilitates market entry for these brands and helps them overcome the traditional challenges of logistics, infrastructure, geog-raphy and regulatory processes. GFG also generates incremental revenues by providing distinct B2B Fashion Services to brands. These include fulfilment services for products that brands sell through their own online chan-nels, media solutions and data analytics.
Our operational infrastructure is fashion-specific, highly efficient and scaled for growth. GFG operates ten regional fulfilment centres with a maximum daily output capacity of over 800,000 items. Our fulfilment practices are locally tailored to each market and include a mix of own- and third-party last mile delivery, as well as local value-added services such as try-on in Russia. Payment options are also tailored to local customer preferences, with over 35 options across our markets. Fully in-house customer support is provided 24 / 7 in the majority of our markets and in eleven different languages. This commitment to delivering an outstanding shopping experience to our customers has yielded a consistently high net promoter score (NPS) of around 80% over the last three years.
Technology underpins our entire business and is geared towards enabling personalised and engaging customer front-ends, modular solutions for brands and efficient operations in the back-end. Our scalable, custom-built technology platform is integrated across our operations within each region and reflects the global and local nature of our business. We developed our predominantly in-house technology platform in a localised manner with technology stacks tailored to each major market. This enhances flexibility and enables us to quickly respond to
5
H1 IN
TERI
M M
ANAG
EMEN
T RE
PORT
| G
LOBA
L FA
SHIO
N GR
OUP
Inte
rim G
roup
Man
agem
ent R
epor
t
local business expectations and regulatory requirements. We have overlaid onto our localised technology stacks a growing global toolkit of advanced centralised solutions. These include, among others, our global Marketplace platform for brands (SellerCenter), pricing tools and busi-ness intelligence tools.
The people at GFG combine strong global expertise with deep local know-how. We have a local and diverse team of over 11,500 people across all regions. Over 98% of our people are based in our countries of operation.
Global Fashion Group S.A. is a stock corporation (société anonyme) under the laws of the Grand Duchy of Luxem-bourg and registered in the Luxembourg Trade and Companies Register (RCS B 190.907). GFG is domiciled in Luxembourg with its registered office located at 5, Heienhaff L-1736 Senningerberg. This is the first public interim management report produced by the Group.
1.2 Group Segments
The Group operates based on three operating segments, which also comprise our reportable segments: APAC, LATAM and CIS.
APACGFG operates locally under two brands in APAC: THE ICONIC and ZALORA. THE ICONIC was launched in late 2011, and is now the leading online fashion and sports retailer in Australia and New Zealand by online sales. Launched in 2012, ZALORA currently operates as market leader (by online sales) in Singapore, Hong Kong, Indo-nesia, the Philippines, Malaysia, Taiwan and Brunei.
LATAMIn LATAM, GFG operates locally under the brand dafiti in Brazil, Argentina, Chile and Colombia. Launched in 2011, dafiti is now ranked first in the region by online fashion and lifestyle sales.
CISIn CIS, GFG operates locally under the brand lamoda in Russia, Belarus, Kazakhstan and Ukraine. Launched in 2011, lamoda has emerged as the leading online retailer for fashion in the region by online sales.
Gross profit within our segment reports is defined as rev-enue less cost of sales. The column ‘Other’ includes headquarters and certain other business activities, such as sales to other retailers by our own brand Lost Ink Limited (‘Lost Ink’), which management decided to close in Febru-ary 2019, and external IT services. The reconciliation col-umn includes consolidation adjustments and the effects of purchase price allocation adjustments in connection with the formation of GFG.
1.3 Research and development
We operate a scalable, custom-built technology platform that is integrated across the operations within each of our regions and reflects both the global and local nature of our business. We developed our predominantly in-house technology platform in a localised manner with technol-ogy stacks tailored to each major market. Our technology platform provides substantial flexibility and enables us to efficiently respond to local business expectations and regulatory requirements.
Our technology is developed and continuously main-tained by an experienced global team of more than 1,000 engineers, product managers and data scientists. In order to continuously strengthen our team’s presence in each of our regions, we leverage a global technology talent pool.
6
H1 IN
TERI
M M
ANAG
EMEN
T RE
PORT
| G
LOBA
L FA
SHIO
N GR
OUP
Inte
rim G
roup
Man
agem
ent R
epor
t
2. REPORT ON ECONOMIC POSITION
2.1 Macroeconomic and Sector-Specific Environment
GFG operates in the online fashion and lifestyle market in 17 countries. The Group’s revenue and profitability depend on the conditions and outlook of this market. These include macroeconomic conditions, the overall fashion and lifestyle sector, and within this sector, devel-opment of the online channel.
Macroeconomic conditions in the regions within GFG’s footprint developed favourably in 2018. According to IMF estimates 1, real GDP experienced positive growth in all three of our geographic reporting segments. In Australia, Brazil and Russia, the largest country by revenue in each of GFG’s three regions, real GDP growth was 2.8%, 1.1% and 2.3%, respectively. For 2019, positive real GDP growth is expected for every country of operation except for Argentina.
Since GFG’s operations are predominantly in countries outside of the Eurozone, the majority of its revenues and costs are denominated in currencies other than the Euro (EUR). GFG is therefore exposed to fluctuations in the values of these currencies relative to the EUR. In the first six months of 2019, GFG’s largest net foreign currency exposures were to the United States dollar (USD), Pound sterling (GBP), Russian ruble (RUB), Australian dollar (AUD), and the Brazilian real (BRL).
While GFG’s reported revenues and Net Merchandise Value (NMV) are impacted by changes in the value of for-eign currencies relative to the EUR, in 2019 more than 90% of our cash flows in our LATAM segment and more than 80% of our cash flows in our APAC and CIS segments will be naturally hedged as local currency revenues will typi-cally be matched against a local currency cost base.
The overall fashion and lifestyle sector in GFG’s geo-graphic footprint is expected to develop favourably with an estimated annual growth rate of 7% from 2018 to 2022. This growth rate is considerably higher than the annual growth rate of 3% forecast over the same period for devel-oped markets such as the United States (US) and Western Europe 2. This growth rate differential is driven by the demographic trends in our regions, which include a rela-tively fast growing population and an expanding middle class with growing purchasing-power.
Within GFG’s footprint, online sales in the fashion and lifestyle sector are expected to outperform the overall sector, with an annual growth rate of 19% from 2018 to 2022 2. With a market volume of EUR 18bn in 2018, online sales comprised only 6% of total spend in the fashion and lifestyle sector 2. Given online penetration of the fashion and lifestyle sector was 20% in the US and 15% in Western Europe in 2018 2, we believe this indicates significant headroom to grow online penetration in our markets.
1 International Monetary Fund: World Economic Outlook Database 2019.
2 Euromonitor International. Based on the markets for apparel and footwear, beauty and personal care, personal accessories and eyewear.
7
H1 IN
TERI
M M
ANAG
EMEN
T RE
PORT
| G
LOBA
L FA
SHIO
N GR
OUP
Inte
rim G
roup
Man
agem
ent R
epor
t
GFG’s markets are at an earlier stage in the structural shift of fashion and lifestyle spend from offline to online than the US and Western Europe. There are several factors in our markets that support this ongoing shift:
• A population that is on average younger than that in the US and Western Europe and has favourable smartphone and online shopping habits
• The lack of a broad brick-and-mortar fashion retail offering, with floorspace of only 5 sqm per capita in our markets, compared to 77 sqm and 53 sqm per capita in the US and Western Europe respectively 1
• The demonstration that other verticals have already reached higher online penetration levels, with consumer electronics and appliances achieving 17% and 15% respectively in 2018 2
• The ongoing dismantling of traditional barriers to e-commerce adoption such as: low consumer trust in online shopping, underdeveloped delivery infrastructure, and the lack of online presence by international brands
Given GFG’s early entry into its markets, we believe we will be one of the major beneficiaries of these developments. We consider ourselves among the market leaders in our sector and footprint, and will continue to focus on growth and market leadership.
2.2 Financial Performance of the Group
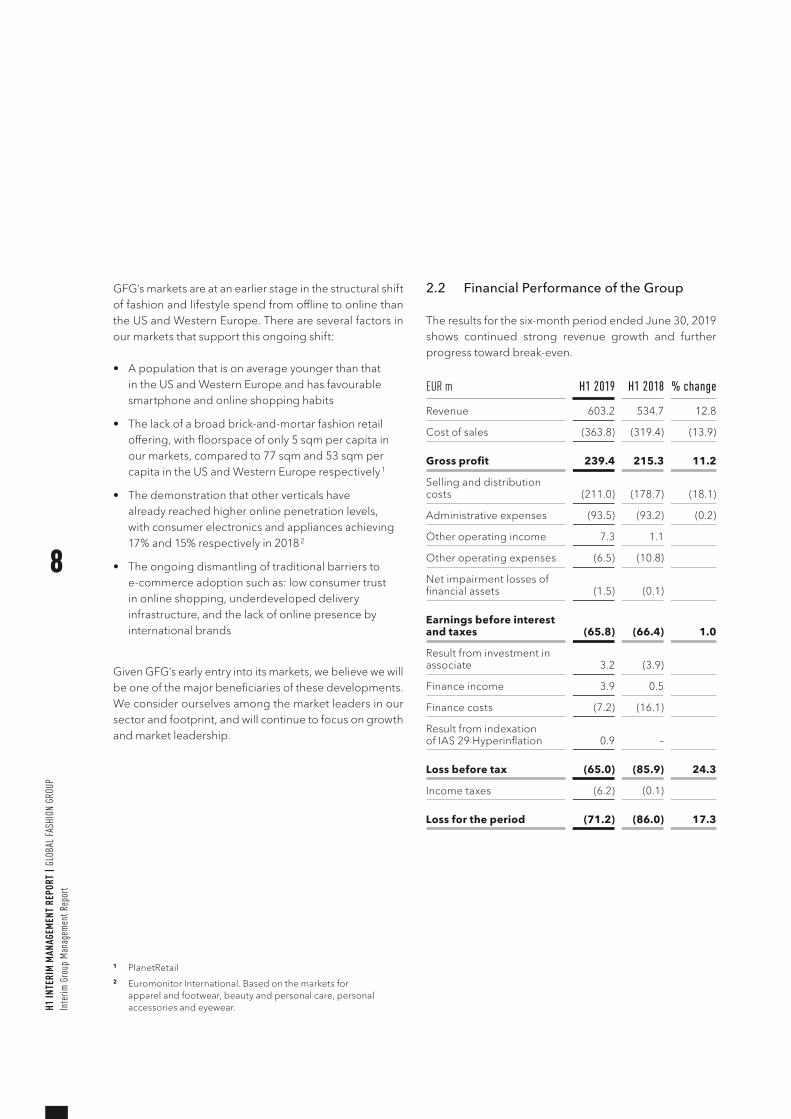
The results for the six-month period ended June 30, 2019 shows continued strong revenue growth and further progress toward break-even.
EUR m H1 2019 H1 2018 % change
Revenue 603.2 534.7 12.8
Cost of sales (363.8) (319.4) (13.9)
Gross profit 239.4 215.3 11.2
Selling and distribution costs (211.0) (178.7) (18.1)
Administrative expenses (93.5) (93.2) (0.2)
Other operating income 7.3 1.1
Other operating expenses (6.5) (10.8)
Net impairment losses of financial assets (1.5) (0.1)
Earnings before interest and taxes (65.8) (66.4) 1.0
Result from investment in associate 3.2 (3.9)
Finance income 3.9 0.5
Finance costs (7.2) (16.1)
Result from indexation of IAS 29 Hyperinflation 0.9 –
Loss before tax (65.0) (85.9) 24.3
Income taxes (6.2) (0.1)
Loss for the period (71.2) (86.0) 17.3
1 PlanetRetail 2 Euromonitor International. Based on the markets for
apparel and footwear, beauty and personal care, personal accessories and eyewear.
8
H1 IN
TERI
M M
ANAG
EMEN
T RE
PORT
| G
LOBA
L FA
SHIO
N GR
OUP
Inte
rim G
roup
Man
agem
ent R
epor
t
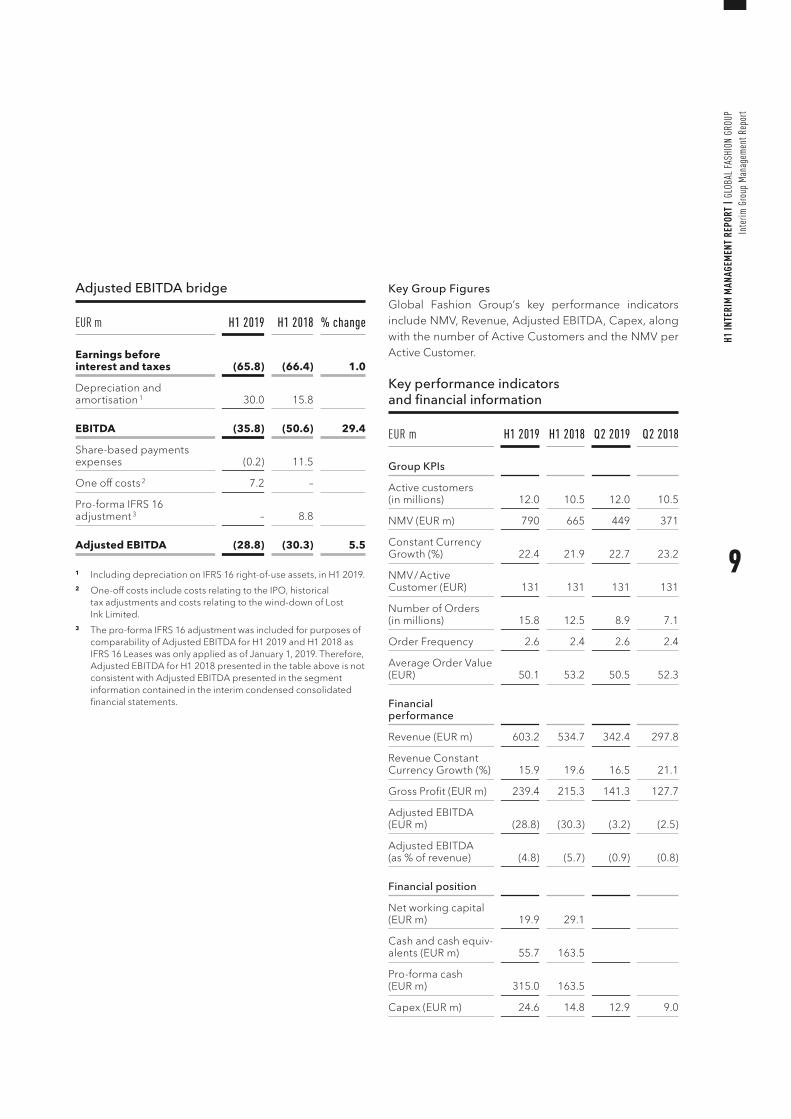
Adjusted EBITDA bridge
EUR m H1 2019 H1 2018 % change
Earnings before interest and taxes (65.8) (66.4) 1.0
Depreciation and amortisation 1 30.0 15.8
EBITDA (35.8) (50.6) 29.4
Share-based payments expenses (0.2) 11.5
One off costs 2 7.2 –
Pro-forma IFRS 16 adjustment 3 – 8.8
Adjusted EBITDA (28.8) (30.3) 5.5
1 Including depreciation on IFRS 16 right-of-use assets, in H1 2019.2 One-off costs include costs relating to the IPO, historical
tax adjustments and costs relating to the wind-down of Lost Ink Limited.
3 The pro-forma IFRS 16 adjustment was included for purposes of comparability of Adjusted EBITDA for H1 2019 and H1 2018 as IFRS 16 Leases was only applied as of January 1, 2019. Therefore, Adjusted EBITDA for H1 2018 presented in the table above is not consistent with Adjusted EBITDA presented in the segment information contained in the interim condensed consolidated financial statements.
Key Group FiguresGlobal Fashion Group’s key performance indicators include NMV, Revenue, Adjusted EBITDA, Capex, along with the number of Active Customers and the NMV per Active Customer.
Key performance indicators and financial information
EUR m H1 2019 H1 2018 Q2 2019 Q2 2018
Group KPIs
Active customers (in millions) 12.0 10.5 12.0 10.5
NMV (EUR m) 790 665 449 371
Constant Currency Growth (%) 22.4 21.9 22.7 23.2
NMV / Active Customer (EUR) 131 131 131 131
Number of Orders (in millions) 15.8 12.5 8.9 7.1
Order Frequency 2.6 2.4 2.6 2.4
Average Order Value (EUR) 50.1 53.2 50.5 52.3
Financial performance
Revenue (EUR m) 603.2 534.7 342.4 297.8
Revenue Constant Currency Growth (%) 15.9 19.6 16.5 21.1
Gross Profit (EUR m) 239.4 215.3 141.3 127.7
Adjusted EBITDA (EUR m) (28.8) (30.3) (3.2) (2.5)
Adjusted EBITDA (as % of revenue) (4.8) (5.7) (0.9) (0.8)
Financial position
Net working capital (EUR m) 19.9 29.1
Cash and cash equiv-alents (EUR m) 55.7 163.5
Pro-forma cash (EUR m) 315.0 163.5
Capex (EUR m) 24.6 14.8 12.9 9.0
9
H1 IN
TERI
M M
ANAG
EMEN
T RE
PORT
| G
LOBA
L FA
SHIO
N GR
OUP
Inte
rim G
roup
Man
agem
ent R
epor
t
Business Activities On February 18, 2019, the Group entered into an agree-ment to sell its 46.93% share of Namshi Holding Limited to Emaar Malls. The transaction was completed on Febru-ary 25, 2019 for a total consideration of USD 129.5m (EUR 114.3m).
On March 11, 2019, management decided to close Lost Ink, a private label fashion business based in the UK. The impact on Adjusted EBITDA for the six-month period ended June 30, 2019 is EUR (5.5)m.
In April 2019, Matthew Price joined the Group as Chief Financial Officer. Matthew was most recently CFO of Moneysupermarket.com and has held key financial roles at Costa Coffee in the UK and Asia, and Sainsbury’s.
On June 3, 2019, the Company announced its intention to conduct an initial public offering and a listing of its shares on the regulated market (Prime Standard) of the Frankfurt Stock Exchange. The Company successfully listed its shares on July 2, 2019, raising net proceeds of EUR 186.1m.
The variance in revenue and margin over the course of the period reflects the seasonality of fashion sales. The Group’s presence in the northern hemisphere (our CIS business); southern hemisphere (Australia, New Zealand and Brazil) and also countries that cross the equator including South East Asia and Colombia, smooths out the seasonal risks of being concentrated in one geography. New season collections drive most sales in the second and fourth quarter, with the first and third quarter focusing on end of season sales and stock clearance.
Growth of NMVIn Q2 2019, NMV grew by 22.7% on a constant currency basis, to EUR 449m. NMV for the first half, reached EUR 790m, growing 22.4% on a constant currency basis.
The first half growth in NMV was as a result of an increase of 14.6% in Active Customers to 12.0m, and NMV per Active Customer rising by 7.1% on a constant currency basis to EUR 131m, underpinned by our leading customer experience.
Our number of orders continued to grow, up by 25.4% to 8.9m in Q2 2019 and, on average, customers are purchas-ing 8.8% more often than the same time last year, at 2.6 times per year.
Marketplace continues to increase, and now represents 19% of NMV, up from 14% for the same period last year.
Growth of RevenueThe strong growth in NMV delivered solid revenue growth. In Q2 2019, revenue grew by 16.5% on a constant currency basis, increasing by EUR 44.6m to EUR 342.4m. For the first half, revenue was EUR 603.2m, increasing 15.9% year on year on a constant currency basis and 12.8% in absolute EUR terms.
GFG continues to be at the forefront of defining what an inspiring customer experience looks like in its markets. In the first half of 2019, GFG’s broad assortment strategy evolved with more exclusive global brand collaborations, further development of the modest fashion segment with another successful Hari Raya festival season, and the launch of a new way of shopping sustainably.
Operational developments in the first half of 2019 have enhanced the delivery experience offered in SE Asia and CIS. ‘Zalora Now’, a subscription programme including free next day delivery, was launched in Indonesia, while the pick-up point network in CIS grew to cover over 12,000 locations. In Brazil, construction of the new fulfilment centre is well-progressed and on track to open in 2020.
Technology innovations focused on app functionality have delivered new levels of customer engagement and strengthened GFG’s app-first approach. Apps generated 47% of NMV in Q2, up 7 ppt compared to the same period last year.
10
H1 IN
TERI
M M
ANAG
EMEN
T RE
PORT
| G
LOBA
L FA
SHIO
N GR
OUP
Inte
rim G
roup
Man
agem
ent R
epor
t
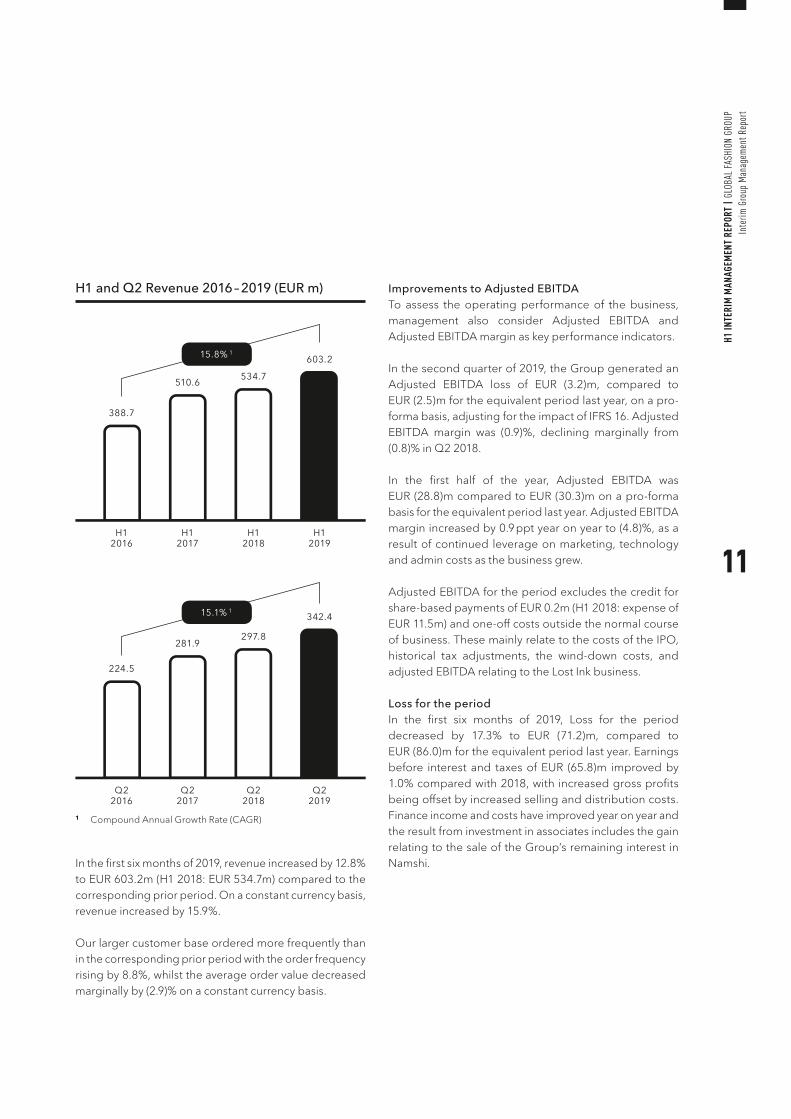
H1 and Q2 Revenue 2016 – 2019 (EUR m)
In the first six months of 2019, revenue increased by 12.8% to EUR 603.2m (H1 2018: EUR 534.7m) compared to the corresponding prior period. On a constant currency basis, revenue increased by 15.9%.
Our larger customer base ordered more frequently than in the corresponding prior period with the order frequency rising by 8.8%, whilst the average order value decreased marginally by (2.9)% on a constant currency basis.
Improvements to Adjusted EBITDATo assess the operating performance of the business, management also consider Adjusted EBITDA and Adjusted EBITDA margin as key performance indicators.
In the second quarter of 2019, the Group generated an Adjusted EBITDA loss of EUR (3.2)m, compared to EUR (2.5)m for the equivalent period last year, on a pro-forma basis, adjusting for the impact of IFRS 16. Adjusted EBITDA margin was (0.9)%, declining marginally from (0.8)% in Q2 2018.
In the first half of the year, Adjusted EBITDA was EUR (28.8)m compared to EUR (30.3)m on a pro-forma basis for the equivalent period last year. Adjusted EBITDA margin increased by 0.9 ppt year on year to (4.8)%, as a result of continued leverage on marketing, technology and admin costs as the business grew.
Adjusted EBITDA for the period excludes the credit for share-based payments of EUR 0.2m (H1 2018: expense of EUR 11.5m) and one-off costs outside the normal course of business. These mainly relate to the costs of the IPO, historical tax adjustments, the wind-down costs, and adjusted EBITDA relating to the Lost Ink business.
Loss for the periodIn the first six months of 2019, Loss for the period decreased by 17.3% to EUR (71.2)m, compared to EUR (86.0)m for the equivalent period last year. Earnings before interest and taxes of EUR (65.8)m improved by 1.0% compared with 2018, with increased gross profits being offset by increased selling and distribution costs. Finance income and costs have improved year on year and the result from investment in associates includes the gain relating to the sale of the Group’s remaining interest in Namshi.
H12016
H12017
H12018
H12019
388.7
510.6 534.7
603.215.8% 1
1 Compound Annual Growth Rate (CAGR)
Q22016
Q22017
Q22018
Q22019
224.5
281.9297.8
342.415.1% 1
11
H1 IN
TERI
M M
ANAG
EMEN
T RE
PORT
| G
LOBA
L FA
SHIO
N GR
OUP
Inte
rim G
roup
Man
agem
ent R
epor
t
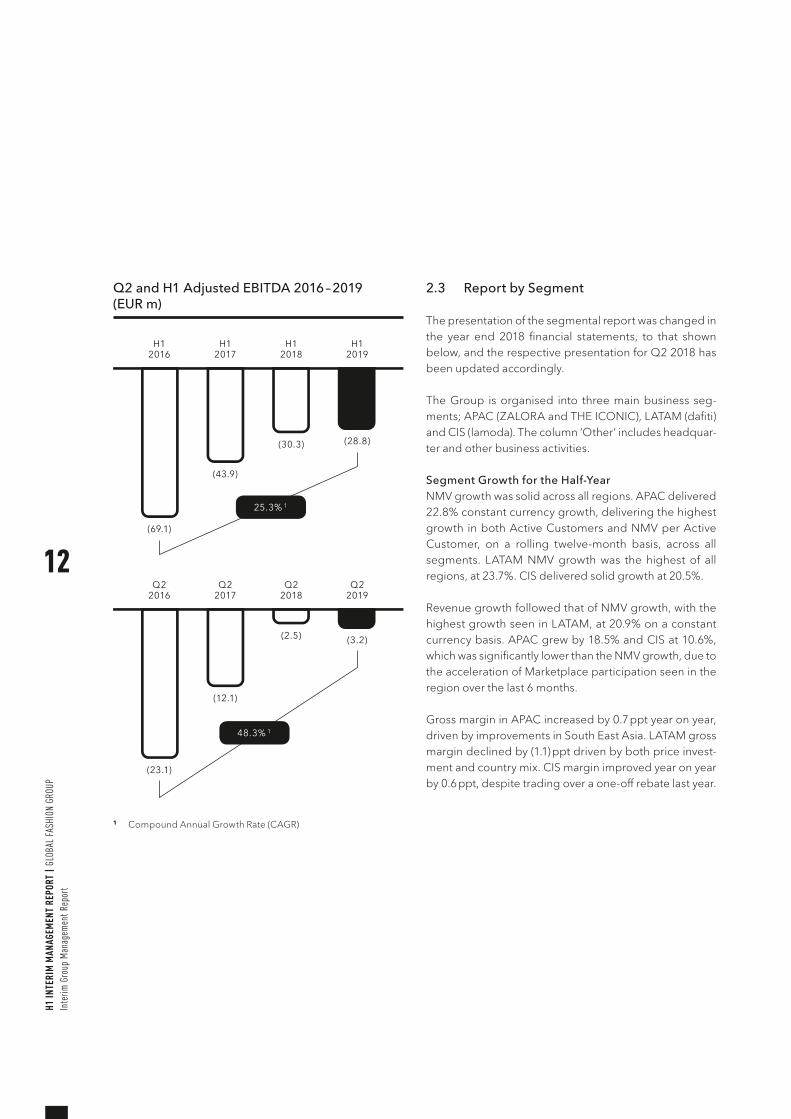
Q2 and H1 Adjusted EBITDA 2016 – 2019 (EUR m)
2.3 Report by Segment
The presentation of the segmental report was changed in the year end 2018 financial statements, to that shown below, and the respective presentation for Q2 2018 has been updated accordingly.
The Group is organised into three main business seg-ments; APAC (ZALORA and THE ICONIC), LATAM (dafiti) and CIS (lamoda). The column ‘Other’ includes headquar-ter and other business activities.
Segment Growth for the Half-YearNMV growth was solid across all regions. APAC delivered 22.8% constant currency growth, delivering the highest growth in both Active Customers and NMV per Active Customer, on a rolling twelve-month basis, across all segments. LATAM NMV growth was the highest of all regions, at 23.7%. CIS delivered solid growth at 20.5%.
Revenue growth followed that of NMV growth, with the highest growth seen in LATAM, at 20.9% on a constant currency basis. APAC grew by 18.5% and CIS at 10.6%, which was significantly lower than the NMV growth, due to the acceleration of Marketplace participation seen in the region over the last 6 months.
Gross margin in APAC increased by 0.7 ppt year on year, driven by improvements in South East Asia. LATAM gross margin declined by (1.1) ppt driven by both price invest-ment and country mix. CIS margin improved year on year by 0.6 ppt, despite trading over a one-off rebate last year.
H12016
H12017
H12018
H12019
(69.1)
(43.9)
(30.3) (28.8)
25.3% 1
1 Compound Annual Growth Rate (CAGR)
Q22016
Q22017
Q22018
Q22019
(23.1)
(12.1)
(2.5) (3.2)
48.3% 1
12
H1 IN
TERI
M M
ANAG
EMEN
T RE
PORT
| G
LOBA
L FA
SHIO
N GR
OUP
Inte
rim G
roup
Man
agem
ent R
epor
t
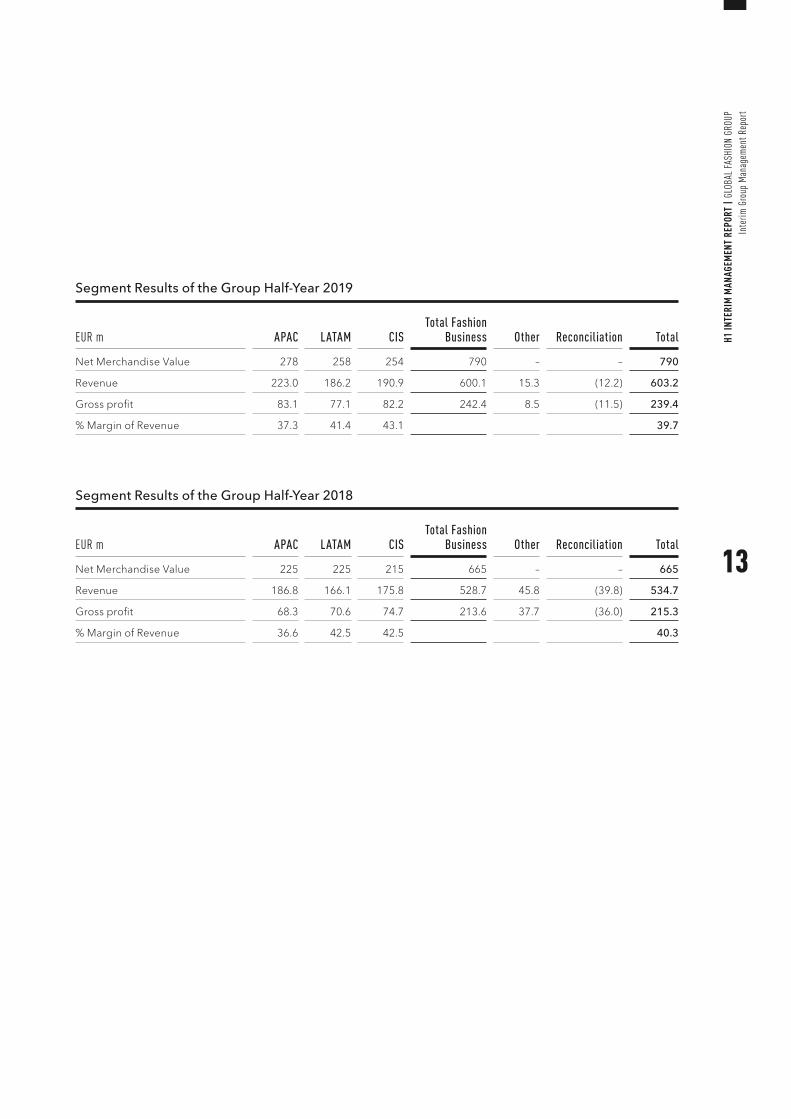
Segment Results of the Group Half-Year 2019
EUR m APAC LATAM CISTotal Fashion
Business Other Reconciliation Total
Net Merchandise Value 278 258 254 790 – – 790
Revenue 223.0 186.2 190.9 600.1 15.3 (12.2) 603.2
Gross profit 83.1 77.1 82.2 242.4 8.5 (11.5) 239.4
% Margin of Revenue 37.3 41.4 43.1 39.7
Segment Results of the Group Half-Year 2018
EUR m APAC LATAM CISTotal Fashion
Business Other Reconciliation Total
Net Merchandise Value 225 225 215 665 – – 665
Revenue 186.8 166.1 175.8 528.7 45.8 (39.8) 534.7
Gross profit 68.3 70.6 74.7 213.6 37.7 (36.0) 215.3
% Margin of Revenue 36.6 42.5 42.5 40.3
13
H1 IN
TERI
M M
ANAG
EMEN
T RE
PORT
| G
LOBA
L FA
SHIO
N GR
OUP
Inte
rim G
roup
Man
agem
ent R
epor
t
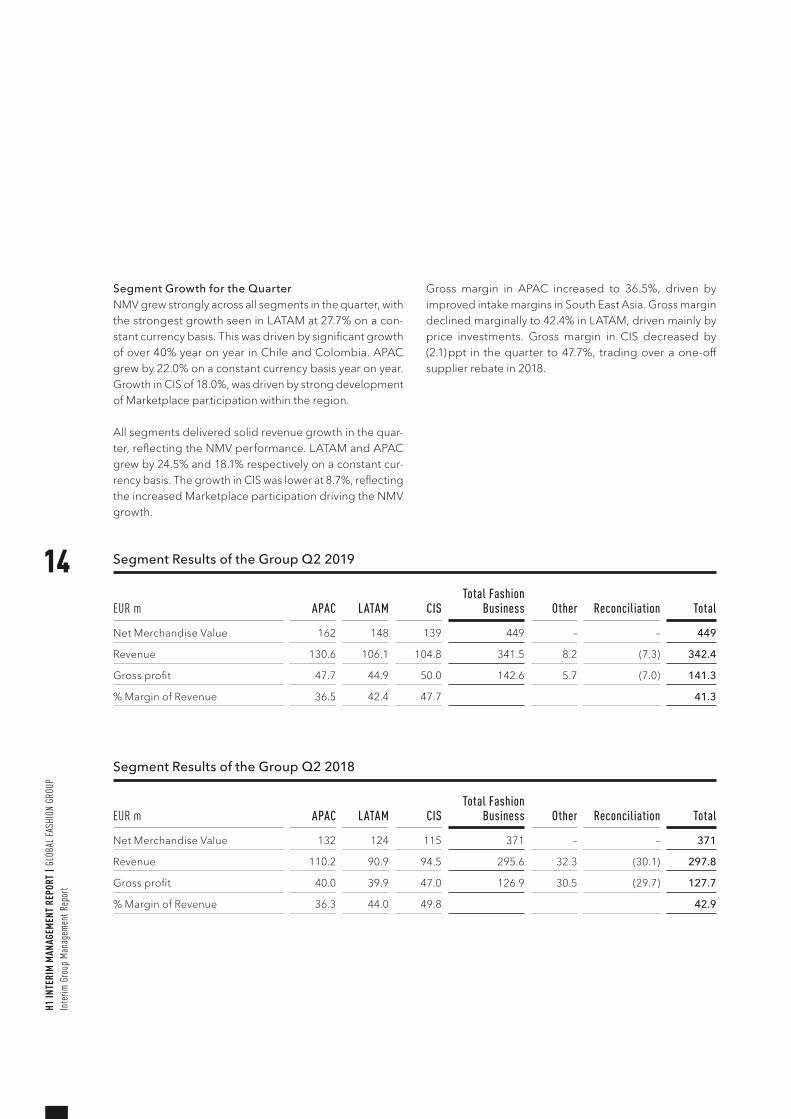
Segment Growth for the QuarterNMV grew strongly across all segments in the quarter, with the strongest growth seen in LATAM at 27.7% on a con-stant currency basis. This was driven by significant growth of over 40% year on year in Chile and Colombia. APAC grew by 22.0% on a constant currency basis year on year. Growth in CIS of 18.0%, was driven by strong development of Marketplace participation within the region.
All segments delivered solid revenue growth in the quar-ter, reflecting the NMV performance. LATAM and APAC grew by 24.5% and 18.1% respectively on a constant cur-rency basis. The growth in CIS was lower at 8.7%, reflecting the increased Marketplace participation driving the NMV growth.
Gross margin in APAC increased to 36.5%, driven by improved intake margins in South East Asia. Gross margin declined marginally to 42.4% in LATAM, driven mainly by price investments. Gross margin in CIS decreased by (2.1) ppt in the quarter to 47.7%, trading over a one-off supplier rebate in 2018.
Segment Results of the Group Q2 2019
EUR m APAC LATAM CISTotal Fashion
Business Other Reconciliation Total
Net Merchandise Value 162 148 139 449 – – 449
Revenue 130.6 106.1 104.8 341.5 8.2 (7.3) 342.4
Gross profit 47.7 44.9 50.0 142.6 5.7 (7.0) 141.3
% Margin of Revenue 36.5 42.4 47.7 41.3
Segment Results of the Group Q2 2018
EUR m APAC LATAM CISTotal Fashion
Business Other Reconciliation Total
Net Merchandise Value 132 124 115 371 – – 371
Revenue 110.2 90.9 94.5 295.6 32.3 (30.1) 297.8
Gross profit 40.0 39.9 47.0 126.9 30.5 (29.7) 127.7
% Margin of Revenue 36.3 44.0 49.8 42.9
14
H1 IN
TERI
M M
ANAG
EMEN
T RE
PORT
| G
LOBA
L FA
SHIO
N GR
OUP
Inte
rim G
roup
Man
agem
ent R
epor
t
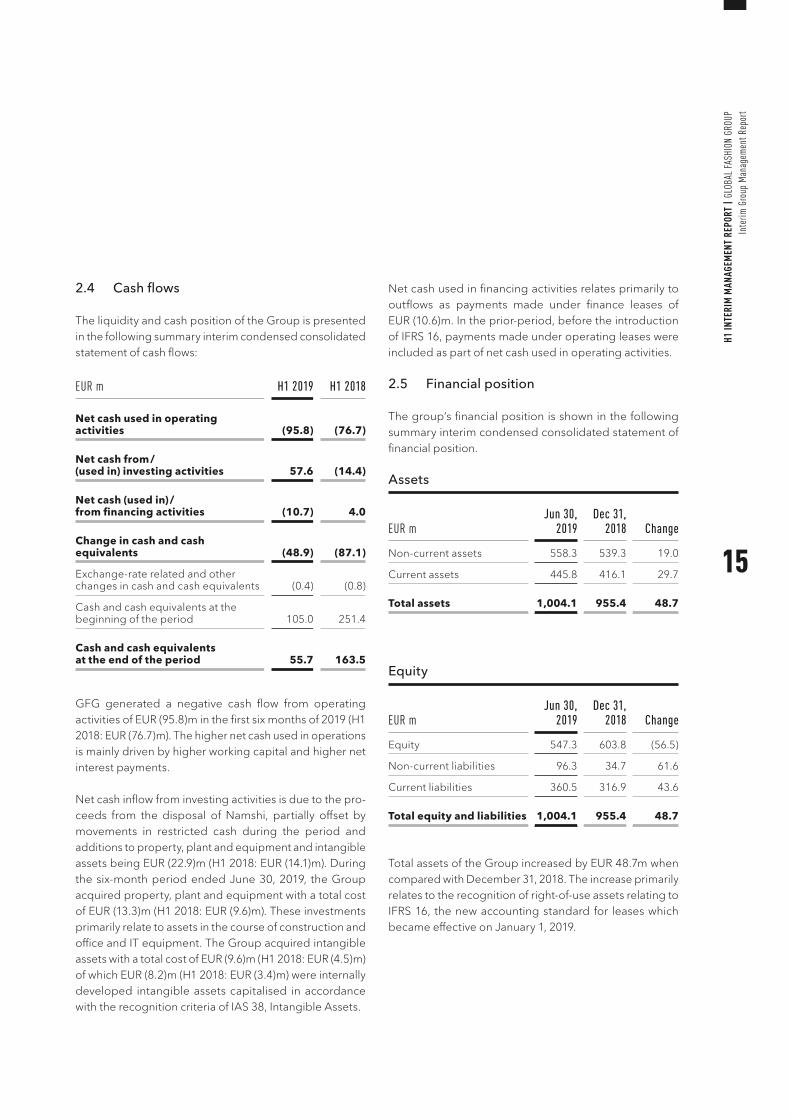
2.4 Cash flows
The liquidity and cash position of the Group is presented in the following summary interim condensed consolidated statement of cash flows:
EUR m H1 2019 H1 2018
Net cash used in operating activities (95.8) (76.7)
Net cash from / (used in) investing activities 57.6 (14.4)
Net cash (used in) / from financing activities (10.7) 4.0
Change in cash and cash equivalents (48.9) (87.1)
Exchange-rate related and other changes in cash and cash equivalents (0.4) (0.8)
Cash and cash equivalents at the beginning of the period 105.0 251.4
Cash and cash equivalents at the end of the period 55.7 163.5
GFG generated a negative cash flow from operating activities of EUR (95.8)m in the first six months of 2019 (H1 2018: EUR (76.7)m). The higher net cash used in operations is mainly driven by higher working capital and higher net interest payments.
Net cash inflow from investing activities is due to the pro-ceeds from the disposal of Namshi, partially offset by movements in restricted cash during the period and additions to property, plant and equipment and intangible assets being EUR (22.9)m (H1 2018: EUR (14.1)m). During the six-month period ended June 30, 2019, the Group acquired property, plant and equipment with a total cost of EUR (13.3)m (H1 2018: EUR (9.6)m). These investments primarily relate to assets in the course of construction and office and IT equipment. The Group acquired intangible assets with a total cost of EUR (9.6)m (H1 2018: EUR (4.5)m) of which EUR (8.2)m (H1 2018: EUR (3.4)m) were internally developed intangible assets capitalised in accordance with the recognition criteria of IAS 38, Intangible Assets.
Net cash used in financing activities relates primarily to outflows as payments made under finance leases of EUR (10.6)m. In the prior-period, before the introduction of IFRS 16, payments made under operating leases were included as part of net cash used in operating activities.
2.5 Financial position
The group’s financial position is shown in the following summary interim condensed consolidated statement of financial position.
Assets
EUR m Jun 30,
2019Dec 31,
2018 Change
Non-current assets 558.3 539.3 19.0
Current assets 445.8 416.1 29.7
Total assets 1,004.1 955.4 48.7
Equity
EUR m Jun 30,
2019Dec 31,
2018 Change
Equity 547.3 603.8 (56.5)
Non-current liabilities 96.3 34.7 61.6
Current liabilities 360.5 316.9 43.6
Total equity and liabilities 1,004.1 955.4 48.7
Total assets of the Group increased by EUR 48.7m when compared with December 31, 2018. The increase primarily relates to the recognition of right-of-use assets relating to IFRS 16, the new accounting standard for leases which became effective on January 1, 2019.
15
H1 IN
TERI
M M
ANAG
EMEN
T RE
PORT
| G
LOBA
L FA
SHIO
N GR
OUP
Inte
rim G
roup
Man
agem
ent R
epor
t
On transition to IFRS 16, the Group recognised an addi-tional EUR 75.0m of right-of-use assets and EUR 75.0m of lease liabilities. The net book value of right-of-use assets as at June 30, 2019 was EUR 74.3m comprising lease additions of EUR 9.8m and offset by depreciation charges of EUR (10.5)m. Total lease liabilities of EUR 82.4m, net of lease repayments and interest, are split between non- current and current lease liabilities on the interim con-densed consolidated statement of financial position.
The increase in total assets was offset by the disposal of the remaining interest in our Middle-East business, Namshi, in Q1 2019.
In the first six months of the year, Capex additions were EUR 24.6m (June 30, 2018: EUR 14.8m) and primarily related to the Group’s continuous investment in its deliv-ery and fulfilment infrastructure, as assets in the course of construction, and office and IT equipment along with intangible assets.
The increase in inventories of EUR 43.0m to EUR 229.1m represents a Group-wide increase in business volumes and the seasonality of our local businesses.
The closing pro-forma cash position at the end of Q2 2019 was EUR 128.9m, including EUR 73.2m of restricted cash and cash on deposit, primarily related to our revolving credit facility and before net proceeds in relation to the IPO of EUR 186.1m and one-off transaction fees.
Movements in equity for the period relate primarily to losses incurred for the six-month period to June 30, 2019, partially offset by favourable translation adjustments.
Non-current liabilities increased by EUR 61.6m, EUR 59.4m of which represents the non-current portion of lease contracts under IFRS 16, discounted to present value.
Current liabilities increased by EUR 43.6m to EUR 360.5m during the period. This increase reflects the current por-tion of finance lease liabilities under IFRS 16 (EUR 17.2m), discounted to present value, and an increase in trade and other liabilities of EUR 18.5m, reflecting the impact of seasonality on the Group’s working capital.
Overall AssessmentThe Management Board views the business development in the first six months of the 2019 financial year as on track. The Group increased its NMV and revenue in line with management guidance and Adjusted EBITDA increased as a result of ongoing leverage in marketing, technology and administration costs.
2.6 Employees
The average headcount for the period was 11,638 employ-ees. The growth was primarily driven by the increasing headcount in the commercial and operations departments and excludes average headcount associated with the disposal of Namshi and the wind-down of Lost Ink.
16
H1 IN
TERI
M M
ANAG
EMEN
T RE
PORT
| G
LOBA
L FA
SHIO
N GR
OUP
Inte
rim G
roup
Man
agem
ent R
epor
t
3. SUBSEQUENT EVENTSSince July 2, 2019 the shares of the Company have been traded on the regulated market (Prime Standard) of the Frankfurt Stock Exchange. The Company received net proceeds of EUR 186.1m.
GFG intends to use the proceeds to fuel continued growth, by investing in technology platforms, customer acquisi-tion, and fulfilment and delivery infrastructure, including automation, as well as other general corporate purposes.
The Company entered into an amended revolving credit facility (‘the amended facility’) on July 9, 2019. The total facility amount remains unchanged at EUR 70.0m, with the allocation between Facility A and Facility B remaining unchanged at EUR 50.0m and EUR 20.0m respectively with Facility A permitted to increase by up to EUR 30.0m. There will be no obligation to hold restricted cash as part of the amended facility. EUR 50.0m that was classified as restricted under the previous facility A was released to the Company on July 11, 2019, with the remaining EUR 20.0m expected to be released in September 2019.
4. RISK AND OPPORTUNITY REPORT
4.1 Risks
GFG recognises that it undertakes risks as a result of cap-turing market opportunities and in pursuing its business strategy. The Group is committed to the proactive identi-fication, assessment, and management of material finan-cial and non-financial risks associated with its activities, in line with the GFG Risk Management Framework. The fol-lowing details the material risks and mitigation activities of the Group:
IT riskGFG is an e-commerce retailer, which means a robust and secure IT infrastructure is of critical importance as an enabler, value driver, and customer facing interface (i. e. our webstores and mobile apps). Operating risks could arise if the IT landscape is not continually adapted to adequately support the challenges of a fast-growing business and could limit our growth if we are unable to remain competitive. GFG Group and regional IT strategies are aligned to support its overall business strategy and objectives.
Cyber and Information Security riskCyber and information security risk continues to be a growing and increasingly ubiquitous worldwide risk, impacting companies of all sizes and across all industries. In recent years there has been a general rise in awareness and regulation around data protection globally. GFG relies on customer data to better understand and serve our customers. To minimise these risks, periodic checks are performed to determine whether the Group and regional IT landscapes meet our operating requirements in order to determine appropriate mitigating actions. There is also natural risk isolation as the customer databases of our operating businesses are not generally interconnected.
17
H1 IN
TERI
M M
ANAG
EMEN
T RE
PORT
| G
LOBA
L FA
SHIO
N GR
OUP
Inte
rim G
roup
Man
agem
ent R
epor
t
Liquidity riskThe Group currently operates at a net loss, although it has a proactive strategy to be profit-making in all markets in the years ahead. Through monthly reporting, short- and medium-term corporate planning, as well as target / actual analysis and numerous financial and non-financial indica-tors, Group Management is informed of the development of the Group’s business in a timely manner and is in a position to take countermeasures where necessary.
In 2018, the Group put in place a Revolving Credit Facility to further optimise and bolster GFG’s working capital position. This was amended in July 2019 following the Group IPO, see section 1.3 for details. In addition, the Group undertook the following key transactions which has further solidified the cash position:
• Disposal of the remaining stake in our Middle East operations on February 25, 2019, for EUR 114.3m; and
• The Group listed on the Frankfurt Stock Exchange on July 2, 2019, raising net proceeds of EUR 186.1m.
Geopolitical and Macroeconomic factorsThe Group’s business is concentrated across several emerging markets, which are at different stages of eco-nomic, political and social development. Moreover, each has its own specific political, social, economic, and legis-lative environment, giving rise to specific risks for each market and potentially giving rise to conflicting legal and regulatory requirements in multiple markets, and potential disruption to cross border movement of goods. Manage-ment is continuously monitoring the political, social, eco-nomic and legislative environments, to be in a position to take mitigating actions if any such risks materialise. GFG operates local fulfilment centers in all our major markets serving to reduce potential friction arising from cross border trade disruption as much as is possible.
Currency (Foreign Exchange)We operate on a global scale and our operations are car-ried out in numerous foreign currencies, which exposes us to foreign currency exchange risks. Currency exchange rates in the Group’s markets tend to be volatile in compar-ison to the euro (GFG’s reporting currency) and such vol-atility arises from fluctuations or devaluations of currencies as well as foreign exchange controls or governmental measures that impact our ability to convert currencies. This creates further risk to the Group’s results of operations as many of the Group’s assets, sales, expenses and earnings are not denominated in Euro.
Operational risksGFG operates partly within emerging markets and has expanded to just over 11,500 employees across its geog-raphies within a short period of time. This generally gives rise to the risk of structures not growing in line with busi-ness requirements, potentially negatively impacting the operations. As an e-commerce company, GFG relies on the efficiency and capacity of our fulfillment centers more so than traditional offline retailers. As a result, there is increased sensitivity to operational risks from disruption and / or capacity constraints of our fulfilment centers. Management mitigates these risks via capacity planning and forecasting, continual optimisation of fulfilment pro-cesses, and investment in machinery and equipment. The Group currently insures its material operational risk expo-sures, to the extent that these risks are insurable, and are commercially viable to insure.
People riskOur people are integral to the success of GFG. The high performing, entrepreneurial and agile work culture con-tinues to be a significant driver of the Group’s perfor-mance. The knowledge, skills and experience of our people are inherently important to our development and management of risk. GFG continues to establish our core people and culture practices such as: dynamic perfor-mance management, workplace safety, compensation reviews, succession planning, continuous learning, lead-ership development, talent mobility, alongside the mea-surement of engagement, to help build the competence and commitment of our most important asset, our people.
18
H1 IN
TERI
M M
ANAG
EMEN
T RE
PORT
| G
LOBA
L FA
SHIO
N GR
OUP
Inte
rim G
roup
Man
agem
ent R
epor
t
Competition riskThe online fashion industry is fragmented and character-ised by intense competition, meaning that competitive pressure in GFG’s markets is a risk. Management closely observes the operations of the Group in each of its oper-ating markets and the competitive environments and adapts the Group’s strategy by taking appropriate countermeasures where needed to allow the Group to successfully compete against current or future competi-tors. The Group’s operating units are pioneers in the e-commerce fashion space within their respective markets and have built a deep understanding of consumer prefer-ences within the market. This provides the Group with a unique advantage and is evident in the strong brand loy-alty and brand recognition of our webstores in their markets.
Ethical and Sustainable sourcing riskGFG sources a proportion of its product range from fac-tories based in emerging markets, which exposes the Group to risks in relation to possible breaches of corporate social responsibility, including ethical sourcing, working conditions and responsible recruitment (in line with GFG’s ethical and sustainable sourcing standards). The Corpo-rate Social Responsibility teams in each region work in tandem with the Commercial teams to proactively ensure that suppliers meet GFG standards, as set by the GFG Sustainability Committee, through a continuous and independent monitoring and audit programme.
4.2 Opportunities
While GFG faces several risks, there are also many oppor-tunities for the Group that may enhance its growth pros-pects or facilitate improved profitability. The primary opportunities that we have identified are:
Macroeconomic developmentsWe believe that growth opportunities in our markets will be driven by several macroeconomic tailwinds that will shift customer behaviour, including urbanisation, growing disposable incomes, increasing customer engagement with mobile and other digital devices, and improved last-mile delivery capabilities. These tailwinds increase both the demand for fashion and lifestyle products, and grow the share of e-commerce within this sector. In 2018, e-com-merce comprised only 6% of the fashion and lifestyle sector in our markets. There is significant headroom for this to grow as customer behaviour continues to shift towards increasing usage of smartphones for transactions and a preference for convenience. For comparison, online penetration of the fashion and lifestyle sector was 20% in the US and 15% in Western Europe in 2018. Attracting more customers in our markets to fashion and lifestyle e-commerce grows the potential customer base for GFG.
Category and segment expansionSignificant scope exists for GFG to continue rolling out all fashion and lifestyle categories across its regions and thus grow its market share. These categories include apparel, footwear, accessories, sports performance, kids and beauty. Currently, the sports performance, kids and beauty categories are only developed to varying degrees in each of our regions, but management’s objective is to expand all of these categories by adding relevant brands and growing assortment width. We believe continued expansion of these adjacent categories will increase aver-age basket values and spend per customer, encouraging customers to see GFG as a one-stop destination for fash-ion and lifestyle.
19
H1 IN
TERI
M M
ANAG
EMEN
T RE
PORT
| G
LOBA
L FA
SHIO
N GR
OUP
Inte
rim G
roup
Man
agem
ent R
epor
t
Additionally, GFG has the opportunity to expand its cov-erage across price levels and other market-specific white spots. With respect to price levels, there is the opportunity to further develop our offering in the premium and entry luxury segments. With respect to potential assortment white spots in any of our markets, our strategy is to develop own brand lines that may fill that gap.
TechnologyFurther innovation in technology will enable GFG to create an even more inspiring and seamless shopping experi-ence for our customers. For example, data analytics can be used to create an assortment catalogue that is increas-ingly curated and personalised for each customer. Our teams continually develop new features and capabilities that improve the engagement and stickiness of our apps. We believe our localised approach to front-end technol-ogy, which allows us to be closer to the customer, creates an effective environment for innovation to develop locally and then be shared across the Group once proven and successful.
On the back-end, there are opportunities for GFG to fur-ther centralise certain tools or platforms, thereby simplify-ing our IT landscape and reducing maintenance and costs. Further automation of operations, including in fulfilment centres, is also an opportunity to improve operational efficiency and improve the customer experience.
Expansion of value-added fashion servicesWe believe there is an opportunity to further develop GFG’s value-added fashion services business, which is currently still nascent and comprises only a small portion of total revenues. We are continuing to advance our capa-bilities in areas such as media services, end-to-end fulfil-ment solutions and white label e-commerce solutions for third party brands. Not only does this create new revenue streams from the brands that use these services, but it also deepens our relationships with them and further inte-grates those brands into our platform.
Geographic expansionGFG’s platforms have been built for scale and could sup-port a potential expansion into new markets. In particular, there are opportunities for GFG to expand into countries that are adjacent to its existing footprint in Asia Pacific and Latin America. Any potential geographic expansion would be focused on markets that offer similar benefits and opportunities to GFG’s existing regions. These include markets that are relatively nascent in terms of e-commerce penetration, that offer an early mover advantage, that have sizable populations with attractive demographics, and that could be served with GFG’s existing operating infrastructure.
5. OUTLOOKThe Group provides guidance for ongoing strong revenue growth during 2019, with a focus on reducing Adjusted EBITDA losses and improving operating cash flow, while continuing to focus strategic capital investments on developing the Group technology infrastructure and enhancing the fulfilment and distribution capabilities in our markets.
5.1 Guidance
GFG confirms it’s guidance for 2019: The Group forecasts NMV growth between 20 – 23% on a constant currency basis, growing to EUR 1.7 – 1.8bn.
The Group forecasts revenue to grow to above EUR 1.3bn in 2019.
At the same time, GFG expects to reduce losses, and make further progress towards Adjusted EBITDA break-even, continuing on the path to profitability.
Having invested EUR 25m in the first half of the year, we now expect 2019 Capex to be around EUR 80m due to phasing benefits and the results of continuously optimis-ing our ongoing investment plans.
20
H1 IN
TERI
M M
ANAG
EMEN
T RE
PORT
| G
LOBA
L FA
SHIO
N GR
OUP
Inte
rim G
roup
Man
agem
ent R
epor
t
6. CAUTIONARY STATEMENT REGARDING FORWARD- LOOKING STATEMENTS
Certain statements included in this document are for-ward-looking statements. Forward-looking statements can typically be identified by the use of words such as “expects”, “may”, “will”, “could”, “should”, “intends”, “plans”, “predicts”, “envisages” or “anticipates” or other words of similar meaning. These forward-looking statements are based upon current expectations and assumptions regarding anticipated developments and other factors affecting Global Fashion Group S.A. (“GFG”) and its group (the “GFG Group”). They are not historical or current facts, nor are they guarantees of future performance.
By their nature, forward-looking statements involve a number of risks, uncertainties and assumptions that could cause actual results or events to differ materially from those expressed or implied by the forward-looking state-ments. These risks, uncertainties and assumptions could adversely affect the outcome and financial effects of the plans and events described in this document. These for-ward-looking statements speak only as of the date of this announcement. Except as required by any applicable law or regulation, the GFG Group expressly disclaims any obligation or undertaking to release publicly any updates or revisions to any forward-looking statements contained in this document to reflect any change in the Group’s expectations with regard thereto or any change in events, conditions or circumstances on which any such for-ward-looking statement is based. These risks and uncer-tainties include those discussed or identified in the filings with the Luxembourg financial and stock market regulator (Commission de Surveillance du Secteur Financier). Nei-ther GFG nor any other person accepts any responsibility for the accuracy of the opinions expressed in this docu-ment or the underlying assumptions.
21
H1 IN
TERI
M M
ANAG
EMEN
T RE
PORT
| G
LOBA
L FA
SHIO
N GR
OUP
Inte
rim G
roup
Man
agem
ent R
epor
t

INTERIM CONDENSED CONSOLIDATED FINANCIAL STATEMENTS
22
H1 IN
TERI
M M
ANAG
EMEN
T RE
PORT
| G
LOBA
L FA
SHIO
N GR
OUP
Inte
rim c
onde
nsed
con
solid
ated
fina
ncia
l sta
tem
ents
INTERIM CONDENSED CONSOLIDATED FINANCIAL STATEMENTS 22Interim condensed consolidated statement of profit or loss 24
Interim condensed consolidated statement of comprehensive income 25
Interim condensed consolidated statement of financial position 26
Interim condensed consolidated statement of changes in equity 28
Interim condensed consolidated statement of cash flows 30
Selected explanatory notes to the interim condensed consolidated financial statements 32
1. Corporate information 33
2. Basis of preparation 34
3. Critical accounting estimates and judgements in applying accounting policies 34
4. Changes in significant accounting policies 35
5. Segment information 38
6. Financial result 43
7. Income taxes 43
8. Interests in associates 44
9. Loss per share 44
10. Share-based payments / share-based compensation 45
11. Property, plant and equipment and right-of-use assets 46
12. Goodwill and other intangible assets 46
13. Inventories 47
14. Other financial assets 47
15. Cash and cash equivalents 47
16. Equity 47
17. Financial Risk Management and Fair Value Measurement 48
18. Balances and transactions with related parties 48
19. Revolving Credit Facility 48
20. Events after reporting period 49
Responsibility statement by the Management Board 50
Review opinion 51
23
H1 IN
TERI
M M
ANAG
EMEN
T RE
PORT
| G
LOBA
L FA
SHIO
N GR
OUP
Inte
rim c
onde
nsed
con
solid
ated
fina
ncia
l sta
tem
ents
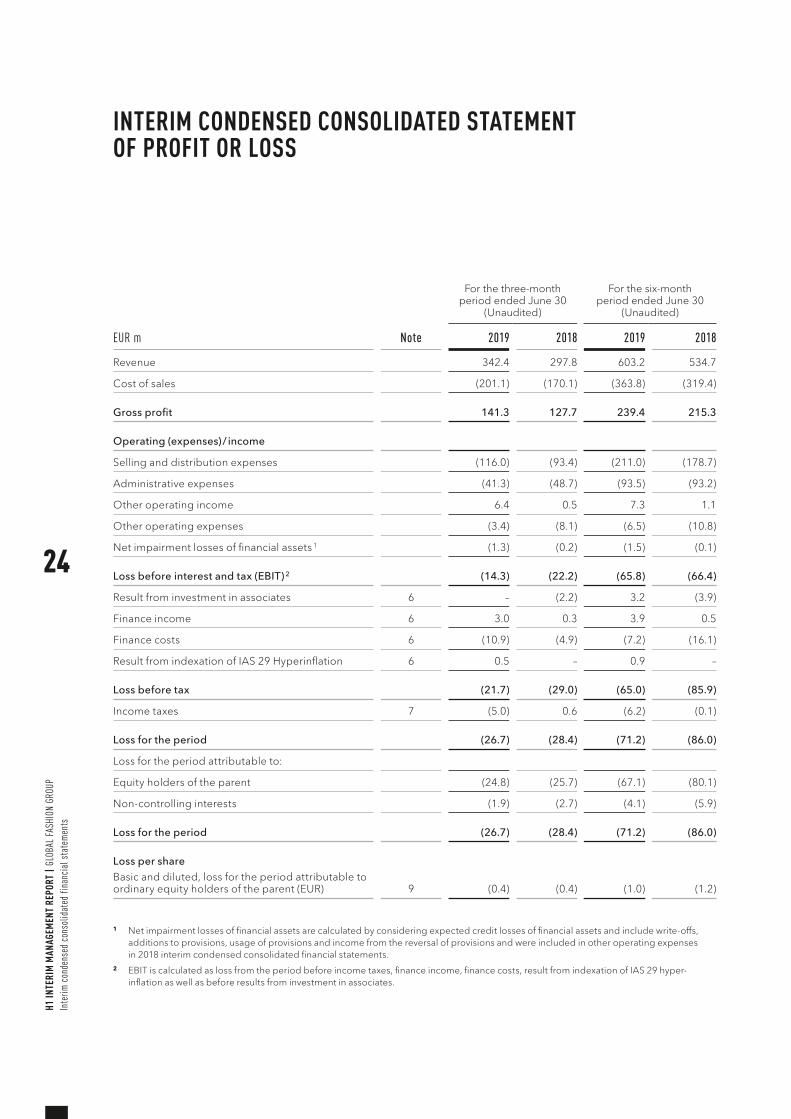
INTERIM CONDENSED CONSOLIDATED STATEMENT OF PROFIT OR LOSS
EUR m Note
For the three-month period ended June 30
(Unaudited)
For the six-month period ended June 30
(Unaudited)
2019 2018 2019 2018
Revenue 342.4 297.8 603.2 534.7
Cost of sales (201.1) (170.1) (363.8) (319.4)
Gross profit 141.3 127.7 239.4 215.3
Operating (expenses) / income
Selling and distribution expenses (116.0) (93.4) (211.0) (178.7)
Administrative expenses (41.3) (48.7) (93.5) (93.2)
Other operating income 6.4 0.5 7.3 1.1
Other operating expenses (3.4) (8.1) (6.5) (10.8)
Net impairment losses of financial assets 1 (1.3) (0.2) (1.5) (0.1)
Loss before interest and tax (EBIT) 2 (14.3) (22.2) (65.8) (66.4)
Result from investment in associates 6 – (2.2) 3.2 (3.9)
Finance income 6 3.0 0.3 3.9 0.5
Finance costs 6 (10.9) (4.9) (7.2) (16.1)
Result from indexation of IAS 29 Hyperinflation 6 0.5 – 0.9 –
Loss before tax (21.7) (29.0) (65.0) (85.9)
Income taxes 7 (5.0) 0.6 (6.2) (0.1)
Loss for the period (26.7) (28.4) (71.2) (86.0)
Loss for the period attributable to:
Equity holders of the parent (24.8) (25.7) (67.1) (80.1)
Non-controlling interests (1.9) (2.7) (4.1) (5.9)
Loss for the period (26.7) (28.4) (71.2) (86.0)
Loss per shareBasic and diluted, loss for the period attributable to ordinary equity holders of the parent (EUR) 9 (0.4) (0.4) (1.0) (1.2)
1 Net impairment losses of financial assets are calculated by considering expected credit losses of financial assets and include write-offs, additions to provisions, usage of provisions and income from the reversal of provisions and were included in other operating expenses in 2018 interim condensed consolidated financial statements.
2 EBIT is calculated as loss from the period before income taxes, finance income, finance costs, result from indexation of IAS 29 hyper-inflation as well as before results from investment in associates.
24
H1 IN
TERI
M M
ANAG
EMEN
T RE
PORT
| G
LOBA
L FA
SHIO
N GR
OUP
Inte
rim c
onde
nsed
con
solid
ated
fina
ncia
l sta
tem
ents
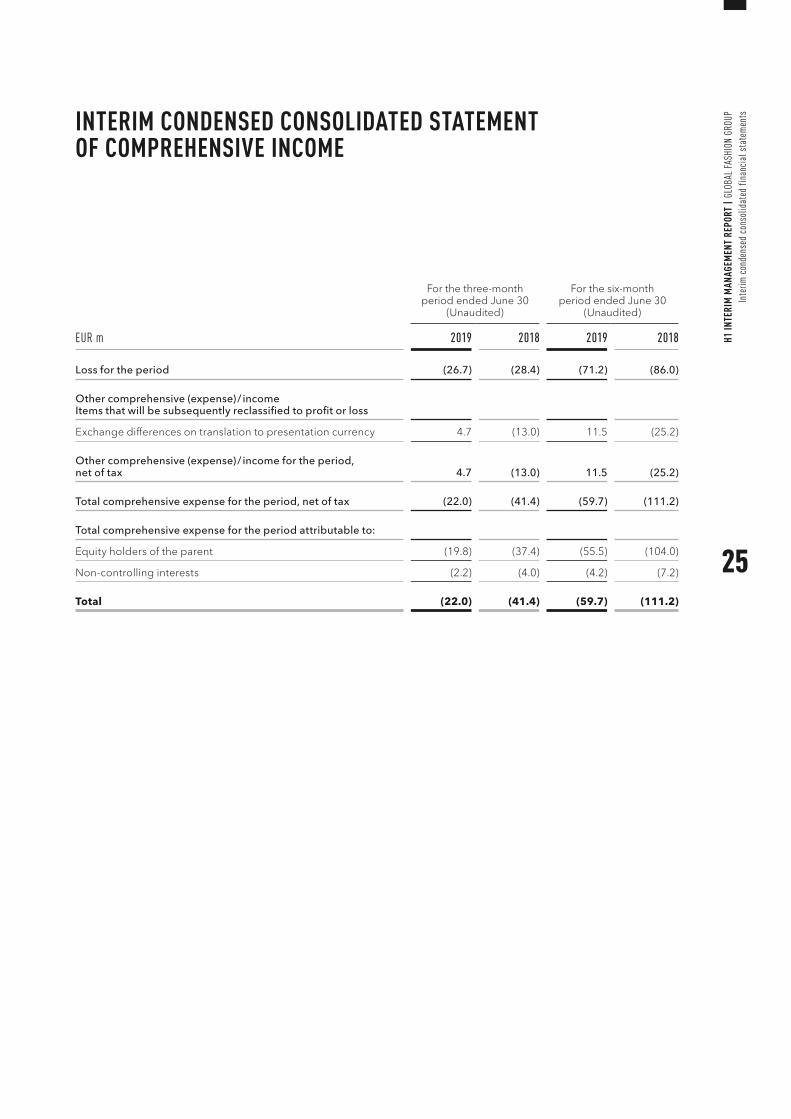
INTERIM CONDENSED CONSOLIDATED STATEMENT OF COMPREHENSIVE INCOME
EUR m
For the three-month period ended June 30
(Unaudited)
For the six-month period ended June 30
(Unaudited)
2019 2018 2019 2018
Loss for the period (26.7) (28.4) (71.2) (86.0)
Other comprehensive (expense) / incomeItems that will be subsequently reclassified to profit or loss
Exchange differences on translation to presentation currency 4.7 (13.0) 11.5 (25.2)
Other comprehensive (expense) / income for the period, net of tax 4.7 (13.0) 11.5 (25.2)
Total comprehensive expense for the period, net of tax (22.0) (41.4) (59.7) (111.2)
Total comprehensive expense for the period attributable to:
Equity holders of the parent (19.8) (37.4) (55.5) (104.0)
Non-controlling interests (2.2) (4.0) (4.2) (7.2)
Total (22.0) (41.4) (59.7) (111.2)
25
H1 IN
TERI
M M
ANAG
EMEN
T RE
PORT
| G
LOBA
L FA
SHIO
N GR
OUP
Inte
rim c
onde
nsed
con
solid
ated
fina
ncia
l sta
tem
ents
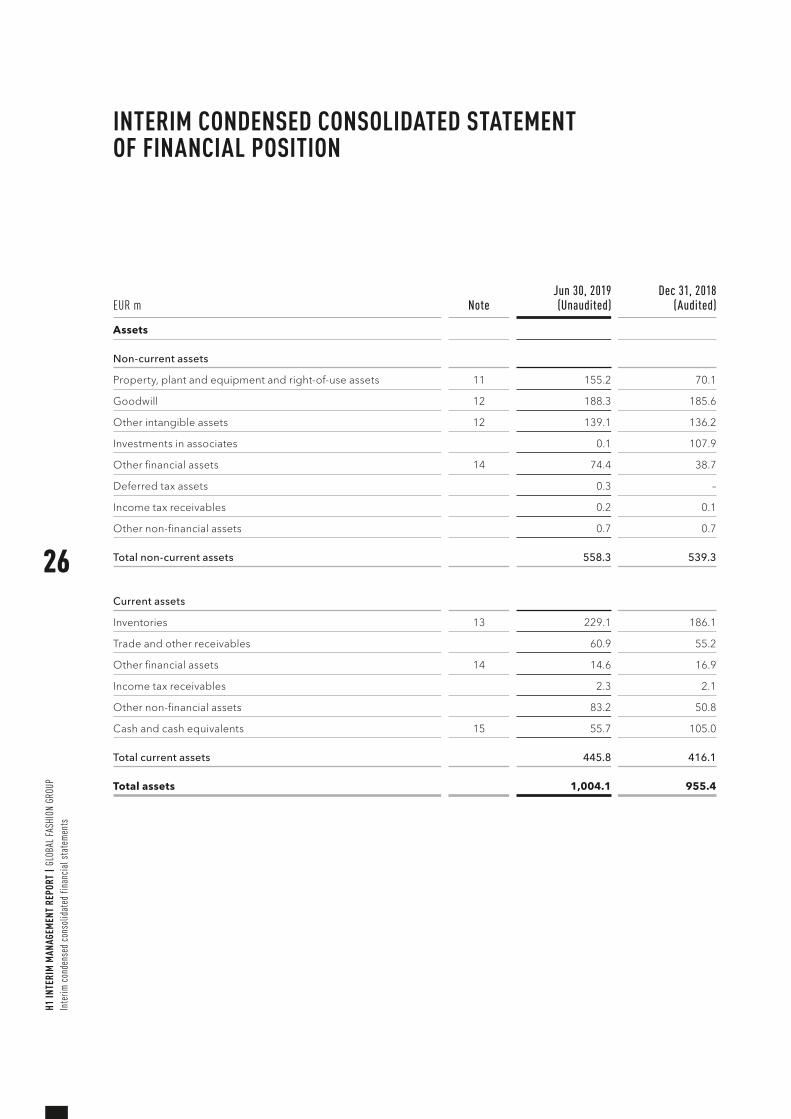
INTERIM CONDENSED CONSOLIDATED STATEMENT OF FINANCIAL POSITION
EUR m NoteJun 30, 2019 (Unaudited)
Dec 31, 2018 (Audited)
Assets
Non-current assets
Property, plant and equipment and right-of-use assets 11 155.2 70.1
Goodwill 12 188.3 185.6
Other intangible assets 12 139.1 136.2
Investments in associates 0.1 107.9
Other financial assets 14 74.4 38.7
Deferred tax assets 0.3 –
Income tax receivables 0.2 0.1
Other non-financial assets 0.7 0.7
Total non-current assets 558.3 539.3
Current assets
Inventories 13 229.1 186.1
Trade and other receivables 60.9 55.2
Other financial assets 14 14.6 16.9
Income tax receivables 2.3 2.1
Other non-financial assets 83.2 50.8
Cash and cash equivalents 15 55.7 105.0
Total current assets 445.8 416.1
Total assets 1,004.1 955.4
26
H1 IN
TERI
M M
ANAG
EMEN
T RE
PORT
| G
LOBA
L FA
SHIO
N GR
OUP
Inte
rim c
onde
nsed
con
solid
ated
fina
ncia
l sta
tem
ents
EUR m NoteJun 30, 2019 (Unaudited)
Dec 31, 2018 (Audited)
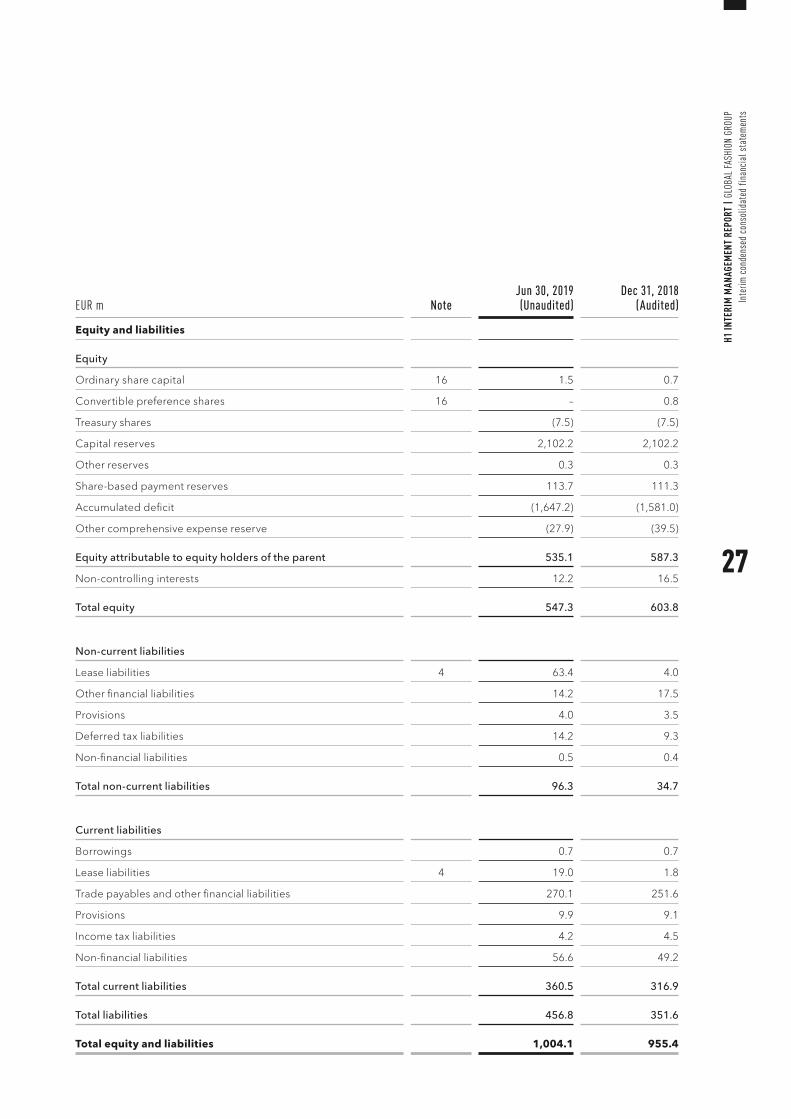
Equity and liabilities
Equity
Ordinary share capital 16 1.5 0.7
Convertible preference shares 16 – 0.8
Treasury shares (7.5) (7.5)
Capital reserves 2,102.2 2,102.2
Other reserves 0.3 0.3
Share-based payment reserves 113.7 111.3
Accumulated deficit (1,647.2) (1,581.0)
Other comprehensive expense reserve (27.9) (39.5)
Equity attributable to equity holders of the parent 535.1 587.3
Non-controlling interests 12.2 16.5
Total equity 547.3 603.8
Non-current liabilities
Lease liabilities 4 63.4 4.0
Other financial liabilities 14.2 17.5
Provisions 4.0 3.5
Deferred tax liabilities 14.2 9.3
Non-financial liabilities 0.5 0.4
Total non-current liabilities 96.3 34.7
Current liabilities
Borrowings 0.7 0.7
Lease liabilities 4 19.0 1.8
Trade payables and other financial liabilities 270.1 251.6
Provisions 9.9 9.1
Income tax liabilities 4.2 4.5
Non-financial liabilities 56.6 49.2
Total current liabilities 360.5 316.9
Total liabilities 456.8 351.6
Total equity and liabilities 1,004.1 955.4
27
H1 IN
TERI
M M
ANAG
EMEN
T RE
PORT
| G
LOBA
L FA
SHIO
N GR
OUP
Inte
rim c
onde
nsed
con
solid
ated
fina
ncia
l sta
tem
ents
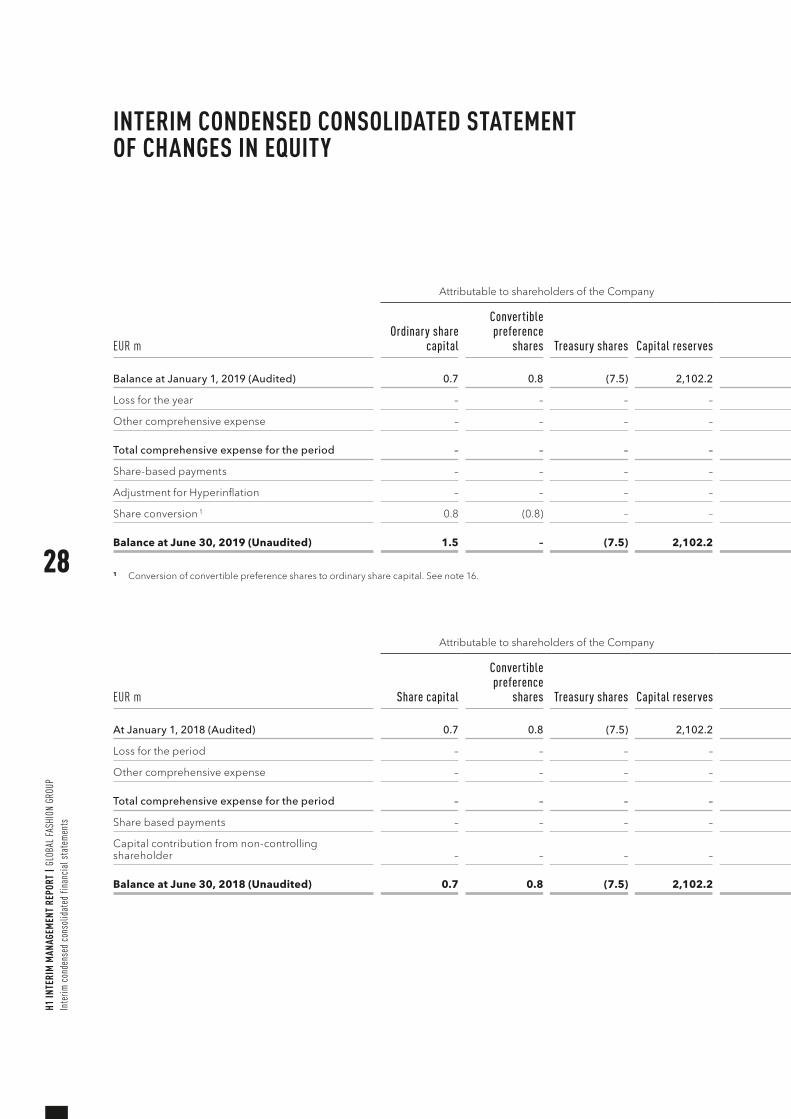
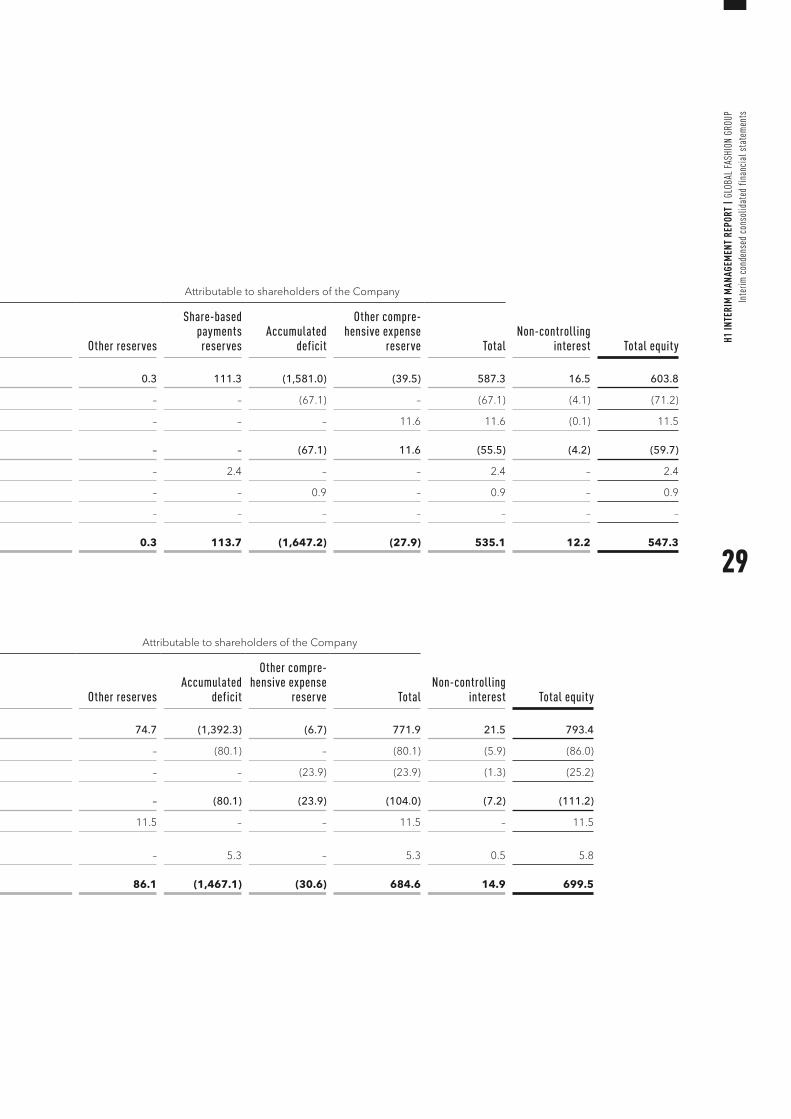
INTERIM CONDENSED CONSOLIDATED STATEMENT OF CHANGES IN EQUITY
EUR m
Attributable to shareholders of the Company Attributable to shareholders of the Company
Non-controlling interest Total equity
Ordinary share capital
Convertible preference
shares Treasury shares Capital reserves Other reserves
Share-based payments reserves
Accumulated deficit
Other compre-hensive expense
reserve Total
Balance at January 1, 2019 (Audited) 0.7 0.8 (7.5) 2,102.2 0.3 111.3 (1,581.0) (39.5) 587.3 16.5 603.8
Loss for the year – – – – – – (67.1) – (67.1) (4.1) (71.2)
Other comprehensive expense – – – – – – – 11.6 11.6 (0.1) 11.5
Total comprehensive expense for the period – – – – – – (67.1) 11.6 (55.5) (4.2) (59.7)
Share-based payments – – – – – 2.4 – – 2.4 – 2.4
Adjustment for Hyperinflation – – – – – – 0.9 – 0.9 – 0.9
Share conversion 1 0.8 (0.8) – – – – – – – – –
Balance at June 30, 2019 (Unaudited) 1.5 – (7.5) 2,102.2 0.3 113.7 (1,647.2) (27.9) 535.1 12.2 547.3
1 Conversion of convertible preference shares to ordinary share capital. See note 16.
EUR m
Attributable to shareholders of the Company Attributable to shareholders of the Company
Non-controlling interest Total equityShare capital
Convertible preference
shares Treasury shares Capital reserves Other reservesAccumulated
deficit
Other compre-hensive expense
reserve Total
At January 1, 2018 (Audited) 0.7 0.8 (7.5) 2,102.2 74.7 (1,392.3) (6.7) 771.9 21.5 793.4
Loss for the period – – – – – (80.1) – (80.1) (5.9) (86.0)
Other comprehensive expense – – – – – – (23.9) (23.9) (1.3) (25.2)
Total comprehensive expense for the period – – – – – (80.1) (23.9) (104.0) (7.2) (111.2)
Share based payments – – – – 11.5 – – 11.5 – 11.5
Capital contribution from non-controlling shareholder – – – – – 5.3 – 5.3 0.5 5.8
Balance at June 30, 2018 (Unaudited) 0.7 0.8 (7.5) 2,102.2 86.1 (1,467.1) (30.6) 684.6 14.9 699.5
28
H1 IN
TERI
M M
ANAG
EMEN
T RE
PORT
| G
LOBA
L FA
SHIO
N GR
OUP
Inte
rim c
onde
nsed
con
solid
ated
fina
ncia
l sta
tem
ents
INTERIM CONDENSED CONSOLIDATED STATEMENT OF CHANGES IN EQUITY
EUR m
Attributable to shareholders of the Company Attributable to shareholders of the Company
Non-controlling interest Total equity
Ordinary share capital
Convertible preference
shares Treasury shares Capital reserves Other reserves
Share-based payments reserves
Accumulated deficit
Other compre-hensive expense
reserve Total
Balance at January 1, 2019 (Audited) 0.7 0.8 (7.5) 2,102.2 0.3 111.3 (1,581.0) (39.5) 587.3 16.5 603.8
Loss for the year – – – – – – (67.1) – (67.1) (4.1) (71.2)
Other comprehensive expense – – – – – – – 11.6 11.6 (0.1) 11.5
Total comprehensive expense for the period – – – – – – (67.1) 11.6 (55.5) (4.2) (59.7)
Share-based payments – – – – – 2.4 – – 2.4 – 2.4
Adjustment for Hyperinflation – – – – – – 0.9 – 0.9 – 0.9
Share conversion 1 0.8 (0.8) – – – – – – – – –
Balance at June 30, 2019 (Unaudited) 1.5 – (7.5) 2,102.2 0.3 113.7 (1,647.2) (27.9) 535.1 12.2 547.3
1 Conversion of convertible preference shares to ordinary share capital. See note 16.
EUR m
Attributable to shareholders of the Company Attributable to shareholders of the Company
Non-controlling interest Total equityShare capital
Convertible preference
shares Treasury shares Capital reserves Other reservesAccumulated
deficit
Other compre-hensive expense
reserve Total
At January 1, 2018 (Audited) 0.7 0.8 (7.5) 2,102.2 74.7 (1,392.3) (6.7) 771.9 21.5 793.4
Loss for the period – – – – – (80.1) – (80.1) (5.9) (86.0)
Other comprehensive expense – – – – – – (23.9) (23.9) (1.3) (25.2)
Total comprehensive expense for the period – – – – – (80.1) (23.9) (104.0) (7.2) (111.2)
Share based payments – – – – 11.5 – – 11.5 – 11.5
Capital contribution from non-controlling shareholder – – – – – 5.3 – 5.3 0.5 5.8
Balance at June 30, 2018 (Unaudited) 0.7 0.8 (7.5) 2,102.2 86.1 (1,467.1) (30.6) 684.6 14.9 699.5
29
H1 IN
TERI
M M
ANAG
EMEN
T RE
PORT
| G
LOBA
L FA
SHIO
N GR
OUP
Inte
rim c
onde
nsed
con
solid
ated
fina
ncia
l sta
tem
ents
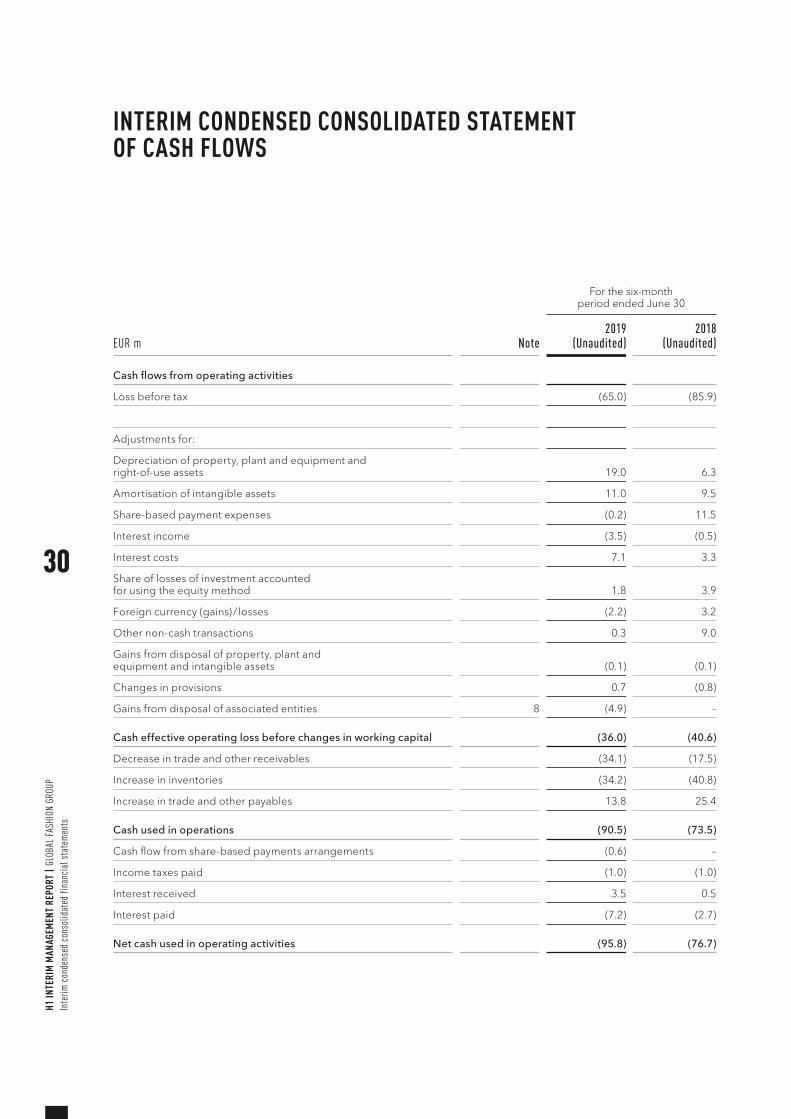
INTERIM CONDENSED CONSOLIDATED STATEMENT OF CASH FLOWS
Note
For the six-month period ended June 30
EUR m 2019
(Unaudited)2018
(Unaudited)
Cash flows from operating activities
Loss before tax (65.0) (85.9)
Adjustments for:
Depreciation of property, plant and equipment and right-of-use assets 19.0 6.3
Amortisation of intangible assets 11.0 9.5
Share-based payment expenses (0.2) 11.5
Interest income (3.5) (0.5)
Interest costs 7.1 3.3
Share of losses of investment accounted for using the equity method 1.8 3.9
Foreign currency (gains) / losses (2.2) 3.2
Other non-cash transactions 0.3 9.0
Gains from disposal of property, plant and equipment and intangible assets (0.1) (0.1)
Changes in provisions 0.7 (0.8)
Gains from disposal of associated entities 8 (4.9) –
Cash effective operating loss before changes in working capital (36.0) (40.6)
Decrease in trade and other receivables (34.1) (17.5)
Increase in inventories (34.2) (40.8)
Increase in trade and other payables 13.8 25.4
Cash used in operations (90.5) (73.5)
Cash flow from share-based payments arrangements (0.6) –
Income taxes paid (1.0) (1.0)
Interest received 3.5 0.5
Interest paid (7.2) (2.7)
Net cash used in operating activities (95.8) (76.7)
30
H1 IN
TERI
M M
ANAG
EMEN
T RE
PORT
| G
LOBA
L FA
SHIO
N GR
OUP
Inte
rim c
onde
nsed
con
solid
ated
fina
ncia
l sta
tem
ents
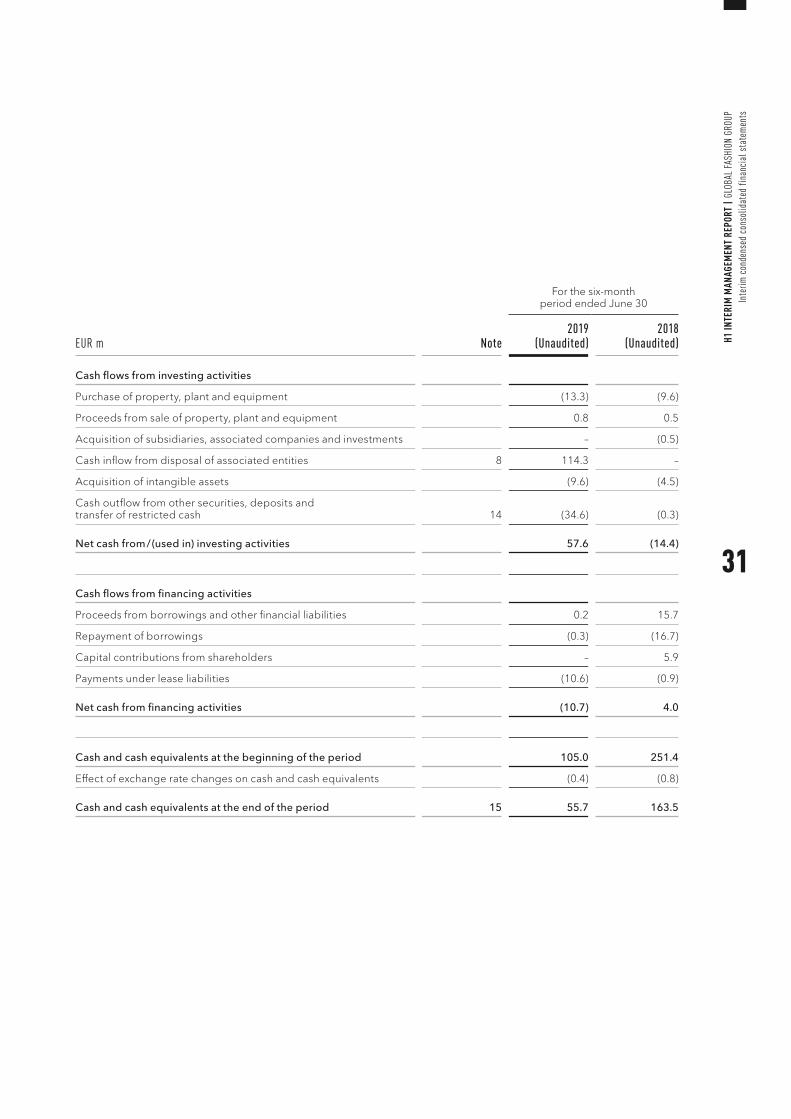
Note
For the six-month period ended June 30
EUR m 2019
(Unaudited)2018
(Unaudited)
Cash flows from investing activities
Purchase of property, plant and equipment (13.3) (9.6)
Proceeds from sale of property, plant and equipment 0.8 0.5
Acquisition of subsidiaries, associated companies and investments – (0.5)
Cash inflow from disposal of associated entities 8 114.3 –
Acquisition of intangible assets (9.6) (4.5)
Cash outflow from other securities, deposits and transfer of restricted cash 14 (34.6) (0.3)
Net cash from / (used in) investing activities 57.6 (14.4)
Cash flows from financing activities
Proceeds from borrowings and other financial liabilities 0.2 15.7
Repayment of borrowings (0.3) (16.7)
Capital contributions from shareholders – 5.9
Payments under lease liabilities (10.6) (0.9)
Net cash from financing activities (10.7) 4.0
Cash and cash equivalents at the beginning of the period 105.0 251.4
Effect of exchange rate changes on cash and cash equivalents (0.4) (0.8)
Cash and cash equivalents at the end of the period 15 55.7 163.5
31
H1 IN
TERI
M M
ANAG
EMEN
T RE
PORT
| G
LOBA
L FA
SHIO
N GR
OUP
Inte
rim c
onde
nsed
con
solid
ated
fina
ncia
l sta
tem
ents

SELECTED EXPLANATORY NOTES TO THE INTERIM CONDENSED CONSOLIDATED FINANCIAL STATEMENTS
32
H1 IN
TERI
M M
ANAG
EMEN
T RE
PORT
| G
LOBA
L FA
SHIO
N GR
OUP
Sele
cted
exp
lana
tory
not
es to
the
inte
rim c
onde
nsed
con
solid
ated
fina
ncia
l sta
tem
ents
1. CORPORATE INFORMATIONGeneral information
The interim condensed consolidated financial statements present the operations of Global Fashion Group S.A. (‘GFG S.A.’). GFG S.A. is hereinafter referred as the ‘Com-pany’. The Company and its subsidiaries are referred to as ‘Global Fashion Group’, the ‘Group’ or ‘GFG’.
GFG S.A. is a stock corporation (société anonyme) under the laws of the Grand Duchy of Luxembourg and is regis-tered in the Luxembourg Trade and Companies Register: RCS B 190.907. GFG is domiciled in Luxembourg with its registered office located at 5, Heienhaff L - 1736 Senninger berg.
The largest shareholders of the Group are Kinnevik AB (‘Kinnevik’) and Rocket Internet SE (formerly Rocket Inter-net AG, ‘Rocket’).
The condensed consolidated financial statements were approved and authorised for issue by the board of direc-tors on August 20, 2019 and were signed on its behalf.
Business activities
The Group’s principal business activity is fashion and life-style e-commerce and associated ancillary services such as marketing, technology, payment, warehousing, and logistics services. The Group offers a wide assortment of leading international and local fashion brands, as well as a selection of own label brands. The Group operates in growth markets through four e-commerce platforms across three regions in 17 countries under the following labels: dafiti (LATAM), lamoda (CIS), THE ICONIC and ZALORA (APAC).
On February 18, 2019, the Group entered into an agree-ment to sell its 46.93% share of Namshi Holding Limited to Emaar Malls. The transaction was completed on Feb-ruary 25, 2019 for total consideration of USD 129.5m (EUR 114.3m). See Note 8 for further details.
On March 11, 2019, management decided to close Lost Ink, a private label fashion business based in the UK. The impact on adjusted EBITDA for the six-month period is EUR (5.5)m.
On June 3, 2019, the Company announced its intention to conduct an initial public offering and a listing of its shares on the regulated market (Prime Standard) of the Frankfurt Stock Exchange. The Company successfully listed newly issued shares on July 2, 2019, raising net proceeds of EUR 186.1m. See further details in note 20, events after the reporting period.
The variance in revenue and margin over the course of the period reflects the seasonality of fashion sales. The Group’s presence in the northern hemisphere (our CIS business); southern hemisphere (Australia, New Zealand and Brazil) and also countries that cross the equator including South East Asia and Colombia, smooths out the seasonal risks of being concentrated in one geography. New season collections drive most sales in the second and fourth quarter, with the first and third quarter focusing on end of season sales and stock clearance.
33
H1 IN
TERI
M M
ANAG
EMEN
T RE
PORT
| G
LOBA
L FA
SHIO
N GR
OUP
Sele
cted
exp
lana
tory
not
es to
the
inte
rim c
onde
nsed
con
solid
ated
fina
ncia
l sta
tem
ents
2. BASIS OF PREPARATIONStatement of compliance
These interim condensed consolidated financial state-ments for the six-month period ended June 30, 2019 have been prepared in accordance with IAS 34, ‘Interim finan-cial reporting’ as adopted by the European Union (EU).
These interim condensed consolidated financial state-ments do not include all the information and disclosures required for the annual financial statements and should be read in conjunction with the Group’s consolidated financial statements for the year ended December 31, 2018 (which are available on the GFG website as part of the IPO Pro-spectus material), which have been prepared in accor-dance with International Financial Reporting Standards (“IFRS”) as adopted by the EU.
The interim condensed consolidated financial statements are presented in Euro (EUR), unless otherwise stated and all values are rounded to the nearest million with a frac-tional digit in accordance with a commercial rounding approach, except when otherwise indicated. This may result in rounding differences as well as in percentage figures that may not exactly reflect the absolute figures they relate to.
3. CRITICAL ACCOUNTING ESTIMATES AND JUDGE-MENTS IN APPLYING ACCOUNTING POLICIES
The preparation of interim financial statements requires management to make judgements, estimates and assumptions that affect the application of accounting policies and the reported amounts of assets and liabilities, income and expense. Actual results may differ from these estimates.
In preparing these interim condensed financial state-ments, the significant judgements made by management in applying the group's accounting policies and the key sources of estimation uncertainty were largely those as applied to the consolidated financial statements for the year ended December 31, 2018.
34
H1 IN
TERI
M M
ANAG
EMEN
T RE
PORT
| G
LOBA
L FA
SHIO
N GR
OUP
Sele
cted
exp
lana
tory
not
es to
the
inte
rim c
onde
nsed
con
solid
ated
fina
ncia
l sta
tem
ents
4. CHANGES IN SIGNIFICANT ACCOUNTING POLICIES
Except as described below, the accounting policies applied in these interim financial statements are the same as those applied in the Group’s consolidated financial statements as at and for the year ended December 31, 2018. The changes in accounting policies are also expected to be reflected in the Group’s consolidated financial statements as at and for the year ending Decem-ber 31, 2019.
The Group has adopted IFRS 16 Leases in these interim condensed consolidated financial statements. The effects from this first-time adoption is further explained below.
IFRS 16 Leases (issued on January 13, 2016). IFRS 16 rep-resents a new approach to lease accounting that requires a lessee to recognise assets and liabilities for the rights and obligations created by leases.
The Group has applied IFRS 16 using the modified retro-spective approach and therefore the comparative infor-mation has not been restated and continues to be reported under IAS 17 and IFRIC 4.
Policy applicable from January 1, 2019
At inception of a contract, the Group assesses whether a contract is, or contains, a lease. A contract is, or contains, a lease if the contract conveys the right to control the use of an identified asset for a period of time in exchange for consideration. To assess whether a contract conveys the right to control the use of an identified asset, the Group assesses whether:
• the contract involves the use of an identified asset – this may be specified explicitly or implicitly and should be physically distinct or represent substantially all of the capacity of a physically distinct asset. If the supplier has a substantive substitution right, then the asset is not identified;
• the Group has the right to obtain substantially all of the economic benefits from use of the asset throughout the period of use; and
• the Group has the right to direct the use of the asset. The Group has this right when it has the decision- making rights that are most relevant to changing how and for what purpose the asset is used. In rare cases where the decision about how and for what purpose the asset is used is predeter-mined, the Group has the right to direct the use of the asset if either:
– the Group has the right to operate the asset; or
– the Group designed the asset in a way that predetermines how and for what purpose it will be used.
This policy is applied to contracts entered into, or changed, on or after January 1, 2019. For contracts entered into before January 1, 2019, the Group elected to apply the practical expedient and applied IFRS 16 only to con-tracts that were previously identified as leases in accor-dance with IAS 17 and IFRIC 4. The Group elected to use the exemptions proposed by the standard on lease con-tracts for which the lease terms ends within 12 months as of the date of initial application, and lease contracts for which the underlying asset is of low value. The Group has leases of certain office equipment (i. e., personal com-puters, printing and photocopying machines) that are considered of low value.
At inception or on reassessment of a contract that contains a lease component, the Group allocates the consideration in the contract to each lease component on the basis of their relative stand-alone prices.
35
H1 IN
TERI
M M
ANAG
EMEN
T RE
PORT
| G
LOBA
L FA
SHIO
N GR
OUP
Sele
cted
exp
lana
tory
not
es to
the
inte
rim c
onde
nsed
con
solid
ated
fina
ncia
l sta
tem
ents
As a lessee
The Group recognises a right-of-use asset and a lease liability at the lease commencement date. The right-of-use asset is initially measured at cost, which comprises the initial amount of the lease liability adjusted for any lease payments made at or before the commencement date, plus any initial direct costs incurred and an estimate of costs to dismantle and remove the underlying asset or to restore the underlying asset or the site on which it is located, less any lease incentives received.
The right-of-use asset is subsequently depreciated using the straight-line method from the commencement date to the earlier of the end of the useful life of the right-of-use asset or the end of the lease term. The estimated useful lives of right-of-use assets are determined on the same basis as those of property and equipment. In addition, the right-of-use asset is periodically reduced by impairment losses, if any, and adjusted for certain remeasurements of the lease liability.
The lease liability is initially measured at the present value of the lease payments that are not paid at the commence-ment date, discounted using the interest rate implicit in the lease or, if that rate cannot be readily determined, the Group’s incremental borrowing rate. Generally, the Group uses its incremental borrowing rate as the discount rate.
Lease payments included in the measurement of the lease liability comprise the following:
• fixed payments, including in-substance fixed payments;
• variable lease payments that depend on an index or a rate, initially measured using the index or rate as at the commencement date;
• amounts expected to be payable under a residual value guarantee; and
• the exercise price under a purchase option that is reasonably certain to be exercised;
• lease payments in an optional renewal period if the Group is reasonably certain to exercise an extension option, and penalties for early termination of a lease unless the Group is reasonably certain not to terminate early.
The lease liability is measured at amortised cost using the effective interest method. It is remeasured when there is a change in future lease payments arising from a change in an index or rate, if there is a change in the Group’s estimate of the amount expected to be payable under a residual value guarantee, or if the Group changes its assessment of whether it will exercise a purchase, extension or termi-nation option.
When the lease liability is remeasured in this way, a corre-sponding adjustment is made to the carrying amount of the right-of-use asset or is recorded in profit or loss if the carrying amount of the right-of-use asset has been reduced to zero.
36
H1 IN
TERI
M M
ANAG
EMEN
T RE
PORT
| G
LOBA
L FA
SHIO
N GR
OUP
Sele
cted
exp
lana
tory
not
es to
the
inte
rim c
onde
nsed
con
solid
ated
fina
ncia
l sta
tem
ents
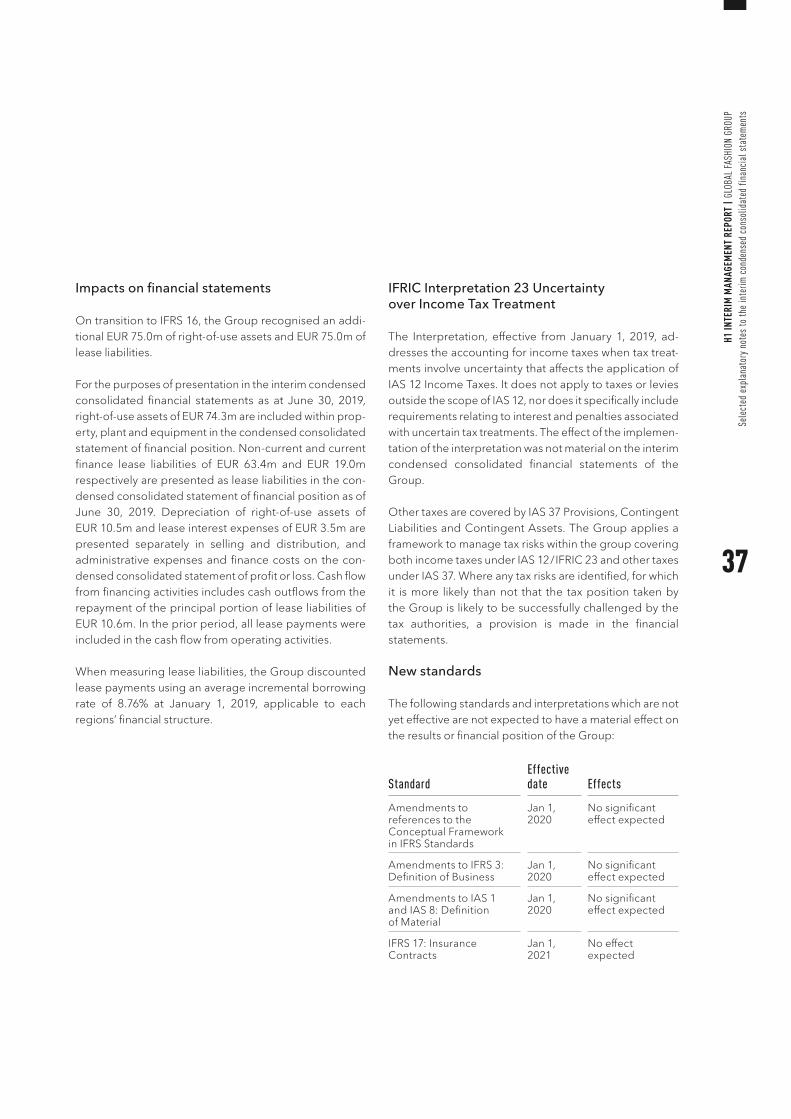
Impacts on financial statements
On transition to IFRS 16, the Group recognised an addi-tional EUR 75.0m of right-of-use assets and EUR 75.0m of lease liabilities.
For the purposes of presentation in the interim condensed consolidated financial statements as at June 30, 2019, right-of-use assets of EUR 74.3m are included within prop-erty, plant and equipment in the condensed consolidated statement of financial position. Non-current and current finance lease liabilities of EUR 63.4m and EUR 19.0m respectively are presented as lease liabilities in the con-densed consolidated statement of financial position as of June 30, 2019. Depreciation of right-of-use assets of EUR 10.5m and lease interest expenses of EUR 3.5m are presented separately in selling and distribution, and administrative expenses and finance costs on the con-densed consolidated statement of profit or loss. Cash flow from financing activities includes cash outflows from the repayment of the principal portion of lease liabilities of EUR 10.6m. In the prior period, all lease payments were included in the cash flow from operating activities.
When measuring lease liabilities, the Group discounted lease payments using an average incremental borrowing rate of 8.76% at January 1, 2019, applicable to each regions’ financial structure.
IFRIC Interpretation 23 Uncertainty over Income Tax Treatment
The Interpretation, effective from January 1, 2019, ad -dresses the accounting for income taxes when tax treat-ments involve uncertainty that affects the application of IAS 12 Income Taxes. It does not apply to taxes or levies outside the scope of IAS 12, nor does it specifically include requirements relating to interest and penalties associated with uncertain tax treatments. The effect of the implemen-tation of the interpretation was not material on the interim condensed consolidated financial statements of the Group.
Other taxes are covered by IAS 37 Provisions, Contingent Liabilities and Contingent Assets. The Group applies a framework to manage tax risks within the group covering both income taxes under IAS 12 / IFRIC 23 and other taxes under IAS 37. Where any tax risks are identified, for which it is more likely than not that the tax position taken by the Group is likely to be successfully challenged by the tax authorities, a provision is made in the financial state ments.
New standards
The following standards and interpretations which are not yet effective are not expected to have a material effect on the results or financial position of the Group:
Standard Effective date Effects
Amendments to references to the Conceptual Framework in IFRS Standards
Jan 1, 2020
No significant effect expected
Amendments to IFRS 3: Definition of Business
Jan 1, 2020
No significant effect expected
Amendments to IAS 1 and IAS 8: Definition of Material
Jan 1, 2020
No significant effect expected
IFRS 17: Insurance Contracts
Jan 1, 2021
No effect expected
37
H1 IN
TERI
M M
ANAG
EMEN
T RE
PORT
| G
LOBA
L FA
SHIO
N GR
OUP
Sele
cted
exp
lana
tory
not
es to
the
inte
rim c
onde
nsed
con
solid
ated
fina
ncia
l sta
tem
ents
5. SEGMENT INFORMATIONOperating segments are components that engage in business activities that may earn revenues or incur expenses, whose operating results are regularly reviewed by the chief operating decision maker (“CODM”) and for which discrete financial information is available.
The Group is organised into three main business seg-ments; APAC (ZALORA and THE ICONIC), LATAM (dafiti) and CIS (lamoda). The column ‘Other’ includes headquar-ter and other business activities.
Segment results do not reflect any consequential effects from the purchase price allocation in connection with the formation of GFG. However, in order to arrive at the GFG consolidated accounts such consequential effects (depre-ciation, amortisation and impairment) are reflected in the ‘reconciliation’ column aside other consolidation adjustments.
Segmental reporting was changed as presented in year end 2018 financial statements and respective amounts for Q2 2018 have been adjusted accordingly.
38
H1 IN
TERI
M M
ANAG
EMEN
T RE
PORT
| G
LOBA
L FA
SHIO
N GR
OUP
Sele
cted
exp
lana
tory
not
es to
the
inte
rim c
onde
nsed
con
solid
ated
fina
ncia
l sta
tem
ents
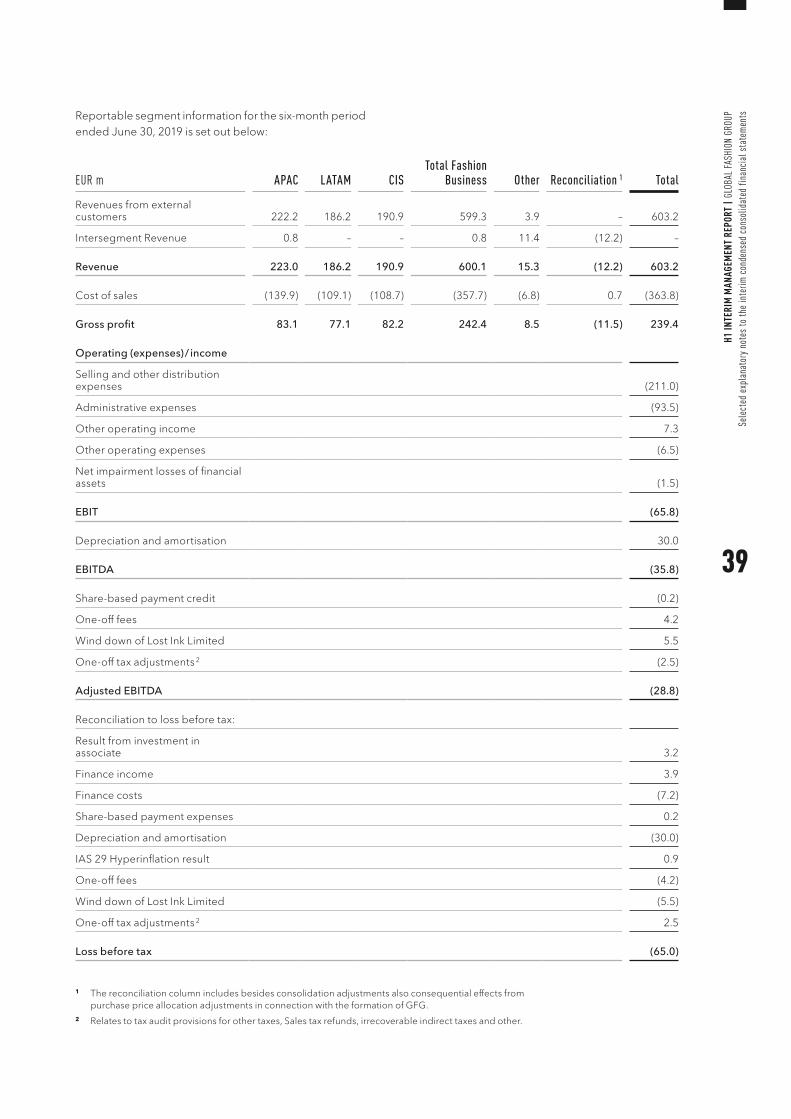
Reportable segment information for the six-month period ended June 30, 2019 is set out below:
EUR m APAC LATAM CISTotal Fashion
Business Other Reconciliation 1 Total
Revenues from external customers 222.2 186.2 190.9 599.3 3.9 – 603.2
Intersegment Revenue 0.8 – – 0.8 11.4 (12.2) –
Revenue 223.0 186.2 190.9 600.1 15.3 (12.2) 603.2
Cost of sales (139.9) (109.1) (108.7) (357.7) (6.8) 0.7 (363.8)
Gross profit 83.1 77.1 82.2 242.4 8.5 (11.5) 239.4
Operating (expenses) / income
Selling and other distribution expenses (211.0)
Administrative expenses (93.5)
Other operating income 7.3
Other operating expenses (6.5)
Net impairment losses of financial assets (1.5)
EBIT (65.8)
Depreciation and amortisation 30.0
EBITDA (35.8)
Share-based payment credit (0.2)
One-off fees 4.2
Wind down of Lost Ink Limited 5.5
One-off tax adjustments 2 (2.5)
Adjusted EBITDA (28.8)
Reconciliation to loss before tax:
Result from investment in associate 3.2
Finance income 3.9
Finance costs (7.2)
Share-based payment expenses 0.2
Depreciation and amortisation (30.0)
IAS 29 Hyperinflation result 0.9
One-off fees (4.2)
Wind down of Lost Ink Limited (5.5)
One-off tax adjustments 2 2.5
Loss before tax (65.0)
1 The reconciliation column includes besides consolidation adjustments also consequential effects from purchase price allocation adjustments in connection with the formation of GFG.
2 Relates to tax audit provisions for other taxes, Sales tax refunds, irrecoverable indirect taxes and other.
39
H1 IN
TERI
M M
ANAG
EMEN
T RE
PORT
| G
LOBA
L FA
SHIO
N GR
OUP
Sele
cted
exp
lana
tory
not
es to
the
inte
rim c
onde
nsed
con
solid
ated
fina
ncia
l sta
tem
ents
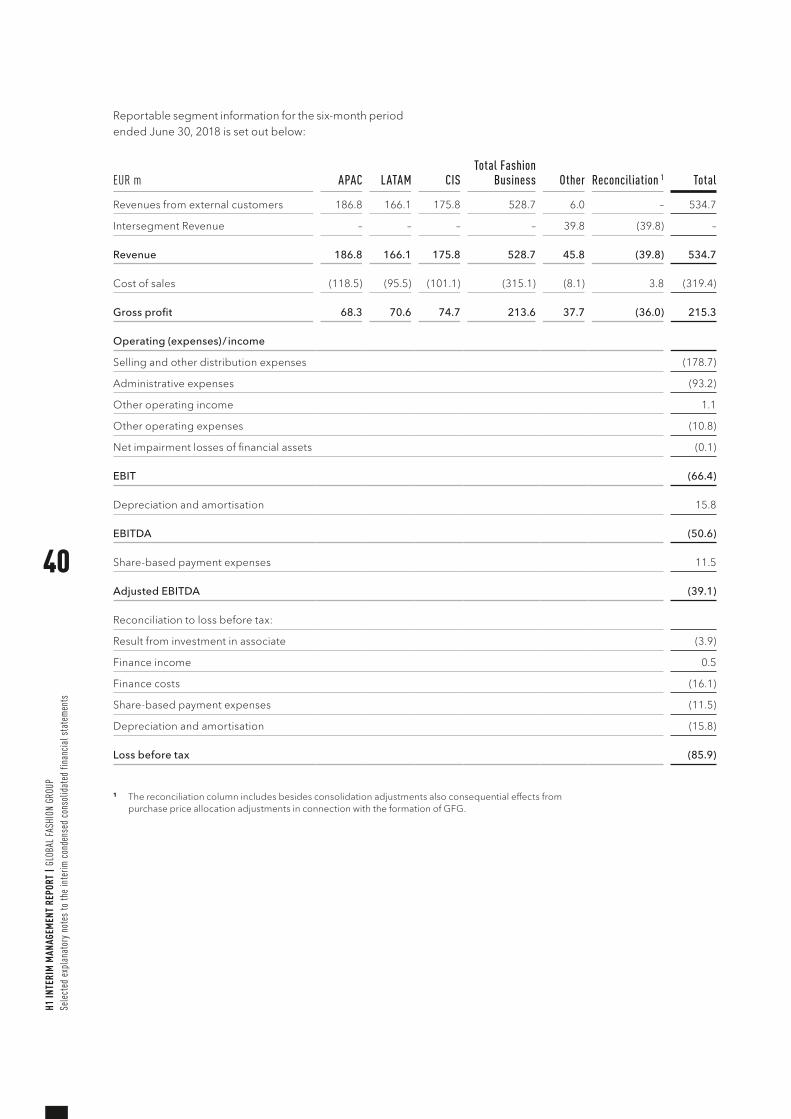
Reportable segment information for the six-month period ended June 30, 2018 is set out below:
EUR m APAC LATAM CISTotal Fashion
Business Other Reconciliation 1 Total
Revenues from external customers 186.8 166.1 175.8 528.7 6.0 – 534.7
Intersegment Revenue – – – – 39.8 (39.8) –
Revenue 186.8 166.1 175.8 528.7 45.8 (39.8) 534.7
Cost of sales (118.5) (95.5) (101.1) (315.1) (8.1) 3.8 (319.4)
Gross profit 68.3 70.6 74.7 213.6 37.7 (36.0) 215.3
Operating (expenses) / income
Selling and other distribution expenses (178.7)
Administrative expenses (93.2)
Other operating income 1.1
Other operating expenses (10.8)
Net impairment losses of financial assets (0.1)
EBIT (66.4)
Depreciation and amortisation 15.8
EBITDA (50.6)
Share-based payment expenses 11.5
Adjusted EBITDA (39.1)
Reconciliation to loss before tax:
Result from investment in associate (3.9)
Finance income 0.5
Finance costs (16.1)
Share-based payment expenses (11.5)
Depreciation and amortisation (15.8)
Loss before tax (85.9)
1 The reconciliation column includes besides consolidation adjustments also consequential effects from purchase price allocation adjustments in connection with the formation of GFG.
40
H1 IN
TERI
M M
ANAG
EMEN
T RE
PORT
| G
LOBA
L FA
SHIO
N GR
OUP
Sele
cted
exp
lana
tory
not
es to
the
inte
rim c
onde
nsed
con
solid
ated
fina
ncia
l sta
tem
ents
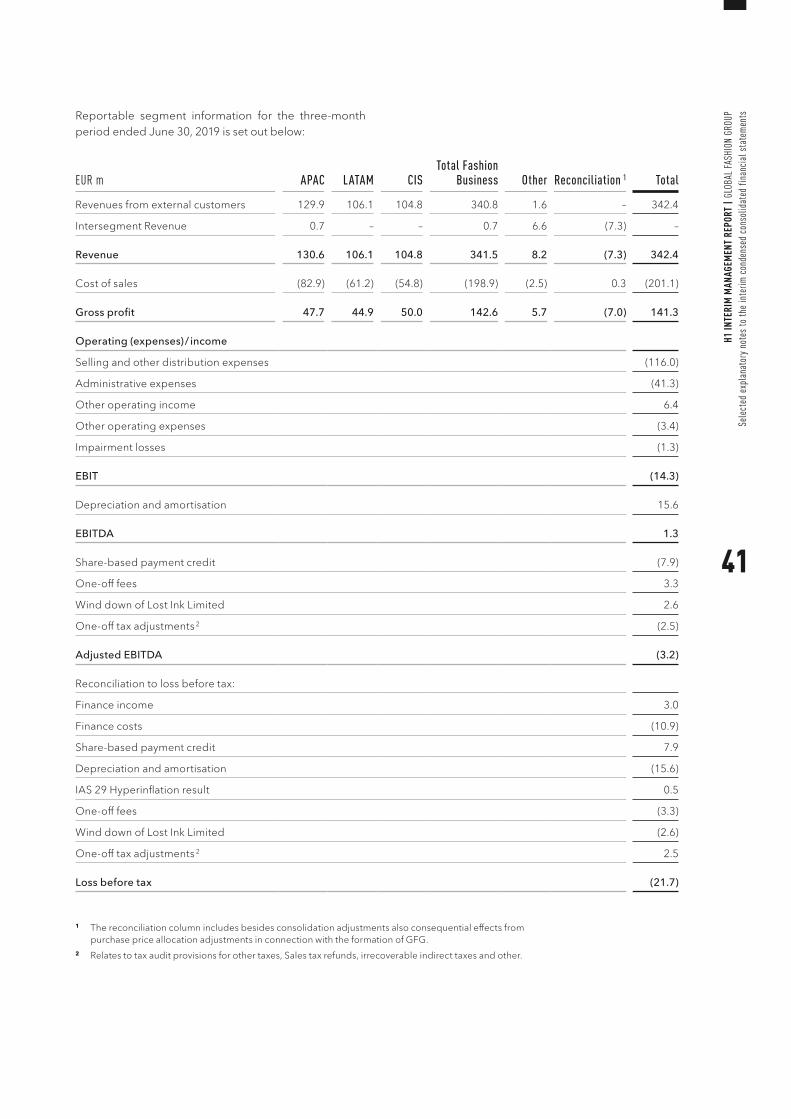
Reportable segment information for the three-month period ended June 30, 2019 is set out below:
EUR m APAC LATAM CISTotal Fashion
Business Other Reconciliation 1 Total
Revenues from external customers 129.9 106.1 104.8 340.8 1.6 – 342.4
Intersegment Revenue 0.7 – – 0.7 6.6 (7.3) –
Revenue 130.6 106.1 104.8 341.5 8.2 (7.3) 342.4
Cost of sales (82.9) (61.2) (54.8) (198.9) (2.5) 0.3 (201.1)
Gross profit 47.7 44.9 50.0 142.6 5.7 (7.0) 141.3
Operating (expenses) / income
Selling and other distribution expenses (116.0)
Administrative expenses (41.3)
Other operating income 6.4
Other operating expenses (3.4)
Impairment losses (1.3)
EBIT (14.3)
Depreciation and amortisation 15.6
EBITDA 1.3
Share-based payment credit (7.9)
One-off fees 3.3
Wind down of Lost Ink Limited 2.6
One-off tax adjustments 2 (2.5)
Adjusted EBITDA (3.2)
Reconciliation to loss before tax:
Finance income 3.0
Finance costs (10.9)
Share-based payment credit 7.9
Depreciation and amortisation (15.6)
IAS 29 Hyperinflation result 0.5
One-off fees (3.3)
Wind down of Lost Ink Limited (2.6)
One-off tax adjustments 2 2.5
Loss before tax (21.7)
1 The reconciliation column includes besides consolidation adjustments also consequential effects from purchase price allocation adjustments in connection with the formation of GFG.
2 Relates to tax audit provisions for other taxes, Sales tax refunds, irrecoverable indirect taxes and other.
41
H1 IN
TERI
M M
ANAG
EMEN
T RE
PORT
| G
LOBA
L FA
SHIO
N GR
OUP
Sele
cted
exp
lana
tory
not
es to
the
inte
rim c
onde
nsed
con
solid
ated
fina
ncia
l sta
tem
ents
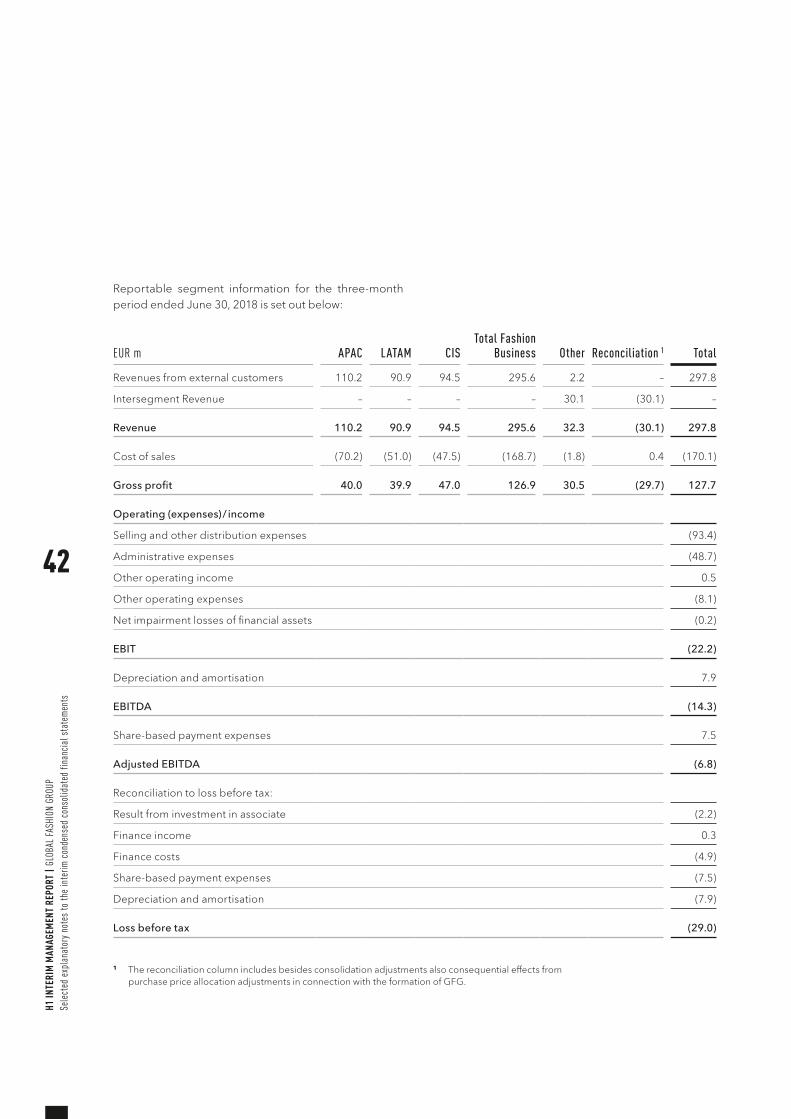
Reportable segment information for the three-month period ended June 30, 2018 is set out below:
EUR m APAC LATAM CISTotal Fashion
Business Other Reconciliation 1 Total
Revenues from external customers 110.2 90.9 94.5 295.6 2.2 – 297.8
Intersegment Revenue – – – – 30.1 (30.1) –
Revenue 110.2 90.9 94.5 295.6 32.3 (30.1) 297.8
Cost of sales (70.2) (51.0) (47.5) (168.7) (1.8) 0.4 (170.1)
Gross profit 40.0 39.9 47.0 126.9 30.5 (29.7) 127.7
Operating (expenses) / income
Selling and other distribution expenses (93.4)
Administrative expenses (48.7)
Other operating income 0.5
Other operating expenses (8.1)
Net impairment losses of financial assets (0.2)
EBIT (22.2)
Depreciation and amortisation 7.9
EBITDA (14.3)
Share-based payment expenses 7.5
Adjusted EBITDA (6.8)
Reconciliation to loss before tax:
Result from investment in associate (2.2)
Finance income 0.3
Finance costs (4.9)
Share-based payment expenses (7.5)
Depreciation and amortisation (7.9)
Loss before tax (29.0)
1 The reconciliation column includes besides consolidation adjustments also consequential effects from purchase price allocation adjustments in connection with the formation of GFG.
42
H1 IN
TERI
M M
ANAG
EMEN
T RE
PORT
| G
LOBA
L FA
SHIO
N GR
OUP
Sele
cted
exp
lana
tory
not
es to
the
inte
rim c
onde
nsed
con
solid
ated
fina
ncia
l sta
tem
ents
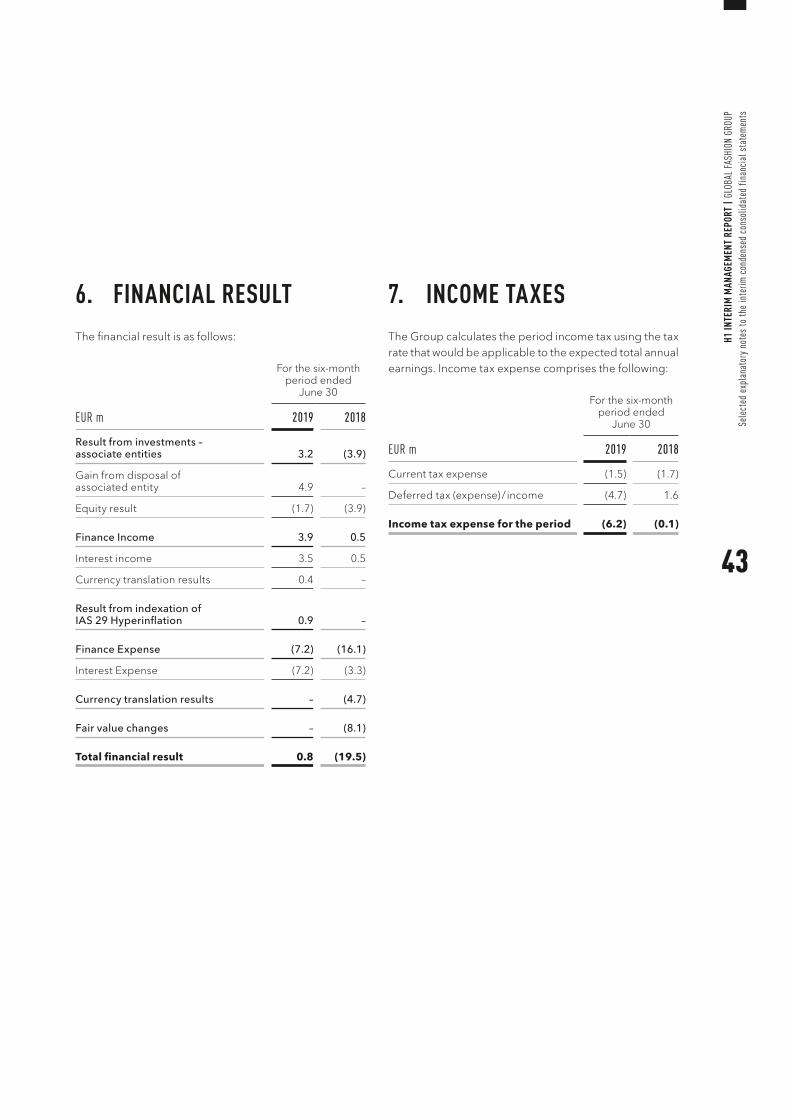
6. FINANCIAL RESULTThe financial result is as follows:
EUR m
For the six-month period ended
June 30
2019 2018
Result from investments – associate entities 3.2 (3.9)
Gain from disposal of associated entity 4.9 –
Equity result (1.7) (3.9)
Finance Income 3.9 0.5
Interest income 3.5 0.5
Currency translation results 0.4 –
Result from indexation of IAS 29 Hyperinflation 0.9 –
Finance Expense (7.2) (16.1)
Interest Expense (7.2) (3.3)
Currency translation results – (4.7)
Fair value changes – (8.1)
Total financial result 0.8 (19.5)
7. INCOME TAXESThe Group calculates the period income tax using the tax rate that would be applicable to the expected total annual earnings. Income tax expense comprises the following:
EUR m
For the six-month period ended
June 30
2019 2018
Current tax expense (1.5) (1.7)
Deferred tax (expense) / income (4.7) 1.6
Income tax expense for the period (6.2) (0.1)
43
H1 IN
TERI
M M
ANAG
EMEN
T RE
PORT
| G
LOBA
L FA
SHIO
N GR
OUP
Sele
cted
exp
lana
tory
not
es to
the
inte
rim c
onde
nsed
con
solid
ated
fina
ncia
l sta
tem
ents
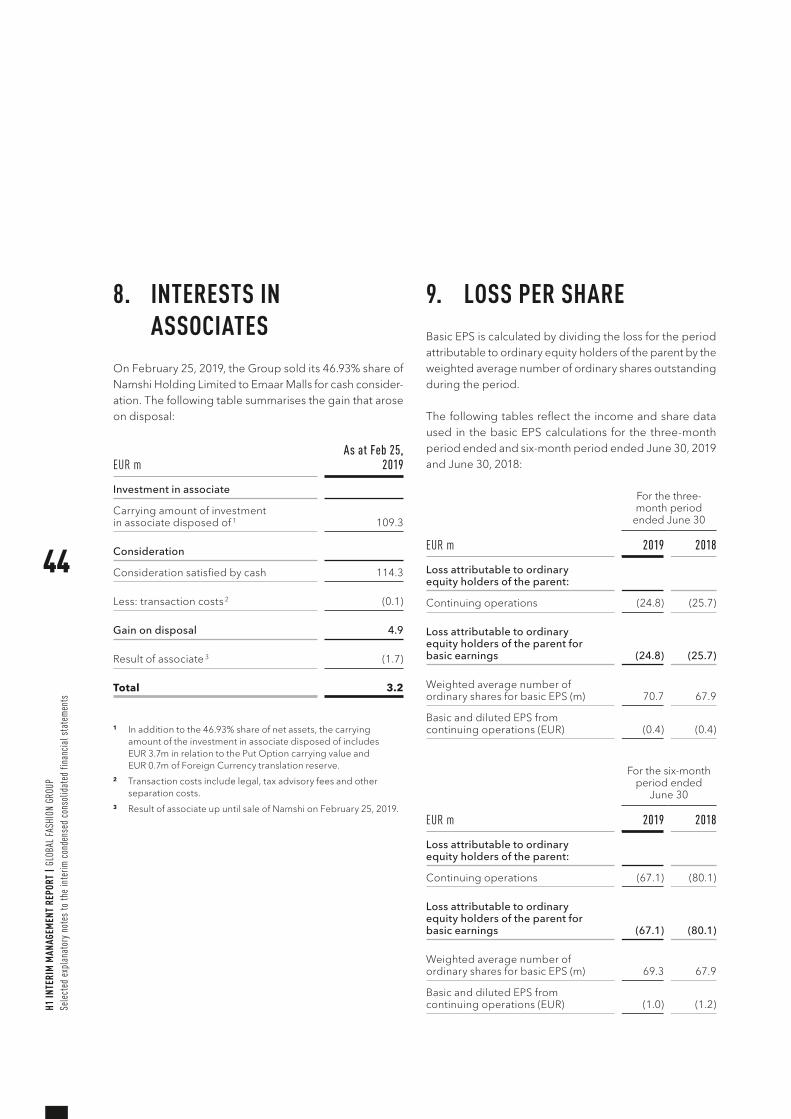
8. INTERESTS IN ASSOCIATES
On February 25, 2019, the Group sold its 46.93% share of Namshi Holding Limited to Emaar Malls for cash consider-ation. The following table summarises the gain that arose on disposal:
EUR m As at Feb 25,
2019
Investment in associate
Carrying amount of investment in associate disposed of 1 109.3
Consideration
Consideration satisfied by cash 114.3
Less: transaction costs 2 (0.1)
Gain on disposal 4.9
Result of associate 3 (1.7)
Total 3.2
1 In addition to the 46.93% share of net assets, the carrying amount of the investment in associate disposed of includes EUR 3.7m in relation to the Put Option carrying value and EUR 0.7m of Foreign Currency translation reserve.
2 Transaction costs include legal, tax advisory fees and other separation costs.
3 Result of associate up until sale of Namshi on February 25, 2019.
9. LOSS PER SHAREBasic EPS is calculated by dividing the loss for the period attributable to ordinary equity holders of the parent by the weighted average number of ordinary shares outstanding during the period.
The following tables reflect the income and share data used in the basic EPS calculations for the three-month period ended and six-month period ended June 30, 2019 and June 30, 2018:
EUR m
For the three-month period
ended June 30
2019 2018
Loss attributable to ordinary equity holders of the parent:
Continuing operations (24.8) (25.7)
Loss attributable to ordinary equity holders of the parent for basic earnings (24.8) (25.7)
Weighted average number of ordinary shares for basic EPS (m) 70.7 67.9
Basic and diluted EPS from continuing operations (EUR) (0.4) (0.4)
EUR m
For the six-month period ended
June 30
2019 2018
Loss attributable to ordinary equity holders of the parent:
Continuing operations (67.1) (80.1)
Loss attributable to ordinary equity holders of the parent for basic earnings (67.1) (80.1)
Weighted average number of ordinary shares for basic EPS (m) 69.3 67.9
Basic and diluted EPS from continuing operations (EUR) (1.0) (1.2)
44
H1 IN
TERI
M M
ANAG
EMEN
T RE
PORT
| G
LOBA
L FA
SHIO
N GR
OUP
Sele
cted
exp
lana
tory
not
es to
the
inte
rim c
onde
nsed
con
solid
ated
fina
ncia
l sta
tem
ents
Other than the newly issued shares following the success-ful IPO, there have been no other transactions involving ordinary shares or potential ordinary shares between the reporting date and the date of authorisation of these financial statements. Please see note 20, events after reporting period for more details.
For diluted loss per share, the weighted average number of ordinary shares in issue is adjusted to assume conver-sion of all dilutive potential ordinary shares that have satisfied the appropriate performance criteria at June 30, 2019.
10. SHARE-BASED PAYMENTS / SHARE-BASED COMPENSATION
At June 30, 2019, the Group’s share-based payment arrangements are composed of:
a) 2018 employee share option plan;
b) Q2 2015 employee stock option plan (cancelled in Q2 2018);
c) Q3 2015 call options;
d) 2014 share-based payment arrangements remaining from the formation of the Group;
e) Inherited share-based payment plans from the acquisition of Kanui and Tricae.
The total share-based payment credit of EUR 0.2m (H1 2018: Expense EUR 11.5m) is comprised of Expense EUR 0.5m (H1 2018: EUR nil) relating to the 2018 employee share option plan and Credit of EUR 0.3m (H1 2018: Expense EUR 11.5m) relating to plans b) – e) mentioned above which taken together had no material changes in the reporting quarter. The cancellation of the Q2 2015 employee stock option plan in Q2 2018 created a larger than usual charge in the comparative period.
a) 2018 Employee share option plan
As at December 31, 2018, the company was still finalising significant terms of the 2018 ESOP. Therefore, it was deter-mined that a grant date of the equity-settled share-based payment awards had not yet been established for account-ing purposes as of the reporting date. In Q1 2019, the terms have been finalised and for all signed contracts it has been deemed that a grant date has now been achieved. The main changes to the ESOP involve reducing the strike price for certain tranches vesting after January 1, 2018 from EUR 9.74 to values ranging from EUR 4.50 – EUR 8.50, subject to a further service condition, and taking away certain tranches vesting in 2021. In addition, for certain future performance-based portions the perfor-mance condition has been eliminated, again subject to an additional service condition. The estimated grant date fair value and the number of instruments were adjusted accordingly.
The grant date fair value of these equity-settled share-based payments was calculated using the inputs disclosed below. Some awards however are still in process of finali-sation and their grant date fair value is not yet es tablished.
In H1 2019, 2,132,368 share options were granted to par-ticipants of the 2018 Employee share option plan. The weighted average exercise price of the options granted was EUR 6.37.
The options granted vest quarterly covering a maximum period up until the end of 2020.
The fair values for all options have been valued using the Black-Scholes model for option pricing, taking into account the terms and conditions on which the stock options were granted.
The stock options generally have a life of up to 10 years. Vested stock options will be exercisable only upon an exit event, including an IPO or trade sale.
45
H1 IN
TERI
M M
ANAG
EMEN
T RE
PORT
| G
LOBA
L FA
SHIO
N GR
OUP
Sele
cted
exp
lana
tory
not
es to
the
inte
rim c
onde
nsed
con
solid
ated
fina
ncia
l sta
tem
ents
The fair value of options granted during the quarter ended June 30, 2019 was estimated using the following assumptions:
Inputs
EUR 2019
Weighted average fair values at measurement date 4.72
The expected life (years) 1.00
Risk Free Rate 0.75% – 7.7%
Expected Volatility (%) 46.31
Expected Dividends Nil
The IPO of the Group in July 2019 is a trigger for the exer-cisability of vested awards. Therefore, the Group adjusted the expected life of the share options for valuation pur-poses to the end of the lock-up period of 12 months after the IPO, reducing the value of the awards by EUR 0.6m.
The weighted average fair value of options granted during the quarter ended March 31, 2019 was EUR 2.32.
As at June 30, 2019, the total amount of options outstand-ing was 9,830,268. All options outstanding vest quarterly up until the end of 2020. The number of awards fully vested was 6,990,309.
In H1 2019, the total expense arising from equity-settled share-based payments is EUR 3.2m (H1 2018: EUR 11.5m). Cash-settled awards resulted in a credit of EUR 3.7m (H1 2018: nil).
11. PROPERTY, PLANT AND EQUIPMENT AND RIGHT-OF-USE ASSETS
During the six-month period ended June 30, 2019, the Group acquired property, plant and equipment with a total cost of EUR 14.7m (June 30, 2018: EUR 10.3m). These investments primarily relate to assets in the course of construction & Office / IT equipment.
The net book value of right-of-use assets in property, plant and equipment as at June 30, 2019 is EUR 74.3m following the adoption of IFRS 16 at January 1, 2019.
12. GOODWILL AND OTHER INTANGIBLE ASSETS
During the six-month period ended June 30, 2019, the Group’s net book value for Goodwill increased, from EUR 185.6m to EUR 188.3m due to the effect from the translation to presentation currency.
As of June 30, 2019, no impairment triggers were present, and no impairment losses were recognised.
During the six-month period ended June 30, 2019, the Group acquired intangible assets with a total cost of EUR 9.9m (June 30, 2018: EUR 4.5m) of which EUR 8.2m (June 30, 2018: EUR 3.4m) were capitalised internally developed intangible assets in accordance with the rec-ognition criteria of IAS 38, Intangible Assets.
46
H1 IN
TERI
M M
ANAG
EMEN
T RE
PORT
| G
LOBA
L FA
SHIO
N GR
OUP
Sele
cted
exp
lana
tory
not
es to
the
inte
rim c
onde
nsed
con
solid
ated
fina
ncia
l sta
tem
ents
13. INVENTORIESDuring the six-month period ended June 30, 2019, the expense from write downs of inventories to net realisable value of EUR 8.0m (six-month period ended June 30, 2018: EUR 6.1m) is included in the costs of sales.
The increase of inventories by EUR 43.0m to EUR 229.1m in the first six months of 2019 is primarily due to building up inventory levels for an expected busy summer / autumn season 2019.
14. OTHER FINANCIAL ASSETSAs at June 30, 2019, other financial assets include restricted cash of EUR 70.0m that provides guarantees to banks, suppliers and leasing partners in relation to the Group's Revolving Credit Facility, that was established on August 28, 2018.
The increase in non-current other financial assets by EUR 35.7m is driven largely by the portion of restricted cash from the Revolving Credit Facility increasing by EUR 40.0m on February 25, 2019.
The transfer from cash and cash equivalents to restricted cash is shown through investing activities in the interim condensed consolidated statement of cash flows.
15. CASH AND CASH EQUIVALENTS
For the purpose of the interim condensed consolidated statement of cash flows, cash and cash equivalents are comprised of the following:
As at Jun 30, 2019
As at Dec 31, 2018
Short-term deposits 21.2 –
Cash at bank and in hand 34.5 105.0
Total cash and short-term deposits 55.7 105.0
16. EQUITYBetween 2015 and 2017, the Company raised EUR 480.0 million of capital in the form of convertible preference shares (“CPS”) from a group of existing shareholders. The agreed terms were such that, in the event of an IPO or corporate transaction, the aggregate subscription price of a CPS held would convert into one newly issued common share based on the pricing achieved in the IPO. The offer price was agreed at EUR 4.50 on June 28, 2019 and trig-gered a conversion of 84,828,235 CPS to common shares at a rate of 1:1. The conversion was effected through a share-buyback and redistribution from existing sharehold-ers to manage anti-dilution.
47
H1 IN
TERI
M M
ANAG
EMEN
T RE
PORT
| G
LOBA
L FA
SHIO
N GR
OUP
Sele
cted
exp
lana
tory
not
es to
the
inte
rim c
onde
nsed
con
solid
ated
fina
ncia
l sta
tem
ents
17. FINANCIAL RISK MANAGEMENT AND FAIR VALUE MEASUREMENT
17.1 Financial Risk Management
In the course of its ordinary business activities, the Group is principally exposed to market risk (primarily currency risk, interest rate risk), credit risk and liquidity risk.
There have been no changes in the Group’s risk manage-ment or in any risk management policies since year end.
Compared to year end, there was no material change in the interest rate risk, foreign currency risk and credit risk and there was no material change in the contractual undis-counted cash out flows for financial liabilities.
17.2 Fair Value Measurement
Management has assessed that the carrying amounts of trade and other receivables, trade and other payables, other current financial assets and other current financial liabilities approximate fair value due to the short-term maturities of these instruments.
The fair values of other financial assets and financial liabil-ities measured at amortised cost as well as of finance lease liabilities approximate their carrying amount, as there were no significant changes in the applicable market rates since these instruments were recognised initially.
18. BALANCES AND TRANS-ACTIONS WITH RELATED PARTIES
Related parties to whom the Group maintains business relationships include Rocket and Kinnevik as they have the ability to exercise significant influence as shareholders of the Group as well as their subsidiaries and joint ventures (referred to as ‘Rocket Group’ and ‘Kinnevik Group’).
During the period, the Group had purchases from Rocket Internet of EUR 0.1m (June 30, 2018: EUR 0.1m) and amounts owed to Rocket Internet of EUR nil (June 30, 2018: EUR 0.1m).
19. REVOLVING CREDIT FACILITY
On August 28, 2018, the Group closed a EUR 70.0m facility ending in October 2020. The total facility amount is split between Facility A EUR 50m and Facility B EUR 20m. Facility A is a base currency revolving credit facility. Facility B is an off-statement of financial position letter of credit facility. As at June 30, 2019, the combined draw down on the facility was EUR 25.8m to facilitate the transition to the IPO RCF.
48
H1 IN
TERI
M M
ANAG
EMEN
T RE
PORT
| G
LOBA
L FA
SHIO
N GR
OUP
Sele
cted
exp
lana
tory
not
es to
the
inte
rim c
onde
nsed
con
solid
ated
fina
ncia
l sta
tem
ents
20. EVENTS AFTER REPORTING PERIOD
Since July 2, 2019 the shares of the Company have been traded on the regulated market (Prime Standard) of the Frankfurt Stock Exchange. The Company received net proceeds of EUR 186.1m after deducting qualifying fees retained by the underwriters, from its Initial Public Offer-ing. The offering consisted of 40,000,000 newly issued shares with a further 4,000,000 shares available as part of the greenshoe option. 2,000,000 shares were issued on August 5, 2019, resulting in net greenshoe proceeds of EUR 9.0m.
The Company intends to use the proceeds to fuel contin-ued growth, by investing in technology platforms, cus-tomer acquisition, and fulfilment and delivery infrastruc-ture, including automation, as well as other general corporate purposes.
The Company entered into an amended revolving credit facility (‘the amended facility’) on July 9, 2019. The total facility amount remains unchanged at EUR 70.0m, with the allocation between Facility A and Facility B remaining unchanged at EUR 50.0m and EUR 20.0m respectively with Facility A permitted to increase by up to EUR 30.0m. There will be no obligation to hold restricted cash as part of the amended facility. EUR 50.0m that was classified as restricted under the previous Facility A was released to the Company on July 11, 2019, with the remaining EUR 20.0m in Facility B expected to be released in September 2019.
On July 2, 2019, the occurrence of the IPO had implications to the 2018 ESOP programme. The awards have been converted to a notional Group award with various strike prices and this modification will be first accounted for in Q3 2019.
49
H1 IN
TERI
M M
ANAG
EMEN
T RE
PORT
| G
LOBA
L FA
SHIO
N GR
OUP
Sele
cted
exp
lana
tory
not
es to
the
inte
rim c
onde
nsed
con
solid
ated
fina
ncia
l sta
tem
ents
RESPONSIBILITY STATEMENT BY THE MANAGEMENT BOARD
To the best of our knowledge, and in accordance with the applicable reporting principles for half-yearly financial reporting, the interim condensed consolidated financial statements give a true and fair view of the assets, liabilities, financial position and profit or loss of the Group, and the interim management report of the Group includes a fair review of the development and performance of the busi-ness and the position of the Group, together with a description of the material opportunities and risks associ-ated with the expected development of the Group for the remaining months of the financial year.
Christoph Barchewitz, Co-CEO
Patrick Schmidt, Co-CEO
Matthew Price, CFO
50
H1 IN
TERI
M M
ANAG
EMEN
T RE
PORT
| G
LOBA
L FA
SHIO
N GR
OUP
Sele
cted
exp
lana
tory
not
es to
the
inte
rim c
onde
nsed
con
solid
ated
fina
ncia
l sta
tem
ents
REVIEW OPINION
Report on review of interim condensed consolidated financial statements
To the Shareholders of Global Fashion Group S.A.5, HeienhaffL-1736 SenningerbergIntroduction
We have reviewed the accompanying interim condensed consolidated financial statements of
Global Fashion Group S.A. as of 30 June 2019, which comprise the interim condensed consolidated statement of financial position as at 30 June 2019 and the related interim condensed consolidated statement of compre-hensive income, the interim condensed consolidated statement of changes in equity, the interim condensed consolidated statement of cash flows for the six-month then ended and explanatory notes. The Supervisory Board is responsible for the preparation and fair presentation of these interim condensed consolidated financial state-ments in accordance with International Financial Report-ing Standard IAS 34 Interim Financial Reporting as adopted by the European Union (“IAS 34”). Our responsi-bility is to express a conclusion on these interim con-densed consolidated financial statements based on our review.
Scope of ReviewWe conducted our review in accordance with International Standard on Review Engagements 2410, “Review of Interim Financial Information Performed by the Indepen-dent Auditor of the Entity.” A review of interim financial information consists of making inquiries, primarily of per-sons responsible for financial and accounting matters, and applying analytical and other review procedures. A review is substantially less in scope than an audit conducted in accordance with International Standards on Auditing and consequently does not enable us to obtain assurance that we would become aware of all significant matters that might be identified in an audit. Accordingly, we do not express an audit opinion.
ConclusionBased on our review, nothing has come to our attention that causes us to believe that the accompanying interim condensed consolidated financial statements are not prepared, in all material respects, in accordance with IAS 34.
Ernst & YoungSociété AnonymeCabinet de révision agréé
Michel FeiderLuxembourg, August 20, 2019
51
H1 IN
TERI
M M
ANAG
EMEN
T RE
PORT
| G
LOBA
L FA
SHIO
N GR
OUP
Sele
cted
exp
lana
tory
not
es to
the
inte
rim c
onde
nsed
con
solid
ated
fina
ncia
l sta
tem
ents
SUPPLEMENTARY INFORMATION
52
H1 IN
TERI
M M
ANAG
EMEN
T RE
PORT
| G
LOBA
L FA
SHIO
N GR
OUP
Supp
lem
enta
ry in
form
atio
n
KPI AND FINANCIAL DEFINITIONS
Active customersActive customers is defined as the number of customers who have purchased at least one item after cancellations, rejections and returns in the last twelve months.
Adjusted EBITDAAdjusted EBITDA is calculated as loss before interest and tax adjusted for depreciation of property, plant and equip-ment and right-of-use assets, amortisation of intangible assets and impairment losses, and adjusted for share-based payment (income) / expenses as well as one-off fees related to the IPO, one-off tax adjustments and expenses relating to the wind-down of Lost Ink Limited.
Average order valueAverage order value is defined as the NMV per order.
CapexCapital expenditure shows the additions to property, plant and equipment, including those due from business com-binations, and additions to intangible assets.
EBITDAEBITDA is calculated as loss before interest and tax adjusted for depreciation of property, plant and equip-ment and right-of-use assets, amortisation of intangible assets and impairment losses.
Net Merchandise ValueNet Merchandise Value (“NMV”) is defined as the value of goods sold including value-added tax (“VAT”) / goods and services tax (“GST”) and delivery fees, after actual or pro-visioned rejections and returns.
Net working capitalNet working capital is calculated as inventories plus current trade and other receivables less current trade payables and other financial liabilities.
OrdersOrders are defined as the number of orders placed by customers after cancellations, rejections and returns.
Order frequencyOrder frequency is defined as the average number of orders per customer per year (calculated as the last twelve month’s orders divided by active customers).
Pro-forma cashPro-forma cash is defined as cash and cash equivalents at the end of the period plus restricted cash, cash on deposit and net IPO proceeds.
53
H1 IN
TERI
M M
ANAG
EMEN
T RE
PORT
| G
LOBA
L FA
SHIO
N GR
OUP
Supp
lem
enta
ry in
form
atio
n
FINANCIAL CALENDAR
August 21, 2019 Q2 and H1 2019 Results
September 19, 2019 Kinnevik Capital Markets Day
September 24, 2019 Berenberg and Goldman Sachs Eighth German Corporate Conference
November 13, 2019 Q3 2019 Results
November 13, 2019 Morgan Stanley European Technology, Media & Telecom Conference
INFORMATION RESOURCES
Further information including corporate news, reports and publications can be found in the Investor Relations section of our website at https://ir.global-fashion-group.com
Investor Relations Matthew Price, Chief Financial OfficerJovana Lakcevic, Head of PR & Communicationsemail: [email protected]
54
H1 IN
TERI
M M
ANAG
EMEN
T RE
PORT
| G
LOBA
L FA
SHIO
N GR
OUP
Supp
lem
enta
ry in
form
atio
n

55
H1 IN
TERI
M M
ANAG
EMEN
T RE
PORT
| G
LOBA
L FA
SHIO
N GR
OUP
Supp
lem
enta
ry in
form
atio
n

global-fashion-group.com