Embed Size (px)
Citation preview
Association for Biology Laboratory Education (ABLE) 2006 Proceedings, Vol. 28:52-69
Interactions between Photosynthesis and Respiration
in an Aquatic Ecosystem
Jane E. Caldwell and Kristi Teagarden
53 Campus Drive, P.O. Box 6057 Dept. of Biology
West Virginia University Morgantown, WV 26506
(304)293-5201 extension 31459
[email protected] (304)293-5201 extension 31542
Abstract: Students measure the results of respiration and photosynthesis separately, combined, and in comparison to a non-living control “ecosystem”. The living ecosystem uses only snails and water plants. Oxygen, carbon dioxide, and ammonia nitrogen concentrations are measured with simple colorimetric and titration water tests using commercially available kits. The exercise is designed for large enrollment non-majors labs, but modifications for large and small classrooms are described.
Introduction
This lab exercise was developed for a freshman course for non-science majors at West Virginia University. The exercise asks students to apply their knowledge of basic metabolic processes to a series of simple aquatic ecosystems, which students monitor through water testing. These ecosystems consist of aquaria containing plants and/or snails with or without light exposure, and are compared against a non-living control system (an aquarium with water, light, and gravel). As they analyze their results, students observe the interplay of respiration, photosynthesis, protein digestion (or waste excretion), and decomposition through their effects on dissolved oxygen, carbon dioxide, and ammonia. Students synthesize these observations into written explanations of their results.
During the course of the lab, students: • predict the relative levels of oxygen, carbon dioxide, and ammonia for various aquaria compared
to a control aquarium. • observe and conduct titrimetric and colorimetric tests for dissolved compounds in water.
Metabolism in aquatic ecosystems 53
• explain which metabolic processes could explain the differences between aquaria, thereby linking the equations of metabolic processes to the organisms present.
The concepts we emphasize are: • Respiration occurs in plants as well as animals. • Photosynthesis and respiration are complementary processes, as are other metabolic processes of
animals and plants. • Unseen organisms (bacteria) can have noticeable effects on ecosystems (e.g. decomposition). • Both decomposition and respiration have fairly similar effects on dissolved gases. • Plants produce wastes, but through dead tissues rather than excretion. • The effects of living organisms on an ecosystem are complex, but reasonably predictable.
Although the exercise is written at an introductory level for non-science majors, it can readily be adapted to more advanced students by inclusion of more rigorous details about metabolic processes and water chemistry (as described in the Appendix on Water Chemistry). It is written as a fairly straightforward stepwise exercise, but may be readily adapted to an inquiry-based exercise (described further in Notes for the Instructor).
In the student outline, instructions are detailed and customized for a specific brand of water testing kit, but the lab is certainly adaptable to other equipment (as discussed in the Materials Appendix). We have found that specific instructions with pictures make the steps of water-testing easy enough for introductory students so that the cognitive load of the testing process does not interfere with thinking about photosynthesis and respiration later. Other kits will be discussed in the instructor notes, and the chemistry of the water tests is included in an appendix.
Student Outline: Metabolism in an Aquatic Ecosystem
Background
In previous lab exercises, you’ve seen the effects of respiration and photosynthesis separately. In this week’s lab, you’ll see the two of them combined. Both photosynthesis and respiration are metabolic pathways: each is a set of chemical reactions carried out by several enzymes, one after another. These two pathways interact with each other, both within a single organism (for example, a plant) or within an ecosystem (containing both plants and animals).
Write the equation for photosynthesis here:
__________ + __________ + energy from sun __________ + __________
Photosynthesis builds sugars out of CO2. The plant stores some of those sugars, and uses the rest to grow and build new tissues. Later, when the plant needs energy, it can break down stored sugars using cell respiration. So can any animals that eat the plant. Both animals and plants use cellular respiration to break down sugars (as well as fats and proteins). The ultimate products of respiration are carbon dioxide and energy.
Write the equation for cellular respiration here:
__________ + __________ __________ + __________ + energy stored as ATP
54 ABLE 2006 Proceedings Vol. 28 Caldwell and Teagarden
Animals depend on the energy (ATP) produced by cellular respiration for all their activities. In a previous lab you saw that when an animal’s metabolism changes, the amount of oxygen it consumes changes. Organisms under stress need more energy, so they consume more oxygen and produce more carbon dioxide.
Although we think of plants as being mainly photosynthetic creatures, it is important to remember that they do carry out cell respiration. It’s just that the effects of cell respiration are often overwhelmed by the results of photosynthesis. In this lab, we will set up conditions that let you observe cell respiration in plants without any competing effects from photosynthesis.
Look at the two products you wrote down in the equation for respiration. Sugars break down fairly cleanly into CO2 or H2O, but not all food molecules can be broken down so simply. Proteins contain not only carbon, oxygen, and hydrogen, but also nitrogen. When animals break down proteins, the nitrogen must be disposed of safely. Humans and most land-dwelling mammals get rid of their nitrogen-containing waste in urine (containing the chemical urea). Birds and reptiles excrete nitrogenous wastes in more concentrated, semi-solid form (uric acid), and fish release their excess nitrogen directly into water as ammonia (NH3 or NH4
+). Whatever its starting form, this nitrogen-containing waste eventually breaks down into ammonia. High levels of ammonia can be toxic.
Living plants generally don’t release nitrogen-containing wastes, because they don’t eat proteins (remember, they break down sugars). Dead plants (as well as animals), however, are broken down by bacteria—which convert their proteins, fats, and sugars into simpler substances. In general, decomposition releases ammonia, water, and carbon dioxide.
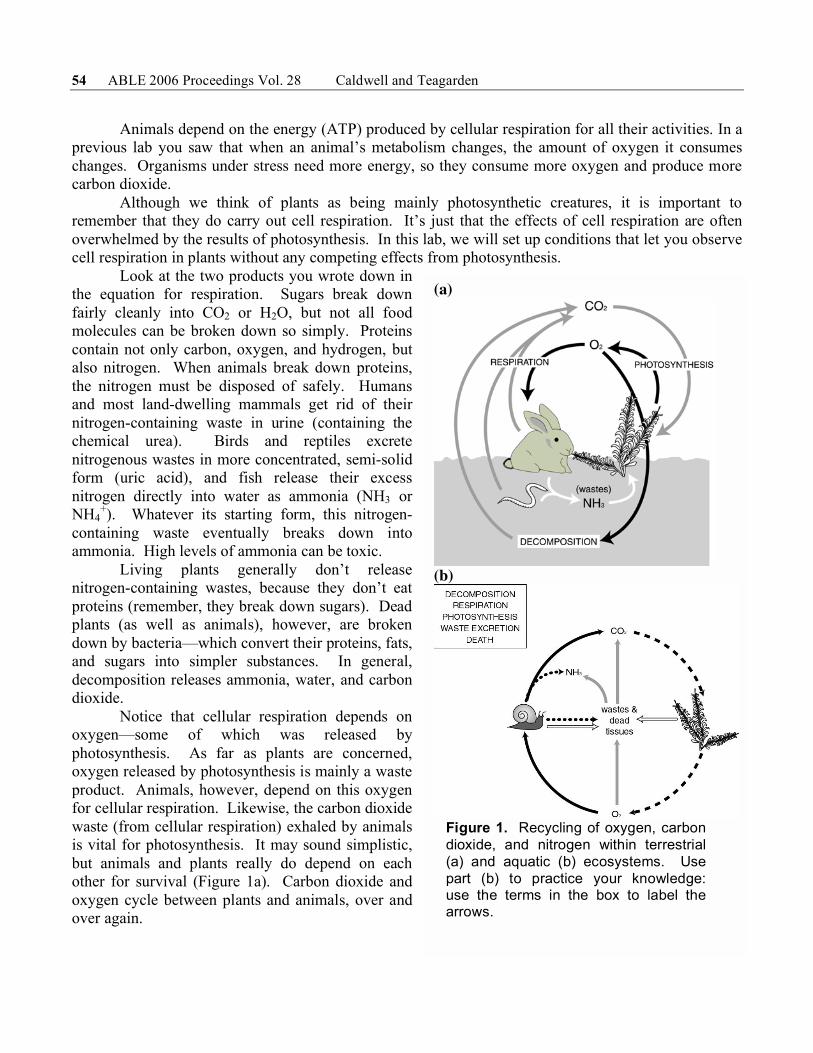
Notice that cellular respiration depends on oxygen—some of which was released by photosynthesis. As far as plants are concerned, oxygen released by photosynthesis is mainly a waste product. Animals, however, depend on this oxygen for cellular respiration. Likewise, the carbon dioxide waste (from cellular respiration) exhaled by animals is vital for photosynthesis. It may sound simplistic, but animals and plants really do depend on each other for survival (Figure 1a). Carbon dioxide and oxygen cycle between plants and animals, over and over again.
(a)
(b)
Figure 1. Recycling of oxygen, carbon
dioxide, and nitrogen within terrestrial
(a) and aquatic (b) ecosystems. Use
part (b) to practice your knowledge: use the terms in the box to label the arrows.

Metabolism in aquatic ecosystems 55
The cycle shown in Figure 1a occurs in water as well as air. If given enough light, water plants will release oxygen into the water, most of which remains dissolved in water rather than bubbling to the surface. Water plants will absorb carbon dioxide for photosynthesis, and some plants will also absorb ammonia (as a source of nitrogen for growth).
Aquatic animals like fish and snails absorb oxygen and release carbon dioxide directly into water through specialized structures like gills. They usually release nitrogenous wastes directly into the water as ammonia. Some ammonia and carbon dioxide are also released by the decay of plants, animals, and feces. Take a minute to label the arrows in Figure 1b with the proper metabolic processes (as listed in the box).
If you’ve ever kept a small fish tank, you probably remember changing the water frequently to get rid of ammonia and other wastes. You might also have used an air stone and an air pump to bubble air through the water—this replenishes oxygen and removes carbon dioxide faster.
About the Organisms You’ll Study Today
The aquatic snails in the aquariums are commonly called “apple snails” (Figure 2). Their scientific name is Pomacea paludosa. Unlike most snails, they actually have separate male and female genders, and both males and females must be present to produce eggs. (Most other snails are hermaphroditic: one individual produces both eggs and sperm… and can reproduce even without a partner.)
Apple snails have gills (like fish) that allow them to absorb O2 from and release CO2 directly into water. Unlike fish, however, they also can breathe through a siphon that connects to a simple lung (like air-breathing animals). Snails do this when the oxygen level of the water is very low, and under these conditions you will see the snails clustering near the surface of the water. (During lab, observe whether this behavior is occurring!) They move by sliding along (using ciliated cells) on a thin film of mucus. They are able to leave water for short periods of time to collect food if needed, and during this time, the lung is left open. Because apple snails have a lung, they do not have to bear all of their weight while moving underwater. You may observe some snails floating on the surface of the water. Do not be alarmed—they are most likely not dead, but rather are floating due to excess air in their lungs. Letting air exit the lung will allow the snail to descend to the bottom of the water.
Like all other animals, snails rely on cellular respiration to produce energy from food. Their digestive system is a fairly simple tube, and contains a lot of bacteria that also produce CO2 and ammonia (while breaking down food the snail has eaten). The snails’ food of choice is plant material, so we feed them sinking fish food pellets or spinach to keep them from eating the plants in the aquariums. (Why won’t the addition of this food affect respiration and photosynthesis in the aquarium? What if we added more food than the snails could eat?)
Most of the plants you see in the aquarium are Elodea, available in many pet stores under the name Anacharis. (You’ve used these in a previous lab.) The leaves of the plants are only two to three cells thick, so O2 and CO2 don’t have far to diffuse between the water and the plant cells. In a previous lab exercise, you watched oxygen bubbles escape from the cut stem of Elodea. Ordinarily, those
Figure 2. An apple snail, Pomacea paludosa.
56 ABLE 2006 Proceedings Vol. 28 Caldwell and Teagarden
bubbles remain trapped inside the stem and are released slowly into the water as dissolved gas. While inside the stem, the gas bubbles help the plants float or stay upright.
As you carry out the lab, take a minute to observe the plants and animals carefully. If you’re lucky, the snails may be laying eggs. Some of the plants will be growing or decaying. See if you can relate these observations to your results. Also keep thinking about the exchange of oxygen and carbon dioxide between plants and animals.
Procedures
Safety Alert!
Wear gloves and safety goggles for all steps of water testing. If any chemicals land on your skin, ask your instructor for assistance.
Preparation
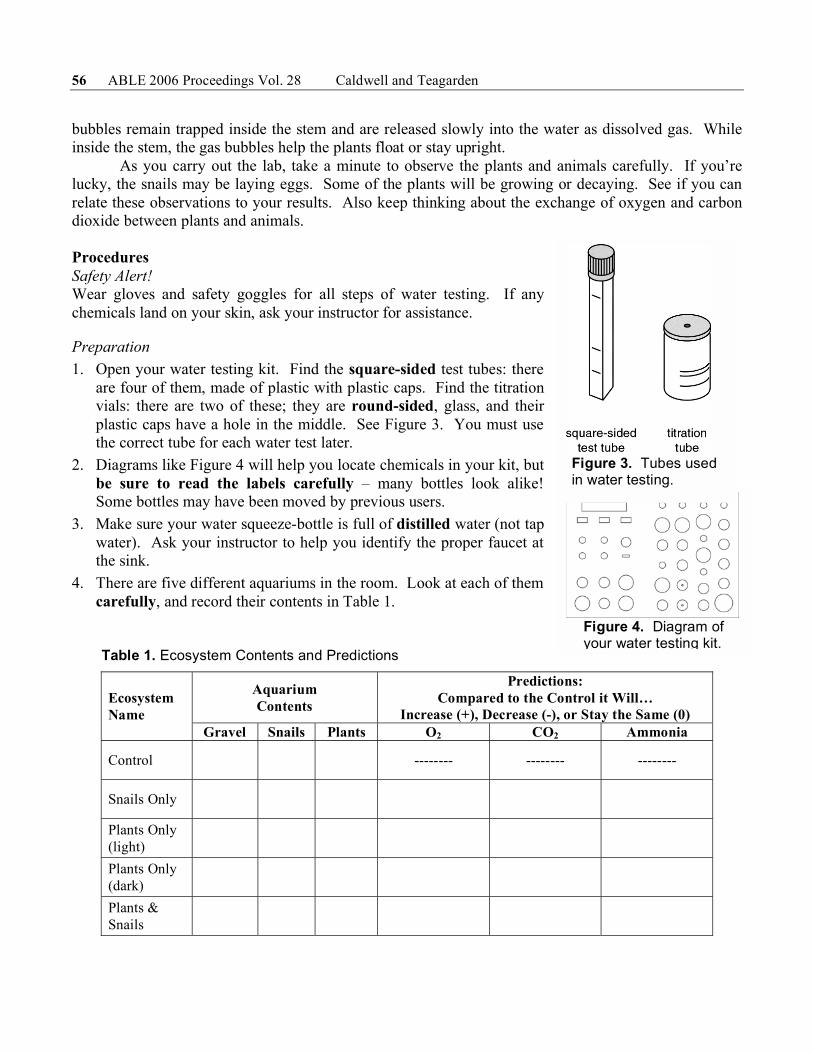
1. Open your water testing kit. Find the square-sided test tubes: there are four of them, made of plastic with plastic caps. Find the titration vials: there are two of these; they are round-sided, glass, and their plastic caps have a hole in the middle. See Figure 3. You must use the correct tube for each water test later.
2. Diagrams like Figure 4 will help you locate chemicals in your kit, but be sure to read the labels carefully – many bottles look alike! Some bottles may have been moved by previous users.
3. Make sure your water squeeze-bottle is full of distilled water (not tap water). Ask your instructor to help you identify the proper faucet at the sink.
4. There are five different aquariums in the room. Look at each of them carefully, and record their contents in Table 1. Table 1. Ecosystem Contents and Predictions
Aquarium
Contents
Predictions:
Compared to the Control it Will…
Increase (+), Decrease (-), or Stay the Same (0) Ecosystem
Name Gravel Snails Plants O2 CO2 Ammonia
Control
-------- -------- --------
Snails Only
Plants Only
(light)
Plants Only
(dark)
Plants &
Snails
Figure 4. Diagram of your water testing kit.
Figure 3. Tubes used in water testing.
Metabolism in aquatic ecosystems 57
5. Predict how the levels of O2, CO2, and ammonia in each ecosystem will compare to the control aquarium. Record those predictions in the table above. If you notice anything unusual about any of the aquariums (dead snails, dead plants, plants chopped up by snails, etc.) note it here:
6. Your instructor will assign one or more water sample(s) to your group. Record your sample(s) here: Sample(s) = __________________.
7. Rinse out the 400 mL beaker with distilled water. (A dirty beaker may contaminate the aquarium.) Collect 250 mL water sample(s) from your assigned aquarium(s), keeping each sample separate. Collect your sample by gently immersing the beaker, being careful not to disturb the aquarium contents or expose the water to excess air by pouring. (This will disturb the dissolved gas concentrations.
8. Be especially careful not to bubble air through your sample—gases from the air may dissolve and give you inaccurate measurements later.
Ammonia Nitrogen (NH3) Test
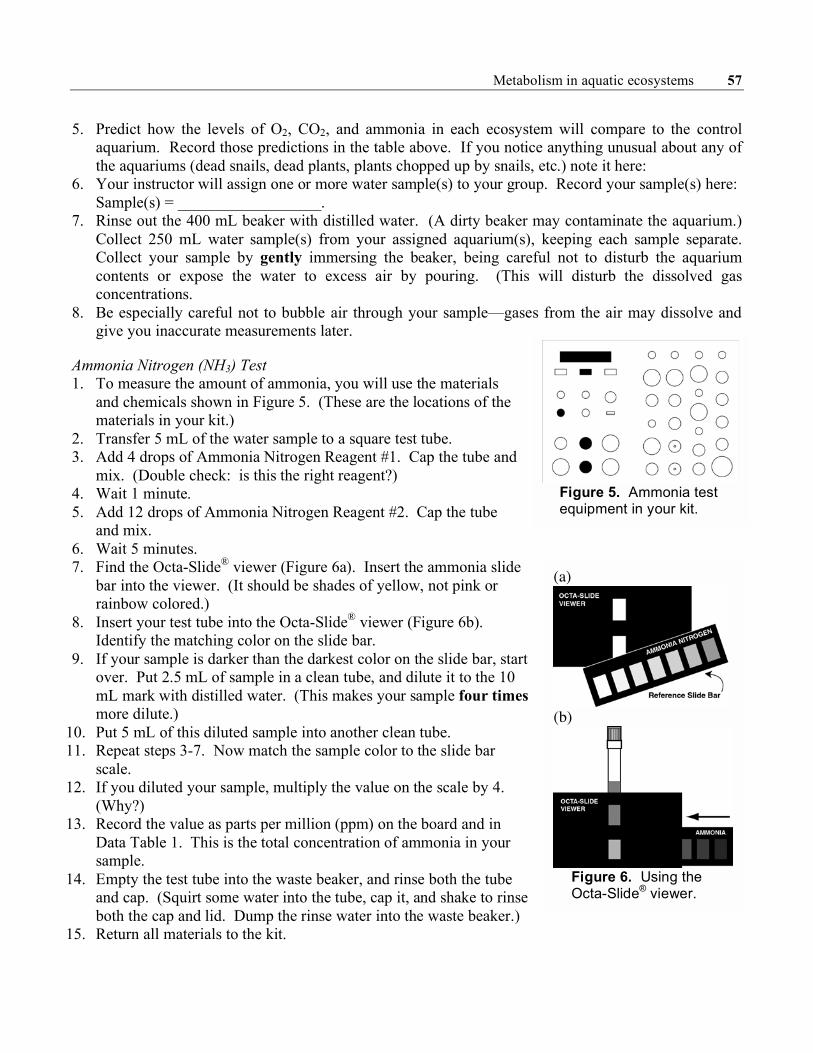
1. To measure the amount of ammonia, you will use the materials and chemicals shown in Figure 5. (These are the locations of the materials in your kit.)
2. Transfer 5 mL of the water sample to a square test tube. 3. Add 4 drops of Ammonia Nitrogen Reagent #1. Cap the tube and
mix. (Double check: is this the right reagent?) 4. Wait 1 minute. 5. Add 12 drops of Ammonia Nitrogen Reagent #2. Cap the tube
and mix. 6. Wait 5 minutes. 7. Find the Octa-Slide® viewer (Figure 6a). Insert the ammonia slide
bar into the viewer. (It should be shades of yellow, not pink or rainbow colored.)
8. Insert your test tube into the Octa-Slide® viewer (Figure 6b). Identify the matching color on the slide bar.
9. If your sample is darker than the darkest color on the slide bar, start over. Put 2.5 mL of sample in a clean tube, and dilute it to the 10 mL mark with distilled water. (This makes your sample four times more dilute.)
10. Put 5 mL of this diluted sample into another clean tube. 11. Repeat steps 3-7. Now match the sample color to the slide bar
scale. 12. If you diluted your sample, multiply the value on the scale by 4.
(Why?) 13. Record the value as parts per million (ppm) on the board and in
Data Table 1. This is the total concentration of ammonia in your sample.
14. Empty the test tube into the waste beaker, and rinse both the tube and cap. (Squirt some water into the tube, cap it, and shake to rinse both the cap and lid. Dump the rinse water into the waste beaker.)
15. Return all materials to the kit.
Figure 5. Ammonia test equipment in your kit.
(a)
(b)
Figure 6. Using the Octa-Slide® viewer.

58 ABLE 2006 Proceedings Vol. 28 Caldwell and Teagarden
Dissolved Carbon Dioxide (CO2) Test
1. As you test for CO2, use the equipment in Figure 7. 2. Find the glass titration tube in your kit. It has a round plastic lid
with a hole in the center. Remove the lid. Rinse the tube and lid with distilled water.
3. Add 20 mL of your water sample to the titration tube. Leave the lid off.
4. Add 2 drops of phenolphthalein indicator to the titration tube. Put the lid on the sample, and swirl to mix.
5. If the sample turns permanently pink or red, there is no CO2 in your sample. Record the result as <1 ppm CO2 on the board and
in Data Table 1. 6. If the sample remains clear, find titrator syringe
#0380. (It should be marked from 0 to 50 ppm.) Fill the syringe to the top mark with Carbon Dioxide Reagent B (Figure 9). The top edge of the plunger will be at 0 ppm.
7. Insert the syringe into the hole in the lid of the titration tube.
8. Gently swirl the tube while you slowly add drops of reagent (Figure 9). Mix the sample thoroughly after each drop. Add one drop at a time, and stop when the sample first becomes faint pink.
9. If the pink color lasts for 30 seconds, you are done.
10. Look at the amount of liquid remaining in the syringe. Read the value at the top edge of the plunger (Figure 10). Record this number as ppm CO2 on the board and in Table 2.
11. Discard the sample and any liquid remaining in the syringe in your waste beaker. Rinse out the titration tube. Use some clean water in a small beaker to rinse out the syringe. Return all materials to the kit.
Dissolved Oxygen (O2) Test
1. As you test for O2, use the equipment shown in Figure 11. 2. Find the glass water sampling bottle in your kit. (Do not use the
squeezable plastic bottle.) 3. Rinse the bottle and cap with distilled water. 4. Fill the bottle completely with sample water, up to the top rim.
This prevents the introduction of additional dissolved oxygen later. When handling your water sample, be especially careful not to bubble air through it.
5. Gently tap the sides with your finger to shake loose any air bubbles. Put the cap on the bottle.
Figure 7. Location of CO2 test equipment.
Figure 8. Filling
the titrator syringe.
Figure 9. Titrating your sample.
Figure 10. Reading the titrator.
Figure 11. Locations of O2 test equipment
Metabolism in aquatic ecosystems 59
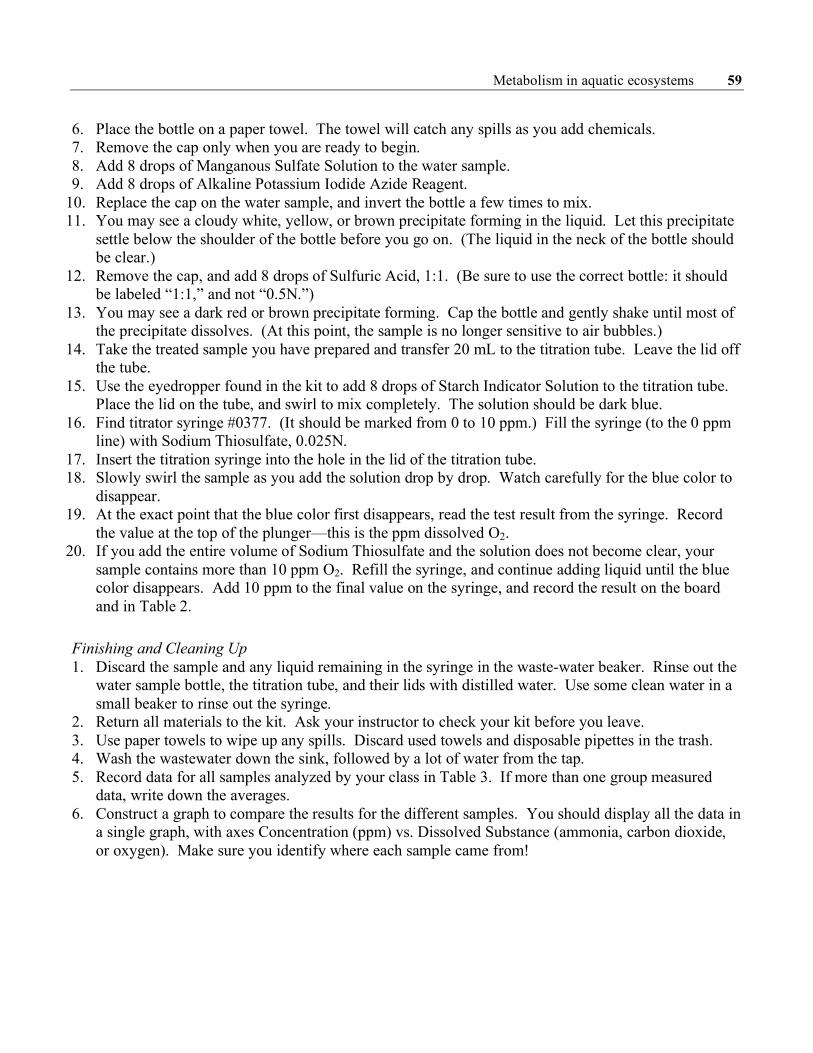
6. Place the bottle on a paper towel. The towel will catch any spills as you add chemicals. 7. Remove the cap only when you are ready to begin. 8. Add 8 drops of Manganous Sulfate Solution to the water sample. 9. Add 8 drops of Alkaline Potassium Iodide Azide Reagent.
10. Replace the cap on the water sample, and invert the bottle a few times to mix. 11. You may see a cloudy white, yellow, or brown precipitate forming in the liquid. Let this precipitate
settle below the shoulder of the bottle before you go on. (The liquid in the neck of the bottle should be clear.)
12. Remove the cap, and add 8 drops of Sulfuric Acid, 1:1. (Be sure to use the correct bottle: it should be labeled “1:1,” and not “0.5N.”)
13. You may see a dark red or brown precipitate forming. Cap the bottle and gently shake until most of the precipitate dissolves. (At this point, the sample is no longer sensitive to air bubbles.)
14. Take the treated sample you have prepared and transfer 20 mL to the titration tube. Leave the lid off the tube.
15. Use the eyedropper found in the kit to add 8 drops of Starch Indicator Solution to the titration tube. Place the lid on the tube, and swirl to mix completely. The solution should be dark blue.
16. Find titrator syringe #0377. (It should be marked from 0 to 10 ppm.) Fill the syringe (to the 0 ppm line) with Sodium Thiosulfate, 0.025N.
17. Insert the titration syringe into the hole in the lid of the titration tube. 18. Slowly swirl the sample as you add the solution drop by drop. Watch carefully for the blue color to
disappear. 19. At the exact point that the blue color first disappears, read the test result from the syringe. Record
the value at the top of the plunger—this is the ppm dissolved O2. 20. If you add the entire volume of Sodium Thiosulfate and the solution does not become clear, your
sample contains more than 10 ppm O2. Refill the syringe, and continue adding liquid until the blue color disappears. Add 10 ppm to the final value on the syringe, and record the result on the board and in Table 2.
Finishing and Cleaning Up
1. Discard the sample and any liquid remaining in the syringe in the waste-water beaker. Rinse out the water sample bottle, the titration tube, and their lids with distilled water. Use some clean water in a small beaker to rinse out the syringe.
2. Return all materials to the kit. Ask your instructor to check your kit before you leave. 3. Use paper towels to wipe up any spills. Discard used towels and disposable pipettes in the trash. 4. Wash the wastewater down the sink, followed by a lot of water from the tap. 5. Record data for all samples analyzed by your class in Table 3. If more than one group measured
data, write down the averages. 6. Construct a graph to compare the results for the different samples. You should display all the data in
a single graph, with axes Concentration (ppm) vs. Dissolved Substance (ammonia, carbon dioxide, or oxygen). Make sure you identify where each sample came from!

60 ABLE 2006 Proceedings Vol. 28 Caldwell and Teagarden
Table 2: Your group’s data only.
Concentrations (ppm)
Sample Ammonia CO2 O2
Table 3: Combined class data.
Average Values (ppm)
Sample Ammonia CO2 O2
Control
Snails Only
Plants Only (light)
Plants Only (dark)
Plants & Snails
Instructor Evaluation (return of equipment, treatment of animals, cooperation, etc.): ________
Questions
1. Compare the oxygen levels of all the aquaria, and explain what you see in terms of metabolism. Be sure to explain any differences. (If some values were not what you expected, explain what you would have expected and why.)
2. Compare the carbon dioxide levels of the aquaria, as you did above. 3. Compare the ammonia levels of the aquaria, as you did above. 4. Plants don’t digest proteins as food, yet aquaria containing plants usually contain slightly more
ammonia than our control aquarium. What could explain this observation? 5. What should happen to the oxygen, carbon dioxide, and ammonia levels in the “plants and snails”
aquarium if we doubled the number of snails? Explain.
Metabolism in aquatic ecosystems 61
Notes for the Instructor
Introducing the lab to the students
At the beginning of the lab, students help the instructor develop the following equations for metabolism:
Respiration: carbon compounds + O2 CO2 + H2O
Protein digestion: protein CO2 + H2O + NH3 + carbon compounds
Photosynthesis: CO2 + H2O carbon compounds + O2
Decomposition: carbon compounds CO2 + H2O + NH3
Students apply this information as they complete Figure 1b, which is then drawn on the
chalkboard. Students’ predictions in Table 1 are then reviewed as hypotheses before the class begins the experiment.
At this point, a few safety warnings about gloves and goggles are in order. Students should be encouraged to examine the labels on the reagents while they work, as some are hazardous and should be handled carefully. We find it helpful for the instructor to use an extra water sample to demonstrate at least one titrimetric test and one colorimetric test so that students understand how to measure results with these two methods. For time considerations, we usually have a previously treated ammonia ready for the colorimetric test (to avoid several 1 minute waiting periods during demonstration), and use a carbon dioxide test to demonstrate titration quickly.
Materials & Equipment
• La-Motte water testing kit (model AQ-2) (1 per group)
• plastic disposable pipettes (a handful per group)
• squeeze-bottle of distilled water (1 per group)
• 400 mL beaker (1 per group) • paper towels • aquaria containing water, gravel, snails and/or
plants (5 per room)
Water Testing
We used La-Motte test kit AQ-2, which is a complete water-testing kit for many other dissolved substances and characteristics, including chloride, nitrate, pH, and alkalinity. We use these kits primarily because we already have many of them on hand, but they are somewhat expensive. A more affordable alternative would be individual testing kits (Ben Meadows Company, 2002), or individual snap-test kits (glass ampoules with pre-measured reagents) from Chemetrics, Inc. (see Appendix A). This lab procedure could be very easily adapted to any water testing supplies, as long as students are given clear instructions.
Some of the reagents used require careful disposal (described below). These kits use the azide modification of the Winkler test for dissolved oxygen and a phenolphthalein-based titration for
62 ABLE 2006 Proceedings Vol. 28 Caldwell and Teagarden
dissolved carbon dioxide (American Public Health Association, et al., 1999). For ammonia nitrogen testing, the salicylate method (USGS National Water Quality Laboratory, 1993) is preferable to the Nesslerization method (American Public Health Association, et al., 1999) that comes standard in the AQ-2, as the salicylate method reagents are less toxic and do not contain trace amounts of mercury (Ben Meadows Company, 2002; American Public Health Association, et al., 1999). All individual kits listed are EPA approved methods for water testing.
Aquaria Set Up and Maintenance
We use 5-gallon plastic aquaria from Hawkeye International equipped with fluorescent light hood, power filter system, and a hinged hood lid system. The standard fluorescent bulbs were replaced with Aqua Glo plant-growth bulbs.
This size aquarium lets us accommodate a large number of lab sections without depleting the aquaria by the end of the week. In practice, we have accommodated 10-12 lab sections meeting in a single room each week with 6 student groups per section. We usually “top off” aquaria with aged water each night, without causing significant variation in the next day’s results. For higher enrollment courses a larger aquarium could be used; for single class sections each student group can use a 600-mL beaker as a mini-aquarium with one snail and/or one to two sprigs of Elodea left overnight. Care and selection of the organisms is described in later sections.
We set up five aquaria: 1. control with aged water and gravel only, equipped with fluorescent grow lamps controlled by a
timer so that lights turn on four hours before the first lab and remain on for 12 hours (if lab schedule permits)
2. “plants only” aquarium identical to control, but with water plants added 3. “plants only” aquarium as above, but with lighting cycle reversed (lamps are on at night and off
during the day) 4. “snails only” aquarium identical to control, but with snails added 5. “plants and snails” aquarium During the week of the lab, no filters or aeration are used, so that CO2 and O2 levels result only from
respiration and photosynthesis. We typically shut off pumps and filters the Friday before lab starts; one weekend of stagnant water seems to be sufficient. Once the lab is over, we resume aeration and filtering to keep snails and plants healthy and to minimize algal growth.
Selection and Care of Organisms
Aquatic snails
We use “apple snails”, Pomacea paludosa, which are frequently sold in aquarium and pet stores—but any medium size (5-10 cm) aquatic snail will do. Tiny (1 cm or less) snails would also work, but are much harder to separate from the aquarium gravel. In a five-gallon aquarium, we use approximately four mature apple snails to get significant differences between aquaria while keeping carbon dioxide and ammonia below toxic levels. You’ll know if the CO2 levels are getting too high if the snails cluster at the surface of the water with siphons extended for air-breathing. An intermediate number of five to six snails can be used, but their wastes cloud the water—which interferes with colorimetric water-testing methods.
For healthy snails, keep the pH around 7.5-8 to avoid de-calcification and thinning of their shells. They prefer a temperature of around 72 ºF; at lower temperatures snails become dormant (and have little
Metabolism in aquatic ecosystems 63
effect on dissolved gases). With plastic aquaria, we surround tanks with 100W lamps to pre-heat the water.
We maintain a “colony” of snails between semesters in one or two 10 gallon heated tanks. Since these snails excrete abundant bacteria, this tank is constantly filtered and aerated. We feed these snails fresh spinach 1-2 times per week, attached to the aquarium wall with a suction cup. During the week of the lab we feed them daily, to keep all snails (even those in the “snails alone” tank) metabolically active and to prevent grazing snails from destroying plants. When snails in the “plants and snails” tank are particularly contented, you may see clusters of transparent eggs—allowing a great opportunity for students to observe reproduction.
Water plants
Elodea is an excellent plant choice because snails prefer not to eat it, but only if it can be obtained without contaminants. There is some difficulty, however, in obtaining snail-free and algae-free Elodea from commercial suppliers. We wash our plants carefully to remove all snail eggs; otherwise contamination by juvenile snails results in excessive respiration in the “plants only” aquarium, and unclear results. Bathing the plants in salt water or hot water kills the snails, but is not recommended since these treatments often kill Elodea and the resulting decomposition obscures the results of photosynthesis. Any contaminating algae become a problem because its decomposition obscures the results of photosynthesis.
We have successfully used jungle vallisneria and corkscrew vallisneria, as well as the “oxygenating plant set” from Ward’s Natural Science (see Appendix A). Each of these items is shipped in batches large enough to supply two to three aquaria. Although snails seem to find most of these plants palatable, their grading can be kept in check somewhat by generous nightly feedings with fresh raw spinach.
In each aquarium containing two inches of clean aquarium gravel and aged (or dechlorinated) water, water plants are “rooted” using rubber bands or weights to hold them in place. This seems to extend the lifespan of Elodea in particular, and often encourages root growth. Unless the plants are over-grazed by snails, they can survive for at least three to four weeks.
Variations on the lab
For smaller courses or flexible lab schedules, “individual” aquaria can be set up by each student group using 600-mL beakers instead of large aquaria. Each beaker needs only a handful of gravel and (where appropriate) a single snail and one to two sprigs of Elodea. These only need to be set up for about 24 hours to obtain reasonable results. For best results, a light source (e.g. plant grow light) should be available in the room. For a single lab section, 1-gallon plastic shoeboxes function well as aquaria.
For an investigative lab, students could develop and test their own hypotheses about respiration and photosynthesis or interactions between species, and then set up the appropriate “mini-aquaria” in beakers. The possible variables are almost limitless: presence and absence of light, addition of aerators or filters, number of organisms, pH of water, etc.
Potential problems and other concerns
Snails must be fed during the week of the lab, or their metabolisms slow down and levels of CO2 and ammonia are unusually low. In our experience any photosynthesis by fresh spinach leaves has only a negligible effect on dissolved gas levels and is far outweighed by keeping the snails active. The water in the “snails only” tank will usually get quite murky by the end of the week, but over one week this does not seem to harm snails and actually can illustrate the importance of plants in an ecosystem.
64 ABLE 2006 Proceedings Vol. 28 Caldwell and Teagarden
Contamination of the “plants only” tank by algae, snails, or dead plant matter will give unexpectedly high levels of CO2 and ammonia and little O2. Plants perform best (and produce the most O2) when aquaria are outfitted with lid-mounted “grow lights” suited to plants.
We typically have “good results” with this lab that conform to our expectations of photosynthesis and respiration. One great thing about this lab is that careful observation can often explain any aberrant results—for example a few baby snails or dying plants in the “plants only” aquarium explain higher than expected CO2 levels. Explanation of these details often gives students a better understanding of ecology and the complexity of biological systems.
Waste Disposal
Local, federal, and state regulations should be obeyed for waste disposal—you may wish to consult your campus health and safety department for advice. Disposal recommendations from the manufacturer’s MSDS sheets are included in Appendix C.
Acknowledgements The authors gratefully acknowledge the financial support of the Department of Biology and
Eberly College of West Virginia University, which allowed us to develop this laboratory exercise and attend ABLE. We also thank the many talented General Biology 104 teaching assistants who have helped us refine the lab through their comments and constructive critiques. Our ABLE reviewers provided many helpful suggestions: thank you!
Literature Cited American Public Health Association, American Water Works Association, and Water Pollution Control
Federation. 1999. Standard methods for the examination of water and wastewater. Twentieth edition. American Public Health Association, New York.
Ben Meadows Company. 2002. Tech Info: Full Line of LaMotte Test Kits. Technical Document 1220, retrieved August 30, 2006, from http://www.benmeadows.com/refinfo/ezfacts/ezpdf/tech1220.pdf.
LaMotte. 2006. Freshwater aquaculture test kit instruction manual. Code 3633-03, retrieved August 30, 2006, from http://www.lamotte.com/pages/common/instruct/index.html.
USGS National Water Quality Laboratory. 1993. Nitrogen, ammonia, colorimetry, salicylate-hypochlorite, automated-segmented flow. NEMI Method I-6522-90, retrieved August 30, 2006, from http://web1.er.usgs.gov/nemi/method_pdf/8908.pdf.
Metabolism in aquatic ecosystems 65
About the Authors
Jane Caldwell received her B.S in integrated science and biology from Northwestern University, and her Ph.D. in biophysics from the University of Wisconsin at Madison in 1992, where she specialized in protein structure by NMR. Jane has been teaching for just six years, but during that time has taught at a private high school, a single-sex middle school, a community college, a small liberal-arts college, and a large research university. She has worked at West Virginia University since 2003 as a Senior Lecturer and Program Coordinator for the non-majors General Biology Program. She teaches introductory non-majors biology and an advanced course on protein structure and function. Her current professional interests include incorporating active learning into the large lecture classroom. Kristi Teagarden received her B.S. in Biology from Bethany College in 1999. She worked as a Clinical Microbiology Technician at WVU Hospitals from 1999 to 2002, and as a Laboratory Technologist I at Precision Therapeutics Inc. from 2002 to 2003, where she conducted primary cell culture and chemosensitivity testing on cell lines from oncology patients. She has been the Academic Lab Manager for the Non-Majors General Biology Program at West Virginia University since 2003. She received the Eberly College Outstanding Staff award in 2005. Her current professional interests include developing practical introductory microbiology labs for non-scientists, and maintaining a virtually perfect lab safety inspection record.
Copyright 2007, West Virginia University
66 ABLE 2006 Proceedings Vol. 28 Caldwell and Teagarden
Appendix A: Ordering Information
Aquaria:
Hawkeye International
URL: www.hawkeyeaquarium.com; website lists vendors • AquaBrite 5 Aquarium: 5-gallon capacity,
with florescent light hood, power filter system, E-Z TiltTM hinged hood system.
Fluorescent Grow Bulbs:
PetsMart URL: http://www.petsmart.com • AQUA-GLO Florescent Bulbs by Hagen
8-Watt, 12-Inch Order #: 605689, Price: $8.99 US
Aquatic Plants:
Ward’s Natural Science
5100 West Henrietta Road P.O. Box 92912 Rochester, NY 14692-9012 Phone: 800-962-2660 URL: www.wardsci.com • Ward’s Oxygenating Plant Set; Order #:
86W7907 (enough for 2-3 aquaria) • Jungle Vallisneria (Vallisneria gigantea);
Order #: 86W785 (enough for 2-3 aquaria) • Corkscrew Vallisneria (Vallisneria spiralis);
Order #: 86W7850 (enough for 2-3 aquaria)
Water Testing Kits and Reagents:
Aquatic Ecosystems
Ordering: 1-877-347-4788 Tech Support: 407-886-3939 URL: www.aquaticeco.com • Complete water testing kit:
La Motte Fish Farm 9 Test Kit (AQ-2) Order #: LMAQ2 Price: $204 US
• Dissolved Oxygen Test Kit Order #: LM5860 Price: $42.47 US Reagent Refill Order # LM5860RP Price: $29.44 US
• Carbon Dioxide Test Kit Order #: LM7297 Price: $28.94 US Reagent Refill Order #: LM297RP Price: $9.32 US
• Ammonia Test Kit (Nessler Method) Order #: LM4795 Price: $69.84 US Reagent Refill Order #: LM4795RP Price: $16.49 US
• Ammonia Test Kit (Salicylate Method) Order #: LM3304 Price: $58.67 US Reagent Refill Order #: LM3304RP $25.47 US
Chemetrics, Inc. carries individual snap-test kits, which could also be used for this lab. Catalog URL: http://www.chemetrics.com/catalogcomplete/Catalog2006_2007.pdf • CHEMets Visual Dissolved Oxygen Test Kit,
0-12 ppm Order #: K-7512
• Dissolved Carbon Dioxide Test Kit Order #: K-1910
• CHEMets Visual Ammonia Test Kit (Nessler Method) Order #: K-1510 Reagent Refill Order #: R-1501
• CHEMets Visual Ammonia Test Kit (Salicylate Method) Order #: K-1410 Reagent Refill Order #: R-1401
Metabolism in aquatic ecosystems 67
Appendix B: Chemistry of Water Tests
Although this lab was designed for non-majors, it can be rendered more appropriate for majors or advanced courses by providing detailed information about water chemistry. This brief background on the water
tests used could be provided to students.
Dissolved Oxygen
A common method for measuring oxygen is the Winkler (or iodometric) test. The LaMotte AQ-2 water testing kit uses the azide modification of this test (American Public Health Association, et al., 1999), which
removes any interference from nitrite.
The water sample must be handled with special care for this test, as the dissolved oxygen content is easily perturbed by exposure to ambient air through trapped bubbles or agitation. Therefore a vital step prior to
dissolved oxygen measurement is “fixation” of the oxygen within the sample. Most kits include a special glass
bottle with conical lid or stopper that can be fully immersed in the sample and aids exclusion of gas bubbles. To
prevent addition of air bubbles, the sampling bottle must be filled to its rim, which means that added reagents will cause spillage. We recommend placing the bottles on paper towels for this reason.
The sample is first treated with divalent manganese sulfate solution followed by strong base. This
quickly converts dissolved oxygen to various manganous hydroxide precipitates (the brown and yellow precipitates noted during the test), and “fixes” the oxygen content of the sample.
MnCl2 + 2 NaOH Mn(OH)2 + 2 NaCl
2 Mn(OH)2 + O2 2 Mn(OH)3 + 2 H+
These precipitates are then dissolved using sulfuric acid. From this point onward, the sample is less
sensitive to ambient air. Conveniently, the “strong base” used in the preceding step is “alkaline potassium iodide
reagent,” which includes both azide (to counteract nitrites) and iodine (for the next step). Upon acidification, iodine converts manganese back to its original divalent state, which frees an amount of iodine equal to the amount
of dissolved oxygen.
2 Mn(OH)3 + 6 HCl 2 MnCl3 + 6 H2O
2 MnCl3 + 2 KI 2 MnCl2 + 2 KCl + I2
The iodine content is then measured using a starch indicator, which turns blue-black in the presence of iodine. As this sample is titrated with thiosulfate (Na2S2O3), iodine is gradually removed from complex with the
starch until the sample returns to a clear, uncolored state.
2 Na2S2O3 + I2 Na2S4O6 + 2 NaI
The original amount of dissolved oxygen is equivalent to the concentration of sodium iodide formed (or the
amount of thiosulfate added).
Dissolved Ammonia Nitrogen
The levels of ammonia measured by most tests are a combination of ammonium (NH4+) and free
ammonia (NH3). The toxic form is free ammonia, whose proportion to the total ammonia nitrogen varies with pH
and temperature. Most kits come with a table that facilitates the calculation of free ammonia (for example,
LaMotte, 2006). For our purposes, however, the total ammonia nitrogen is sufficient, and reflects the total nitrogen liberated by protein digestion or decomposition.
68 ABLE 2006 Proceedings Vol. 28 Caldwell and Teagarden
There are two common testing methods for ammonia: the Nessler test (American Public Health
Association, et al., 1999) and the salicylate test (USGS National Water Quality Laboratory, 1993). The latter is to be preferred as the reagents are more environmentally friendly and do not contain mercury.
Nessler’s Method
This method treats ammonia-containing samples with tetraiodomercurate, which forms a yellow or brown
color that can be measured by spectrophotometry, permanent liquid color standards (American Public Health Association, et al., 1999), or a calibrated color gauge (as in the AQ-2 kit). The method is not accurate for very
low (< 100 μg/L) concentrations of ammonia (American Public Health Association, et al., 1999).
The sample is first pre-treated with zinc sulfate and alkali to precipitate and thus remove interference from calcium, iron, magnesium, and sulfide. Nessler’s reagent is potassium tetraiodomercurate in potassium
hydroxide (Ammonia Nitrogen Reagent #2), which creates a yellow compound in solution:
NH4+ + 2[HgI4]
2 + 4OH HgO·Hg(NH2)I + 7I + 3H2O
Salicylate Method
This alternative method of determining ammonia nitrogen does not involve mercury (USGS National
Water Quality Laboratory, 1993). First, hypochlorite ion is added to the sample to convert ammonia into
monochloramine:
NH3 + OCl NH2Cl + OH
In the next step, salicylate and a nitro-ferricyanide catalyst are added, to convert monochloramine to 5-
aminosalicylate, which (as an analog of indophenol) is blue in color:
NH2Cl + C7H6O3 + C5FeN6O6 C7H6NO3 (blue) + Cl + C5FeN6O6 + 2H+
The excess salicylate reagent gives the solvent a yellow color, thus in combination with 5-aminosalicylate
(blue) a green solution is produced. The original concentration of ammonia is equal to the final concentration of 5-aminosalicylate, which can be determined using a calibrated color scale. If no significant amount of ammonia
is present, the solution remains yellow.
Dissolved Carbon Dioxide Test
The test for carbon dioxide is a titration monitored through the color change of phenolphthalein (American Public Health Association, et al., 1999). Conveniently, the color change of this compound at pH 8.3
coincides with the end point of carbon dioxide and bicarbonate titration. First, dissolved CO2 and bicarbonate are
converted to sodium bicarbonate using aqueous sodium hydroxide (called “Carbon Dioxide Reagent B” in the instructions):
HCO3 + H+ CO2 + H2O CO2 + NaOH NaHCO3
Completion of the reaction is indicated by appearance of a pink color, which indicates a stoichiometric amount of sodium hydroxide has been added.
Metabolism in aquatic ecosystems 69
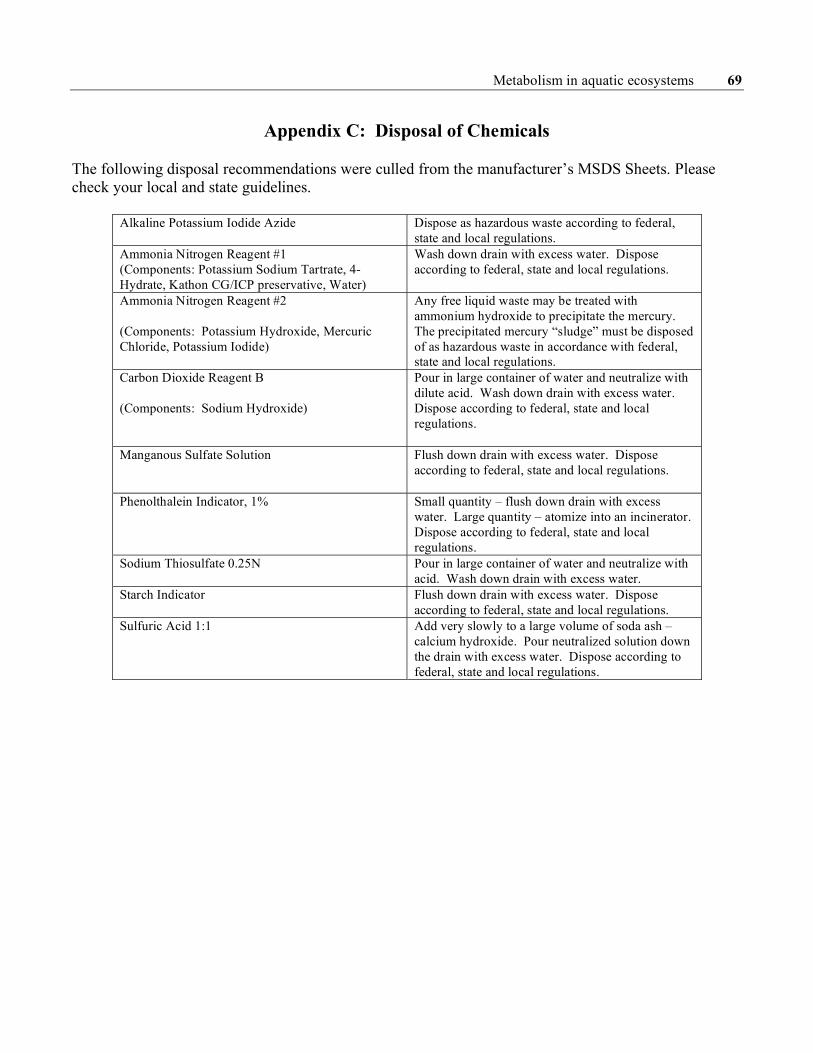
Appendix C: Disposal of Chemicals The following disposal recommendations were culled from the manufacturer’s MSDS Sheets. Please check your local and state guidelines.
Alkaline Potassium Iodide Azide Dispose as hazardous waste according to federal,
state and local regulations. Ammonia Nitrogen Reagent #1
(Components: Potassium Sodium Tartrate, 4-
Hydrate, Kathon CG/ICP preservative, Water)
Wash down drain with excess water. Dispose
according to federal, state and local regulations.
Ammonia Nitrogen Reagent #2
(Components: Potassium Hydroxide, Mercuric
Chloride, Potassium Iodide)
Any free liquid waste may be treated with
ammonium hydroxide to precipitate the mercury.
The precipitated mercury “sludge” must be disposed
of as hazardous waste in accordance with federal, state and local regulations.
Carbon Dioxide Reagent B
(Components: Sodium Hydroxide)
Pour in large container of water and neutralize with
dilute acid. Wash down drain with excess water.
Dispose according to federal, state and local
regulations.
Manganous Sulfate Solution Flush down drain with excess water. Dispose
according to federal, state and local regulations.
Phenolthalein Indicator, 1% Small quantity – flush down drain with excess
water. Large quantity – atomize into an incinerator.
Dispose according to federal, state and local
regulations. Sodium Thiosulfate 0.25N Pour in large container of water and neutralize with
acid. Wash down drain with excess water. Starch Indicator Flush down drain with excess water. Dispose
according to federal, state and local regulations. Sulfuric Acid 1:1 Add very slowly to a large volume of soda ash –
calcium hydroxide. Pour neutralized solution down
the drain with excess water. Dispose according to
federal, state and local regulations.