Embed Size (px)
Citation preview

www.pwc.com/us/
Intel’s EconomicImpacts on the USEconomy, 2008 - 2012
Prepared for Intel Corporation
Intel’s EconomicImpacts on the USEconomy, 2008 - 2012
December 17, 2013

Intel’s Economic Impacts on the US Economy, 2008 – 2012
Contents
Executive Summary 1
I. Introduction 5
II. Industry Classfication 7
III. Intel’s Economic Impact through its Operations, Capital Investments, andDistribution Channels 9
IV. Intel’s Economic Impact by Sector 16
V. Intel’s Products and Services Impacts 18
VI: Case Studies 28
Appendix A: Data Sources and Methodology 58
Appendix B: Intel’s Indirect and Induced Impacts on the US Economy by Sector 61
Appendix C: Literature Review 66

Intel’s Economic Impacts on the US Economy, 2008 – 2012
1
Intel’s Economic Impacts on the US Economy,2008 - 2012
Executive Summary
Intel Corporation and its wholly-owned subsidiaries (“Intel”) design and manufactureadvanced integrated digital technology platforms. A platform consists of amicroprocessor and chipset, and may be enhanced by additional hardware, software,and services. The platforms are used in a wide range of applications, such as PCs,laptops, servers, tablets, smartphones, automobiles, automated factory systems, andmedical devices. Intel also develops and sells software and services primarily focused onsecurity and technology integration.
Intel Corporation engaged PwC to assess its economic impacts on the US economy. Thisreport provides PwC’s economic impact estimates for Intel in terms of employment,labor income, and gross domestic product (or GDP) for 2008 - 2012.1 These impacts arefurther highlighted through a series of case studies on important contributions Intelmakes to the US national and local economies.
Key Findings
Intel, the world’s largest semiconductor manufacturer,2 has a widespread economicimpact throughout all sectors of the US economy through its operations andinvestments. Intel not only provides a large number of jobs to US workers,3 but alsoinvests heavily in the United States: since 2009, the company has announced plans tobuild two new factories in Oregon and Arizona and upgrade its existing manufacturingfacilities in those two states and in New Mexico with next-generation technology. Intelis currently ranked first in R&D among US public companies and it is the fifth largestcapital investor in the United States.4 In addition, Intel’s products and services directlyboost economy-wide productivity.
1 A company’s GDP is also known as its value added, i.e., the additional value created at a particular stageof production. It is equal to the company’s sales less its purchases from other businesses. It can also bemeasured as the sum of employee compensation, proprietors' income, income to capital owners fromproperty, and indirect business taxes (including excise taxes, property taxes, fees, licenses, and sales taxespaid by businesses).2 See IBISWorld Industry Report 33441a, “Semiconductor and Circuit Manufacturing in the US,” August2013, pg. 29.3 According to Intel’s 2012 Annual Report, approximately 51 percent of its 105,000 worldwide employeesare located in the United States, with the majority of the company’s microprocessor manufacturing beingdone at facilities in Arizona, Oregon and New Mexico.4 Scott Thurm, “Behind the Big Profits: A Research Tax Break,” The Wall Street Journal, June 14, 2013;Diana G. Carew and Michael Mandel, “U.S. Investment Heroes of 2013: The Companies Betting onAmerica’s Future,” Progressive Policy Institute, September 2013.

Intel’s Economic Impacts on the US Economy, 2008 – 2012
2
A. Quantitative Analysis
In 2012:
Intel employed 53,200 full- and part-time workers in the United States. Eachjob at Intel is estimated to support more than 13 other jobs elsewhere in the USeconomy.
Intel paid out a total of $9.3 billion in wages and salaries and benefits anddirectly contributed $26.0 billion in GDP in 2012.
Counting economic impacts through operations, investments, and distributionchannels, Intel’s total employment impact on the US economy was 774,600 jobs.
Counting economic impacts through operations, investments, and distributionchannels, Intel’s total impact on labor income (including wages, salaries,benefits, and proprietors’ income) was $52.2 billion.
Counting economic impacts through operations, investments, and distributionchannels, Intel’s total impact on US GDP was $95.8 billion.
Cumulative Economic Impact, 2008-2012:
Intel’s direct employment in the United States increased from 44,800 in 2008to 53,200 in 2012.
Intel paid out a total of $39.4 billion in wages and salaries and benefits (incurrent dollars) over this period and directly contributed a total of $120.7 billion(in current dollars) to GDP.
Intel’s total employment impact on the US economy through operations,investments, and distribution channels rose from 581,600 jobs in 2008 to774,600 jobs in 2012, or an increase of 33 percent.
Intel’s total impact on labor income through operations, investments, anddistribution channels for the period was $214.6 billion (in current dollars).
Intel’s total impact on US GDP through operations, investments, anddistribution channels for the period was $408.5 billion (in current dollars).
Between 2007 and 2011, the most recent 5-year period for which relevant dataare available, Intel’s products and services are estimated to have contributed$54.8 billion in GDP (in current dollars) to the US economy through its impacton total factor productivity and capital deepening.
Intel’s direct, upstream, and downstream impacts on the US economy for the 2008 –2012 period are summarized in Table E-1.

Intel’s Economic Impacts on the US Economy, 2008 – 2012
3
Table E-1.− Intel’s Impacts on the US Economy, 2008 – 2012
Item 2008 2009 2010 2011 2012
Em ploy ment* 581,600 584,500 600,900 7 08,900 7 7 4,600
Direct impact 44,800 44,500 44,100 50,100 53,200
Indirect and induced impacts
Upstream (operations and capital investment) 441,800 444,400 460,100 554,300 606,300
Downstream (distribution channel) 95,000 95,600 96,7 00 104,500 115,100
Labor Incom e ($ m illions)** $37 ,328 $37 ,541 $40,032 $47 ,503 $52,226
Direct impact $6,7 00 $6,854 $7 ,7 43 $8,859 $9,283
Indirect and induced impacts
Upstream (operations and capital investment) $25,090 $25,004 $26,452 $32,328 $35,87 8
Downstream (distribution channel) $5,538 $5,683 $5,837 $6,316 $7 ,065
GDP ($ m illions) $7 4,97 4 $7 3,434 $7 6,196 $88,07 5 $95,802
Direct impact $23,951 $22,801 $22,939 $25,001 $26,044
Indirect and induced impacts
Upstream (operations and capital investment) $41,541 $40,940 $43,293 $52,307 $57 ,7 20
Downstream (distribution channel) $9,483 $9,694 $9,964 $10,7 67 $12,038
Source: Intel data on direct employment and labor income and PwC calculations using the IMPLAN modeling sy stem.
Note: Details may not add to totals due to rounding.
* Direct employment is defined as the num ber of full- and part-tim e jobs. Indirect and induced em ploy m ent includes pay roll em ploy ment and self-employ m ent.
** Direct labor income is defined as wages and salaries and benefits. Indirect and induced labor income includes wages and salaries, benefits, and proprietors' incom e.

Intel’s Economic Impacts on the US Economy, 2008 – 2012
4
B. Qualitative Case Studies
In addition to the significant economic impact generated from Intel’s operations andcapital investments at locations with large Intel manufacturing facilities in Oregon,Arizona and New Mexico, there are other impacts related to job creation and talentgrowth, innovation, industry leadership, supplier benefits and clustering impacts. Toqualitatively assess Intel’s impacts in these areas, PwC and Intel jointly identified threethemes that would be the focus of three field-level case studies of Intel’s operations andinvestments in the United States.5 PwC developed these case studies through interviewsof external stakeholders and industry experts. Quotes from some of these respondentsare included in the highlights below.
1. Research and Development (“R&D”) – In 2012 Intel’s global R&D spendingwas $10.1 billion, with a five-year R&D spend of over $36.5 billion. US-basedR&D spending accounted for the majority of the total global spend in 2012. In a2013 survey conducted by Booz & Co, Intel was the number one R&D spenderamong publicly traded US companies in all sectors. Interview respondents calledIntel’s R&D efforts in the United States “rich with innovation” and “industry-leading,” pointing to years of being on the “leading-edge of development” and“bringing forward technology that matters.”
2. Supply Chain Ecosystem – Intel maintains and interacts with a vast supplychain as both a consumer and a supplier. With $11B in global capitalexpenditures (about 80% in the US) and $53.3 billion in global sales, thecompany operates in the middle of a supply chain that is continuously improvingthe usability and interactivity of technology. Interview respondents describedIntel’s impact on its Oregon supply chain as “the most important economic factorin Oregon” and that Intel “makes a difference and is stable in our economy.”Furthermore, industry veterans viewed Intel as a company that “kept themanufacturing and expertise in this country [US]” and noted that “without Intel,the semiconductor industry would be considerably less US-centric and furtherbehind.”
3. Venture Capital – Since its inception in 1991, Intel Capital has invested morethan $10.8 billion in over 1,276 companies in 54 countries. Intel Capital’sinvestment in the US Technology industry has been evident with $6.7 billion, or62% of its total capital investment going to US-based companies. Furthermore,Intel Capital’s focus on company building has resulted in over 500 acquisitions,mergers, and IPOs. Intel Capital’s contribution to the US economy and businessenvironment goes beyond capital investment. As industry experts and executivesof former portfolio companies stated, Intel Capital is “among the best in knowingthe industry” and their “stamp of approval is hard to match.” Intel Capital’sadvantages are described as “longevity, experience, size, consistency, andfinancial returns were among the best, if not the best of any unit.” Portfolio
5 For the purposes of the Case Studies, Intel refers to Intel Corporation, excluding McAfee and Wind Riversubsidiaries.

Intel’s Economic Impacts on the US Economy, 2008 – 2012
5
companies benefit from investments and interactions that “helped us to span outgeographically and grow the sales team.”
Intel’s Economic Impacts on the US Economy, 2008 – 2012
6
Intel’s Economic Impacts on the US Economy,2008 - 2012
I. Introduction
This report estimates the US economic impact of Intel Corporation and its wholly-owned subsidiaries McAfee, Inc. and Wind River Systems, Inc. (“Intel”) in terms ofemployment, labor income, and gross domestic product (or value added) for 2008 -2012. These impacts are highlighted through a series of case studies on importantcontributions Intel makes to the US national and local economies.
The IMPLAN model, an input-output model based on federal government data, wasused to quantify the economic impact of Intel on the US economy for each year from2008 through 2012.6 As described below, three types of economic impacts attributableto Intel – direct, indirect, and induced – were quantified:
Direct impact measures Intel’s jobs, labor income, and gross domestic product(or GDP).
Indirect impact measures the jobs, labor income, and GDP occurringthroughout Intel’s supply chain, including both its upstream purchases fromsuppliers and the downstream impacts associated with the distribution of Intel’sproducts through its wholesalers, distributors, and retailers.
Induced impact measures the jobs, labor income, and GDP resulting fromhousehold spending of labor and proprietor’s income earned either directly orindirectly from Intel’s spending.
For the indirect and induced impacts, the report considers both operational impacts(due to purchases of intermediate inputs and payments of labor compensation) andcapital investment impacts (due to investment in new structures and equipment).
This report also separately estimates the impact of Intel’s products and services onother sectors of the US economy, such as through productivity enhancement.
It should be noted that this report reflects Intel’s gross contribution to US employment,labor income, and gross domestic product (GDP), and does not account for potentialredeployment of labor and capital in the absence of Intel’s US operations.
The rest of this report is organized as follows. Section II defines the primary industriesin which Intel Corporation and its wholly-owned subsidiaries operate. Section IIIestimates Intel’s upstream (operations and capital investment) and downstream(distribution channel) impacts on the US economy for 2008 through 2012. Section IVestimates Intel’s economic impact by US industrial sector. Section V discusses theeconomic impacts of Intel’s products and services. Section VI presents three casestudies that build upon the quantitative analyses to further highlight Intel’s economic
6 The IMPLAN input-output economic modeling system is developed by the IMPLAN Group LLC. TheIMPLAN model is based on input-output tables that map the flow of value along the supply chain fordifferent industries in the economy.

Intel’s Economic Impacts on the US Economy, 2008 – 2012
7
impacts from a qualitative perspective. A description of the data and methodology usedin this report is in Appendix A. Appendix B provides additional detail on Intel’sindirect and induced impacts on the US economy by sector. Appendix C summarizesthe economic literature on the Information and Communications Technology (ICT)sector’s impact on productivity and economic growth.

Intel’s Economic Impacts on the US Economy, 2008 – 2012
8
II. Industry Classification
Intel Corporation and its wholly-owned subsidiaries McAfee, Inc. and Wind RiverSystems, Inc. encompass a number of activities that span separate industryclassifications in government economic data. For this report, Intel Corporation’s maineconomic activities are classified under “semiconductor and other electronic componentmanufacturing.” McAfee, Inc.’s and Wind River Systems, Inc.’s activities are classifiedunder “software publishers” and “custom computer programming services,”respectively.
Intel Corporation designs and manufactures advanced integrated digital technologyplatforms. A platform consists of a microprocessor and chipset, and may be enhancedby additional hardware, software, and services. Intel Corporation sells these platformsprimarily to original equipment manufacturers, original design manufacturers, andindustrial and communications equipment manufacturers in the computing andcommunications industries. The platforms are used in a wide range of applications,such as PCs, laptops, servers, tablets, smartphones, automobiles, automated factorysystems, and medical devices.
McAfee, Inc. develops and sells software and services primarily focused on technologysecurity including integration of anti-malware, anti-spyware, and antivirus software forpersonal computers, computer networks and other systems around the world. WindRiver Systems, Inc. develops embedded and mobile software enabling companies todevelop, run, and reliably manage device software.
Intel’s three main business segments fall within the following industrial categories in theNorth American Industry Classification System (“NAICS”) (see Table 1):
1. NAICS 334413. Semiconductor and related device manufacturing.This subsector comprises establishments primarily engaged in manufacturingsemiconductors and related solid state devices. Examples of products made bythese establishments are integrated circuits, memory chips, microprocessors,diodes, transistors, solar cells and other optoelectronic devices.
2. NAICS 51121. Software publishers. This subsector comprisesestablishments primarily engaged in computer software publishing or publishingand reproduction. Establishments in this industry carry out operations necessaryfor producing and distributing computer software, such as designing, providingdocumentation, assisting in installation, and providing support services tosoftware purchasers.
3. NAICS 213112. Custom computer programming services. Thissubsector comprises establishments primarily engaged in writing, modifying,testing, and supporting software to meet the needs of particular customers.

Intel’s Economic Impacts on the US Economy, 2008 – 2012
9
Table 1.− Intel by Business Segment
BusinessSegment
NAICSIMPLAN
SectorDescription
IntelCorporation
334413 243Semiconductor and related devicemanufacturing
McAfee, Inc. 51121 345 Software publishers
Wind RiverSystems, Inc.
541511 371Custom computer programmingservices

Intel’s Economic Impacts on the US Economy, 2008 – 2012
10
III. Intel’s Economic Impact through itsOperations, Capital Investments, and DistributionChannels
This section presents Intel’s economic impact on the US economy through itsoperations, capital investment, and distribution channel. The results reflect the impactof Intel Corporation, and its wholly-owned subsidiaries, McAfee, Inc. and Wind RiverSystems, Inc. The total economic impact includes:
1. Direct impact (the jobs, labor income, and GDP within Intel),2. Indirect impact (the jobs, labor income, and GDP occurring throughout the
upstream and downstream supply chain of Intel), and3. Induced impact (the jobs, labor income, and GDP resulting from household
spending of income earned either directly or indirectly from Intel’s spending).
Upstream impacts arise from Intel’s operations (due to both purchases ofintermediate inputs and payments of labor compensation) and capital investment (dueto its investment in new structures and equipment). Downstream impacts arise fromIntel’s distribution channel and include the operational impacts of Intel’sdistributors. Intel’s distribution channel includes wholesalers, distributers, andretailers. Each business in Intel’s distribution channel provides jobs and labor incomeand generates GDP.
The IMPLAN input-output model was used to estimate Intel’s economic impacts on theUS economy over the 2008-2012 period.7
7 When comparing this report to other input-output analyses, note that not all input-output analysesnecessarily incorporate capital investment and/or distribution channel impacts.
Key Findings:
Intel’s total employment impact on the US economy rose from 581,600 jobs in 2008 to774,600 jobs in 2012, or an increase of 33.2 percent.
In 2012, Intel employed 53,200 full- and part-time workers in the United States. Each job atIntel supported more than 13 other jobs elsewhere in the US economy.
Intel’s total impact on labor income was $52 billion in 2012 and nearly $215 billion over the2008-2012 period.
Intel’s total impact on US GDP was $96 billion in 2012 and more than $408 billion over the2008-2012 period.

Intel’s Economic Impacts on the US Economy, 2008 – 2012
11
Employment
Intel employed 53,200 US workers in 2012. In addition, Intel indirectly supported721,400 other full-time and part-time jobs in the US economy: 496,300 from Intel’soperations; 110,000 from Intel’s capital investment; and 115,000 from its distributionchannel. Combining the direct, indirect and induced impacts, Intel’s total employmentimpact on the US economy is estimated to be 774,600 full-time and part-time jobs in2012, roughly ½ of 1 percent of total US employment.
Intel’s total employment impact on the US economy rose from 581,600 jobs in 2008 to774,600 jobs in 2012 (see Table 2). The largest component of Intel’s total employmentimpact is attributable to its operational supply chain.
Table 2.− Intel’s Impact on US Employment, 2008-2012 [Direct impact and indirect/induced impacts due to operations, capital investment, and distribution]
Source: Intel data on direct employment and PwC calculations using the IMPLAN modeling system.
0
100,000
200,000
300,000
400,000
500,000
600,000
700,000
800,000
900,000
2008 2009 2010 2011 2012
Direct Operational Capital Investment Distribution Channel

Intel’s Economic Impacts on the US Economy, 2008 – 2012
12
Labor Income
According to Intel, it paid $9.3 billion in wages, salaries and fringe benefits to its USemployees in 2012. Including the jobs indirectly supported by Intel through itsoperational spending, capital investment, and distribution channel, the associated totalimpact on US labor income (including wages and salaries and benefits as well asproprietors’ income) is estimated to be $52.2 billion in 2012.
Intel’s total impact on US labor income grew each year from $37.3 billion in 2008 to$52.2 billion in 2012 (see Table 3).
Table 3.− Intel’s Impact on US Labor Income, 2008 – 2012(In billions of dollars)
[Direct impact and indirect/induced impacts due to operations, capital investment, and distribution]
Source: Intel data on direct labor income and PwC calculations using the IMPLAN modeling system.
$0
$10
$20
$30
$40
$50
$60
2008 2009 2010 2011 2012
Direct Operational Capital Investment Distribution Channel

Intel’s Economic Impacts on the US Economy, 2008 – 2012
13
GDP
PwC estimates that Intel’s operations directly generated $26.0 billion of GDP to the USeconomy in 2012. Intel’s operations indirectly generated an additional $48.4 billion tothe US economy in 2012, while its capital investment and distribution channel impactadded another $9.8 billion and $12.0 billion of GDP, respectively. Combining theoperational, capital investment, and distribution channel impacts, Intel’s total GDPimpact on the US economy was $95.8 billion, accounting for 6/10 of 1 percent of USGDP in 2012.
Intel’s GDP contribution to the US economy grew from $75.0 billion in 2008 to $95.8billion in 2012 despite a slight reduction in 2009 to $73.4 billion during a period of USeconomic contraction (see Table 4).
Table 4.− Intel’s US GDP Impact, 2008 – 2012 (In billions of dollars)
[Direct impact and indirect/induced impacts due to operations, capital investment, and distribution]
Source: PwC calculations using the IMPLAN modeling system.
$0
$20
$40
$60
$80
$100
$120
2008 2009 2010 2011 2012
Direct Operational Capital Investment Distribution Channel

Intel’s Economic Impacts on the US Economy, 2008 – 2012
14
Case Study: Intel’s Fabrication Site in Hillsboro,Oregon
Intel provides the Oregon region with approximately 16,400 direct jobs, making it the state’s largest private employer.For perspective, Intel represents approximately 20% of tech employment in Oregon which has more than 5,300 techcompanies employing a total of 81,632 tech industry professionals.
Intel also compares favorably with respect to employee salaries and Oregon’s standard of living. The average annualsalary of tech sector employees in Oregon was $94,200 in 2012, or 123 percent higher than other private sectoremployment within Oregon.
“Intel’s average wage is approximately $125,000 here in the Portland metro area, while average per capita income is$41,000.”
- President and CEO of the largest business advocacy organization in Oregon
Intel is the largest taxpayer in Washington County, contributing $20.8 million in taxes to the County in 2012. Oregondoes not have a sales tax; therefore, its excise tax (i.e., the tax for the privilege of doing business in the state) is theprimary revenue source for the state along with property and employment taxes. Tax revenues serve to fund, for example,public safety employees, public school employees, government officials and staff, and state economic developmentinitiatives. As a result, tax contributions provide an employment impact beyond Intel’s direct workers.
“[As] the largest [employer] in the state...Intel has a huge impact from a state-wide perspective.”
- President of a local Oregon Chamber of Commerce
Intel’s total capital investment in the state has exceeded $25 billion since the company acquired its first piece of propertyin Oregon in 1974. A senior member of the Oregon Building Trades and Portland Development Commission recentlyremarked that the construction jobs that Intel provides have a ripple effect on the economy in numerous areas including,for example, construction workers paying mortgages, going out to dinner, and making other purchases.
“All of the construction jobs related to Intel’s new fabrication sites put the construction industry back to work in thestate [Oregon].”
- President and CEO of the largest business advocacy organization in Oregon
“Through some of our darkest times during the technology bust in 1999-2000, Intel had cranes in the air doingconstruction. Intel makes a difference and is stable in our economy.”
- President of a local Oregon Chamber of Commerce
“Intel is the single mostimportant economic factor inOregon today...they bringworkers from world-wideover to here.”
“No one is as big and ascomprehensive as Intel.”
“If you took Intel out ofOregon, we would be introuble.”
- President and CEO of thelargest business advocacyorganization in Oregon

Intel’s Economic Impacts on the US Economy, 2008 – 2012
15
The results for each year are summarized in Table 5. The total economic impact ofIntel in terms of jobs and labor income (including wages and salaries and benefits aswell as proprietors’ income) grew steadily throughout the period. The total economicimpact in terms of GDP in nominal terms grew at an average rate of 6 percent per yearfrom 2008 through 2012 despite a contraction in 2009.
Table 5.− Intel’s Direct, Operational, Capital Investment, and DistributionChannel Impacts on the US Economy, 2008-2012
(Dollar amounts in millions of current dollars)
ItemDirect
Impacts
Indirect and Induced Impacts
TotalImpacts
Upstream ImpactsDownstream
ImpactOperational
ImpactsCapital
InvestmentImpacts
DistributionChannelImpacts
2008Employment1 44,800 408,900 32,900 95,000 581,600Labor Income2 $6,700 $23,142 $1,948 $5,538 $37,328GDP $23,951 $38,660 $2,881 $9,483 $74,974
2009Employment 44,500 405,900 38,500 95,600 585,500Labor Income $6,854 $22,727 $2,277 $5,683 $37,541GDP $22,801 $37,592 $3,347 $9,694 $73,434
2010Employment 44,100 415,500 44,600 96,700 600,900Labor Income $7,743 $23,762 $2,690 $5,837 $40,032GDP $22,939 $39,333 $3,960 $9,964 $76,196
2011Employment 50,100 463,600 90,700 104,500 708,900Labor Income $8,859 $26,925 $5,403 $6,316 $47,503GDP $25,001 $44,462 $7,846 $10,767 $88,075
2012Employment 53,200 496,300 110,000 115,100 774,600Labor Income $9,283 $29,399 $6,478 $7,065 $52,226GDP $26,044 $48,442 $9,278 $12,038 $95,802
Source: Intel data on direct labor income and PwC calculations using the IMPLAN modeling system.Note: Details may not add to totals due to rounding.1 Direct employment is defined as the number of full- and part-time jobs. Indirect and induced employment includespayroll employment and self-employment.2 Direct labor income is defined as wages and salaries and benefits. Indirect and induced labor income includes wagesand salaries, benefits, and proprietors’ income.

Intel’s Economic Impacts on the US Economy, 2008 – 2012
16
IV. Intel’s Economic Impact by Sector
Intel purchases intermediate inputs from a variety of other US industries, supportingjobs in these industries and spurring additional rounds of input purchases by theseindustries. Other economic impacts are generated by the personal spending of Intelemployees and out of the additional income earned by employees in the supply chain toIntel. The jobs, labor income (including wages and salaries and benefits as well asproprietors’ income), and GDP supported by this cycle of spending, or multiplierprocess, are referred to as the indirect and induced economic impacts.
Intel also purchases capital goods from a variety of US suppliers, which has a similarmultiplier effect on the rest of the US economy.
Table 6 shows Intel’s indirect and induced economic impacts by receiving sectors. PwCestimates that at the national level, each direct job at Intel supported more than 13 jobselsewhere in the US economy in 2012. That is, in addition to the 53,200 jobs directlyprovided by Intel, 721,400 additional jobs were supported in the US economy throughthe indirect and induced impacts of Intel. Intel’s purchase of intermediate inputs fromother US suppliers supported 496,300 indirect and induced jobs in other industriesacross the country in 2012. Intel’s capital investment supported 110,000 additionalindirect and induced jobs across the US economy and Intel’s distribution channelsupported another 115,100 jobs. Combined, Intel directly or indirectly supported774,600 jobs in the US economy in 2012. The service sector, being the largest sector inthe US economy, accounted for the largest number of indirect and induced jobsattributable to Intel’s spending (324,400) in 2012, followed by Wholesale and RetailTrade (135,700), Finance, Insurance, Real Estate, Rental and Leasing (65,000),Manufacturing (61,000), and Construction (45,300).
PwC estimates that in 2012 the $9.3 billion in employee compensation directly paid outby Intel led to an additional $42.9 billion in labor income in the US economy – amultiplier effect of 4.6. In addition, Intel’s direct GDP contribution of $26.0 billion in2012 resulted in an additional $69.8 billion of GDP to the US economy – a multipliereffect of 2.7. Detailed impact results by sector for the 2008-2012 period are presentedin Appendix B.
Key Findings:
Intel Corporation and its wholly-owned subsidiaries have a widespread economic impactthroughout all sectors of the economy.
In 2012, the service sector accounted for the largest number of indirect and induced jobsattributable to Intel’s spending, followed by wholesale and retail trade, and finance,insurance, real estate, rental and leasing.

Intel’s Economic Impacts on the US Economy, 2008 – 2012
17
Table 6.− Intel’s Indirect and Induced Impacts on the US Economy, by Receiving Industry, 2012
Source: PwC calculations using the IMPLAN modeling system.
* Employment is defined as the number of full- and part-time jobs, including self-employment.
** Labor income is defined as wages and salaries and benefits and proprietors' income.
Indirect Induced Indirect Induced Indirect Induced
Agriculture 1 ,200 6,900 $37 $214 $55 $327
Mining 3,100 1,7 00 $232 $130 $682 $386
Utilities 1 ,900 1,300 $248 $169 $899 $613
Construction 41 ,500 3,800 $2,319 $216 $2,480 $248
Manufacturing 45,600 15,400 $3,820 $1,065 $7 ,454 $2,17 1
Wholesale and retail trade 7 1 ,300 64,400 $5,327 $2,544 $9,212 $4,158
Transportation and warehousing 20,600 9,600 $1,109 $531 $1,494 $7 22
Information 8,900 6,000 $999 $557 $1,668 $1,161
Finance, insurance, real estate, rental and leasing 19,200 45,800 $1,151 $2,187 $3,325 $8,27 0
Services 160,300 164,100 $10,258 $7 ,543 $12,661 $9,17 6
Other 17 ,7 00 11,100 $1,408 $880 $1,600 $995
Total Indirect and Induced Im pacts 391,300 330,100 $26,906 $16,037 $41,531 $28,227
Sector DescriptionEm ploym ent* Labor Incom e ($ m illion)** GDP ($ m illion)

Intel’s Economic Impacts on the US Economy, 2008 – 2012
18
V. Intel’s Products and Services Impacts
This section first reviews the economic literature on the impact of the Information andCommunications Technology (“ICT”) sector on US economic growth and then estimatesIntel’s share of the overall contribution of the ICT sector.
Contribution of the ICT Sector to US Economic Growth – Literature Review
The ICT sector’s economic impacts include improved labor productivity, lower prices,and faster economic growth. Moore’s Law, named after Intel co-founder Gordon Moore,states that the number of transistors on integrated circuits doubles approximately everytwo years. The capabilities of computers and other semiconductor-dependent devicesare strongly linked to Moore’s Law. Computing power, processing speeds, and memorycapacity have all increased exponentially. From the early 1970s to 2000, the power ofmicroprocessors increased by a factor of 7,000 while the cost of storing one megabit ofdata fell from more than $5,000 to just 17 cents.8 A large body of economics researchfinds that the ICT sector has fueled technological change and productivity growth acrossall sectors of the economy.
In general, companies increase productivity through three channels:
1. Capital deepening: Increased investment in capital equipment (includingcomputers and other information technology) allows workers to be more efficientand more productive.
2. Improved labor quality: Investments in “human capital” through trainingand investments in education increase worker productivity.
3. Total factor productivity: Increases in productivity achieved throughtechnological progress and innovations in business systems or organizationalstructure.
8 Rauch, Jonathan, “The New Old Economy: Oil, Computers, and the Reinvention of the Earth,” TheAtlantic Monthly, January 2001.
Key Findings:
Users of Intel's products and services benefit from productivity enhancements and costreductions.
Intel’s products and services contribute to the growth of productivity and GDP throughtwo channels: total factor productivity and capital deepening.
Through these two channels, Intel’s products and services contributed $54.8 billion inGDP to the US economy over the 2007-2011 period.

Intel’s Economic Impacts on the US Economy, 2008 – 2012
19
Case Study: Selected Intel R&D Facilities
Intel’s Arizona operations are spread across two large sites in the City of Chandler. Roughly half of Intel’s 11,000 employee basein the state works at the 700-acre Ocotillo campus which is dedicated to manufacturing the company’s latest silicon technology.The remaining employees are located at Intel’s 150-acre Chandler campus where a substantial portion of employees are dedicatedto research and development. In fact, Intel has invested more than $300 million to build a new research and development facilityat this site. The facility, which is nearing completion, will be used to expand Intel’s packaging operations. The innovation thatwill occur in this facility is aimed at influencing technology trends for years to come. This investment is creating several hundredIntel R&D-related jobs and nearly a thousand construction jobs. Intel’s Arizona employees, on average, earn over $130,000 peryear (including total compensation, benefits and bonuses).
Intel’s Massachusetts Design Center in Hudson, Massachusetts is home to more than 825 engineers engaged inmicroprocessor design, testing and validation for the development of next generation multi-core Itanium® and Xeon®microprocessors for high-end servers. Lab facilities, technical staff, and engineers work directly with product design teams onfirst silicon readiness to support the introduction of new high performance products before they are released for high volumemanufacturing. Labs are staffed by a cross-functional team of content developers, debug engineers, software engineers,technicians and inventory control specialists, working closely with design and validation engineering working on first silicon tovolume validation to deliver production ready quality products.
In Intel’s New Hampshire R&D and production facility, a group of 60 Intel research and development employees researchesmethods to make it easier to perform parallel programming on Intel processing cores while maximizing application performance.Parallel programming by definition is aimed at compartmentalizing complex problems into smaller, more manageable problemsand computing solutions simultaneously. The site manager of the New Hampshire Intel facility described the importance of thework being performed as, “enabling the technology created by Intel, meaning, without them, the development community wouldnot be able to “unlock” the potential and performance of the newer multi-core processors developed at Intel.” The programminglanguage, prototypes and tools developed here allow end-users of Intel’s silicon to better understand and utilize the capabilities ofthe products. Intel’s R&D at this facility is aimed at faster computing, higher efficiency, and ease of technology use for moreapplications.
In the Columbia, South Carolina facility, approximately 310 Intel engineers test Intel’s products to verify the already-designed product’s features work as advertised and meet stated specifications. It is considered the “last step” before thecompleted piece of research and development becomes commercialized. The site manager of the South Carolina design centerstated, “All of our validation activities have successfully yielded commercialized products in the XeonTM and CoreTM product lines;for example, XeonTM E5 is a recent product predominantly supporting Cloud and Data Center programs validated at the SouthCarolina facility and the highly successful 4th Generation CoreTM graphics system was also validated here.” When asked about theeffects of the research and development site on the local economy, the site manager responded, “Salaries for this site are notablyhigher than the comparative geography and our employees enjoy a generally higher standard of living…The South CarolinaCommerce Secretary’s office tells us our gross salary of $26 million has a compounded effect of nearly three times [$76 million]on the local economy.”
In Intel’s Eau Claire, Wisconsin lab, a group of 60 Intel employees are defining, designing, validating, and testing componentsinto which fabric connects. Fabric is high-speed interface that connects elements of a computing system and a key technology forsupercomputing. Fiber cables act like the network connection on a computer, allowing the user to send and receive data. Datatransfers through fiber 25 billion times per second, allowing for faster sending and receiving of information than ever before.Fiber cables play a key role in high performance computing, which improves our economy, safety, and fundamental knowledge.This technology helps oil companies reduce wasted effort by accurately identifying and locating oil reserves, improves theaccuracy of weather predictions allowing for accelerated warning systems, and allows for intricate simulations of real-worldcatastrophes to predict impact and provide planning tools for disaster relief efforts. The Wisconsin team has grown by 20 percentin the past year and is expected to continue to grow.
In Fort Collins, Colorado, approximately 425 Intel employees design data center applications and solutions including theXeonTM and ItaniumTM architectures. The Fort Collins R&D center is responsible for the architecture, design, and development ofhigh-performance server microprocessors for server and workstation applications. The site collaborates with universities byparticipating in programs to grow awareness of and support professorships in Science, Technology, Engineering andMathematics (“STEM”) careers. In addition, the site participates on external boards and conference committees to supportwomen and minorities in STEM. The design center also impacts its community through environmental initiatives such asrecycling (68,000 lbs in 2011), reducing onsite energy and gas consumption (by an amount that is equivalent to the annual energyand gas onsumption by 250 average American households), and improving eco-friendly options for worker transportation byimplementing and incentivizing a “bike to work” program. This group also is noteworthy because it is the largest per employeedonor to the United Way in the country with an average gift size per donor at $3,500.
Intel’s Economic Impacts on the US Economy, 2008 – 2012
20
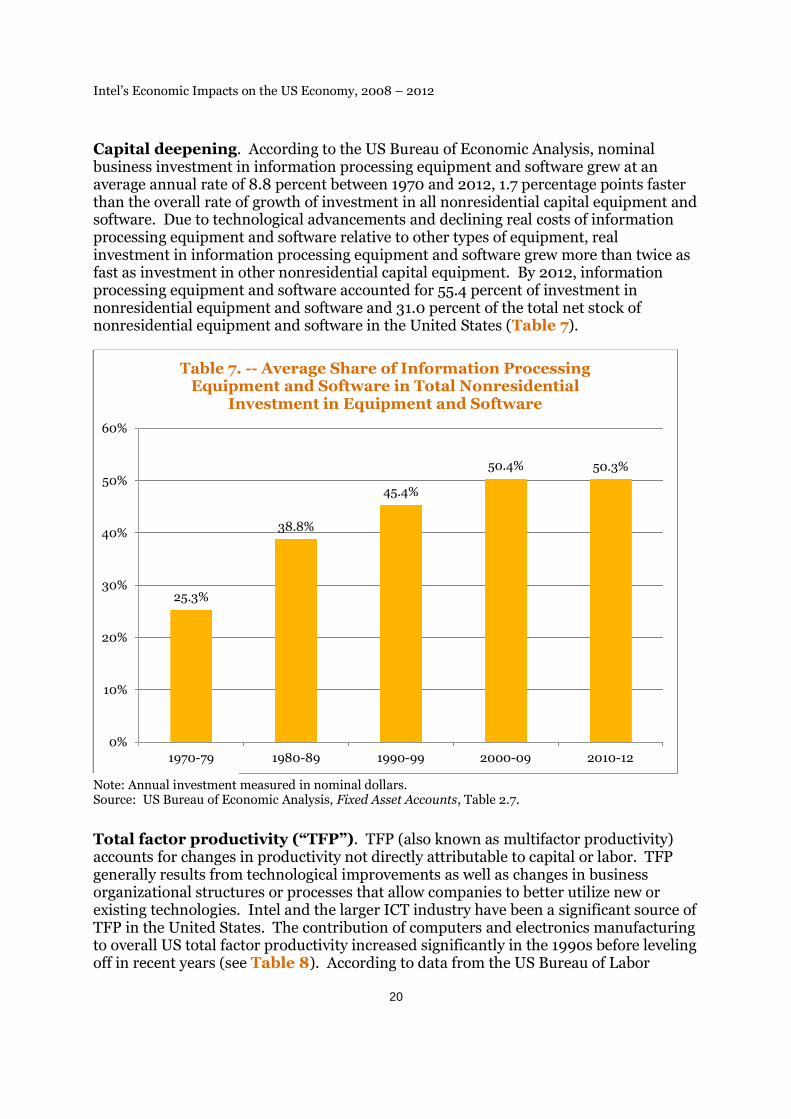
Capital deepening. According to the US Bureau of Economic Analysis, nominalbusiness investment in information processing equipment and software grew at anaverage annual rate of 8.8 percent between 1970 and 2012, 1.7 percentage points fasterthan the overall rate of growth of investment in all nonresidential capital equipment andsoftware. Due to technological advancements and declining real costs of informationprocessing equipment and software relative to other types of equipment, realinvestment in information processing equipment and software grew more than twice asfast as investment in other nonresidential capital equipment. By 2012, informationprocessing equipment and software accounted for 55.4 percent of investment innonresidential equipment and software and 31.0 percent of the total net stock ofnonresidential equipment and software in the United States (Table 7).
Note: Annual investment measured in nominal dollars.Source: US Bureau of Economic Analysis, Fixed Asset Accounts, Table 2.7.
Total factor productivity (“TFP”). TFP (also known as multifactor productivity)accounts for changes in productivity not directly attributable to capital or labor. TFPgenerally results from technological improvements as well as changes in businessorganizational structures or processes that allow companies to better utilize new orexisting technologies. Intel and the larger ICT industry have been a significant source ofTFP in the United States. The contribution of computers and electronics manufacturingto overall US total factor productivity increased significantly in the 1990s before levelingoff in recent years (see Table 8). According to data from the US Bureau of Labor
25.3%
38.8%
45.4%
50.4% 50.3%
0%
10%
20%
30%
40%
50%
60%
1970-79 1980-89 1990-99 2000-09 2010-12
Table 7. -- Average Share of Information ProcessingEquipment and Software in Total Nonresidential
Investment in Equipment and Software

Intel’s Economic Impacts on the US Economy, 2008 – 2012
21
Statistics, computers and electronics manufacturing accounted for 0.46 percentagepoints of the 0.92 percentage point increase in annual private nonfarm business TFPover the 1987 to 2011 period. In other words, computers and electronics manufacturingaccounted for approximately half of the TFP growth in the private nonfarm businesssector over this 25-year period.
Source: US Bureau of Labor Statistics, Contributions of Manufacturing Industries to PrivateNonfarm Business Multifactor Productivity, June 19, 2013.
The benefits of productivity growth take many forms. The most immediate benefit isthat labor can produce more output for a given hour of work. Firms that utilize newforms of technology are able to produce the same number of goods or services ofequivalent quality at lower costs given the same number of inputs. Productivity gainsare shared by consumers, workers, and shareholders in the form of lower prices, higherwages, and higher returns on investment. Longer-term effects include higher levels ofICT investment and the development of a labor force with the skills required to utilizeICT in the workplace.
Although the impact of technological progress on productivity gains is difficult to assess,the general consensus among economists has centered around the followingobservations and trends (see Appendix C):
0.30
0.51
0.85
0.36
0.22
0.460.48 0.48
1.341.40
0.44
0.92
0.0
0.2
0.4
0.6
0.8
1.0
1.2
1.4
1.6
1987-90 1990-95 1995-00 2000-07 2007-11 1987-11
Table 8. -- Contribution of Computers and ElectronicsManufacturing to Private Nonfarm Business Total
Factor Productivity Growth, 1987-2011[Percentage points]
Computers and Electronics
Private Nonfarm Business TFP

Intel’s Economic Impacts on the US Economy, 2008 – 2012
22
1. The decline in prices of ICT hardware,2. Growth of employment in ICT-intensive businesses compared to growth in
employment in non-ICT intensity businesses,3. The ICT industry’s positive contribution to economic growth since the early
1990s, and4. Positive "spillover" effects in relation to firms' proximity and access to ICT
investment.
Prices
Data provided by the Bureau of Labor Statistics indicates that prices for informationtechnology hardware and software fell by more than 67 percent during the 1990s.9
Between 1994 and 2001, the price of semiconductors dropped by 47.1 percent comparedto a decline of 18.6 percent between 1988 and 1994 (Aizcorbe, Oliner and Sichel,2006).10 In 1998 alone, the end-use price for computers fell by 40.3 percent with thedecline in semiconductors prices accounting for 40 to 60 percent of the decline(Aizcorbe, Flamm and Khurshid, 2001).11
Technological change in the semiconductor manufacturing industry was the main driverof the observed decline in ICT prices (Mann, 2003). The manufacture of dynamicrandom access memory (DRAMs) and personal computers (PC) both experiencedsignificant price declines during the 1990s. Cheaper semiconductors explained abouthalf of the decline in PC prices (Mann, 2003). Microprocessor unit (MPU) chips alsofollowed an overall trend in price decline, accelerating in the mid-90s and slowing after2001. During this period Intel was the dominant producer of MPU chips (Aizcorbe,Oliner and Sichel, 2006).
While technological progress in the ICT-producing industry was the main driver of thedecline in ICT prices during the 1990s, globalized production contributed to additionprice declines, which allowed for the diffusion of ICT hardware throughout theeconomy. Globalized production and international trade accounted for 10 to 30 percenttradeoff of the decline in ICT hardware prices over this period (Mann, 2003). Forexample, regression analysis has found that an increase in net imports of PCs isassociated with a reduction in PC prices. As the global capacity to produce dynamicrandom access memory (DRAMs) hardware increased relative to actual production, thedecline in prices accelerated (Mann, 2003). As a result of the lower prices, ICThardware was more easily diffused throughout the economy. This diffusion was theresult of two related effects. First, technological advances in semiconductors resulted incontinuing price declines for a given level of performance. These price reductionsincreased demand for intermediate inputs in industries that use semiconductors, suchas computer and communications equipment manufacturing. Second, the price ofoutput in semiconductor-using industries was lower, increasing the quantity demanded
9 PwC calculation using the consumer price index for all urban consumers for information technologyhardware and services.10 The decline in semiconductor prices slowed between 2001 and 2004, declining by 28.2 percent.11 The largest end users of semiconductor chips in 1999 were computer manufacturers, making up half ofthe value of worldwide shipments; the next largest end users were communications equipment (21percent) and consumer electronics (14 percent) manufacturers (Aizcorbe, Flamm and Khurshid, 2001).
Intel’s Economic Impacts on the US Economy, 2008 – 2012
23
by other industries for products like computers and telecommunications equipment(Jorgenson, Ho and Stiroh, 2002).
Firms that purchased and incorporated ICT inputs into their production processesprovided indirect contributions to economic growth. Declines in the price of ICT inputshelped slow price inflation across the economy and allowed policymakers to maintainlower interest rates over a longer timeframe (Mann 2003). From the standpoint of thefinal consumer, technological improvements that reduced the cost of microprocessorsand PCs result in direct gains in the form of increased consumer surplus. For otherbusinesses, these technological improvements mean cheaper inputs and changes inproduction processes that provide further indirect benefits to the economy in the formof lower output prices form non-ICT products to the final consumer. This indirectcontribution is known as “social surplus.” From 2000 to 2007, the social surplusassociated with the declining prices of ICT hardware and software was about 4 percentof real GDP or about $500 billion. This increase in GDP was the result of decliningprices of ICT, which resulted in new business startups and the diffusion of new businessprocesses and practices (Mann 2012).12
Employment
During the 1990s, wholesale trade, securities and commodity brokers, depositoryinstitutions, and telecommunications all had relatively higher levels of informationtechnology. These sectors also experienced higher contributions to GDP growth relativeto other sectors in the economy (Mann, 2003). While the intensity of ICT technologyincreased by an average of 150 percent during the 2000s, the diffusion of ICTtechnology was not equally distributed across all industries. In fact, there was awidening dispersion in ICT-intensity among sectors within the US economy (Mann,2012).
The difference in relative ICT-intensity among industries had varying impacts onemployment. ICT producers, which made up about 3 percent of total employment,continued to add jobs over the 2001-2009 period. Employment in ICT-intensive serviceestablishments grew by 5 percent during this period, adding about 1 million jobs to theUS economy. In contrast, non-ICT intensive services, which accounted for about twothirds of total employment, only grew by 1.5 percent over the same period (Mann, 2012).ICT-intensive manufacturing establishments expanded and contracted with the businesscycle relatively more closely than non-ICT intensive manufacturing. Over the 2001-2009 period, employment in ICT-intensive manufacturing establishments declined by34 percent compared to a decline of 17 percent in non-ICT intensive manufacturingestablishments (Mann, 2012). Although small ICT-intensive services made up just 5 to6 percent of overall employment in the United States, these establishments accountedfor a much higher share of overall net job creation, ranging from 13 percent in 2003 to68 percent in 2008 (Mann, 2012).
12 ICT hardware price declines contributed the most to social surplus. Although software prices did notdecline as quickly, their rate-of-return was greater than hardware. Expenditures on software and ICTservices are also much greater than expenditures on hardware (Mann, 2012).
Intel’s Economic Impacts on the US Economy, 2008 – 2012
24
Case Study: Intel’s Education Collaboration
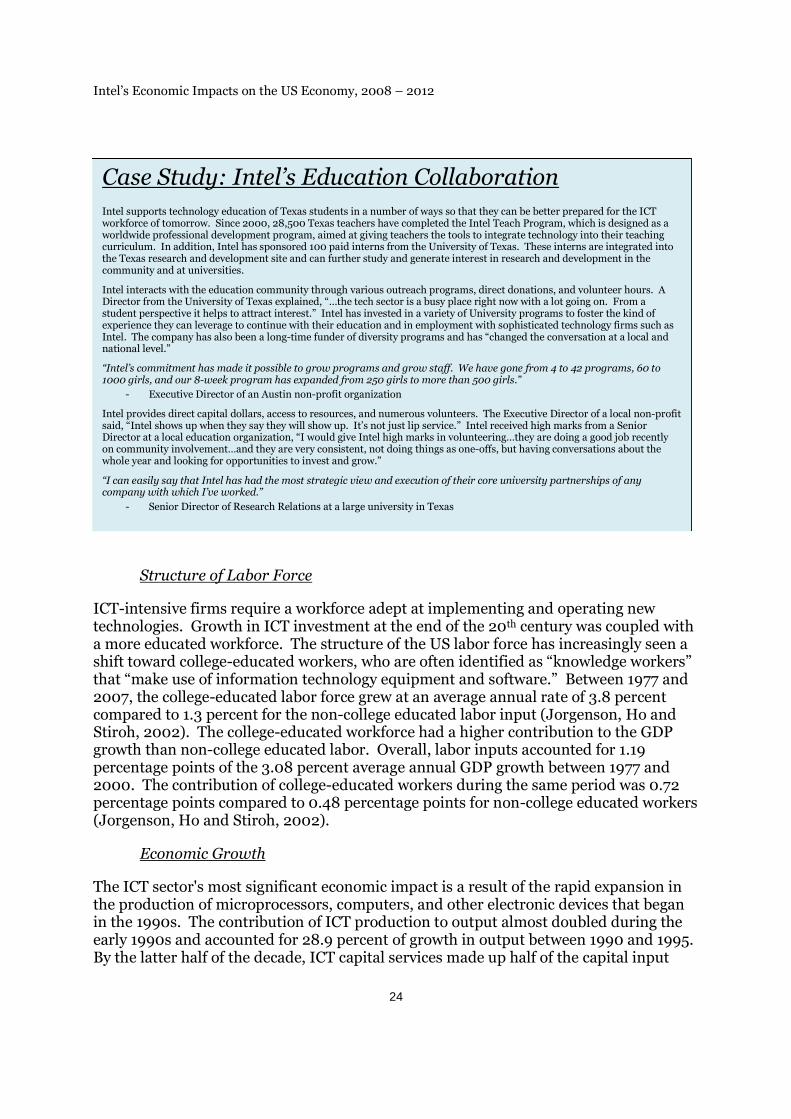
Intel supports technology education of Texas students in a number of ways so that they can be better prepared for the ICTworkforce of tomorrow. Since 2000, 28,500 Texas teachers have completed the Intel Teach Program, which is designed as aworldwide professional development program, aimed at giving teachers the tools to integrate technology into their teachingcurriculum. In addition, Intel has sponsored 100 paid interns from the University of Texas. These interns are integrated intothe Texas research and development site and can further study and generate interest in research and development in thecommunity and at universities.
Intel interacts with the education community through various outreach programs, direct donations, and volunteer hours. ADirector from the University of Texas explained, “…the tech sector is a busy place right now with a lot going on. From astudent perspective it helps to attract interest.” Intel has invested in a variety of University programs to foster the kind ofexperience they can leverage to continue with their education and in employment with sophisticated technology firms such asIntel. The company has also been a long-time funder of diversity programs and has “changed the conversation at a local andnational level.”
“Intel’s commitment has made it possible to grow programs and grow staff. We have gone from 4 to 42 programs, 60 to1000 girls, and our 8-week program has expanded from 250 girls to more than 500 girls.”
- Executive Director of an Austin non-profit organization
Intel provides direct capital dollars, access to resources, and numerous volunteers. The Executive Director of a local non-profitsaid, “Intel shows up when they say they will show up. It’s not just lip service.” Intel received high marks from a SeniorDirector at a local education organization, “I would give Intel high marks in volunteering…they are doing a good job recentlyon community involvement…and they are very consistent, not doing things as one-offs, but having conversations about thewhole year and looking for opportunities to invest and grow.”
“I can easily say that Intel has had the most strategic view and execution of their core university partnerships of anycompany with which I’ve worked.”
- Senior Director of Research Relations at a large university in Texas
Structure of Labor Force
ICT-intensive firms require a workforce adept at implementing and operating newtechnologies. Growth in ICT investment at the end of the 20th century was coupled witha more educated workforce. The structure of the US labor force has increasingly seen ashift toward college-educated workers, who are often identified as “knowledge workers”that “make use of information technology equipment and software.” Between 1977 and2007, the college-educated labor force grew at an average annual rate of 3.8 percentcompared to 1.3 percent for the non-college educated labor input (Jorgenson, Ho andStiroh, 2002). The college-educated workforce had a higher contribution to the GDPgrowth than non-college educated labor. Overall, labor inputs accounted for 1.19percentage points of the 3.08 percent average annual GDP growth between 1977 and2000. The contribution of college-educated workers during the same period was 0.72percentage points compared to 0.48 percentage points for non-college educated workers(Jorgenson, Ho and Stiroh, 2002).
Economic Growth
The ICT sector's most significant economic impact is a result of the rapid expansion inthe production of microprocessors, computers, and other electronic devices that beganin the 1990s. The contribution of ICT production to output almost doubled during theearly 1990s and accounted for 28.9 percent of growth in output between 1990 and 1995.By the latter half of the decade, ICT capital services made up half of the capital input

Intel’s Economic Impacts on the US Economy, 2008 – 2012
25
contribution (Jorgenson, 2001). ICT equipment and software played an important rolein the acceleration of productivity growth over the 1995 to 2003 period (Corrado,Hulton, and Sichel, 2009). Output per hour in the private nonfarm business sector grewat an average annual rate of 2.95 percent between 1995 and 2003 compared to 1.47percent between 1973 and 1995, an increase of 1.48 percentage points. Corrado, Hultonand Sichel found that 0.53 percentage points (or 36 percent) of this increase was due tocapital deepening in the form of ICT equipment and software. Another 0.85 percentagepoints was accounted for by growth in total factor productivity, with the remainderaccounted for by changes in the composition of labor.13 As discussed below, thecomputer and electronics manufacturing sector plays an important role in the TFPgrowth. In fact, between 1995 and 2000, this industry accounted for more than 60% ofthe TFP growth in the private nonfarm business sector.14
Beginning in the 1990s, ICT hardware laid the groundwork for increased economicproductivity and economic growth. According to the Bureau of Labor Statistics,between 1987 and 2011 the computer and electronics manufacturing industrycontributed 50 percent of private nonfarm business TFP growth (0.46 percentage pointsout of the 0.92 percentage point average annual TFP growth). Over the same period,output per hour for all private non-farm businesses grew at an average annual rate of2.2 percent. In other words, computer and electronics manufacturing accounted forapproximately 21 percent of the increase in output per worker over this period.15
Productivity gains related to a rapid price decline of ICT hardware resulted inapproximately $230 billion of additional GDP growth between 1995 and 2002 (Mann,2003). The direct and indirect gains in economic growth related to lower ICT prices andincreased ICT-intensity amounted to an economic gain between $810 billion and $935billion from the 2002-2007 period. After including ICT-services (such as computerdesign), the overall gain is closer to $1 trillion given the broad use of ICT hardware,software, and services across all industries in the US economy (Mann, 2012). Lower ICTprices supported additional investment in ICT capital which translated into productivitygrowth and higher growth in GDP (Mann, 2003).
Spillover Effects
Geographical proximity to pools of ICT investment results in positive "spillover" effects.Recent research looked at 4-digit SIC level industries within the Northern Californiaregion (a highly ICT-intensive region) compared to other regions. Firms with easyaccess to ICT capital had more flexibility in production. The increased specialization oftechnology firms within close proximity of each other allows non-ICT establishments totake advantage of their resources to ramp up or slow down production with more ease.For example, the output elasticity of ICT investment (i.e., the change in production withrespect to a change in ICT investment) for non-durable goods manufactured in
13 See Table 6 in Corrado, Hulton and Sichel, 2009.14 US Bureau of Labor Statistics, “Contributions of Manufacturing Industries to Private Nonfarm BusinessMultifactor Productivity,” June 19, 2013.15 PwC calculations based on data from US Bureau of Labor Statistics, “Contributions of ManufacturingIndustries to Private Nonfarm Business Multifactor Productivity,” June 19, 2013 and “MultifactorProductivity Trends – 2011,” April 9, 2013.

Intel’s Economic Impacts on the US Economy, 2008 – 2012
26
Northern California was 5 percent higher than firms in the same industry outside theregion (Tambe and Hitt, 2010). Firms with relatively more access to outside sources ofICT investment were better equipped to utilize new production methods and practices.The relatively higher elasticity in supply also suggests that firms with access to otherhighly ICT-intensive firms are more flexible in response to market changes.
Conclusion
The ICT sector boosts productivity through various channels. The rapid decline in ICThardware prices between 1995 and 2002 contributed to $230 billion in GDP growth.The combination of ICT hardware and services contributed to an additional $1 trillion inGDP growth between 2002 and 2007. The total contribution of the ICT industry tooverall economic growth over the 1995-2007 period was approximately $1.3 trillion(Mann, 2003 and Mann, 2012). Investment in ICT capital was coupled with a highly-educated workforce. As a result of the change in the structure of labor force, the realgrowth rate in labor productivity during the 2000s was 10 to 20 percent higher relativeto its baseline from 1995 to 2003 (Corrado, Hulten and Sichel, 2009). Spillover effectsrelated to the proximity of other ICT-intensive firms are associated with higher outputper given amount of capital input.
Intel’s Contribution to US Economic Growth
Intel operates in the larger ICT sector by designing and manufacturing microprocessors,motherboard chipsets, integrated circuits, and other similar products. Microprocessorsrepresent the largest segment of Intel’s business, accounting for an estimated 76 percentof the company’s revenue in 2012. Intel is the world’s largest supplier ofsemiconductors in terms of sales, with a global market share of approximately 15.7percent.16 The microprocessors that Intel produces are components of computers andmany other commonly used electronic devices. As electronic devices become moreefficient (e.g., increased computing power, higher-resolution graphics, etc.), so does theproductivity of the households and firms that use them.
As with the ICT sector as a whole, Intel’s products and services contribute to economicgrowth both through their impact on total factor productivity and through theircontribution to capital deepening.
Total factor productivity. According to the US Bureau of Labor Statistics, thegrowth in total factor productivity (also called “multifactor productivity”) accountedfor 0.4 percentage points of the 1.9 percent annual average increase in the privatenonfarm business sector’s real output over the most recent five-year period for whichdata are available (2007 to 2011). The remaining 1.5 percentage points are due to thecombined contribution of capital and labor.17 BLS data show that the Computer and
16 IHS iSuppli Research, December 2012.17 BLS, Multifactor Productivity Trends - 2011, Table B (http://www.bls.gov/mfp/mprdload.htm).Weighting is necessary in order for the individual factor growth rates to sum to the overall growth ofprivate nonfarm business sector output.

Intel’s Economic Impacts on the US Economy, 2008 – 2012
27
Electronics Manufacturing sector (NAICS 334) accounted for half of the TFP growthin the private nonfarm business sector between 2007 and 2011.18 Given that Intel’soutput accounted for approximately 8.5 percent of output in the Computer andElectronics Manufacturing sector during this period, we estimate that Intel’scontribution to nonfarm private business TFP growth averaged 4.2 percent (8.5percent of 50 percent). Thus, through the TFP impact, Intel’s products and servicescontributed 0.02 percentage points to the private nonfarm business sector’s realGDP growth over the 2007 to 2011 period (4.2 percent of 0.4 percent). Thisamounts to $9.0 billion of real GDP between 2007 and 2011 (measured in 2005dollars), or $10.2 billion nominal GDP (measured in current dollars). In otherwords, Intel’s products and services contributed an average of $2.o billion ofnominal GDP per year in this 5-year period due to its impact on total factorproductivity.
Capital deepening. Intel also contributes to GDP growth through increasedinvestment in information processing capital by other sectors of the economy (i.e.,capital deepening). Capital services contributed 1.1 percentage points out of the 1.9percentage increase in the private nonfarm business sector’s real GDP between 2007and 2011. Using data from the US Bureau of Labor Statistics, we estimate thatcomputers and related equipment accounted for approximately one-half of onepercentage point of the increase in the private nonfarm business sector’s real GDPbetween 2007 and 2011 (or $51.4 billion).19 Intel's global market share ofmicroprocessors was 80 percent in 2011.20 Assuming that roughly 80 percent ofcomputers in the United States use an Intel microprocessor, we estimate that Intel'scontribution to real GDP growth through capital deepening was $41.1 billion overthe 2007 and 2011 period (measured in 2005 dollars), or $44.6 billion in nominalGDP (measured in current dollars).21 In other words, Intel’s products and servicescontributed to an average of $8.9 billion of nominal GDP per year through capitaldeepening in this 5-year period.
18 Bureau of Labor Statistics, Multifactor Productivity Trends in Manufacturing, 2011. The contributionof the computers and electronics manufacturing sector to TFP was 0.22 during the period of 2007-2011.The contribution of private nonfarm business to TFP was 0.44 for the same period. The computers andelectronics manufacturing sector therefore contributed half of private nonfarm business TFP growth.19 BLS, Multifactor Productivity Trends- 2011, Table 5. Various asset shares can be found in the MFPcomprehensive tables, "Capital and Information Capital Measure by Asset Type,"http://bls.gov/mfp/mprdload.htm20 Statista, Microprocessor Market Share Worldwide 2009-2011.21 This analysis implicitly assigns all of the value of a personal computer with an Intel chip to Intel andexcludes the value of Intel’s chips used in other types of communications and electronic equipment.

Intel’s Economic Impacts on the US Economy, 2008 – 2012
28
As shown in Table 9,22 the contribution to GDP of Intel's products and services throughtotal factor productivity growth and capital deepening over the 2007-2011 period wasestimated to be $54.8 billion in nominal terms, or approximately $11.0 billion per year.
Table 9 – Contribution of Intel's Products and Services to US EconomicGrowth, 2007-2011
22 BLS, Multifactor Productivity Trends – 2011, Statista, and PwC Calculations. GDP price deflatorsconverting real to nominal growth are from Appendix B of the 2013 Economic Report of the President.
$10.2 billion
$44.6 billion
Contribution to TFP
Contribution due to CapitalDeepening
Total Contribution = $54.8 billion
Source: PwC calculations based on data from IMPLAN and the Bureau of Labor Statistics.

Intel’s Economic Impacts on the US Economy, 2008 – 2012
29
VI: Case Studies
In addition to the significant economic impact generated from operations and capitalinvestments at locations with large Intel manufacturing facilities in Oregon, Arizona andNew Mexico, there are other impacts related to job creation and talent growth,innovation, industry leadership, supplier benefits and clustering impacts. Toqualitatively assess Intel’s impacts on the US national and local economies, PwC andIntel jointly identified three themes that would be the focus of three field-level casestudies of Intel’s operations and investments in the United States.23
In creating the case studies PwC utilized the following approach:
First, PwC created a strategy and plan to assess Intel’s impact. We incorporatedexisting known information supplemented with research and a structuredstakeholder analysis that leveraged input and guidance from internal Intelsources, suppliers, consumers, laborers, colleges, community programs, andgovernmental policy makers.
Next, PwC focused its efforts on conducting face-to-face interviews with keystakeholders as they were identified within both the direct value chain andindirect channels using structured interviews. While the interviewing teamfollowed scripted questions, in order to obtain rich qualitative insights from therespondents, the team pursued additional lines of questioning and themes wheninteresting issues arose as part of the conversation.
Finally, upon completion of research, interviews, and analysis, the PwC teamdeveloped a comprehensive economic overview which is outlined herein.
Quotes from some of these respondents are included in the highlights below.
1. Research and Development (“R&D”) – In 2012 Intel’s global R&D spendingwas $10.1 billion, with a five-year R&D spend of over $36.5 billion. US-basedR&D spending accounted for the majority of the total global spend in 2012. In a2013 survey conducted by Booz & Co, Intel was the number one R&D spenderamong publicly traded US companies in all sectors. Interview respondents calledIntel’s R&D efforts in the United States “rich with innovation” and “industry-leading,” pointing to years of being on the “leading-edge of development” and“bringing forward technology that matters.”
2. Supply Chain Ecosystem – Intel maintains and interacts with a vast supplychain as both a consumer and a supplier. With $11B in global capitalexpenditures (about 80% in the US) and $53.3 billion in global sales, thecompany operates in the middle of a supply chain that is continuously improvingthe usability and interactivity of technology. Interview respondents described
23 For the purposes of the Case Studies, Intel refers to Intel Corporation, excluding McAfee and WindRiver subsidiaries.

Intel’s Economic Impacts on the US Economy, 2008 – 2012
30
Intel’s effects on its Oregon supply chain as “the most important economic factorin Oregon” and that Intel “makes a difference and is stable in our economy.”Furthermore industry veterans touted Intel as a company that “kept themanufacturing and expertise in this country [US]” and noted that “without Intel,the semiconductor industry would be considerably less US-centric and furtherbehind.”
3. Venture Capital – Since its inception in 1991, Intel Capital has invested morethan $10.8 billion in over 1,276 companies in 54 countries. Intel Capital’sinvestment in the US Technology industry has been evident with $6.7 billion, or62% of its total capital investment going to US-based companies. Furthermore,Intel Capital’s focus on company building has resulted in over 500 acquisitions,mergers, and IPOs. Intel Capital’s contribution to the US economy and businessenvironment goes beyond capital investment. As industry experts and executivesof former portfolio companies stated, Intel Capital is “among the best in knowingthe industry” and their “stamp of approval is hard to match.” Intel Capital’sadvantages are described as “longevity, experience, size, consistency, andfinancial returns were among the best, if not the best of any unit.” Portfoliocompanies benefit from investments and interactions that “helped us to span outgeographically and grow the sales team.”
The following pages describe the results of the individual Case Studies.

Intel’s Economic Impacts on the US Economy, 2008 – 2012
31
Case Study 1: Research and DevelopmentInnovations and Technology Advancements with Local,State, National and Global Implications
Globally, Intel spent $10.1 billion on research and development (“R&D”) in 2012, themajority of which is staffed and occurs within the United States. Intel’s R&D initiativesare constantly expanding the technology market and creating opportunity forimprovements in efficiency, data analysis, and user-experience. Major research anddevelopment hubs for Intel are spread across the United States including: Oregon,Texas, Pennsylvania, Wisconsin, South Carolina, New Hampshire, Washington,California, and Colorado. Each of these sites is designed to stay closely connected to itstechnology ecosystem and each site contributes to the research and developmentcapabilities of Intel nationally.
Exhibit 1.1: Intel’s Worldwide Research and Development Spend (2008-2012)
Intel’s R&D initiatives have delivered a number of major technology advancementsincluding, to name a few: low-power architectures; virtualization technologies; and,teraflops research processors. Intel is consistently an early adopter of innovativetechnology, which can be seen through Intel’s equipment purchasing. An internal Intelmanufacturing equipment buyer stated, “We see a 1 to 3 year gap between the first smallwave of equipment buyers, mainly Intel, and the second large wave of equipmentbuyers…the gap is mainly a function of Intel’s technology growing faster than thecompetition.”
0
1
2
3
4
5
6
7
8
9
10
11
2008 2009 2010 2011 2012
5.7 5.7
6.6
8.4
10.1
US
Din
Billi
on
s
R&D Spend by Year

Intel’s Economic Impacts on the US Economy, 2008 – 2012
32
Below are two examples of Intel’s R&D contributions, impact and leadership.
Intel recently built a development fabrication facility in Oregon that opened in 2013 andis building a leading-edge technology, large-scale fabrication facility in Arizona. R&Dspending increased in 2012 by 22 percent over 2011, driven by increasing investments insmartphones, tablets, Ultrabook systems, and data centers. Furthermore, R&Dspending increased with annual wage increases, higher process development costs forIntel’s next-generation 14 nano-meter process technology, and higher costs related todeveloping the 450 millimeter wafer technology.
Examples of Intel Impacts by Particular R&D CenterGeographic Locations
Intel’s Arizona operations are spread across two large sites in the City of Chandler.Roughly half of Intel’s 11,000 employee base in the state works at the 700-acre Ocotillocampus which is dedicated to manufacturing the company’s latest silicon technology.The remaining employees are located at Intel’s 150-acre Chandler campus where asubstantial portion of employees are dedicated to research and development. In fact,Intel has invested more than $300 million to build a new research and developmentfacility at this site. The facility, which is nearing completion, will be used to expandIntel’s packaging operations. The innovation that will occur in this facility is aimed atinfluencing technology trends for years to come. This investment is creating severalhundred Intel R&D-related jobs and nearly a thousand construction jobs. Intel’sArizona employees, on average, earn over $130,000 per year (including totalcompensation, benefits and bonuses).
Intel’s Massachusetts Design Center in Hudson, Massachusetts is home to morethan 825 engineers engaged in microprocessor design, testing and validation for thedevelopment of next generation multi-core Itanium® and Xeon® microprocessors forhigh-end servers. Lab facilities, technical staff, and engineers work directly withproduct design teams on first silicon readiness to support the introduction of new highperformance products before they are released for high volume manufacturing. Labsare staffed by a cross-functional team of content developers, debug engineers, softwareengineers, technicians and inventory control specialists, working closely with design andvalidation engineering working on first silicon to volume validation to deliverproduction ready quality products.
In Intel’s New Hampshire R&D and production facility, a group of 60 Intel researchand development employees researches methods to make it easier to perform parallelprogramming on Intel processing cores while maximizing application performance.Parallel programming by definition is aimed at compartmentalizing complex problemsinto smaller, more manageable problems and computing solutions simultaneously. Thesite manager of the New Hampshire Intel facility described the importance of the workbeing performed as, “enabling the technology created by Intel, meaning, without them,the development community would not be able to “unlock” the potential andperformance of the newer multi-core processors developed at Intel.” The programming

Intel’s Economic Impacts on the US Economy, 2008 – 2012
33
language, prototypes and tools developed here allow end-users of Intel’s silicon to betterunderstand and utilize the capabilities of the products. Intel’s R&D in New Hampshirefocuses on faster computing, higher efficiency, and ease of technology use for moreapplications.
In Intel’s Columbia, South Carolina facility, approximately 310 Intel engineers testIntel’s products to verify the already-designed product’s features work as advertised andmeet stated specifications. It is considered the “last step” before the completed piece ofresearch and development becomes commercialized. The site manager of the SouthCarolina design center stated, “All of our validation activities have successfully yieldedcommercialized products in the XeonTM and CoreTM product lines; for example, XeonTM
E5 is a recent product predominantly supporting Cloud and Data Center programsvalidated at the South Carolina facility and the highly successful 4th Generation CoreTM
graphics system was also validated here.” When asked about the effects of the researchand development site on the local economy, the site manager responded, “Salaries forthis site are notably higher than the comparative geography and our employees enjoy agenerally higher standard of living…The South Carolina Commerce Secretary’s officetells us our gross salary of $26 million has a compounded effect of nearly three times[$76 million] on the local economy.”
In Intel’s Eau Claire, Wisconsin lab, a group of 60 Intel employees are defining,designing, validating, and testing components into which fabric connects. Fabric ishigh-speed interface that connects elements of a computing system and a keytechnology for supercomputing. Fiber cables act like the network connection on acomputer, allowing the user to send and receive data. Data transfers through fiber 25billion times per second, allowing for faster sending and receiving of information thanever before. Fiber cables play a key role in high performance computing, whichimproves our economy, safety, and fundamental knowledge. This technology helps oilcompanies reduce wasted effort by accurately identifying and locating oil reserves,improves the accuracy of weather predictions allowing for accelerated warning systems,and allows for intricate simulations of real-world catastrophes to predict impact andprovide planning tools for disaster relief efforts. The Wisconsin team has grown by 20percent in the past year and is expected to continue on its growth trajectory.
In Fort Collins, Colorado, approximately 425 Intel employees design data centerapplications and solutions including the XeonTM and ItaniumTM architectures. The FortCollins R&D center is responsible for the architecture, design, and development of high-performance server microprocessor for server and workstation applications. The sitecollaborates with universities by participating in programs to grow awareness of andsupport professorships in Science, Technology, Engineering and Mathematics (“STEM”)careers. In addition, the site participates on external boards and conference committeesto support women and minorities in STEM. The design center also impacts itscommunity through environmental initiatives such as recycling (68,000 lbs. in 2011),reducing onsite energy and gas consumption (by an amount that is equivalent to theannual energy and gas consumption by 250 average American households), andimproving the eco-friendly options for worker transportation by implementing andincentivizing a “bike to work” program. This group also is noteworthy because it

Intel’s Economic Impacts on the US Economy, 2008 – 2012
34
benefits its community through direct community giving. Intel Fort Collins is Intel’snumber one United Way contributor in the nation by average gift size per donor at$3,500.
Intel R&D: Case Study Interview Results
Intel’s research and development efforts contribute to the US economy in significantways:
Job Creation – The research and development arm of Intel Corporation ishome to high-paying and innovative employment opportunities. These jobs andpositions not only provide internal job growth, but also external job growththrough individual start-up companies, service and support positions for theimproved technology, and local small businesses through employee dollars spent.
Innovation – Intel’s research and development and further commercializationinto viable products enables large technology companies to improve upon currentperformance, increase user experience, and deliver value to the economy. Intelresearch plays a critical role in setting the path for the technology market.
Industry Leadership – Intel is leading current technological innovations.According to semiconductor industry experts, “Without Intel’s contributions, theUS semiconductor industry and the US technology industry in parallel would notbe the leader it is today.”
Education Collaboration – Intel works with numerous education programsfrom grade-school all the way to post-graduate and Doctoral programs. Theseprograms help to highlight the positive aspects of STEM careers and build thepipeline for a healthy middle-upper class of graduates.
Community Impact – Intel’s volunteerism, community engagement, andcontinuously giving nature impact the local communities in which it operates.These programs coupled with the small business support by the employees ofIntel, are the building blocks for a strong local community.
Each of these topics is covered in greater detail below. Intel selected its Austin, Texasdesign center to measure the individualized effects of an Intel research and developmentsite on the local community and economy.
Job Creation
Many industry experts maintain that Austin, Texas is in many ways considered a“miniature-Silicon Valley” often referred to as “Silicon Hills,” with presence from manylarge technology companies including, Dell, IBM, National Instruments, and Samsung.Intel is a significant employer in Austin with approximately 1,300 high-paying jobs in itsR&D Center.

Intel’s Economic Impacts on the US Economy, 2008 – 2012
35
Texas is the second largest state by population at over 26 million in 2012.24 Texasmaintains 29,380 tech establishments, employing 485,636 individuals in 2012. Techemployees in Texas average $92,200 in annual salaries, 85 percent higher than theaverage private sector wages of $49,800.25
“I can say with absolute certainty that Intel has made it possible for us to expand ourimpact and hire more people to expand our programs.”
- Executive Director of an Austin non-profit organization
Intel is a crucial contributor to bringing high-paying tech jobs to the Austin area.According to an executive member of the Austin Chamber of Commerce, “For the last 10years our chamber has worked to revitalize the economy. A lot of effort has been aboutbringing in a diverse set of jobs…” In the past 18 months, Intel has bought property,consolidated operations, and had a successful round of hiring. These diverse jobs canserve to improve the economy by raising standards of living, keeping the job marketviable for high-talent graduates coming out of universities like the University of Texas –Austin and Texas State, and drawing additional talent to the region.
“They [Intel] hire a bunch of people and their kids get to go to good schools…providingthat quality of life and quality of job creates Intel’s ripple effect… [that] can be seen insouthwest Austin”
- Executive Director of an Austin non-profit organization
“Intel is a significant provider of jobs to the region.”
- Senior Director of an Austin workforce development program
Innovation
Intel works with its end-customers to collaboratively develop projects, software, andsolutions that will create and enable the technology of tomorrow. Intel is involved on aneveryday basis with representatives from some of the largest technology manufacturersto define the technology roadmap in a collaborative and open environment. Thiscollaboration and innovation between component and product manufacturers increasesbenefit and value to joint customers. The relationship between Intel and its customersis described by Intel as “…one of the most multifaceted relationships in the industry.We collaborate on products as well as software and solutions.”
“Our company and Intel have been partners for over 30 years. One of the things thatreally pulled us together was the rich DNA of innovation running through both of ourcompanies. We have a similar set of values: Try to do our very best for our customersevery day by bringing forward technology that matters.”
- VP and GM of US Commercial Sales for a significant Intel client
24 http://www.dshs.state.tx.us/chs/popdat/st2012.shtm25 CyberStates Report 2012.

Intel’s Economic Impacts on the US Economy, 2008 – 2012
36
Intel is responsible for unlocking the potential power, performance and othercapabilities in the industry-leading technology that is being developed in Intel labsaround the country. This means developing programming language, testing capabilities,and creating innovative software to interact with the technological advancements thatare driving the industry forward. A design center site manager at Intel said that “ourcompilers and tools…unlock the potential of our newer, multi-core processors.”
“Intel is great at executing on new technology…they lead the industry in introducingnew technology and also independently go and coordinate the technology developmentand the architectural development so that they can deliver a new architecture andtechnology every year.”
- 35-year semiconductor sector veteran
Intel is responsible for some of the most useful technological research and developmentadvances. Intel has pioneered research on technological power consumption,computing ability, and size of application, to name a few. Intel’s Austin, Texas researchand development center is working on a number of innovative products including,perhaps most significantly, AtomTM processors. The AtomTM processor is a newdisruptive technology enabling a wide spectrum of products including netbooks, entry-level desktops, tablets, smartphones, consumer electronics devices, and othercompanion devices. Atom processors are ultra-low-power and are improving theuptime of the useful technology that individual users interact with on a daily basis. In arecent comparison, a Windows 8 tablet with Intel AtomTM processor showed the lowest2-year cost of ownership and the highest battery-life when compared to the Apple iPad,Android tablet and Windows RT tablet.26
Industry Leadership
Intel is described as having a position of “…leadership, ahead of all their competition…”by a 35-year semiconductor veteran. Intel has been a leader and driver in the marketsince its inception. Intel is responsible for continuous improvements in efficiency,speed, computing power, and user experience. Intel communicates its strategic vision tothe technology community, and strives to grow the base of future employees througheducational support programs such as the Semiconductor Research Corporation andother educational collaboration described below.
“Intel’s strategic view and coordinated actions have helped keep the United States atthe leading edge of development. Intel has helped guide the long-term direction ofresearch down to the University level so that it and other companies can leveragethose fundamentals 10-15 years in the future.”
- 35-year semiconductor sector veteran
Intel is driving the market forward both at the national level and in local jurisdictionslike Austin. With programs aimed at solving complex problems and performing,innovative research at collaborative institutes including Stampede at the University of
26 http://www.principledtechnologies.com/Intel/Atom_tablet_TCO_0313.pdf

Intel’s Economic Impacts on the US Economy, 2008 – 2012
37
Texas, Intel continues to lead the industry from an R&D strategic perspective. Intel’sR&D initiatives are continually assessing the strategic computing and technologyroadmap to address everyday problems and engineer productive solutions. As theSenior VP for Research and Reports at a nationwide technology advocacy groupcommented, “Intel has been very active in education and encouraging STEM fields.These are long-term views that allow Intel to create industry clusters to support theirgoals.”
“Without Intel, the semiconductor industry would be considerably less US-centric andfurther behind. If it weren’t for Intel, the US wouldn’t have nearly the influence andpresence it has in the semiconductor industry today. When companies were movingoverseas in the 1980s and 1990s, Intel kept the manufacturing and expertise in thiscountry and we are still the leaders worldwide.”
- 35-year semiconductor sector veteran
Education Collaboration
Intel understands that without acceptable candidates to fill positions, technologybusinesses cannot grow, innovate, and sustain themselves. The research anddevelopment of tomorrow will be performed and formulated by the young men andwomen of today. Since 2000, 28,500 Texas teachers have completed the Intel TeachProgram. To facilitate the development of the next generation of technologyprofessionals, Intel developed the Intel Teach Program which is designed as a worldwideprofessional development program, aimed at giving teachers the tools to integratetechnology into their teaching curriculum. In addition, Intel currently staffs 100 paidinterns from the University of Texas. These interns are integrated into the Texasresearch and development site and can further study and generate interest in researchand development in the community and at the universities.
Intel is dedicated to the education community through various outreach programs,direct donations, and volunteer hours. A Director from the University of Texasexplained, “…the tech sector is a busy place right now with a lot going on. From astudent perspective it helps to attract interest.” Intel has invested in a variety ofuniversity programs to foster the kind of experience students can leverage to continuetheir education and find employment with sophisticated technology firms such as Intel.The company has also been a long-time funder of diversity programs and has “changedthe conversation at a local and national level.”
“Intel’s commitment has made it possible to grow programs and grow staff. We havegone from 4 to 42 programs, 60 to 1000 girls, and our 8 week program has expandedfrom 250 girls to more than 500 girls.”
- Executive Director of an Austin non-profit organization
Intel provides direct capital dollars, access to resources, and numerous volunteers toassist in these educational efforts. The Executive Director of a local non-profit said,“Intel shows up when they say they will show up. It’s not just lip service.” Intel received
Intel’s Economic Impacts on the US Economy, 2008 – 2012
38
high marks from a Senior Director at a local education organization, “I would give Intelhigh marks in volunteering…they are doing a good job recently on communityinvolvement…and they are very consistent, not doing things as one-offs, but havingconversations about the whole year and looking for opportunities to invest and grow.”
TACC & STAMPEDE
The Texas Advanced Computing Center (“TACC”) supports cutting-edge researchin nearly every field of science. TACC’s mission is to enable discoveries that improvescience and society through the application of advanced computing technologies. TACCis comprised of 110 staff and students and operates some of the most powerfulsupercomputers and visualization systems in the world. Supercomputing is a critical andrelatively new element of scientific discovery, allowing scientists to explore andhypothesize around “phenomenon that are too big, small, fast, or dangerous toinvestigate in the laboratory.”27 Scientists use the computing resources at TACC tocreate forecasts, run complex scenario analyses, develop innovative solutions to age-oldquestions, and perform other critical research.
Intel is a member of TACC’s Science and Technology Affiliates for Research (“STAR”)program. The mission of this program is to promote a mutually beneficial exchangebetween industry and academia in advanced computing techniques and technologies,and at the same time foster a framework for technology innovation and supporteconomic development in the state of Texas and across the nation. Furthermore, Intelcollaborated with Dell and TACC to develop Stampede, one of the most advancedscientific research instruments in the world. With more than 500,000 Intel Xeon PhiTM
coprocessors, Stampede was listed as the 7th most powerful advanced computing systemon the planet and the most powerful in the United States dedicated to academicresearch.28 It took TACC approximately a year to design, build, and deploy theStampede supercomputer working closely with Intel and Dell engineers and universityresearchers. The project was awarded $50 million in funding by the National ScienceFoundation over a four year period with the option to renew in 2017, enabling four moreyears of open science research.
“Stampede is an important part of NSF’s portfolio for advanced computinginfrastructure enabling cutting-edge foundational research for computational anddata-intensive science and engineering. Society’s ability to address today’s globalchallenges depends on advancing cyberinfrastructure.”
- Farnam Jahanian, Head of NSF’s Directorate for Computer and InformationScience and Engineering29
Supercomputers like Stampede are important for a number of reasons: they allowscientists to conduct research that would otherwise be impossible to observe; theyincrease the speed and efficiency of research and development, allowing questions to be
27 http://www.tacc.utexas.edu/about/28 http://www.top500.org/blog/lists/2012/11/press-release/29 http://www.tacc.utexas.edu/stampede/

Intel’s Economic Impacts on the US Economy, 2008 – 2012
39
answered faster than with previous technology; and, they allow for simulation,visualization, and intelligent data storage to grow knowledge stores and improveunderstandings of everyday and complex events. Over the course of Stampede’slifetime, it is estimated that it will provide the equivalent of more than 400,000 years ofcomputing to tens of thousands of scientists.30 Intel’s contribution to the project goesbeyond the Xeon PhiTM coprocessors. Intel works with scientists in various fields toadapt simulation packages to run efficiently on the coprocessors, enabling faster andmore complex research to be performed.
Stampede is an example of Intel technology leading the industry and improving on thecomputing capabilities of the United States and local economies. This leadership drivesjob growth, economic development, talent clustering, and national research comparativeadvantages.
Community Impact
Intel understands the importance of being involved in the local community and investsin the community in a number of ways including through direct employee volunteersboth in the community and at local science and technology festivals, and providingresources for local events and initiatives.
Intel assists the community in developing a skilled workforce through support of localorganizations that train the adult workforce. One Texas program, which Intel directlysupports through volunteering and direct donations, trains 400 people every 6-8 weeksfor a skilled trade and 500 people per year on computer programming, technology, andmaintenance. Intel is involved heavily in the local Austin Science and EngineeringFestival, contributing $25,000 annually and encompassing 10,000 students andvolunteers. “The festival is focused on training the workforce of tomorrow,” said a long-time executive-director of the festival. “Intel is definitely the most involved of the techfirms.”
“Intel attracts more companies to the region. Their design center attracts others.”
- Senior Director of an Austin workforce development program
30 http://www.tacc.utexas.edu/news/feature-stories/2013/texas-unleashes-stampede

Intel’s Economic Impacts on the US Economy, 2008 – 2012
40
Case Study 2: Supply Chain EcosystemFostering High Quality US-Based Supply through DomesticOperations
Intel is the world’s largest semiconductor-chip maker by revenue and requires a vastsupply chain of upstream suppliers to fill its specialized requirements from rawmaterials and other fabrication inputs, to manufacturing equipment, to constructionequipment and services, to fabrication-site labor. Its presence in the United States hascontinued to provide the country with a global-leader position in PC microprocessors.Intel also serves a key supply chain role looking downstream as a supplier not only to itsdirect customers but also for its impact on other related parties, enterprise andconsumer, who use or integrate Intel’s products. Consideration of Intel’s entire supplychain – both upstream and downstream – shows that the company has a substantialimpact on the US economy.
Upstream Impacts
For example, Intel’s advancements in technology, position in the market, and qualitybrand name draw suppliers close to its US fabrication sites and can pave the way foradditional foreign direct investments into the United States. In fact, many of Intel’sglobal suppliers have set up distribution, sales, and supply companies in the UnitedStates in order to be closer to Intel and better integrate into Intel’s supply chain.
“We see suppliers opening applications labs and supply bases within a mile or two ofour campus. Japan-based companies and European-based companies have openedsites near our Oregon and Arizona campuses to get in front of our people and to workclosely with Intel.”
- Intel Executive who works directly with suppliers
Downstream Impacts
Intel’s role in the US economy does not stop with a high-quality technology supply base.Intel plays an integral part in supplying and enabling the original equipmentmanufacturers (“OEMs”), such as Hewlett-Packard (“HP”), Dell, and Lenovo, to changethe ways end-users interact with and apply technology to their everyday lives. Intelsupplies its customers with quality products, a brand-name relationship, and strategicguidance that can help to expand its customers’ client bases.
“We worked together with Intel on a very large, global target that was not currentlyour account. In our partnership we convinced the account to move to our companyacross desktops, notebooks, and workstations. The client relationship was successfuland renewed with another three-year contract, and one of the main reasons theaccount cited for wanting to do business with us was because of the collaborativerelationship we had with Intel.”
- VP and GM of US Commercial Sales for a significant Intel client

Intel’s Economic Impacts on the US Economy, 2008 – 2012
41
Impact in the United States
Intel is the fifth largest capital investor in the United States and number one amongmanufacturers.31 From an expense standpoint and its impact on the supply chain, Intelspent $11.0 billion on capital expenditures worldwide in 2012.32 This amount is largelydriven by Intel’s manufacturing and new expansion, approximately 75 percent of whichis housed in the United States. In addition, 42 percent of global supply chain spendingis sourced from companies located in the United States. In 2012, Intel had operationalexpenditures of almost $2 billion in support of the Oregon site, approximately 90percent coming from more than 2,000 US-based suppliers from 46 different states.33
Although more than three-fourths of Intel’s $53.3 billion in 2012 sales revenue wasgenerated outside the United States, the majority of the company’s microprocessormanufacturing occurs in the United States at the Arizona, Oregon, New Mexico, andother sites.
Exhibit 1.2: Intel Supply Chain
From a standpoint of resources employed in the United States, in 2012, IntelCorporation had 49,721 employees within the United States, 5.7 times more than anyother country in which Intel operates. This number understates Intel Corporation’s
31 Diana G. Carew and Michael Mandel, “U.S. Investment Heroes of 2013: The Companies Betting onAmerica’s Future,” Progressive Policy Institute, September 2013.32 Intel 2012 Annual Report – Intel Corporation only (i.e., excludes McAfee and Wind River subsidiaries).33 Intel Personnel.
Upstream Downstream
Raw Material
Suppliers
Manufacturing
Equip. Suppliers
Const. Equip. and
Service Suppliers
Direct Fabrication
Labor
Intel FabSite
Original Equip.
Manufacturer
Original Design
Manufacturer
Other End-Users
Secondary Supply Chain
EntertainmentHotels
Restaurants
Rental CarsAirport Business
Infrastructure
PhilanthropiesEducation
Public Programs

Intel’s Economic Impacts on the US Economy, 2008 – 2012
42
total employment since it does not take into account contract employees, interns, andemployees of subsidiaries. Intel Corporation’s five largest US sites by 2012 headcountwere: Oregon (16,381); Arizona (11,913); Folsom, California (6,209); Santa Clara,California (5,876); and, New Mexico (3,335).34
Intel is a recognized leader in the technology supply chain winning multiple awards andranking highly among the largest companies in the world. For example, Intel rankedseventh on Gartner’s 2012 Supply Chain Top 25 list for excellence in supply chainmanagement. This is also demonstrated in its supplier assistance initiatives, suppliercollaborations, and efforts around environmental sustainability and “conflict material”avoidance.
Supplier Assistance Initiatives
Intel provides its suppliers with a number of beneficial initiatives. These programs notonly have a positive impact on the suppliers that they directly affect, but they alsocontribute to a quality and sustainable US semiconductor and technology supplierecosystem. Suppliers receive tangible and intangible benefits from working with Intelincluding: direct sales; access to Intel equipment, engineers and any shared productroadmaps and technology plans; and the market perception of being a quality leadergiven Intel’s selection of the company as a supplier.
Intel holds “Supplier Days” in which suppliers come together to discuss, learn, andparticipate in working sessions. In addition, Intel assists its suppliers with health andsafety training. Suppliers often reach out to Intel and Intel proactively seeks outopportunities to assist their suppliers. Intel performs a Supplier Quality HealthAssessment in which Intel performs a 3-4 day intensive program to assess 20 keyperformance indicators. Intel provides the supplier with a report outlining the findingsof the assessment and strategically consults with the supplier on ways to improveweaknesses. Recently, after Japan’s major 2011 earthquake and tsunami, some of Intel’sJapanese suppliers noted that they were better prepared for that event because of Intel’svision and focus on risk management and supply chain resiliency.
34 Intel CSR Report 2012.

Intel’s Economic Impacts on the US Economy, 2008 – 2012
43
Exhibit 1.3: Intel Supplier Imperatives
Designed to award and publicly recognize Intel suppliers for meeting cost, quality,availability, delivery, technology and environmental, social and governance goals, theSupplier Continuous Quality Improvement Program (“SCQI”) is another example ofIntel’s commitment to assist its suppliers, achieve performance, quality, and designexcellence. Annually, all of Intel’s suppliers are graded on a balanced scorecardmeasuring key performance indicators. The balanced scorecard focuses on a number ofkey areas including safety, quality, cost, technology, environmental and socialgovernance, and output. To recognize the efforts and the achievements of the suppliersthat meet the established goals, Intel publicly announces the winners of the SCQI awardraising the winning suppliers’ visibility and international recognition. An internal Intelexecutive who works directly with suppliers stated, “We publicly recognize thesuppliers...acknowledging they are Intel suppliers, and in the top tier in terms ofcapabilities.”
Supplier Collaborations
Intel hosts between 20-25 supplier collaborations per year within the equipment andautomation group alone. These collaborative relationships allow for mutually beneficialinnovation. Engineers from both the suppliers and Intel design and develop newproducts, capital equipment, and new technologies. Engineers from the collaboratingsuppliers have access to capital equipment, ideas, silicon wafers, pattern test structures,and metrology capabilities that Intel maintains. Some of the associated capitalequipment Intel provides has a cost between $15 million and $50 million. As Intel’stechnology and equipment roadmap has expanded relative to competitors, its suppliersreceive access to equipment and technology otherwise unobtainable in the marketplace.The suppliers benefit by avoiding steep capital expenditures, gaining access to Intel

Intel’s Economic Impacts on the US Economy, 2008 – 2012
44
engineers and experience, and joining Intel with innovating around leading-edge oftechnologies.
Environmental Consciousness and Sustainability
Intel is focused on achieving a more environmentally sustainable business model. Forexample, water is one of the biggest consumption items for Intel, using approximately 9million gallons daily. About 22 percent of Intel’s daily water consumption occurs in itsChandler, Arizona chip manufacturing plant. In a desert community that receives only9 inches of average annual rainfall, water recycling is of paramount importance.Currently, the Intel site recycles approximately 60 percent of its water, with plans toincrease that amount to 90 percent in the future. Intel and the city of Chandler, Arizonaare working together to solve the water problems. According to an article recentlypublished in BusinessWeek, “‘Intel and the city inked another agreement ahead of thisexpansion in which the company would help secure and pay for added water rights,’ saidDoug Toy, Chandler’s Water Regulatory Affairs manager. It is also paying for upgradesto the city’s wastewater-treatment plant. Intel has “been a very good partner,” Toy said.‘They are part of the solution, not part of the problem.’”35
Social Consciousness and “Conflict Material”Avoidance
Intel is a pioneer in working to put systems and processes in place to reduce thepossibility that the minerals it is purchasing and that its suppliers are providing are“conflict minerals.” Conflict minerals are broadly defined as metals such as tantalum,tin, tungsten or gold where the ores are mined and sold by militant groups to financeviolent activities. Intel was the first electronics company to publish goals aroundmanufacturing “conflict-free” products and has worked to achieve their goals in thefollowing ways, to name a few:36
1. Achieved its 2012 goal to be conflict-free for the metal tantalum. All tantalumsmelters identified in Intel’s microprocessor supply-chain have been validated tobe conflict-free via the Electronic Industry Citizenship Coalition and Global e-Sustainability Initiative.
2. Mapped greater than 90 percent of its supply-chain, identifying over 140 uniquesmelters.
3. Conducted an on-the-ground review of the extractives and minerals trade in theDemocratic Republic of the Congo.
4. Initiated an industry-sponsored funding program called the “CFS Early AdoptersFund” to accelerate smelter participation in validating conflict-free supply lines.
35 http://www.businessweek.com/news/2013-09-15/intel-refilling-aquifer-reflects-water-concern-climate-and-carbon#p236 http://www.intel.com/content/dam/doc/policy/policy-conflict-minerals.pdf
Intel’s Economic Impacts on the US Economy, 2008 – 2012
45
Supply Chain Impacts as Seen Through the Hillsboro,OR Fabrication Site
Intel’s supply chain impacts the United States and local economies in many and varyingways. Among Intel’s significant centers of operation, this review will focus on Intel’s sitein Hillsboro, Oregon to elucidate the individualized effects of an Intel fabrication siteon a local community and economy. The main impacts of Intel in Oregon are listedbelow:
Direct Economic Benefits – Intel’s supply chain is integrated into the USeconomy. Interacting with coast-to-coast suppliers, Intel builds the workforcethrough capital expenditures, improving its suppliers through consultativesupport, and direct hiring.
Supplier Benefits – Intel provides a number of benefits to its suppliers andthose companies to which Intel supplies. From access to capital equipment tohealth and safety training programs, Intel builds mutually beneficialrelationships and helps to create the top-tier suppliers in the semiconductor andbroader technology industry.
Clustering Impacts – Intel is a gravitational force in the technology industry.Foreign and domestic companies feel a strong need to be close to that industryleadership and Intel’s geographic locales, bolstering local economies and creatingtechnology ecosystems in metropolitan areas.
Community Involvement – Intel is one of the most philanthropic andcommunity oriented companies as described by interview respondents. Itsinteraction with the local economies through education development,fundraising, volunteering, and small-business-building activities strengthens thelocales in which it operates and by extension the broader US economy.
Industry Leadership – Intel’s supply chain has evolved over the years to beone of the best in the world. Improving the supply chain allows the business torun more efficiently. Acting as the middle of the computing supply chain, Intelplays a critical role in growing the capabilities of suppliers and OEMs.
Each of these topics will be covered in greater detail below.
Direct Economic Benefits
Intel provides the Oregon region with approximately 16,400 direct jobs, making it thestate’s largest private employer. For perspective, Intel represents roughly 20% of techemployment in Oregon which has more than 5,300 tech companies employing a total of81,632 tech industry professionals.
Intel also compares favorably with respect to employee salaries and Oregon’s standardof living. The average annual salary of tech sector employees in Oregon was $94,200 in2012, or 123 percent higher than other private sector employment within Oregon.37
37 CyberStates Report.

Intel’s Economic Impacts on the US Economy, 2008 – 2012
46
“Intel’s average wage is approximately $125,000 here in the Portland metro area,while average per capita income is $41,000.”
- President and CEO of the largest business advocacy organization in Oregon
Intel is the largest taxpayer in Washington County, contributing $20.8 million in taxesto the County in 2012.38 Oregon does not have a sales tax; therefore, its excise tax (i.e.,the tax for the privilege of doing business in the state) is the primary revenue source forthe state along with property and employment taxes. Tax revenues serve to fund, forexample, public safety employees, public school employees, government officials andstaff, and state economic development initiatives – tax contributions therefore providean employment impact beyond Intel’s direct workers.
“[As] the largest [employer] in the state...Intel has a huge impact from a state-wideperspective.”
- President of a local Oregon Chamber of Commerce
Intel also impacts job creation through consistent and substantial capital spending.Intel’s capital spending on its Washington County campuses in Oregon provides oneexample. The company’s capital investments in the state exceed $25 billion since itacquired its first piece of property in Oregon in 1974. A senior member of the OregonBuilding Trades and Portland Development Commission recently remarked that theconstruction jobs that Intel provides have a ripple effect on the economy in numerousareas including, for example, construction workers paying mortgages, going out todinner, and making other purchases.
“All of the construction jobs related to Intel’s new fabrication sites put the constructionindustry back to work in the state [Oregon].”
- President and CEO of the largest business advocacy organization in Oregon
“Through some of our darkest times during the technology bust in 1999-2000, Intelhad cranes in the air doing construction. Intel makes a difference and is stable in oureconomy.”
- President of a local Oregon Chamber of Commerce
Supplier Benefits
Intel’s suppliers in Oregon have access to Intel’s talented workforce and strategicconsulting, as well as materials, equipment, and ideas not available elsewhere in thetechnology market. Intel’s Oregon-based suppliers are strategically located to reducelogistics-related expenses and take part in the cluster’s exchange of capital, workforce,and innovation. Becoming an Intel supplier brings with it the perception of being at theleading-edge of technology innovation. This market perception can help local suppliersto expand their knowledge-base, improve their functions, and win additional work.
38 Intel.

Intel’s Economic Impacts on the US Economy, 2008 – 2012
47
“We look for equipment suppliers that can meet our technological needs and providethe lowest possible total cost of ownership including capital cost, consumption of spareparts, uptime, and automation. We also look for companies that have anenvironmental and social governance process and policy in place.”
- Intel manufacturing equipment buyer who works directly with suppliers
“Suppliers that work with Intel have to meet exacting standards and by doing sodemonstrate their ability to be world-class. It gets out to the industry who Intel workswith.”
- Intel manufacturing equipment buyer who works directly with suppliers
When considering the rigorous senior management review process that a supplier mustpass in order to become an Intel supplier, one can understand the perception of qualityand performance that an Intel supplier conveys. Intel assists suppliers that have notfully matured in their understanding of their supply chain. Intel suppliers in Oregonhave access to the same programs and consultations as those available to all suppliers.The Supplier Quality Health Assessment and the Supplier Continuous QualityImprovement programs described earlier improve the suppliers’ business model andcan provide suppliers with an honest strengths, weaknesses, opportunities, and threats(“SWOT”) analysis of where their operations stand relative to top-tier industrybenchmarks. Suppliers have commented that, “We could pay a lot of money to havesomeone come in and do this, but Intel does it for free.” Some Intel suppliers commentthat the assessments are “balanced, fair, and analytical...they helps us see where we canimprove and be more efficient.”
“Our key message to our suppliers is not to meet the requirements just for Intel, but todo it for themselves, to create a better, more high-performance supply chain.”
- Intel supply chain quality and integration manager
Clustering Impacts
Intel’s fabrication site in Oregon is among the largest and most technologicallyadvanced site in the Intel ecosystem. The talent and innovative spirit that surrounds thesite fosters growth opportunities for suppliers, start-ups, and economic value. Intel’spresence in Oregon paves the way for other companies and worldwide individuals togravitate towards Intel’s critical mass. Intel’s presence helps to grow a highly talentedworkforce through internal trainings, external involvement with colleges anduniversities, and funding and support of Science, Technology, Engineering, and Math(“STEM”) programs for students.
“Intel grows the local Oregon cluster through the labor pool that has learned crucialtechnical skills and businesses that pop up to serve Intel.”
- Senior Vice President Research and Reports for a leading technology advocacygroup in the United States.
Intel’s supply partners generally make every effort to be close to large Intel sites andgain access to Intel technologies. By responding to Intel’s supply requirements, local
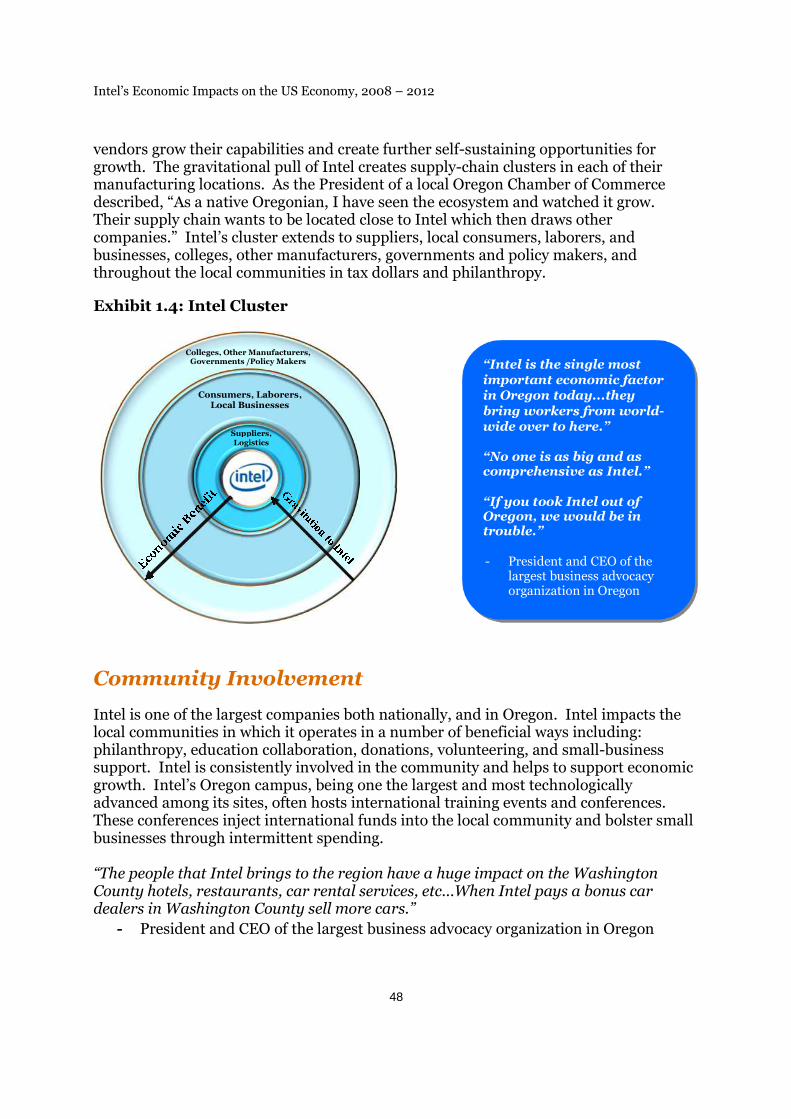
Intel’s Economic Impacts on the US Economy, 2008 – 2012
48
vendors grow their capabilities and create further self-sustaining opportunities forgrowth. The gravitational pull of Intel creates supply-chain clusters in each of theirmanufacturing locations. As the President of a local Oregon Chamber of Commercedescribed, “As a native Oregonian, I have seen the ecosystem and watched it grow.Their supply chain wants to be located close to Intel which then draws othercompanies.” Intel’s cluster extends to suppliers, local consumers, laborers, andbusinesses, colleges, other manufacturers, governments and policy makers, andthroughout the local communities in tax dollars and philanthropy.
Exhibit 1.4: Intel Cluster
Community Involvement
Intel is one of the largest companies both nationally, and in Oregon. Intel impacts thelocal communities in which it operates in a number of beneficial ways including:philanthropy, education collaboration, donations, volunteering, and small-businesssupport. Intel is consistently involved in the community and helps to support economicgrowth. Intel’s Oregon campus, being one the largest and most technologicallyadvanced among its sites, often hosts international training events and conferences.These conferences inject international funds into the local community and bolster smallbusinesses through intermittent spending.
“The people that Intel brings to the region have a huge impact on the WashingtonCounty hotels, restaurants, car rental services, etc...When Intel pays a bonus cardealers in Washington County sell more cars.”
- President and CEO of the largest business advocacy organization in Oregon
“Intel is the single mostimportant economic factorin Oregon today...theybring workers from world-wide over to here.”
“No one is as big and ascomprehensive as Intel.”
“If you took Intel out ofOregon, we would be introuble.”
- President and CEO of thelargest business advocacyorganization in Oregon
Suppliers,Logistics
Consumers, Laborers,Local Businesses
Colleges, Other Manufacturers,Governments /Policy Makers

Intel’s Economic Impacts on the US Economy, 2008 – 2012
49
When it comes to philanthropy on a national scale, Intel provides a strong corporateexample. Intel was named the “Most Philanthropic Company” in Oregon four years in arow. Intel not only works in the community, but it works with the community, bringingthe technical expertise, creativity, and energy of its employees to volunteering andcommunity action. US employees donate hundreds of thousands of hours each year toeducation, environmental programs, and other community needs. In Oregon, Intel haswon numerous awards from United Way including: Largest Total Employee GivingCampaign, Largest Corporate Gift, and Campaign Chair Award, recognizing the tangiblebenefits of Intel’s community involvement.
“Intel is an active participant in the community...It is smart, strategic, and targetedwith its philanthropy...with most of the tech industry being insular, Intel is moreoutward-focused.”
- President and CEO of the largest business advocacy organization in Oregon
“Intel’s community involvement and philanthropy helps employees, helps its supplychain customer base, helps the broader community...and builds goodwill.”
- Senior Vice President Research and Reports for a leading technology advocacygroup in the United States.
Many companies not integrated into Intel’s direct supply chain for semiconductorfabrication in Oregon also benefit from Intel’s presence in the local community. Intelinteracts with these companies through the “Vantage Club” which is a collaborativeeffort between Intel and the local Chamber of Commerce to match Intel employees withlocal small-businesses for acquiring other goods and services by facilitating interactionsand making the connection easier and more efficient.
“Lots of businesses want access to Intel and Intel’s employees. [Vantage Club] is aprocess by which we can collaboratively organize and coordinate that access...it alsotakes those dollars paid to the 16,000+ Intel employees, some of whom do not live inHillsboro, and puts them into the local economy.”
- President of a local Oregon Chamber of Commerce
Industry Leadership
Intel’s Oregon operations illustrate Intel’s industry leadership. In 2012, Intel wasnamed the “Most Admired Technology Company” in Oregon for the eighth consecutiveyear, based on a survey of more than 2,500 CEOs and top-level managers throughoutOregon.
Intel’s supply chain is ranked seventh among Gartner’s 2012 Supply Chain Top 25.Gartner applies the following criteria when assessing companies for the Supply ChainTop 25 list: an outside-in focus; innovation within the supply chain and in connectionwith new product introductions; strong partnership relationships with upstream anddownstream parties; and, commitment to operational excellence and continuousimprovement in people, processes, and supporting technology. Intel has reduced cycletimes by approximately 40 percent in recent years, reduced costs, and demonstrated

Intel’s Economic Impacts on the US Economy, 2008 – 2012
50
leadership in social responsibility. As one of the largest fabrication sites, Intel’s Oregonlocation is a significant contributor to Intel’s global supply chain excellence.
“Intel is involved in helping us to define our roadmap focused on mobility in acollaborative and open environment. This open and collaborative relationshipprovides maximum benefit and value to our joint customers. We have collaborated tobuild out exciting new solution sets for our customers.”
- VP and GM of US Commercial Sales for a significant Intel client
Intel maintains a vast yet high-quality supplier base across the globe. However, theUnited States is Intel’s primary manufacturing geography and is home to many of Intel’slargest and most technologically advanced campuses, including its Hillsboro, Oregoncampus. Many of Intel’s large suppliers have substantial presence within Oregon andsome suppliers are based and headquartered in Oregon. Having the Intel and supplierpresence has put Oregon on the map in terms of technology leadership and has broughtlike-minded companies and individuals to the area. Intel has helped to put the UnitedStates and Oregon at the leading edge of technology innovation and supply-chainleadership.
“[In Oregon] there are businesses specializing in second tier supply chain that locatenear the Intel site. Specializations that these businesses have can feed into Intel'ssupply chain and reinforce Intel’s decision to stay there…companies learn from oneanother and grow with each other.”
- Senior Vice President Research and Reports for a leading technology advocacygroup in the United States
Intel’s Economic Impacts on the US Economy, 2008 – 2012
51
Case Study 3: Intel CapitalImpact on the Corporate Venture Capital Industry andEconomic Growth
Intel Capital Background
Intel Capital was established in 1991 and has continuously been recognized as a marketleader in the corporate venture capital market ever since. An editor of a well-knownventure capital publication commented, “Intel Capital is the benchmark for corporateventuring.” With a significant past and a breadth of investments and experience, IntelCapital was also described by an editor of a corporate venture capital journal as “…amodel for other corporate venture capital firms…” Intel Capital brings not only years ofexperience and direct capital to companies, but global reach, market validation, andexpert industry insights. Intel Capital strategically focuses on building technologyecosystems through investments in mobility, software & services, consumer internet,digital media & entertainment, enterprise, and manufacturing and labs.
Intel Capital’s mission is to spur innovation and inspire the entrepreneurialspirit in support of Intel’s vision of creating and extending computingtechnology to connect and enrich the lives of every person on Earth.
Intel Capital acts and invests on a stage-agnostic basis, meaning that its focus does nottrend toward early-stage start-ups, late-stage established businesses, or any stage inbetween. This strategy allows for a diversified approach to investing in which nopotential investment is rejected based on stage, and rather all investments are assessedon a merit-based approach. Intel Capital bases its decision to invest on a number offactors including: potential market size; leadership team; and, strategic fit to Intel. IntelCapital is funded from Intel Corporation’s available cash and typically invests between$300 and $500 million per year. In FY2012 Intel Capital invested $352 million,preceded by $526 million in FY2011.
Intel Capital operates in an industry where there are many large venture capital andcorporate venture capital players. While there is a noted cluster of Intel Capitalportfolio investments in and around Santa Clara, California where Intel Capital isheadquartered, there are more clusters of investment spread across the country in stateslike Massachusetts, Florida, Washington, Texas, and North Carolina. Corporateventuring specifically tends to be focused on the goals, strategy, and culture of theparent. Intel Capital is consistent with setting the criteria for investment and hastalented individuals that understand the industry and its direction. An investmentmanager that works for Intel Capital was described by a former CEO of an Intel Capitalinvestment company as, “…thoughtful…he understood our options from allperspectives.”
Intel Capital has invested in success stories consistently over the years. Among IntelCapital’s notable investments are those listed in the table below.

Intel’s Economic Impacts on the US Economy, 2008 – 2012
52
Table 10: Intel Capital –Notable Investments
Company HQ Location Founded 2012 Revenue(millions)
Headcount
LOGMEIN Boston, MA2003 inHungary
$140 575
PEREGRINE San Diego, CA 1990 $204 402
VOCERA San Jose, CA 2000 $101 130
MOTRICITY(Voltari)
Bellevue, WA 2001 $90 152
Intel Capital Economic Impacts as Seen from the SantaClara, California Headquarters
Intel Capital contributes to the US and local economy in a number of ways:
Job Creation – Direct capital gives investment companies the opportunity toexpand workforce and market, providing access to high-paying, fast-growingjobs.
Industry Leadership – Intel Capital promotes technology advancement bystrategic investments. A number of industry veterans indicated that otherventure capital firms watch how Intel Capital operates and in what area andcompany it chooses to invest.
Intel Capital Advantages – Intel Capital utilizes its extensive network,technological expertise, breadth of experience, and understanding of the marketto help investments grow and thrive.
Talent Growth – The company not only grows talent externally, through jobscreated, promotion of Science, Technology, Engineering, and Math (“STEM”)programs, and talent matching, but also grows talent internally, allowing fortechnology spinoffs and start-up firms from Intel’s internal pipeline.
Clustering Effects – The presence of a large capital investor and the talent ofone of the largest technology companies worldwide, attracts like-mindedindividuals and talent to the regions because of access to suppliers, capital, andgrowing talent from universities.
Local Community Impact – Technology sector jobs are high-paying and Inteland Intel Capital have a commitment to community involvement. The dollarsfrom payrolls are disbursed through purchasing and the community benefitsfrom volunteer hours and dollars from Intel Capital and Corporate.
Networking and Match-making – One of the most difficult things for start-up companies is legitimizing their business and selling to the enterprise. IntelCapital helps start-up companies to make important business developmentconnections, grow their businesses, and increase their contributions to theeconomy via tax dollars, job creation, and introducing these companies to its vastinternal and external network to help them to succeed.
Intel’s Economic Impacts on the US Economy, 2008 – 2012
53
From a local perspective, it should be noted that Intel Corporation also is headquarteredin Santa Clara. While the impacts below focus on Intel Capital, incremental effects mayalso be attributed to the parent company.
Each of the above topics will be covered in greater detail below.
Job creation
Intel Capital spurs the technology industry through direct capital investment, indirectindustry leadership and bringing additional investors to the table, and through aconsistent, measured process of matching portfolio companies with potential customersand partners. Intel Capital has been operating within the corporate venturing space as aleader for more than 20 years. Venture capital provides companies with much-neededstart-up funding for pioneering ideas and allows these companies to hire additionaltalent, expand their market reach, further innovate, and transform their ideas intotangible products. The US venture capital ecosystem fosters an attractive environmentfor the world’s top talent and draws companies and individuals into the region. Theeditor of a venture capital publication stated, “…getting jobs into a high-paying marketis certainly made easier with a VC firm.” Furthermore, direct job growth can be seen inmany cases. The CEO of a former portfolio company commented, “The investmenthelped us to span out geographically and grow the sales team from 6 to 30 in less than ayear…”
Venture-backed jobs made up for 11 percent of US private sector employment in 2010.For the same year, venture-backed revenue accounted for 10 percent of total US sales.In addition, venture-backed jobs accounted for significant portions of majoremployment industries within the US economy including: 90 percent of software jobs,74 percent of biotechnology jobs, 72 percent of semiconductors/electronics jobs, 54percent of computer jobs, and 48 percent of telecommunications jobs.39
“Intel has been very smart about a lot of the things they’ve done – particularly in VC.They use their venture arm to influence the marketplace and to encourage certainbusinesses to start or R&D processes to start...”
- Senior Vice President Research and Reports for a leading technology advocacy groupin the United States.
Industry Leadership
Intel Capital demonstrates industry leadership in a number of different ways. Whetherleading an investment round, investing in a new and innovative technology as an earlyadopter, or filling out rounds by bringing their global investment syndicate of more than30 co-investors, Intel Capital delivers value to the economy through growing thecompanies of tomorrow. The president of a local chamber of commerce responded,“Intel is one of our largest employers and they have trickled down in our economy byhelping many of the small businesses throughout the valley.”
39 NVCA Venture Impact Edition 6.0.

Intel’s Economic Impacts on the US Economy, 2008 – 2012
54
Intel Capital is consistently on the “most active” list of venture capital firms and oftenwins objective investment awards from trade publications including: Corporate VentureUnit of the Year (2013)40; Top Technology VC of 201241; and, #1 for quantity of IPOpipeline companies in portfolio42.
“[Intel Capital] is the biggest corporate VC firm around the world, so we spend asmuch time as we can trying to understand what they do and why.”
- Founder and Editor-In-Chief for a prominent corporate venturing magazine
Intel Capital Advantages
Intel Capital has many strategic advantages which add value to its investments. Thesevalue-add benefits include: recognized brand; technology expertise; and, networkingcapabilities. A former CEO of an investment company described the benefits of IntelCapital’s involvement as follows: “We were able to use the brand name in makingconnections… Intel Capital really knew the domain…[Intel Capital Technology Days]focused on making good matches between buyers and sellers. They were some of thebest to work with.”
“The partner we worked with was knowledgeable about the business, knew theindustry well, and had his ear to the ground. Of the investors we worked with, he wasamong the best in knowing the industry.”
- Former CEO of a well-known software company venture-backed by Intel Capital
Intel Capital is a stage-agnostic investor which allows them to invest at any stage in thelife-cycle of the business.
Intel Capital also has a size, longevity, market presence, and leadership position thatmake an investment more than just capital and ideas, but also a market perception thatthe company being invested in has the appropriate direction, leadership, and is viable.A CEO of a former investment company said, “When we thought about raising morefunds, we featured Intel quite prominently. We received more interest from VCs withthe Intel connection. The Intel connection helps other investors get over the initialdoubts/questions and puts stock in the claims you are making. The team, position inthe market, and strategy are legitimized.”
Intel Capital’s presence as an investor also helps with financing considerations. “IntelCapital really helped to ensure the banks that we knew what we were doing and werefully backed. They communicated to the banks that they did not have to worry about[the company’s] legitimacy and long-term business proposition,” responded the CEO ofa former portfolio company. In some instances, Intel Capital’s investments putcompanies on the map; in other investments, they legitimize companies that have beenon the map for some time.
40 Global Corporate Venturing Magazine.41 PrivCo.42 CBInsights.

Intel’s Economic Impacts on the US Economy, 2008 – 2012
55
“Having Intel Capital as an investor lends legitimacy when talking to key customers’executives or other investors. Intel Capital as an investor is a stamp of approval thatis hard to match.”
- CEO of a former Intel Capital -financed semiconductor equipment manufacturer
“Intel Capital’s longevity, experience, size, consistency, and financial returns wereamong the best, if not the best of any unit.”
- Founder and Editor-In-Chief for a prominent corporate venturing magazine
Intel Capital can also open doors for further financing and banking relationships. Asdescribed above, Intel Capital has a syndicate of over 30 co-investors and Intel Capitalnever goes into an investment alone. This allows companies additional access to capitaland Intel Capital the ability to invest in numerous companies to diversify their presenceand grow the industry. Economically, opening the investment and financingopportunities for an investment company opens the doors for market growth, industrygrowth, and job creation.
Talent Growth
Intel Capital’s investments and direct assistance outside of capital foster anenvironment of talent growth and innovative ideas. Furthermore, Intel Capital and IntelCorporation combine to develop new talent both through education initiatives in theScience, Technology, Engineering, and Mathematics (STEM) fields and through internaltraining and talent growth which advances the skills and capabilities of their ownemployees. These employees and those individuals touched by Intel’s efforts to grow theSTEM careers and capabilities in the United States can form companies and start-ups oftheir own, improving the technology ecosystem and further expanding the US economy.
“Intel Capital helped with introductions to people and building our executive staff. TheCEO Summit was good from a number of perspectives including imparting knowledgeon building and fielding a team, as well as gaining knowledge through workshops andnetworking.”
- CEO of a former Intel Capital-financed semiconductor equipment manufacturer
“They are very engaged with the issues we are concerned about here...affordablehousing, transportation, education and making all those things better so that Intel andother high-tech firms can draw the best and brightest workers and drive the localeconomy.”
- President of a local Chamber of Commerce in which Intel Capital operates
Clustering Benefits
Intel Capital’s headquarters is in Santa Clara, California. Silicon Valley occupiesapproximately the same area as Santa Clara and is home to a plethora of start-up andearly stage companies. For a start-up company, ease of access to capital is acontributing factor to business location decisions. Intel Capital’s presence in Silicon

Intel’s Economic Impacts on the US Economy, 2008 – 2012
56
Valley has attracted companies to locate in the local community so that the companiescan be close to their source of funding. Companies want to be able to quickly, easily,and cheaply communicate face-to-face with Intel Capital, and as such, have often chosento locate in Santa Clara, California.
“Early on [in the 1990s] that really had an effect around Santa Clara where Intel [andIntel Capital] is based. Many start-ups went there because of its proximity to IntelCorporation…”
- Lead Editor of a widely-publicized venture capital journal.
Local Community Impact
Santa Clara County, California (a significant portion of what is commonly referred to asSilicon Valley) is home to a multitude of venture capital firms, including Intel Capital,and approximately $165 billion venture capital dollars have been spent since 1970. Thelocal median single family home price is $569,00043, compared with $212,300nationally, showing the impact of high-salaried positions and the effects of the high-techindustry on the local economy. The high local standard of living can be seen in SantaClara County’s $89,064 in median household income, which compares with $61,632 forCalifornia44 and $50,502 nationally (i.e., 76% above the national median). Santa ClaraCounty maintains a budget of $4.2 billion45. These incomes and tax revenues help tobuild significant ecosystems and inject major dollars into small businesses,communities, public safety, capital projects, parks and recreation, and public works. Aneditor of a local industry journal described how a few well-known start-ups made theirheadquarters in economically depressed areas and quickly turned the micro-economiesfrom negative to positive.
“The company is paying significant taxes in the community that goes towards streetmaintenance, emergency responders, locally-owned utilities, etc. From there it tricklesdown in terms of hotel rooms, restaurants, meeting locations, and convention centerpopularity. From an educational standpoint, they are engaged with and foster STEM(Science, Technology, Engineering, and Math) education in its local school districtsand throughout the valley.”
- President of a local Chamber of Commerce
Intel Capital is continuously providing the region with capital investment, businessleadership, customer introductions, technology expertise, and merger and acquisitionconsulting. These acts drive new business growth and economic improvement.
43 Community Economic Profile – City of Santa Clara, California.44 http://quickfacts.census.gov/qfd/states/06/06085.html45 http://www.mercurynews.com/elections/ci_21741987/santa-clara-county-tries-again-sales-tax
Intel’s Economic Impacts on the US Economy, 2008 – 2012
57
Intel Capital Technology Days & Intel Capital GlobalSummit
Intel Capital hosts the Intel Capital Global Summit which is an annual 1000 personconference bringing together entrepreneurs from its portfolio companies and Global1000 corporate decision makers to help each find partnership, collaboration or evensales opportunities.46 Portfolio companies benefit from increases in sales, networkingwith key customer contacts, and gaining an understanding of what customers arelooking for in the marketplace. Any company can choose to participate or notparticipate in meetings with specific decision makers and at times companies may not fitwith the program; however, according to a former CEO of a portfolio company “access tothe Intel network is a business development tool that not many companies refuse.”
Intel Capital Technology Days has a similar goal as the Intel Capital Global Summit andconnects corporate decision makers with Intel Capital portfolio companies. As portfoliocompanies grow their sales, additional workers are needed to add capacity, salessupport, delivery, etc. These events indirectly create jobs by creating orders,collaborative projects, and connections. Companies from Intel’s extensive network gainaccess to Intel Capital’s portfolio and can often improve business and drive additionaltop-line and bottom-line growth, further trickling down to national tax revenues whichare then used to fund jobs in the public safety, governmental, education andinfrastructure sectors.
“The greatest interaction we received from Intel Capital was in sales and marketingfor exposure and customer access. They were by far the best at that.”
- Former CEO of a well-known software company venture-backed by Intel Capital
Intel Capital also hosts an annual Intel Capital Global Summit, bringing togetherinnovators, key executives, thought leaders, governmental officials, and professionalservice providers. It is held in Southern California and is strategically designed toimmerse attendees in a world of networking. Activities available at the summit includeone-on-one introductions and targeted match-making sessions, panel discussions andsocial events. All events are aimed at establishing relationships with Global 1000companies, offering new sales opportunities to portfolio companies, and providing keydecision makers in the Intel network access to the ideas, innovations, and innovatorsthat can stimulate growth.
In 2012, Intel Capital generated more than 3,500 engagements between portfoliocompanies and customers; hosted more than 1,800 Global Summit Connect meetings;and, hosted 76 Intel Capital Technology Days resulting in more than 1,700introductions. The growth created by these events directly affects the US and localeconomy through, among other things, job creation, additional tax revenues, research &development, and higher donations from excess funds. The graphic below depicts howthese events drive economic benefit.
46 Top 1000 companies by revenue as determined by Forbes.

Intel’s Economic Impacts on the US Economy, 2008 – 2012
58
Exhibit 1.5: Intel Capital Technology Days and Intel Capital Global Summit Web
Intel’s Economic Impacts on the US Economy, 2008 – 2012
59
Appendix A: Data Sources and Methodology
This Appendix describes the methodology used to derive the results for the study. Itfirst discusses the IMPLAN model which was used to estimate many of the impacts inthis report. It also discusses the data sources PwC utilized to develop estimates of Intel’sdirect employment, labor income, and GDP impacts and capital investment impacts. Itthen describes PwC’s use and adjustment of the IMPLAN model to capture a morecomplete estimate of Intel’s overall impact on the US economy. These adjustmentscapture capital investment impacts and distribution channel impacts which are notnecessarily incorporated into other economic impact analyses.
The IMPLAN model, an input-output (I-O) model based on Federal government data,was used to estimate Intel’s overall economic impact. I-O modeling is typicallyemployed to analyze how a change in economic activity in one sector of the economyaffects activities in other sectors of the economy. In a so-called “marginal” impactanalysis, I-O model results can be viewed as showing the impact of small changes inactivity in one sector (e.g., semiconductor manufacturing) on the rest of the economybefore any price adjustments and before businesses, workers, and consumers adjusttheir activities. The ultimate economic impact of a change in activity will be lesspronounced than shown by I-O results, particularly if induced price changes are large.
I-O models can also be used in an economic contribution analysis, as done in this study.By simulating a “complete shutdown” of an existing sector, an economic contributionstudy attempts to quantify the portion of an economy that can be attributed to such anexisting sector. It uses the I-O model to identify all backward (i.e., upstream) linkagesin the study area. An economic contribution analysis, when compared with the entirestudy area economy, offers insights into the relative extent and magnitude of a companyor an industry in the study area. However, this is not to say that a complete shutdown ofIntel would result in the permanent loss of the jobs and output attributable to thecompany through this exercise. In this unlikely event, the resources currently allocatedto semiconductor manufacturing may find employment in other industries, which wouldcompensate in part for the loss of the jobs and output from the semiconductor sector.
The latest version of the IMPLAN model, which is used for this study, incorporates theinput-output relationships for 2011. It does not reflect the 2013 comprehensive revisionof the industry economic accounts by the Commerce Department, which has not yetbeen released. The 2013 comprehensive revision will record research and developmentexpenditures as capital investment instead of an item of cost.47 An IMPLAN model thatincorporates this revision may estimate greater impacts of the activities of research anddevelopment intensive industries, such as the semiconductor industry.
47For further information on the revision see “Preview of the 2013 Comprehensive Revision of the
National Income and Products Accounts,” Survey of Current Business, March 2013.

Intel’s Economic Impacts on the US Economy, 2008 – 2012
60
Estimating the Direct Jobs, Direct Labor Income and Direct GDP
This report uses data on direct employment, employee compensation, and capitalexpenditures provided by Intel. Intel provided data for Intel Corporation and for its twolargest wholly-owned subsidiaries -- McAfee, Inc. and Wind River Systems, Inc. Theemployment data include both full-time and part-time workers. Employeecompensation includes wages, salaries and fringe benefits.
Intel’s contribution to GDP was estimated based Intel’s employment and thesemiconductor industry’s average GDP to employment ratio from the IMPLAN model.
Estimating the Indirect and Induced Economic Impacts
Estimates of the indirect and induced economic impacts of Intel were derived based onthe IMPLAN model for the United States. The IMPLAN model is built around an“input-output” table that relates the purchases that each industry has made from otherindustries to the value of the output of each industry. To meet the demand for goodsand services from an industry, purchases are made in other industries according to thepatterns recorded in the input-output table. These purchases in turn spark still morepurchases by the industry’s suppliers, and so on. Additionally, employees and businessowners make personal purchases out of the additional income that is generated by thisprocess, sending more new demands rippling through the economy.
Multipliers describe these iterations. The Type I multiplier measures the direct andindirect effects of a change in economic activity. It captures the inter-industry effectsonly, i.e., industries buying from local industries. The Type II (Social Accounting Matrixor SAM) multiplier captures the direct and indirect effects and, in addition, it alsoreflects induced effects (i.e., changes in spending from households as income increasesor decreases due to the changes in production). The indirect and induced impacts byIntel on other sectors of the economy in terms of employment, labor income (includingwages and salaries and benefits as well as proprietors’ income), and GDP werecalculated through the multiplier process built into the model.48
The magnitude of the multipliers within the IMPLAN model varies from year to year.This variability is reflected in the estimates of Intel’s impacts on the US economy. Forexample, in Table 5, the ratio of Intel’s indirect and induced GDP impacts to direct GDPimpact was lower in 2009 (2.2) during a period of economic contraction compared tothe ratio in 2012 (2.7) during 2012 when the economy was expanding.
48 Because the IMPLAN models are used for total impact analysis (as opposed to marginal impactanalysis) in this study, necessary adjustments are made to the initial indirect and induced impactestimates to prevent double-counting. For instance, the indirect and induced effects from the estimatesthat are mapped to the semiconductor industry are adjusted downward to reflect Intel’s share.

Intel’s Economic Impacts on the US Economy, 2008 – 2012
61
Estimating Capital Investment Impact
To quantify Intel’s capital investment impact, PwC used capital expenditure data for2008 through 2012 that Intel provided to the Census Bureau as part of the AnnualCapital Expenditures Survey. For the impact analysis, capital spending was thentranslated into purchases of capital assets by type through the use of the so-called“capital flow matrix” from the US Department of Commerce.
Estimating Distribution Channel Impacts
PwC estimated Intel’s share of the semiconductor industry’s distribution marginavailable from the IMPLAN model to capture impacts associated with the distribution ofIntel’s products. Based on these margins, we estimated the related impact onemployment, labor income, and GDP.

Intel’s Economic Impacts on the US Economy, 2008 – 2012
62
Appendix B: Intel’s Indirect and Induced Impact on the US Economy by Sector
Table B-1.− Results for 2008
Indirect Induced Indirect Induced Indirect Induced
Operational Im pact 213,900 195,000 $14,180 $8,962 $22,799 $15,861
Agriculture 800 4,100 $28 $135 $42 $205
Mining 2,200 1,000 $214 $102 $622 $296
Utilities 1,500 800 $194 $100 $7 02 $362
Construction 6,600 2,200 $368 $124 $416 $140
Manufacturing 30,600 9,100 $2,503 $621 $5,536 $1,285
Wholesale and retail trade 18,500 38,100 $1,287 $1,456 $2,231 $2,37 9
Transportation and warehousing 11,200 5,7 00 $594 $303 $7 98 $412
Information 6,200 3,500 $642 $310 $1,069 $663
Finance, insurance, real estate, rental and leasing 12,200 27 ,300 $7 29 $1,227 $2,021 $4,57 8
Services 111,100 96,000 $6,67 8 $4,058 $8,285 $4,942
Other 13,000 7 ,200 $944 $525 $1,07 6 $599
Capital Investm ent Im pact 19,200 13,700 $1,348 $600 $1,823 $1,058
Agriculture 0 300 $1 $8 $2 $12
Mining 100 100 $5 $4 $18 $13
Utilities 0 100 $5 $6 $20 $23
Construction 4,600 200 $245 $9 $258 $11
Manufacturing 4,200 600 $423 $41 $589 $84
Wholesale and retail trade 1,800 2,600 $125 $98 $208 $159
Transportation and warehousing 7 00 400 $36 $20 $48 $27
Information 400 200 $41 $22 $85 $45
Finance, insurance, real estate, rental and leasing 900 1,800 $40 $83 $118 $313
Services 6,400 7 ,200 $419 $298 $47 3 $360
Other 100 200 $7 $11 $6 $10
Distribution Channel Im pact 57,000 38,000 $3,786 $1,752 $6,381 $3,102
Agriculture 100 800 $2 $26 $3 $40
Mining 200 200 $21 $20 $61 $58
Utilities 100 100 $8 $19 $28 $7 1
Construction 300 400 $17 $24 $20 $27
Manufacturing 900 1,800 $65 $122 $149 $253
Wholesale and retail trade 37 ,400 7 ,400 $2,699 $284 $4,692 $464
Transportation and warehousing 5,000 1,100 $248 $59 $336 $80
Information 500 7 00 $53 $61 $94 $130
Finance, insurance, real estate, rental and leasing 1 ,7 00 5,300 $94 $240 $283 $896
Services 9,200 18,800 $461 $7 93 $581 $966
Other 1,600 1,400 $119 $102 $135 $117
Total Indirect and Induced Im pacts 290,100 246,700 $19,314 $11,313 $31,003 $20,020
Source: PwC calculations using the IMPLAN modeling sy stem.
* Employment is defined as the number of full- and part-time jobs, including self-employ ment.
** Labor income is defined as wages and salaries and benefits and proprietors' income.
Sector DescriptionEm ploym ent* Labor Incom e ($ m illion)** GDP ($ million)

Intel’s Economic Impacts on the US Economy, 2008 – 2012
63
Table B-2.− Results for 2009
Indirect Induced Indirect Induced Indirect Induced
Operational Im pact 210,900 195,000 $13,783 $8,943 $21,871 $15,721
Agriculture 800 4,100 $24 $117 $36 $17 8
Mining 2,100 1,000 $137 $66 $398 $192
Utilities 1 ,400 800 $180 $94 $652 $341
Construction 6,500 2,200 $358 $123 $405 $139
Manufacturing 30,100 9,100 $2,340 $599 $5,049 $1,190
Wholesale and retail trade 18,300 38,100 $1,328 $1,482 $2,302 $2,422
Transportation and warehousing 11 ,100 5,7 00 $57 1 $294 $7 67 $399
Information 6,100 3,500 $641 $312 $1,061 $663
Finance, insurance, real estate, rental and leasing 12,000 27 ,300 $7 11 $1 ,212 $1,989 $4,581
Services 109,7 00 96,000 $6,561 $4,120 $8,148 $5,017
Other 12,800 7 ,200 $933 $525 $1,064 $599
Capital Investm ent Im pact 22,700 15,800 $1,577 $701 $2,111 $1,236
Agriculture 0 300 $1 $9 $2 $14
Mining 100 100 $6 $4 $21 $15
Utilities 0 100 $6 $7 $23 $27
Construction 6,500 200 $350 $11 $369 $13
Manufacturing 4,600 7 00 $47 0 $47 $658 $98
Wholesale and retail trade 2,000 3,000 $134 $114 $222 $185
Transportation and warehousing 800 500 $41 $24 $54 $32
Information 400 300 $46 $26 $94 $52
Finance, insurance, real estate, rental and leasing 1,000 2,100 $45 $97 $133 $366
Services 7 ,200 8,300 $468 $348 $529 $421
Other 100 200 $8 $13 $7 $12
Distribution Channel Im pact 57,300 38,300 $3,922 $1,761 $6,597 $3,096
Agriculture 100 800 $2 $23 $3 $35
Mining 200 200 $14 $13 $40 $38
Utilities 100 100 $7 $18 $26 $67
Construction 300 400 $17 $24 $20 $27
Manufacturing 900 1,800 $62 $118 $131 $236
Wholesale and retail trade 37 ,600 7 ,500 $2,847 $291 $4,949 $47 6
Transportation and warehousing 5,000 1,100 $242 $58 $329 $7 8
Information 500 7 00 $54 $61 $94 $130
Finance, insurance, real estate, rental and leasing 1,7 00 5,400 $94 $239 $285 $903
Services 9,300 18,900 $464 $811 $585 $988
Other 1 ,600 1,400 $119 $103 $136 $118
Total Indirect and Induced Im pacts 290,900 249,100 $19,282 $11,405 $30,580 $20,053
Source: PwC calculations using the IMPLAN modeling sy stem.
* Employment is defined as the number of full- and part-time jobs, including self-employ ment.
** Labor income is defined as wages and salaries and benefits and proprietors' income.
Sector DescriptionEm ploy m ent* Labor Incom e ($ m illion)** GDP ($ m illion)

Intel’s Economic Impacts on the US Economy, 2008 – 2012
64
Table B-3.− Results for 2010
Indirect Induced Indirect Induced Indirect Induced
Operational Im pact 213,700 201,800 $14,328 $9,434 $22,734 $16,599
Agriculture 800 4,200 $26 $130 $39 $198
Mining 2,200 1,100 $158 $7 8 $460 $227
Utilities 1,500 800 $187 $100 $67 7 $362
Construction 6,600 2,300 $363 $127 $410 $144
Manufacturing 30,400 9,400 $2,416 $639 $5,223 $1,298
Wholesale and retail trade 18,500 39,400 $1,352 $1,518 $2,344 $2,483
Transportation and warehousing 11,200 5,900 $590 $314 $7 93 $427
Information 6,200 3,600 $665 $326 $1,085 $686
Finance, insurance, real estate, rental and leasing 12,200 28,200 $7 35 $1,289 $2,07 2 $4,836
Serv ices 111,100 99,400 $6,865 $4,355 $8,522 $5,302
Other 13,000 7 ,500 $97 1 $559 $1,108 $637
Capital Investm ent Im pact 26,500 18,100 $1,862 $828 $2,501 $1,460
Agriculture 100 300 $2 $11 $2 $17
Mining 100 100 $7 $5 $25 $18
Utilities 100 100 $7 $9 $27 $32
Construction 7 ,200 200 $387 $13 $408 $16
Manufacturing 5,500 800 $57 2 $56 $800 $115
Wholesale and retail trade 2,300 3,500 $158 $135 $262 $219
Transportation and warehousing 900 500 $49 $28 $64 $38
Information 500 300 $55 $30 $113 $62
Finance, insurance, real estate, rental and leasing 1,200 2,400 $54 $115 $159 $432
Serv ices 8,500 9,7 00 $561 $412 $633 $497
Other 100 200 $10 $16 $9 $14
Distribution Channel Im pact 58,000 38,700 $4,022 $1,815 $6,770 $3,194
Agriculture 100 800 $2 $25 $3 $38
Mining 200 200 $16 $15 $46 $44
Utilities 100 200 $7 $19 $27 $69
Construction 300 400 $17 $24 $20 $28
Manufacturing 900 1,800 $65 $123 $143 $251
Wholesale and retail trade 38,000 7 ,600 $2,904 $292 $5,049 $47 7
Transportation and warehousing 5,100 1,100 $251 $60 $341 $82
Information 500 7 00 $56 $63 $96 $132
Finance, insurance, real estate, rental and leasing 1 ,7 00 5,400 $98 $248 $296 $931
Serv ices 9,400 19,100 $482 $838 $608 $1,020
Other 1 ,7 00 1,400 $124 $107 $142 $122
Total Indirect and Induced Im pacts 298,200 258,600 $20,212 $12,077 $32,004 $21,253
Source: PwC calculations using the IMPLAN modeling sy stem.
* Employment is defined as the number of full- and part-time jobs, including self-employ ment.
** Labor income is defined as wages and salaries and benefits and proprietors' income.
Sector DescriptionEm ployment* Labor Income ($ million)** GDP ($ million)***
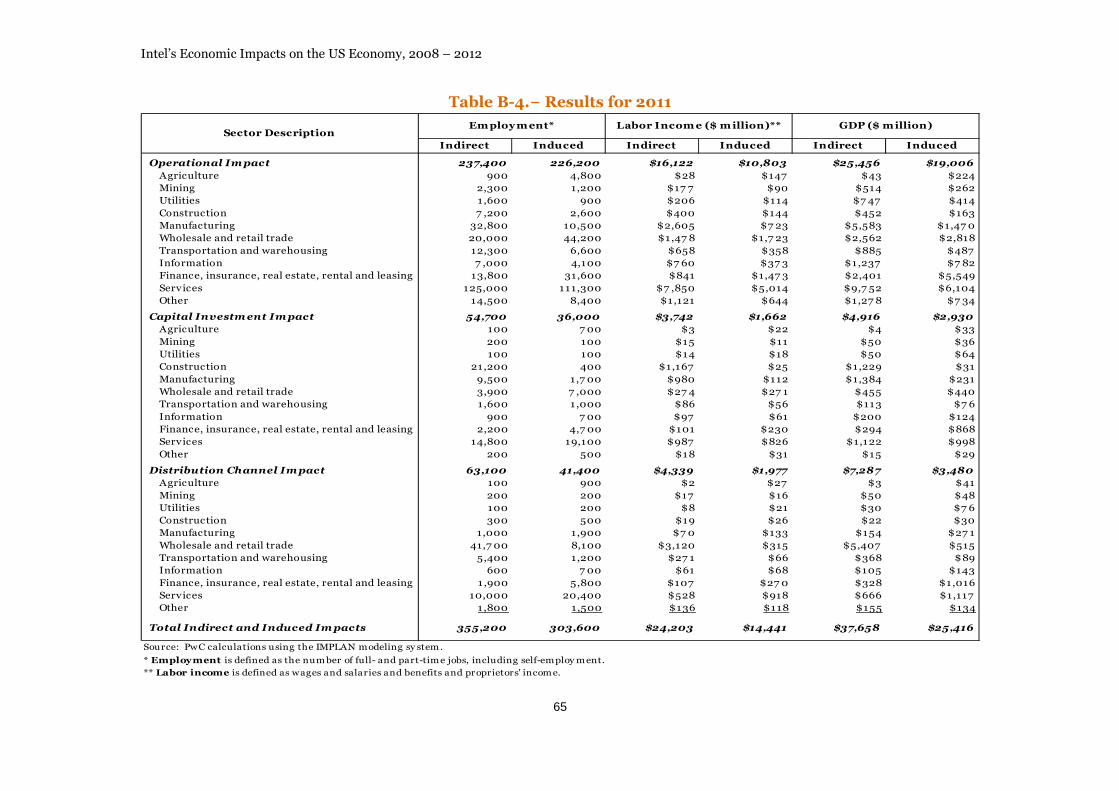
Intel’s Economic Impacts on the US Economy, 2008 – 2012
65
Table B-4.− Results for 2011
Indirect Induced Indirect Induced Indirect Induced
Operational Im pact 237,400 226,200 $16,122 $10,803 $25,456 $19,006
Agriculture 900 4,800 $28 $147 $43 $224
Mining 2,300 1,200 $17 7 $90 $514 $262
Utilities 1 ,600 900 $206 $114 $7 47 $414
Construction 7 ,200 2,600 $400 $144 $452 $163
Manufacturing 32,800 10,500 $2,605 $7 23 $5,583 $1,47 0
Wholesale and retail trade 20,000 44,200 $1,47 8 $1,7 23 $2,562 $2,818
Transportation and warehousing 12,300 6,600 $658 $358 $885 $487
Information 7 ,000 4,100 $7 60 $37 3 $1,237 $7 82
Finance, insurance, real estate, rental and leasing 13,800 31,600 $841 $1,47 3 $2,401 $5,549
Services 125,000 111,300 $7 ,850 $5,014 $9,7 52 $6,104
Other 14,500 8,400 $1,121 $644 $1,27 8 $7 34
Capital Investm ent Im pact 54,700 36,000 $3,742 $1,662 $4,916 $2,930
Agriculture 100 7 00 $3 $22 $4 $33
Mining 200 100 $15 $11 $50 $36
Utilities 100 100 $14 $18 $50 $64
Construction 21,200 400 $1,167 $25 $1,229 $31
Manufacturing 9,500 1,7 00 $980 $112 $1,384 $231
Wholesale and retail trade 3,900 7 ,000 $27 4 $27 1 $455 $440
Transportation and warehousing 1 ,600 1,000 $86 $56 $113 $7 6
Information 900 7 00 $97 $61 $200 $124
Finance, insurance, real estate, rental and leasing 2,200 4,7 00 $101 $230 $294 $868
Services 14,800 19,100 $987 $826 $1,122 $998
Other 200 500 $18 $31 $15 $29
Distribution Channel Im pact 63,100 41,400 $4,339 $1,977 $7,287 $3,480
Agriculture 100 900 $2 $27 $3 $41
Mining 200 200 $17 $16 $50 $48
Utilities 100 200 $8 $21 $30 $7 6
Construction 300 500 $19 $26 $22 $30
Manufacturing 1,000 1,900 $7 0 $133 $154 $27 1
Wholesale and retail trade 41,7 00 8,100 $3,120 $315 $5,407 $515
Transportation and warehousing 5,400 1,200 $27 1 $66 $368 $89
Information 600 7 00 $61 $68 $105 $143
Finance, insurance, real estate, rental and leasing 1 ,900 5,800 $107 $27 0 $328 $1,016
Services 10,000 20,400 $528 $918 $666 $1,117
Other 1 ,800 1,500 $136 $118 $155 $134
Total Indirect and Induced Im pacts 355,200 303,600 $24,203 $14,441 $37,658 $25,416
Source: PwC calculations using the IMPLAN modeling sy stem.
* Employment is defined as the number of full- and part-time jobs, including self-employ ment.
** Labor income is defined as wages and salaries and benefits and proprietors' income.
Sector DescriptionEmployment* Labor Incom e ($ m illion)** GDP ($ million)
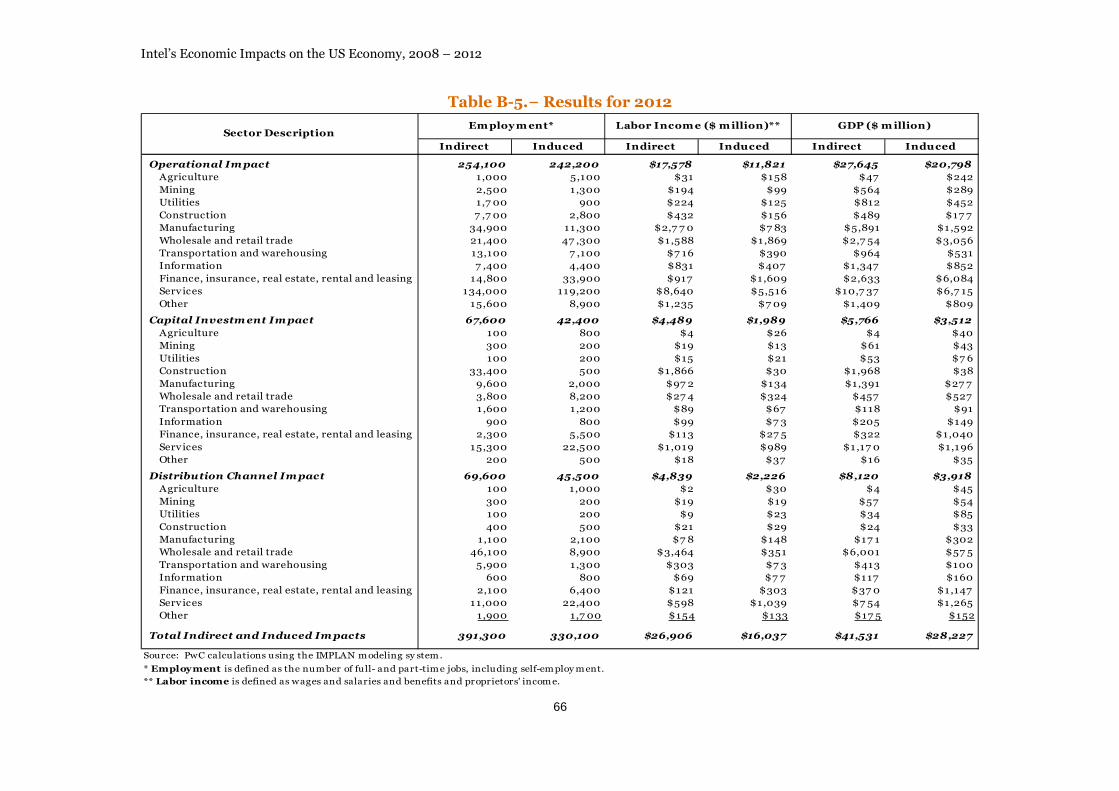
Intel’s Economic Impacts on the US Economy, 2008 – 2012
66
Table B-5.− Results for 2012
Indirect Induced Indirect Induced Indirect Induced
Operational Im pact 254,100 242,200 $17,578 $11,821 $27,645 $20,798
Agriculture 1,000 5,100 $31 $158 $47 $242
Mining 2,500 1,300 $194 $99 $564 $289
Utilities 1,7 00 900 $224 $125 $812 $452
Construction 7 ,7 00 2,800 $432 $156 $489 $17 7
Manufacturing 34,900 11 ,300 $2,7 7 0 $7 83 $5,891 $1,592
Wholesale and retail trade 21 ,400 47 ,300 $1,588 $1,869 $2,7 54 $3,056
Transportation and warehousing 13,100 7 ,100 $7 16 $390 $964 $531
Information 7 ,400 4,400 $831 $407 $1,347 $852
Finance, insurance, real estate, rental and leasing 14,800 33,900 $917 $1,609 $2,633 $6,084
Serv ices 134,000 119,200 $8,640 $5,516 $10,7 37 $6,7 15
Other 15,600 8,900 $1,235 $7 09 $1,409 $809
Capital Investm ent Im pact 67,600 42,400 $4,489 $1,989 $5,766 $3,512
Agriculture 100 800 $4 $26 $4 $40
Mining 300 200 $19 $13 $61 $43
Utilities 100 200 $15 $21 $53 $7 6
Construction 33,400 500 $1,866 $30 $1,968 $38
Manufacturing 9,600 2,000 $97 2 $134 $1,391 $27 7
Wholesale and retail trade 3,800 8,200 $27 4 $324 $457 $527
Transportation and warehousing 1 ,600 1,200 $89 $67 $118 $91
Information 900 800 $99 $7 3 $205 $149
Finance, insurance, real estate, rental and leasing 2,300 5,500 $113 $27 5 $322 $1,040
Serv ices 15,300 22,500 $1,019 $989 $1,17 0 $1,196
Other 200 500 $18 $37 $16 $35
Distribution Channel Im pact 69,600 45,500 $4,839 $2,226 $8,120 $3,918
Agriculture 100 1,000 $2 $30 $4 $45
Mining 300 200 $19 $19 $57 $54
Utilities 100 200 $9 $23 $34 $85
Construction 400 500 $21 $29 $24 $33
Manufacturing 1 ,100 2,100 $7 8 $148 $17 1 $302
Wholesale and retail trade 46,100 8,900 $3,464 $351 $6,001 $57 5
Transportation and warehousing 5,900 1,300 $303 $7 3 $413 $100
Information 600 800 $69 $7 7 $117 $160
Finance, insurance, real estate, rental and leasing 2,100 6,400 $121 $303 $37 0 $1,147
Serv ices 11,000 22,400 $598 $1,039 $7 54 $1,265
Other 1 ,900 1,7 00 $154 $133 $17 5 $152
Total Indirect and Induced Im pacts 391,300 330,100 $26,906 $16,037 $41,531 $28,227
Source: PwC calculations using the IMPLAN m odeling sy stem .
* Employment is defined as the num ber of full- and part-tim e jobs, including self-em ploy m ent.
** Labor income is defined as wages and salaries and benefits and proprietors' incom e.
Sector DescriptionEm ploy m ent* Labor Incom e ($ m illion)** GDP ($ m illion)

Intel’s Economic Impacts on the US Economy, 2008 – 2012
67
Appendix C: Literature Review
Table C-1 - Summary of Findings
Author /
Date Title Topic / Focus / Question
Geography /
Sectors Covered Time Period Findings
Aizcorbe,
Oliner, and
Sichel
September
2006
“Shifting Trends in
Semiconductor Prices and
the Pace of Technological
Progress”
Price decline (rapid in
90s, slowed 2001-2006)
Price swings reflect
changes in price-cost
markups and trends
Shift to faster cost
declines correspond to
speed-up in pace of
advance in
semiconductor
technology
Slower cost declines since
2001 not mirrored by
deceleration in pace of
advance in
semiconductor
technology
Semiconductor
manufacturing
1990s-Early
2000s Intel is the dominant producer of MPU chips.
Intel actively invests in other companies and nascent industries with the aim to spur
demand for its products.
Faster price declines for DRAM and MPU chips in mid-90s were followed by slower price
declines after 2001.
Swings in price-cost markups account for considerable part of price dynamics.
After controlling for markups, implied cost trends point to notably smaller swings in pace
of technical progress.
Implied cost trends may be affected by factors that are largely unrelated to pace of
technical progress.
Aizcorbe,
Flamm, and
Khurshid
November
2001
"The Role of
Semiconductor Inputs in
IT Hardware Price
Decline: Computers vs.
Communications.”
Determines change in price
of semiconductors and their
corresponding contribution
to price declines in
computers and
communications equipment
Worldwide and
US
Semiconductor
manufacturing
Computer,
communications,
and consumer
electronics
manufacturing
1992-1999 Communications equipment prices do not fall as fast compared to computer prices from
the 1992-1999 period.
End-use price decline of computers was 40.3% in 1998.
Semiconductors' price decline contributed 16.1%-23.8% of the price decline in 1998.

Intel’s Economic Impacts on the US Economy, 2008 – 2012
68
Author /
Date Title Topic / Focus / Question
Geography /
Sectors Covered Time Period Findings
Bosworth and
Triplett
(Brookings
Institution)
Spring 2001
“What’s New About the
New Economy? ICT,
Economic Growth and
Productivity”
Measures contribution of
ICT on output growth for
US Nonfarm Business
and Private Domestic
Economy
Discusses link between
ICT and multifactor
productivity
Measures role of capital
accumulation and
amount of economic
growth not explained by
growth in productive
inputs
Examines the impact on
labor productivity and
MFP
All sectors 1973-1999 Services of ICT capital provide all of the acceleration in growth of capital services in late
1990s.
ICT will continue to impact labor productivity. The source of multifactor productivity will
continue to be tied to gains in the production of ICT and demand for ICT capital.
Crafts
July 2004
"Social Savings as a
Measure of The
Contribution of a New
Technology to Economic
Growth"
Measures direct, indirect,
and social welfare
contributions of new
technologies
Western
economies
All sectors
1985-2002 Change in Social Savings of ICT as percentage of GDP was 4.1% from the 1992-1999 period
and 5.6% from the 1985-2001 period.
IT Sector has a 16.7 annual percentage consumer price decline during the 1996-2000
period.
Corrado,
Hulten and
Sichel
September
2009
“Intangible Capital and
US Economic Growth” Examines treatment of
intangible investment in
measures of GDP
Creates new sources-of-
growth (SOG) estimates
to account for growth in
output due to omission of
intangibles
ICT impact on US
economy
1973-2003 Including intangible capital in growth measures results in increases in rate of change of
output per worker.
The effects of the "ICT revolution" have not been fully encapsulated in growth figures.
The role of MFP is correspondingly diminished after accounting for intangible capital.
Labor’s income share of growth has decreased significantly over time.
Including intangible investment in real output increases estimates of the growth rate of
output per hour by 10-20% relative to baseline.
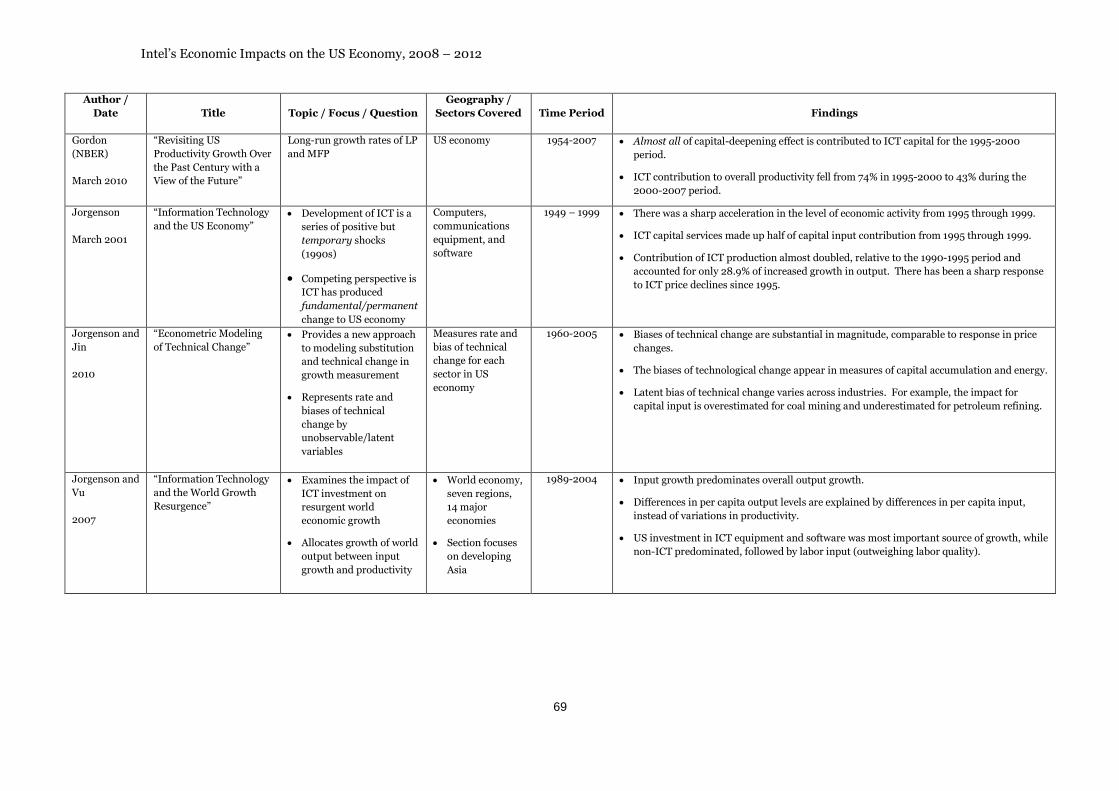
Intel’s Economic Impacts on the US Economy, 2008 – 2012
69
Author /
Date Title Topic / Focus / Question
Geography /
Sectors Covered Time Period Findings
Gordon
(NBER)
March 2010
“Revisiting US
Productivity Growth Over
the Past Century with a
View of the Future”
Long-run growth rates of LP
and MFP
US economy 1954-2007 Almost all of capital-deepening effect is contributed to ICT capital for the 1995-2000
period.
ICT contribution to overall productivity fell from 74% in 1995-2000 to 43% during the
2000-2007 period.
Jorgenson
March 2001
“Information Technology
and the US Economy” Development of ICT is a
series of positive but
temporary shocks
(1990s)
Competing perspective is
ICT has produced
fundamental/permanent
change to US economy
Computers,
communications
equipment, and
software
1949 – 1999 There was a sharp acceleration in the level of economic activity from 1995 through 1999.
ICT capital services made up half of capital input contribution from 1995 through 1999.
Contribution of ICT production almost doubled, relative to the 1990-1995 period and
accounted for only 28.9% of increased growth in output. There has been a sharp response
to ICT price declines since 1995.
Jorgenson and
Jin
2010
“Econometric Modeling
of Technical Change” Provides a new approach
to modeling substitution
and technical change in
growth measurement
Represents rate and
biases of technical
change by
unobservable/latent
variables
Measures rate and
bias of technical
change for each
sector in US
economy
1960-2005 Biases of technical change are substantial in magnitude, comparable to response in price
changes.
The biases of technological change appear in measures of capital accumulation and energy.
Latent bias of technical change varies across industries. For example, the impact for
capital input is overestimated for coal mining and underestimated for petroleum refining.
Jorgenson and
Vu
2007
“Information Technology
and the World Growth
Resurgence”
Examines the impact of
ICT investment on
resurgent world
economic growth
Allocates growth of world
output between input
growth and productivity
World economy,
seven regions,
14 major
economies
Section focuses
on developing
Asia
1989-2004 Input growth predominates overall output growth.
Differences in per capita output levels are explained by differences in per capita input,
instead of variations in productivity.
US investment in ICT equipment and software was most important source of growth, while
non-ICT predominated, followed by labor input (outweighing labor quality).

Intel’s Economic Impacts on the US Economy, 2008 – 2012
70
Author /
Date Title Topic / Focus / Question
Geography /
Sectors Covered Time Period Findings
Jorgenson, Ho
and Samuels
November
2010
“Information Technology
and US Productivity
Growth: Evidence from a
Prototype Industry
Production Account”
Adapts previous growth
analysis into NAICS,
providing greater detail
on service industries
Compare growth of ICT-
service-producing
industries relative to
hardware manufacturing
ICT hardware,
software and
services
1960-2007 Production of ICT equipment and software appeared highly volatile – boom 1995-2000,
bust, recovery 2000-07.
The period of 1995-2000 was predominated by innovation and production of
semiconductors and semiconductor-intensive computers.
The period of 2000-07 broader spectrum of ICT-using industries.
The replication of established technologies contributed to growth of capital and labor
inputs – specifically ICT hardware and software.
Jorgenson, Ho
and Stiroh
October 2002
“Growth of US Industries
and Investments in
Information Technology
and Higher Education”
Outlines sources of
growth for US economy
Incorporates ICT
industry involved with
production of equipment
and software
ICT equipment and
software
1977-2000 Growth during this period was dominated by ICT investment and higher education.
A jump in ICT investment, gains in employment of college-educated workers, and revival
of productivity growth account for resurgence of US economy since 1995.
The spread of ICT equipment and software interacting with an educated workforce lead to
increased gains in output.
Mann
March 2012
“Information Technology
Intensity, Diffusion, and
Job Creation”
References employment
dynamics of
establishments (different
sizes)
Examines intensity of
ICT hardware, software,
& services
Determines direct,
globalization, and social
surplus gains from ICT
service
All sectors 2001-2009 ICT-using sectors with above-average in ICT-intensity begin 3-times more ICT-intensive
and end up more than 4-times ICT-intensive as below-average sectors.
There is a widening dispersion of ICT-intensity across various sectors.
ICT producers make up a small part of economy, with about 3% of employment.
ICT-software and service establishments have added jobs on net. ICT remains a hot-bed of
entrepreneurship.
Small establishments that use ICT intensively account for 5% of overall employment.
Small ICT-intensive establishments accounted for 13-68% of economy-wide net job
change.
ICT-intensive establishments in manufacturing and service sectors expand and contract
employment relatively more over the business cycle than non-ICT-intensive
establishments in the same industry.
The direct and indirect gains of the US economy of lower ICT prices and increased ICT-
intensity is between $810 and $935 billion for the 2002-2007 period.
The direct and indirect gains total is approximately $1T trillion in the US economy. There
is a broad-based use of information technology hardware, software and ICT-services.

Intel’s Economic Impacts on the US Economy, 2008 – 2012
71
Author /
Date Title Topic / Focus / Question
Geography /
Sectors Covered Time Period Findings
Mann
December
2003
“Globalization of ICT
Services and White Collar
Jobs: The Next Wave of
Productivity Growth”
Determines the impact of
investment in
information technology
on prices, GDP,
employment in US
economy
Diffusion of ICT
throughout US economy
Measures impact of ICT
“package” (hardware,
software and business-
service applications)
Examines globalization
of software and ICT
services
All sectors
Measures ICT
intensity by
sector
(ICTEQ/FTE
rank)
Compares
durable
manufacturing
to construction
and health
sectors for
capital
expenditure per
employee
1998-2003 Globalized production and international trade made up 10-30% of the price decline in IT
hardware.
Lower prices led to higher productivity growth and accumulated $230 billion in GDP
(1995-2002).
ICT services and software made up 58% to 69% of ICT spending in 1993 and 2001,
respectively.
Through the economic boom of 1990s, jobs that demanded ICT skills (not just ICT-
producing firms) increased by 22%.
Tambe and
Hitt
November
2010
“Job Hopping,
Information Technology
Spillovers, and
Productivity Growth”
Examines regional
differences in returns to
ICT investments
Measures ICT spillovers
generated by ICT workers
Determines
Network/spatial
proximity effects of ICT
California
counties
4-digit SIC level
industries
2006-2007 Firms with access to an external ICT pool that is one standard deviation larger than the
mean is associated with a substantial increase in output elasticity of own ICT investment.
Firms with relatively more access to ICT investments result in positive "spillover" effects.
The output elasticity of ICT investment for non-durable goods manufacturing goods in
Northern California (a highly ICT intensive region) is 5% higher than firms in these
industries outside that region.

Intel’s Economic Impacts on the US Economy, 2008 – 2012
72
References
Aizcorbe, Ana, Kenneth Flamm, and Anjum Khurshid. "The Role of Semiconductor Inputs in IT HardwarePrice Decline: Computers vs. Communications." Federal Reserve Paper (2001).
Aizcorbe, Ana, Stephen D. Oliner, and Daniel E. Sichel. "Shifting Trends in Semiconductor Prices and thePace of Technological Change." Finance and Economics Discussion Series, Divisions of Research& Statistics and Monetary Affairs, Federal Reserve Board (2006).
Bosworth, Barry P., and Jack E. Triplett. "What's New About the New Economy? IT, Economic Growthand Productivity. "Brookings Institution 2 (2001).
Bureau of Labor Statistics. Consumer Price Index – August 2013. September 17, 2013.
Bureau of Labor Statistics. Multifactor Productivity Trends – 2011. April 9, 2013.
Bureau of Labor Statistics. Multifactor Productivity Trends in Manufacturing, 2011. June 19, 2013.
Corrado, Carol, Charles Hulten, and Daniel Sichel. "Intangible Capital and U.S. Economic Growth." TheReview of Income and Wealth 55.3 (2009).
Council of Economic Advisers. "2013 Economic Report of the President." Appendix B: Statistical TablesRelating to Income, Employment and Production. United States Government Printing Office,March 2013.
Crafts, Nicholas F. R. "Social Savings as a Measure of the Contribution of a New Technology to EconomicGrowth." Department of Economic History, London School of Economics 6.4 (2004).
Gordon, Robert J. "Revisiting U.S. Productivity Growth Over the Past Century with a View of theFuture." NBER Working Paper Series Working Paper 15834. (2010).
Jorgenson, Dale W. "Information Technology and the U.S. Economy." American EconomicAssociation 91.1 (2001).
Jorgenson, Dale W., and Hui Jin. "Econometric Modeling of Technical Change." Journal ofEconometrics 157 (2010).
Jorgenson, Dale W., and Khuong Vu. "Information Technology and the World GrowthResurgence." German Economic Review8.2 (2007).
Jorgenson, Dale W., Mun Ho, and Jon Samuels. "Information Technology and U.S. Productivity Growth:Evidence from a Prototype Industry Account." Industrial Productivity in Europe: Growth andCrisis (2010).
Jorgenson, Dale W., Mun S. Ho, and Kevin J. Stiroh. "Growth of U.S. Industries and Investments inInformation Technology and Higher Education." (2002).
Mann, Catherine L. "Globalization of IT Services and White Collar Jobs: The Next Wave of ProductivityGrowth." International Economics Policy Briefs (2003).
Mann, Catherine L. "Information Technology Intensity, Diffusion, and Job Creation." (2012).
Tambe, Prasanna and Lorin M. Hitt. “Job Hopping, Information Technology Spillovers, and ProductivityGrowth.” (2010).