Embed Size (px)
Citation preview

General rights Copyright and moral rights for the publications made accessible in the public portal are retained by the authors and/or other copyright owners and it is a condition of accessing publications that users recognise and abide by the legal requirements associated with these rights.
• Users may download and print one copy of any publication from the public portal for the purpose of private study or research. • You may not further distribute the material or use it for any profit-making activity or commercial gain • You may freely distribute the URL identifying the publication in the public portal
If you believe that this document breaches copyright please contact us providing details, and we will remove access to the work immediately and investigate your claim.
Downloaded from orbit.dtu.dk on: Apr 14, 2018
Intelligent Electric Vehicle Integration - Domain Interfaces and Supporting Informatics
Andersen, Peter Bach; Østergaard, Jacob; Poulsen, Bjarne; Gantenbein, Dieter
Publication date:2013
Document VersionPublisher's PDF, also known as Version of record
Link back to DTU Orbit
Citation (APA):Andersen, P. B., Østergaard, J., Poulsen, B., & Gantenbein, D. (2013). Intelligent Electric Vehicle Integration -Domain Interfaces and Supporting Informatics. Kgs. Lyngby: Technical University of Denmark (DTU).

Peter Bach Andersen
Intelligent Electric VehicleIntegration - Domain Interfaces
and Supporting Informatics
PhD Thesis, November 2012

Intelligent Electric Vehicle Integration - Domain Interfaces and SupportingInformatics
Author(s):Peter Bach Andersen
Supervisor(s):Prof. Jacob Østergaard, Technical University Of DenmarkAssoc. prof. Bjarne Poulsen, Technical University Of DenmarkResearch Scientist, Dieter Gantenbein, IBM Zurich Research Lab
Funding:EC power (1/3)Danish Agency for Science, Technology and Innovation (Forskningsstyrelsen) (1/3)Technical University of Denmark (1/3)
PhD school:Department of Electrical Engineering, Technical University of Denmark
Department of Electrical EngineeringCentre for Electric Power and Energy (CEE)Technical University of DenmarkElektrovej 325DK-2800 Kgs. LyngbyDenmark
www.cee.dtu.dkTel: (+45) 45 25 35 00Fax: (+45) 45 88 61 11E-mail: [email protected]
Release date: TBDClass: 1 (public)Edition: 1Comments: This report is a part of the requirements to achieve the PhD degree at
the Technical University of Denmark.Rights: c©DTU Electrical Engineering, 2012
ii

Abstract
This thesis seeks to apply the field of informatics to the intelligent integra-
tion of electric vehicles into the power system. The main goal is to release
the potential of electric vehicles in relation to a reliable, economically effi-
cient power system based on renewables.
To make intelligent EV integration a reality, it is prudent to understand
the domain in its entirety. In this thesis, this is reflected by a thorough
investigation of the stakeholders most relevant to the synergistic relationship
between electric vehicle and grid.
The first investigation addresses the power market. The market can give
system operators access to the flexibility of electric vehicles while at the
same time creating an immediate economic incentive for the EV owner. A
fleet operator is introduced to allow a fleet of electric vehicles to participate
in the markets. Examples are provided on the specific markets and services
in which the electric vehicle may be best suited to participate.
The next stakeholder investigated is the distribution system operator rep-
resenting the low voltage grid. The challenge is assessed by considering a
number of grid impacts studies. Next, a set of grid congestion mitigation
strategies are proposed with a special attention to the impact that conges-
tion would have on the operation of a fleet operator.
The third and most important stakeholder is the electric vehicle owner. The
emphasis is on the plug in patterns of a number of Danish electric vehicle
drivers. The objective is to understand how owner behavior will influence
charging flexibility. It is indicated how plug in behavior may be predicted
and how the resulting flexibility may be applied to achieve several different
goals.

After having investigated the aims, constraints and requirements for the
above stakeholders, the attention, in the second part of the thesis, is turned
to three vital topics within the field of informatics.
The first topic is the control architecture that determines the placement
and relationship between control systems used to control electric vehicle
charging. A centralised market-based architecture is chosen and the func-
tionalities needed by the control logic are defined.
The next informatics topic, communication, describes a set of protocols and
standards applicable for electric vehicle integration. The study investigates
the IEC 61850 standard and its ability to support smart charging.
Finally it is described how considerations to each of the stakeholders can
be included in the optimization done by the fleet operator. It is shown
how different markets can be considered and how stochastic optimization
can be used to model uncertainty in regards to plug in behavior and grid
congestion.
A large part of the above work have been done as contributions to the
EDISON project in which the Thesis Author has participated. During the
project the author has built a technical platform for testing several of the
technologies mentioned above, against a small fleet of electric vehicles. This
thesis is meant as an input for market players, system operators, fleet op-
erators, fellow researchers and anyone with an interest in the role of the
electric vehicle in the future power system.

Resume
Denne afhandling vil undersøge hvorledes informatik kan bruges til at un-
derstøtte en intelligent integration af elbilen i det danske elsystem. Formalet
er at frigøre elbilens potentiale i forhold til et palideligt og økonomisk opti-
meret elsystem baseret pa vedvarende energi. For at realisere en intelligent
integration er det nødvendigt, at undersøge og forsta omradet i dets helhed.
I denne afhandling er dette reflekteret i en bred undersøgelse af en række
hovedaktøre som vil have en særlig interesse i interaktionen mellem elbil
og elnet. Den første undersøgelse er rettet mod elmarket. Markedet kan
bade give systemperatører adgang til elbilens fleksibilitet samtidig med, at
elbilens ejer far en økonomisk kompensation. En fladeoperatør introduc-
eres som bindeled mellem elbiler og marked. Der gives specifikke eksempler
pa de undermarkeder og systemydelser som en elbil kan være bedst egnet
til at indga i. Den næste aktør er distributionsselskabet og det lavspænd-
ingsnet, som det repræsenterer. En række analyser af elbilers pavirkning
i denne del af elnettet er blevet undersøgt og en række strategier bliver
foreslaet for at imødega overbelastinger. Opmærksomheden er særligt rettet
mod hvorledes netbegrænsninger vil pavirke en fladeoperatør i dens ladeko-
ordinering. Den sidste og vigtigste aktør er elbilsejeren. Her undersøges el-
bilsejeres tilslutningsmønstre for at klarlægge elbilernes fleksibilitet i forhold
til intelligent opladning. Data fra en række danskeres brug af elbiler er brugt
i et studie og de første resultater fremlægges. Det indikeres ogsa hvorledes
tilslutningsmønstre kan forudsiges og den givne ladefleksibilitet bruges mod
forskellige mal. Den næste del af afhandlingen beskæftiger sig med dis-
cipliner indenfor informatik, og hvorledes de skal muliggøre integrationen
af elbiler i forhold til de hensyn, mal og begrænsninger, som er specifi-
ceret af ovenstaende aktører. Først behandles den kontrolarkitektur som

skal definere placeringen og forholdet mellem de systemer, som skal kon-
trollere en eilbils ladeadfærd. Der argumenters for brugen af en centralis-
eret markedsbaseret arkitektur og der gives eksempler pa de funktioner, som
den nødvendige styringslogik skal implementere. Dernæst beskives mulige
kommnikationsløsninger i form af en række protokoller og standarder. Dette
inkluderer en undersøgelse af IEC 61850 standarden og dens evne til at un-
derstøtte intelligent elbilsintegration. Det sidste emne inden for informatik
er den optimering af ladeadfærd, som en fladeoperatør vil udføre under
hensynstagen til de tidligere beskrevne aktører. Det beskrives hvorledes
usikkerhed i forhold til distributionsnettet og elbilsejeren kan inkluderes i en
stokastisk optimeringmodel, og hvorledes flere typer markeder kan benyttes
til at reducere prisen for opladning. En stor del af de ovenstaende emner er
lavet som bidrag til EDISON projektet i hvilket denne afhandlings forfatter
har deltaget. Under samme projekt har forfatteren udviklet en teknisk plat-
form, ved hjælp af ovenstaende teknologier, der bliver brugt til at demon-
strere intelligent opladning mod en række elbiler. Denne afhandling er ment
som input til markedsaktører, fladeoperatører, systemoperatører, forskere
og alle, som har en interesse i elbilens rolle i fremtidens elnet.

Acknowledgements
I would like to start by paying tribute to the parties which have provided fi-
nancial support to my PhD. The opportunity of pursuing a PhD and having
the financial backup to explore the field through international conferences
and external stays is a privilege not to be taken for granted.
I extend my heartfelt gratitude to my supervisors. To Bjarne, who origi-
nally introduced my to CEE and without whom I would not have written
this thesis. To Jacob, whose dedication to the field and his center have been
highly encouraging. To Dieter, whose passion for innovation is both conta-
gious and inspirational. To Chresten who, while not an official supervisor,
with his academic integrity and friendly nature has been a great support
throughout these three years.
To my colleagues and fellow researches from whom I have received a lot of
constructive input. Thank you, Salva, Ole, Andreas, Olle, Bernhard, Juan,
Shi, Kai, Junjie, Pierre and everyone at CEE.
To my close colleagues in our small EV smart grid integration group, Francesco
and Anders. I will always remember our small office where great ideas have
been born and plants have gone to die.
Finally I thank my family, my caring parents and wonderful wife. Thanks
for putting up with odd working hours and for politely listening to my
lengthy rants about my research.
To all of you: THANK YOU.

The LimerickPlug them in
Charge them up
From your own plug socket
Proudly put your foot down
As you drive around
In your electric rocket
Source: readingjuice.co.uk
ii

Contents
List of Figures vii
List of Tables ix
Glossary xi
1 Introduction 1
1.1 EV Integration - Exploring a New Paradigm . . . . . . . . . . . . . . . . 1
1.1.1 The Smart Grid . . . . . . . . . . . . . . . . . . . . . . . . . . . 2
1.1.2 Distributed Energy Resources and Virtual Power Plants . . . . . 2
1.1.3 The Electric Vehicle and Utilization Concepts . . . . . . . . . . . 3
1.2 Quantifying the Benefits . . . . . . . . . . . . . . . . . . . . . . . . . . . 5
1.2.1 Immediate Benefits to Environment and Health . . . . . . . . . . 5
1.2.2 Benefits Achieved trough Intelligent Integration . . . . . . . . . . 7
1.3 Projects and Coordinated Work Efforts within EV Research . . . . . . . 7
1.4 This PhD Study and its Contributions . . . . . . . . . . . . . . . . . . . 9
1.4.1 Thesis Objectives and Scope . . . . . . . . . . . . . . . . . . . . 9
1.4.1.1 Domain Interfaces . . . . . . . . . . . . . . . . . . . . . 10
1.4.1.2 Supporting Informatics . . . . . . . . . . . . . . . . . . 11
1.4.2 Thesis Documentation - Content and Structure . . . . . . . . . . 12
1.4.2.1 Publication list . . . . . . . . . . . . . . . . . . . . . . . 13
1.4.2.2 Thesis Structure . . . . . . . . . . . . . . . . . . . . . . 16
2 Market Integration 19
2.1 Introduction . . . . . . . . . . . . . . . . . . . . . . . . . . . . . . . . . . 19
2.2 Related Work Within Area . . . . . . . . . . . . . . . . . . . . . . . . . 20
iii

CONTENTS
2.3 Thesis Work and Contributions . . . . . . . . . . . . . . . . . . . . . . . 21
2.3.1 Market Integration in EDISON . . . . . . . . . . . . . . . . . . . 22
2.3.2 Comparative Study between Ancillary Service Markets . . . . . . 23
2.3.3 Providing Ancillary Services in Denmark . . . . . . . . . . . . . 26
2.4 Sub-conclusion . . . . . . . . . . . . . . . . . . . . . . . . . . . . . . . . 28
2.4.1 Contributions and Results by the Thesis . . . . . . . . . . . . . . 28
2.4.2 Discussion and Recommendations . . . . . . . . . . . . . . . . . 29
3 Grid Integration 31
3.1 Introduction . . . . . . . . . . . . . . . . . . . . . . . . . . . . . . . . . . 31
3.2 Related Work within Area . . . . . . . . . . . . . . . . . . . . . . . . . . 33
3.3 Thesis Work and Contributions . . . . . . . . . . . . . . . . . . . . . . . 35
3.4 Sub-conclusion . . . . . . . . . . . . . . . . . . . . . . . . . . . . . . . . 37
3.4.1 Contributions and Results by the Thesis . . . . . . . . . . . . . . 37
3.4.2 Discussion and Recommendations . . . . . . . . . . . . . . . . . 38
4 EV Owner 41
4.1 Introduction . . . . . . . . . . . . . . . . . . . . . . . . . . . . . . . . . . 41
4.2 Related Work within Area . . . . . . . . . . . . . . . . . . . . . . . . . . 43
4.3 Thesis Work and Contributions . . . . . . . . . . . . . . . . . . . . . . . 45
4.3.1 Simple Prediction based on Driving Data . . . . . . . . . . . . . 45
4.3.2 Early Investigation of Real Driving Data . . . . . . . . . . . . . . 47
4.3.3 Plug in Patterns: Seasonal Changes . . . . . . . . . . . . . . . . 49
4.3.4 Plug in Patterns: Familiarization . . . . . . . . . . . . . . . . . . 50
4.3.5 Plug in Variance Case and Relation to Smart Charging . . . . . 52
4.4 Sub-conclusion . . . . . . . . . . . . . . . . . . . . . . . . . . . . . . . . 53
4.4.1 Contributions and Results by the Thesis . . . . . . . . . . . . . . 55
4.4.2 Discussion and Recommendations . . . . . . . . . . . . . . . . . 55
5 Control Architecture 57
5.1 Introduction . . . . . . . . . . . . . . . . . . . . . . . . . . . . . . . . . . 57
5.2 Related Work within Area . . . . . . . . . . . . . . . . . . . . . . . . . . 59
5.3 Thesis Work and Contributions . . . . . . . . . . . . . . . . . . . . . . . 61
5.3.1 System Architecture of EDISON . . . . . . . . . . . . . . . . . . 61
iv

CONTENTS
5.3.2 High-level Functions . . . . . . . . . . . . . . . . . . . . . . . . . 62
5.4 Sub-conclusion . . . . . . . . . . . . . . . . . . . . . . . . . . . . . . . . 64
5.4.1 Contributions and Results by the Thesis . . . . . . . . . . . . . . 64
5.4.2 Discussion and Recommendations . . . . . . . . . . . . . . . . . 65
6 Communication 67
6.1 Introduction . . . . . . . . . . . . . . . . . . . . . . . . . . . . . . . . . . 67
6.2 Related Work within Area . . . . . . . . . . . . . . . . . . . . . . . . . . 68
6.3 Thesis Work and Contributions . . . . . . . . . . . . . . . . . . . . . . . 70
6.3.1 Research on the IEC 61850 . . . . . . . . . . . . . . . . . . . . . 70
6.3.1.1 Using REST Services . . . . . . . . . . . . . . . . . . . 71
6.3.1.2 Data Model . . . . . . . . . . . . . . . . . . . . . . . . . 72
6.3.1.3 Test of IEC 61850/REST Implementation . . . . . . . . 73
6.4 Sub-conclusion . . . . . . . . . . . . . . . . . . . . . . . . . . . . . . . . 75
6.4.1 Contributions and Results by the Thesis . . . . . . . . . . . . . . 75
6.4.2 Discussion and Recommendations . . . . . . . . . . . . . . . . . 75
7 Optimization 79
7.1 Introduction . . . . . . . . . . . . . . . . . . . . . . . . . . . . . . . . . . 79
7.2 Related Work within Area . . . . . . . . . . . . . . . . . . . . . . . . . . 81
7.3 Thesis Work and Contributions . . . . . . . . . . . . . . . . . . . . . . . 82
7.3.1 Cost Minimization . . . . . . . . . . . . . . . . . . . . . . . . . . 82
7.3.2 Introducing Markets . . . . . . . . . . . . . . . . . . . . . . . . . 83
7.3.3 Introducing Uncertainty - EV Owner Behavior . . . . . . . . . . 85
7.3.4 Introducing Uncertainty - Grid Constraints . . . . . . . . . . . . 87
7.4 Sub-conclusions . . . . . . . . . . . . . . . . . . . . . . . . . . . . . . . . 89
7.4.1 Contributions and Results by the Thesis . . . . . . . . . . . . . . 89
7.4.2 Discussion and Recommendations . . . . . . . . . . . . . . . . . 90
8 Conclusions 91
8.1 Domain Interfaces . . . . . . . . . . . . . . . . . . . . . . . . . . . . . . 91
8.2 Supporting Informatics . . . . . . . . . . . . . . . . . . . . . . . . . . . . 94
8.3 Intelligent EV Integration - Closing Remarks . . . . . . . . . . . . . . . 96
v

CONTENTS
9 Core publications 97
A Coordination Strategies for Distribution Grid Congestion Management
in a Multi-Actor, Multi-Objective Setting . . . . . . . . . . . . . . . . . 98
B A comparison of electric vehicle integration projects . . . . . . . . . . . 107
C Smartly charging the electric vehicle fleet . . . . . . . . . . . . . . . . . 115
D Implementation of an Electric Vehicle Test Bed Controlled by a Virtual
Power Plant for Contributing to Regulating Power Reserves . . . . . . . 144
E Prediction and optimization methods for electric vehicle charging sched-
ules in the EDISON project . . . . . . . . . . . . . . . . . . . . . . . . . 152
F Facilitating a generic communication interface to distributed energy re-
sources - Mapping IEC 61850 to RESTful Services . . . . . . . . . . . . 160
References 167
vi

List of Figures
1.1 Controlled charging . . . . . . . . . . . . . . . . . . . . . . . . . . . . . 4
1.2 Active power service . . . . . . . . . . . . . . . . . . . . . . . . . . . . . 5
1.3 Energy backup . . . . . . . . . . . . . . . . . . . . . . . . . . . . . . . . 5
1.4 CO2 emission comparison . . . . . . . . . . . . . . . . . . . . . . . . . . 6
1.5 Domain overview . . . . . . . . . . . . . . . . . . . . . . . . . . . . . . . 11
1.6 Thesis structure . . . . . . . . . . . . . . . . . . . . . . . . . . . . . . . . 17
2.1 Market integration comparison . . . . . . . . . . . . . . . . . . . . . . . 20
2.2 Market integration in EDISON . . . . . . . . . . . . . . . . . . . . . . . 22
2.3 Smart charging . . . . . . . . . . . . . . . . . . . . . . . . . . . . . . . . 23
2.4 Table-To-Grid setup . . . . . . . . . . . . . . . . . . . . . . . . . . . . . 27
2.5 EV setup . . . . . . . . . . . . . . . . . . . . . . . . . . . . . . . . . . . 27
3.1 Map of base-case operations . . . . . . . . . . . . . . . . . . . . . . . . . 35
3.2 Advance capacity allocation . . . . . . . . . . . . . . . . . . . . . . . . . 37
4.1 Expected night availability as function of variance . . . . . . . . . . . . 45
4.2 Implementation of predictions . . . . . . . . . . . . . . . . . . . . . . . . 46
4.3 Full sample of vehicles . . . . . . . . . . . . . . . . . . . . . . . . . . . . 47
4.4 Plug in periods . . . . . . . . . . . . . . . . . . . . . . . . . . . . . . . . 48
4.5 Winter vs. summer month . . . . . . . . . . . . . . . . . . . . . . . . . . 49
4.6 Initial vs. mature use . . . . . . . . . . . . . . . . . . . . . . . . . . . . 51
4.7 SOC distribution for case EV . . . . . . . . . . . . . . . . . . . . . . . . 52
4.8 Plug in/out cumulative distributions and input for value functions . . . 54
5.1 Centralized and distributed architecture . . . . . . . . . . . . . . . . . . 58
vii

LIST OF FIGURES
5.2 Function-based design for a GVPP . . . . . . . . . . . . . . . . . . . . . 60
5.3 Comparison of architectures . . . . . . . . . . . . . . . . . . . . . . . . . 60
5.4 Architecture in EDISON . . . . . . . . . . . . . . . . . . . . . . . . . . . 62
5.5 High-level centralized fleet operator functionalities . . . . . . . . . . . . 63
6.1 Project comparison of communication technologies . . . . . . . . . . . . 69
6.2 The 61850 standard . . . . . . . . . . . . . . . . . . . . . . . . . . . . . 71
6.3 Mapping to URL path . . . . . . . . . . . . . . . . . . . . . . . . . . . . 72
6.4 Logical nodes used in implementation . . . . . . . . . . . . . . . . . . . 73
6.5 Communication setup in EDISON . . . . . . . . . . . . . . . . . . . . . 74
6.6 Test of IEC 61850 communication . . . . . . . . . . . . . . . . . . . . . 74
7.1 Optimization approach . . . . . . . . . . . . . . . . . . . . . . . . . . . . 80
7.2 Markets and stages . . . . . . . . . . . . . . . . . . . . . . . . . . . . . . 84
8.1 Chapter topic relationships . . . . . . . . . . . . . . . . . . . . . . . . . 96
viii

List of Tables
2.1 A/S market comparison . . . . . . . . . . . . . . . . . . . . . . . . . . . 24
4.1 Plug in period averages . . . . . . . . . . . . . . . . . . . . . . . . . . . 49
4.2 Plug in period seasonal averages . . . . . . . . . . . . . . . . . . . . . . 50
4.3 Plug in period familiarization averages . . . . . . . . . . . . . . . . . . . 51
7.1 Symbol overview . . . . . . . . . . . . . . . . . . . . . . . . . . . . . . . 82
ix

GLOSSARY
x

Glossary
A/S Ancillary Service
CVPP Commercial Virtual Power Plant
DER Distributed Energy Resource
DSO Distribution System Operator
ENTSO European Network of Transmission
System Operators for Electricity
EV Electric Vehicle
EVSE Electric Vehicle Supply Equipment
FDR Frequency controlled Disturbance
Reserve
FNR Frequency controlled Normal opera-
tion Reserve
GAMS General Algebraic Modeling System
GVPP Generic Virtual Power Plant
ICE Internal Combustion Engine
ICT Information and communication
technology
IEC International Electrotechnical Com-
mission
OEM Original Equipment Manufacturer
PLC Power Line Communication
REST REpresentational State Transfer
RTO Regional Transmission Organization
SLA Service Level Agreement
SOA Service Oriented Architecture
SOAP Simple Object Access Protocol
SOC State-Of-Charge
TLS Transport Layer Security
TSO Transmission System Operator
TVPP Technical Virtual Power Plant
V2G Vehicle-To-Grid
VPP Virtual Power Plant
xi

GLOSSARY
xii

1
Introduction
1.1 EV Integration - Exploring a New Paradigm
Since Scottish inventor Robert Anderson built the first electric vehicle (EV) in 1832, the
world has seen several attempts at electrifying the transportation sector. Successful EV
introduction represents a challenge of daunting proportions but with an extraordinary
potential for society. A challenge which can only be solved through a large set of
disciplines spanning such fields as anthropology, politics, business, and technology.
In the following, the term “EV Integration” will be used to cover the technological
challenges and describe the solutions that engineers and technicians working within
electric components, power system design, informatics, and mathematics have to com-
bine in a number of cross-disciplinary solutions. EV Integration research should, for
instance, find solutions for:
• Infrastructure
• Roaming
• New EV services
• Smart grid integration
The goal of the latter area would be to minimize the adverse effects of introducing
EVs as a new load in the power system and, instead, promote them as an active asset.
This would ultimately reduce society’s cost, monetary as well as environmental, for
the electrification of transportation. To achieve the above the EV itself would have
1

1. INTRODUCTION
to be equipped with capabilities so that it through information and communication
technology (ICT) can receive stimuli from its surrounding environment and through
logic adjust its charging or discharging behavior.
The main EV integration challenge addressed in this thesis is that of intelligent EV
integration into the power system as part of the smart grid concept.
1.1.1 The Smart Grid
The “smart grid” is said to be a trend of huge proportions in the Western world, a
significant revolution in the world of power and energy, a major paradigm shift in
markets, and one of the biggest engineering challenges of the century. It is, however,
also complex, early in its development and may have to be carried out in iterations as
part of an evolution.
The standard organisation “IEEE” gives the following definition: “The ”smart grid”
has come to describe a next-generation electrical power system typified by the increased
use of communications and information technology in the generation, delivery and con-
sumption of electrical energy.” (1)
Academia has put forward countless suggestions as to what this increased use of
ICT may be used for. Practical applications pursued at the moment include intelligent
metering, home automation, distributed production from Photovoltaics (PV), micro
combined heat and power units (CHP), and the control of loads such as air conditioning
(A/C), electric heating and EV charging.
The latter type of units, decentralized production and controllable loads, is often
grouped under the umbrella of a common term: distributed energy resources (DER).
DER is geographically distributed units with a resource potential. DER integration
constitutes a large part of smart grid research.
1.1.2 Distributed Energy Resources and Virtual Power Plants
As more DERs connect to the various levels of the power system, a new challenge for
the system operators - DSOs and TSOs - emerges. An interesting feature of DERs,
however, is that a sufficient degree of controllability and intelligence can elevate them
from being a challenge to the grid to, instead, being an asset. This raises the question
as to how and to what end DERs should be controlled. While the purposes typically
explored in academia relates to cost reduction, environmental and/or socio-economic,
2

1.1 EV Integration - Exploring a New Paradigm
it remains a question what purpose will bring about the greatest value. One answer to
the question as to how to coordinate the behavior of DERs, one viable solution is the
use of a Virtual Power plant (VPP)
A VPP describes an aggregated system in which many DERs are partly or fully
controlled by a single coordinating entity. For the individual DER, the VPP can hide
the complexity of market interactions and help meet market requirements that the
individual DER would be too small to accommodate. For the power system operators
and market players, the VPP aggregator could hide the complexity of interfacing with
a host of small individual units. The name “Virtual power plant” explicitly refers to a
VPP aggregator’s ability to mimic a traditional large power plant in behavior. VPPs
have been researched as part of the European FENIX project (2) and in academic
publications such as (3, 4).
When applied to EV integration the term “fleet operator” is often used for the
aggregating entity that controls the DERs as part of the VPP concept. This use of the
VPP concept can be found in the EDISON project and is described in a publication
co-authored by the Thesis Author (5). In this thesis both the term “fleet operator” and
“aggregator” will be used. A “fleet operator” can be said to describe the role taken by
a “real” actor operating in the current market and business space while “aggregator”
is closer to the more generic academic definition of the same entity. Currently, busi-
nesses in Denmark engaged in providing charging-related services to EV owners uses
terms such as “Electric Mobility Operator”to describe themselves. Chapter 5, “Control
architecture” will go into more detail with the structure of a VPP.
1.1.3 The Electric Vehicle and Utilization Concepts
While the EV is similar to other DERs according to the above definition, some of its
properties make it of particular interest. The main defining properties of an EV that
elevates it potential as a DER is that it is:
1. Expected to be grid-connected and available most of the time with a high degree
of flexibility
2. A high-power, quick-response flexible load with an attached storage and possibly
with bi-directional power flow capabilities
3

1. INTRODUCTION
For the first property the following can be observed. As other types of household
attached DERs, such as CHP, Wind, and roof-installed solar, the unit is acquired and
installed to meet a purpose separate from its potential functions in a smart grid context.
For the EV this primary function is transportation which is also the main limiting
factor in the degree to which the EV can be used for smart grid related matters. It has,
however, been established that a typical vehicle is parked for as much as 23 hours a
day in a publication by Kempton (6), and that these periods, especially at night, follow
certain patterns that are predictable to an extent which allow EV charging to pursue
other purposes than reaching a adequate energy level for the next drive. Kempton
therefore describes the EV as “a vastly underutilized resource”.
The second property owes itself to the fact that the DER in question is built for
transportation; i.e., it uses a drive train system capable of transferring large quantities
of power to and from the battery on short notice. Generally speaking, it does not matter
whether energy is transferred back and forth between the battery and motor due to
acceleration and regenerative braking or between battery and grid as part of smart
grid integration. It is also likely that batteries will become better at accommodating
shallow mid-State-Of-Charge cycles. Having established the EV as a DER with a high
grid potential, the remaining question is this: what should this potential be used for.
In the remainder of this thesis the term “intelligent EV utilization concept” is meant
to cover all services and goals that the manipulation of the direction, rate and timing
of the power and energy exchanged between vehicle and power grid can accommodate.
The following introduces three EV capabilities that can each support a range of
utilization concepts for various levels of the power system.
Controlled charging Charging is delayed or advanced in time based on, e.g.,
energy cost or renewable contents. A specific utilization concept could be following
a dynamic energy tariff. Controlled charging is often described by the term “Smart
charging”.
Figure 1.1: Controlled charging - Illustrative example of controlled charging behavior
4

1.2 Quantifying the Benefits
Active power services Short-duration charging and, possibly, discharging opera-
tions. This capability can be used towards ancillary services - either the ones present
in the current power market or new types of ancillary services aimed at the local dis-
tribution net.
Figure 1.2: Active power service - Illustrative example of active power service behavior
Energy backup Using a portion of the EV battery capacity to store energy which
is to be delivered back to the surrounding power system at a later point in time. This
capability can be used towards the utilization concept of storing wind energy at hours
with low demand.
Figure 1.3: Energy backup - Illustrative example of energy backup behavior
The above types of behavior can be employed in either system-wide or local grid
utilization concepts. Examples of the former is energy backup for transmission grid
attached renewables and energy market prices. Local grid concepts could be voltage
control, congestion mitigation, and co-existence with other DERs. This thesis will
touch upon the above utilization concepts throughout this thesis.
1.2 Quantifying the Benefits
The benefits that the introduction of electric vehicles can accommodate can be di-
vided up between immediate environment and health benefits and the additional socio-
economic benefits that can be obtained through smart grid integration and EV intelli-
gence.
1.2.1 Immediate Benefits to Environment and Health
On a local level, EV introduction will reduce particle emission and street noise. Both of
these pollutants are proven to have adverse effects on the public health. Noise pollution
5

1. INTRODUCTION
have been investigated by WHO in (7) and particle pollution by Aarhus University in
(8). Besides from the intangible human consequences, the result is an increase in the
cost of public health care and a decrease in workforce productivity.
On a national level the introduction of EVs can reduce oil dependency and green
house gas emission, respectively, thereby reducing human-made contributions to global
warming. The latter is true not only when considering the pollution-free electric motor,
but also when considering how the energy, on which it runs, was generated. The term
“Well-To-Wheel” C02-emission encompasses the sum of produced CO2 by all parts of
the energy production chain.
Based on a Well-To-Wheel calculation, a typical EV would produce less than half
the CO2 than a traditional ICE car in the same size-class as seen in figure 1.4.
Figure 1.4: CO2 emission comparison - The EV emission is based on C02 productionof energy generation in western Denmark (0,449 g CO2/Wh), data source: Dansk ElbilKomite (9)
Electrifying the entire Danish transport sector would reduce the national C02 emis-
sion considerably. This means that the integration of EVs is crucial to meeting the
milestones/targets of 2020, 2030 and 2050 for green house gas emission issued by the
Danish government.
6

1.3 Projects and Coordinated Work Efforts within EV Research
1.2.2 Benefits Achieved trough Intelligent Integration
A unique feature of the EV is that it, after the point of acquisition, can become “cleaner”
over time. This is true if the renewable component of a nation’s power generation
increases over time and especially if the intelligence of the EV promotes and accelerates
an increased penetration of renewable production.
The Danish TSO, EnergiNet.dk, have released a report on efficient use of wind
energy (10) stating the following:
”The analysis shows that heat pumps and EVs have a big potential in creating a
new and large flexible energy demand which mean that a larger portion of wind power
can be used inside Denmark. Thereby Co2-emissions will be reduced considerably”
Another benefit related to intelligent EV integration is the socio-economic costs of
implementing and operating a next-generation power system.
The general cost of the future power system has been investigated in another En-
erginet.dk report (11) which estimates a DKK 6.1 billion net-earning for Denmark if
smart grids are implemented. The report stresses that the services provided by”green
and flexible vehicles” are essential for realizing this potential. Energinet.dk report (10)
even more explicitly mentions EV integration. From the report summary:
”It is furthermore of vital importance that solutions are developed that supports an
intelligent interaction between electric vehicles, heat pumps and the power system..”
”..If this intelligence is not developed in the communication between power system
and the new flexible demand, the socio-economic benefit of electric vehicle and heat
pump integration will be reduced by approximately DKK 1.7 billion per year.”
There is therefore good reason to promote the introduction of EVs in society and
pursue an intelligent integration into the power system.
1.3 Projects and Coordinated Work Efforts within EV
Research
Over the last couple of years, EV integration has received a lot of attention from both
academia and industry. A lot of research groups have conducted and published research
which is both relevant and valuable to EV integration. This section will mention some
of the research groups and projects which have made significant contributions to the
field
7

1. INTRODUCTION
The EDISON project (12), “Electric vehicles in a Distributed and Integrated market
using Sustainable energy and Open Networks”, was a research project whose goal it was
to develop optimal solutions for EV integration, including network issues, market solu-
tions, and optimal interaction between different energy technologies. The project has
thoroughly investigated a long list of issues relating to EV introduction and integration.
The e-Mobility Berlin project have made significant contributions to the field (13).
The project was initiated by Daimler AG (Mercedes-Benz) and the utility RWE. Among
the participants are also battery, Electric Vehicle Supply Equipment (EVSE) and other
auto-mobile original equipment manufacturers (OEM). The project introduced a fleet
of 100 EVs supplied by Daimler and 500 EVSEs which were delivered and powered by
RWE in the streets of Berlin for a large field test. The project was primarily aimed
at developing and testing standardized solutions for electric vehicles and contributed
towards infrastructure standardization in Europe.
The Vattenfall Wind-to-vehicle (W2V) project (14) was a cooperation initiative
between BMW and the energy company Wattenfall. The project deserves mention
for being among the first to demonstrate the ability of a group of EVs to participate
in a system-wide utilization concept - charging based on wind production. For the
demonstration, a complete ICT system was set up to coordinate a number of “mini-e”
vehicles. The same group has moved on to do grid impact studies and to demonstrate
that the coordination of EVs may also benefit the distribution grid.
The MERGE project (15) was launched as an “evaluation of the impacts that
EV will have on the EU electric power systems regarding planning, operation and
market functioning.”. Among the notable contributions of this project was its grid
impact studies that in great detail, and for different topologies and EV integration
levels showed the impact of EV introduction on European grids. The projects also
defined a stage-based roadmap for the realisation of EV smart charging schemes, short
and long-term.
A research group lead by Professor Willett Kempton, University of Delaware, has
made great contributions to EV research (16). Among the contributions are the demon-
stration on market integration via Vehicle-To-Grid technology and the economic as-
sessment of regulation power provision. Technically, the group has contributed with
solutions in the form of control systems and power electronics for EV monitoring and
8

1.4 This PhD Study and its Contributions
control as well as communication solutions and the application of agent theory in the
coordination of EV charging.
IBM researchers Carl Binding and Olle Sundstroem have worked on optimization
methods to support smart charging. The researchers have considered a wide range of
relevant parameters such as grid congestion issues, EV owner behavior, market trading,
and battery lifetime issues. To this end they have used a equally long array of meth-
ods such as optimization (linear, quadratic etc.), grid modelling (load flow, network
model etc.), battery models, and statistical techniques. The publications from these
researchers constitute a great contribution to the field in general and have been an
inspiration for parts of this thesis.
The International Electrotechnical Commission (IEC) have made standards relevant
to EV integration(17), some of the most significant have been mentioned in several of
the core publications of this thesis. The standards put forward by IEC can greatly
influence the shape and direction of the field in Europe. The above is also true for the
European Committee for Electro technical Standardization (CENELEC) (18).
The above groups and projects has in several cases produced academic results which
are useful as input to this thesis. These inputs will be described in the “related work”
sections in each of the following chapters.
1.4 This PhD Study and its Contributions
This section outlines the exact goals of this study and the contributions made to address
them. The objectives pursued by the Thesis Author are described in the “Thesis
objectives and scope” section and the “Thesis documentation - content and structure”
section describes the written contributions that documents how the PhD author have
sought to meet the objectives. This is done by listing all the papers and book chapters
that have been published and then map a chosen subset - the core publications - to the
structure of this main thesis report.
1.4.1 Thesis Objectives and Scope
Solving any type of engineering challenge can be split into two basic steps: Firstly, a
thorough investigation of the domain in which the challenge exist is done, and, sec-
9

1. INTRODUCTION
ondly, the best possible solutions are recommended. This basic, but very fundamental,
approach allows for the definition of the two main objectives of this thesis:
1. To investigate the main stakeholders within intelligent EV integration and the
objectives, considerations and constraints they each represent.
2. To identify and find the best contemporary informatics technologies to solve the
challenge of intelligent EV integration.
By addressing the above objectives the main contribution of the thesis becomes an
investigation of the domain in which the EVs will be integrated and the identification
of appropriate informatics to carry out such an integration.
In the end, the thesis is meant to consolidate the EVs role in the ultimate, over-
arching mission of smart grid research: the development of a reliable, sustainable and
economic power system.
This thesis divides the work done into two parts. The first part describes the domain
investigation and the second deals with the investigated informatics solutions. Each
part is described in the following sections.
1.4.1.1 Domain Interfaces
As more and more EVs connect to the power system, the foundation for relationships
and dependencies to a new set of stakeholders is established.
Entities like fleet and system operators will have business models, objectives and
constraints that may influence the charging behavior of an EV in many different ways.
These new relationships should be implemented in a way that is financially beneficial,
convenient and acceptable to the EV owner.
The domain considered in this thesis is grid-centric with a focus on three levels.
First there is the consumer-level representing the individual grid connection point.
This level is included since understanding the behavioral patterns, value drivers and
requirements of prosumers, in this case EV owners, is a clear necessity for EV integra-
tion. Next, the distribution level is included due to the very real operational challenges
and opportunities that EV introduction may entail in this part of the system. Finally,
on the system-wide level, the market is included to represent system-wide energy and
10

1.4 This PhD Study and its Contributions
power services since the market may drive the economic incentives behind the various
intelligent EV utilization concepts.
The domain along with the levels described above is shown in figure 1.5
Figure 1.5: Domain overview - Main stakeholders and objectives within intelligent EVintegration
The stakeholders considered by this thesis, as part of the domain interfaces inves-
tigation becomes:
• Market player (Market integration)
• Distribution system operator (Grid integration)
• EV owner
Each of the above stakeholders is covered by a chapter in this thesis.
1.4.1.2 Supporting Informatics
Informatics, as part of computer science, covers the structure, algorithms, behavior,
and interactions of natural and artificial systems that store, process, access, and com-
municate information. The thesis will apply part of the academic field of informatics
to the specific application of EV integration.
11

1. INTRODUCTION
The topics selected cover the major aspects of the information value chain: archi-
tectural system relationships between entities collecting and exchanging data; the ways
in which the data is formatted and sent as part of the communication process between
said entities; and, finally, the ultimate goal of predicting future events and achieve value
through optimization.
The supporting informatics topics of this thesis becomes:
• System architecture
• Communication
• Optimization
Each of the above topics are covered by a chapter in this thesis.
This thesis and its publications have attempted to illuminate how the domain study
of EV owner, grid and market integration have impacted recommendations within
choice of technologies. The conclusions chapter will illustrate this relationship.
1.4.2 Thesis Documentation - Content and Structure
This main thesis document, made up by the following chapters and sections, is publication-
based, i.e., this “enveloping document” lists and references a set of publication made
throughout the PhD study and relies on them as a direct part of the thesis work doc-
umentation.
Each chapter have primarily been defined to cover a meaningful portion of the
overall PhD thesis objectives, but will also be closely linked to one or more publications.
Since most of the documentation is left to the publications, the main objective of
the following chapters will be to summarize findings, relate the work to that done by
others, add possible corrections, supply more context and perspective, and finally to
relate each topic to the field of intelligent EV integration in its entirety.
Two exceptions are chapter four “EV owner” and chapter seven “Optimization”
where new material has been included which has not been documented elsewhere. The
following sections will describe the contributions made by the author in terms of pub-
lications and project contributions, list a number of core publications with special
relevance to the thesis and finally map them to the thesis structure.
12

1.4 This PhD Study and its Contributions
1.4.2.1 Publication list
A subset of the publications by the Thesis Author has been selected as core publications.
A core publication is a written contribution with special relevance to the objectives
defined by the thesis. The letter next to the publication will be used as a identifier
throughout the document.
APeter Bach Andersen, Junjie Hu, and Kai Heussen.Coordination strategies for distribution grid congestion manage-ment in a Multi-Actor, Multi-Objective Setting. In Proc. 3rd IEEEPES Innovative Smart Grid Technologies (ISGT) Europe, Berlin, 2012.
BPeter Bach Andersen, Rodrigo Garcia-Valle, and Willett Kempton.A Comparison of Electric Vehicle Integration Projects. In Proc. 3rdIEEE PES Innovative Smart Grid Technologies (ISGT) Europe, Berlin, 2012.
C
Peter Bach Andersen, Einar Bragi Hauksson, Anders Bro Pedersen, DieterGantenbein, Bernhard Jansen, Claus Amtrup Andersen, and Jacob Dall.Smartly charging the electric vehicle fleet. In book “Smart Grid Ap-plications, Communications, and Security”, Wiley-VCH (ISBN: 978-1-1180-0439-5), pages: 381-408, 2012.
D
Francesco Marra, Dario Sacchetti, Anders Bro Pedersen, Peter Bach Andersen,Chresten Træholt, and Esben Larsen.Implementation of an Electric Vehicle Test Bed Controlled by aVirtual Power Plant for Contributing to Regulating Power Reserves.In Proc. IEEE Power and Energy Society General Meeting, San Diego, 2012.
E
Andreas Aabrandt, Peter Bach Andersen, Anders Bro Pedersen, Shi You,Bjarne Poulsen, Niamh O’Connell, and Jacob Østergaard.Prediction and optimization methods for electric vehicle chargingschedules in the EDISON project. In Proc. IEEE PES Innovative SmartGrid Technologies (ISGT), (ISBN: 9781457721588), Washington, D.C., 2012.
F
Anders Bro Pedersen, Einar Bragi Hauksson, Peter Bach Andersen, BjarnePoulsen, Chresten Træholt, and Dieter Gantenbein.Facilitating a generic communication interface to distributed energyresources - Mapping IEC 61850 to RESTful Services. In Proc. FirstIEEE International Conference on Smart Grid Communications (SmartGrid-Comm), (ISBN: 978-1-4244-6510-1), Gaithersburg , 2010.
13
1. INTRODUCTION
The core publications are all publications to which the Thesis Author have con-
tributed with a significant part of the work. An exception is the core publication D by
Marra, which have been included since parts of the demonstrations described consti-
tute proof-of-concept of work done by the author. All core publications are appended
to this document. The Thesis Author have also made contributions to a number of
other publications not directly included in or referenced by this thesis. They are not be
included since the Thesis Authors role is smaller than in the core publication and/or
the topic they address falls outside the scope of this thesis document. The following is
the full list of publications to which the author have made contributions, excluding the
core publications. (Begins on the following page...)
14

1.4 This PhD Study and its Contributions
Anders Bro Pedersen, Peter Bach Andersen, Joachim Skov Johansen, David Rua,Jos Ruela, and Joo A. Peas Lopes.ICT solutions to support EV deployment. In Book “Electric Vehicle Integra-tion Into Modern Power Networks”, Springer, 2013.
Shi You, Junjie Hu, Anders Bro Pedersen, Peter Bach Andersen, Claus NygaardRasmussen, and Seung-Tae Cha.Numerical Comparison of Optimal Charging Schemes for Electric Vehi-cles. In Proc. Proceedings of IEEE PES General Meeting, San Diego, 2012.
Qiuwei Wu, Arne Hejde Nielsen, Jacob Østergaard, Seung-Tae Cha, FrancescoMarra, and Peter Bach Andersen.Modeling of Electric Vehicles (EVs) for EV Grid Integration Study. InProc. 2nd European Conference SmartGrids & E-Mobility, (ISBN: 978-3-941785-14-4), Brussels, 2010.
Carl Binding, Dieter Gantenbein, Bernhard Jansen, Olle Sundstroem, Peter BachAndersen, Chresten Træholt, Francesco Marra, and Bjarne Poulsen.Electric Vehicle Fleet Integration in the Danish EDISON Project. InProc. IEEE Power & Energy Society General Meeting, (ISBN: 978-1-4244-6549-1),Minneapolis, 2010.
Peter Bach Andersen, Bjarne Poulsen, Chresten Træholt, and Jacob Østergaard.Using Service Oriented Architecture in a Generic Virtual Power Plant. InProc. Sixth International Conference on Information Technology: New Generations(ITNG ’09), (ISBN: 978-1-4244-3770-2), page: 184, Las Vegas, 2009.
Morten Decker, Bjarne Poulsen, Peter Bach Andersen, Cresten Træholt, and JacobØstergaard.Theoretical evaluation of a generic virtual power plant framework usingservice oriented principles. In Proc. 6th Mediterranean Conference and Ex-hibition on Power Generation, Transmission, Distribution and Energy Conversion,Thessaloniki, 2008.
Peter Bach Andersen, Bjarne Poulsen, Morten Decker, Cresten Træholt, and JacobØstergaard.Evaluation of a Generic Virtual Power Plant Framework Using ServiceOriented Architecture. In Proc. 2nd. IEEE International Conference on Powerand Energy (PECCon 08), (ISBN: 978-1-4244-2404-7), pages: 1212-1217, Johor Ba-haru, 2008.
15

1. INTRODUCTION
Furthermore, the Thesis Author has made contributions to the following projects:
EDISON The Thesis Author has been in charge of DTUs participation in EDISON
Work Package 3 : “Distributed integration technology development” and has made
written contributions to the technical reports of the project.
• (Internal report) Existing Asset Analysis.
• (Internal report) Distributed reference architecture.
• (Public report) D3.1 Distributed integration technology development.
The Thesis Author have developed large parts of the back-end system - The EDISON
Virtual Power Plant (EVPP) - used for demonstrations throughout the project.
SEESGEN ICT The Thesis Author has contributed to the SEESGEN-ICT Work
Package 4: “ICT for Demand Side Integration” Here the Thesis Author made written
contributions to the reports:
• (Public report) D4-2: Report on ICT requirements, offers and needs for Demand
Side Integration.
• (Public report) D4-3: ICT for Demand Side Integration - Report on Technical
and non-Technical barriers and solutions.
Having listed the previous contributions by the Thesis Author, the next section
outlines this thesis document and its structure.
1.4.2.2 Thesis Structure
The structure of this document is made to reflect the two main objectives of the thesis.
This means that the thesis consist of two parts: ”Domain interfaces” and ”Support-
ing informatics”. The ”Domain interfaces” part consists of chapters reflecting the key
stakeholders identified and thus consists of chapters dealing with the EV owner, dis-
tribution grid and market. In the same way, the ”Supporting informatics” part holds
three chapters covering control architecture, communications and optimization.
Each chapter will start with a list of the core publication that contribute to the
specific topic.
16

1.4 This PhD Study and its Contributions
The thesis document structure, along with the publication to chapter mapping, is
illustrated in figure: 1.6.
Figure 1.6: Thesis structure - Thesis structure with core publications mapped tochapters
The thesis document will conclude with a “Conclusions” chapter that will present
and discuss the results, make recommendations, and finally indicate areas in need of
further investigation.
17

1. INTRODUCTION
18

2
Market Integration
This chapter deals with the market as part of the “Domain interfaces” investigations
of this thesis. The following publications constitute the core contributions done by the
Thesis Author to this area:
B A comparison of electric vehicle integration projects.
D Implementation of an Electric Vehicle Test Bed Controlled by a Virtual Power Plant
for Contributing to Regulating Power Reserves.
E Prediction and optimization methods for electric vehicle charging schedules in the
EDISON project.
The publications will be referred to by their letter (B,D,E) in the following. Part
of the material in this chapter, presented in the “Comparative study between ancillary
service markets” section, is part of a special project report “Ancillary services and
EV aggregator operation” done by the Thesis Author under supervision of Professor
Willett Kempton at the University of Delaware. The report has not been published,
but is available upon request.
2.1 Introduction
The existing power and energy markets may represent the easiest short-term way of
integrating fleets of Electric Vehicles (EV) into the power system. Adjusting charg-
ing according to energy prices or participation in markets product can both benefit the
19

2. MARKET INTEGRATION
power system and represent an immediate economic incentive for fleet operator and EV
owner. Furthermore, the study of current market conditions provides a good oppor-
tunity for shaping the recommendations and requirements for future markets to come.
For the above reasons this thesis, and projects such as EDISON and the University of
Delaware’s Vehicle-To-Grid (V2G) programme, uses existing markets for the investi-
gations on EV utilization concepts. There are, however, shortcomings in the current
markets that need to be addressed as part of DER market integration research: Firstly,
requirements in terms of minimum bid sizes may represent a barrier for market entry.
This issue was one of the main reasons the Virtual Power Plant (VPP) concept was
originally proposed. The need for such an entity may decrease as the market evolves,
but is, at least for now, a necessity for not only meeting capacity limits but also to
manage the complexity of market involvement on behalf on individual EV owners. The
use of VPP aggregation vs. distributed control is covered in more detail in chapter five
“Control Architecture”. Secondly, since power markets were not built for DERs such
as EVs, the flexibility and services of such units may not be appropriately rewarded if
the mechanisms and products of the markets are left unchanged. A lot of attention is
therefore given to designing the future markets that will better facilitate the integration
of DERs. This is the main purpose of projects such as EcoGrid.EU (19). Finally, the
distribution grid may be subject to new kinds of markets. This may help ensure a fair,
safe and efficient utilization of the LV network. This is touched upon in chapter three
“Grid integration” in this thesis.
2.2 Related Work Within Area
As part of the core publication, B, three projects was investigated in terms of their
approach to market integration. See figure 2.1
Figure 2.1: Market integration comparison - Comparison of the market integrationapproach of three EV projects
20

2.3 Thesis Work and Contributions
As can be seen in the figure, University Of Delaware (UD) V2G is the only of the
three projects that actively investigated the aspect of interfacing with the regulation
market. The work by UD V2G within advanced EV utilization deserves special men-
tion in this section due to their focus on this more advanced market approach and
their practical demonstrations of active participation in such a market. Market par-
ticipation was achieved by forming a VPP-like constellation and by partnering with a
large battery-based regulation provider. The description of these demonstrations and
the associated economics incentives is found in (20, 21). While UD V2G is unique in
terms of the results they have achieved, numerous other researchers have investigated
integration with either spot markets, ancillary service (A/S) markets or a combination
of the two. In the paper (22), Rotering uses price forecasts and dynamic programming
in a demonstration of both spot market based charging cost minimization and A/S
provision. In a case based on markets in California, it is shown how daily charging cost
can be reduced from $0,43 to $0,2 . The daily profit of regulation service participation
is estimated to be $1,71. In the article (23), Kristoffersen describes a fleet operator
charging according to spot marked prices while considering typical driving patterns.
The article suggests using either linear or quadratic programming to plan charging,
depending on whether the fleet operator can influence market prices i.e. being a price
taker vs having market power. In a report by Heesche (24), the author estimates the
charging costs based on different charging strategies and mix between the spot and
regulation market. Charging costs can, for some night charging scenarios, be cut in
half when using smart charging instead of “dumb” charging. The estimated savings,
however, is less than EUR 10 per month and are unlikely to be large enough to in-
centivize smart charging. Especially when considering that the market energy price is
typically only a small fraction of what the EV owner pays per kWh. In Denmark only
15-25 percent of the energy bill is the energy price, the rest is taxes and fees.
Letting the tax component of the energy price increase and decrease as a function of
the time of use, can strengthen the economic incentive of smart charging in the future.
2.3 Thesis Work and Contributions
Core publications part of the PhD study have described how the charging of a fleet of
EVs can be based on hourly spot market prices or regulation signals. The following sec-
21

2. MARKET INTEGRATION
tion covers work done as part of the EDISON project, a comparison between American
and European A/S products and, finally, a few demonstrations on A/S provision.
2.3.1 Market Integration in EDISON
As previously shown, EDISON choose to focus on existing markets and in this case on
the Nordic Spot day-ahead energy market. The first step taken was an investigation
of how a Fleet operator would be introduced in the setup of the spot market. The
following figure 2.2 illustrates the approach used.
Figure 2.2: Market integration in EDISON - The introduction of a fleet operator inthe EDISON project
The figure shows some of the existing market roles (Retailer, production- or load
balance responsible) to which an actor, such as the fleet operator, would be associated.
In a real market scenario the fleet operator would bid on energy based on historic
prices and the expected demand of its fleet. For the demonstrations done in EDISON
however, the bidding process was neglected and it was shown how charging cost could
be minimized if coordinated directly with known spot day-ahead energy prices. Rather
than spot market integration it can be argued, this reflect a scenario where a dynamic
energy tariff is used for charging.
Figure 2.3 shows a piece of demonstration software made in EDISON and illustrates
how charging would be moved to the cheapest hours during night.
22

2.3 Thesis Work and Contributions
Figure 2.3: Smart charging - The charging schedule (bottom graph) places charging inhours where prices are low (middle graph).
For charging planning, linear optimization was used. More information is available
in the core publication E and in chapter seven “Optimization”. Since energy prices
are generally fixed for EV owners there are no immediate economic incentive for smart
charging as done in the optimization. If energy is purchased through a retailer trough
the spot market it could, however, mean a lowering of charging prices. Using the spot
prices directly in the cost estimation does not give a accurate impression of the real
savings an end user would see. Rather this would depend on the bidding strategy of
the fleet operator/retailer.
2.3.2 Comparative Study between Ancillary Service Markets
A type of markets that could offer higher savings, or even a profit, for the EV owners
and fleet operators, are the A/S markets.
As mentioned previously in this chapter, UD V2G has already proven that there
is a potential for connecting a fleet of EVs with the regulation market in the PJM
area. To better understand both the requirements, potential barriers and type and
shape of economic compensation that different markets represents, an investigation has
been made. The goal was to compare the conditions under which UD V2G successfully
demonstrated market integration with the conditions in the Danish A/S and regulation
markets as part of European Network of Transmission System Operators for Electricity
(ENTSO-E). The summery of this investigation can be seen in table 2.1.
23

2. MARKET INTEGRATION
A/S Market Area Controlmethod
Contracting Minimumbid size(MW)
Responsivenessrequirement(To full ca-pacity)
Capacitycom-pensa-tion
Average capacity pay-ment (MW-Hr)
Energy payment(MW)
Frequency reg-ulation
PJM(USA)
Controlsignal
Day ahead,One-hourblocks
0,5 5 Min Energy - 12,5 EUR A Based onRMCP and in some casesLOC
SynchronizedReserve
PJM(USA)
Controlsignal
Day ahead,One-hourblocks
0,5 10 Min Energy - 7,3 EUR B Tier 1: Basedon LMP plus a pr MWpremium Tier 2: Basedon SRMCP and in somecases LOC
Manual regula-tion reserves
DK west+ DKeast
Manual Day ahead,One-hourblocks
10 15 Min Capacityand en-ergy
1,97 EURC up west
0,08 EURC down west
0,49 EURC up east 0,86
EURC down east
N/A
Primary Re-serve
DK west Frequencysensing
Day ahead,Six-hourblocks
0,3 30 Sec Capacity 50,4 EUR D up 16,85
EUR D down
Secondaryreserve
DK west Controlsignal
Purchasedon a monthlybasis
N/A 15 Min Capacityand en-ergy
N/A Based on spot- and in-traday regulation marketprices.
Frequencycontrolled nor-mal operationreserve
DK east Frequencysensing
Purchasedon a monthlybasis
0,3 2,5 Min Capacity 78,36 EUR E up 58,87
EUR E down
Frequency con-trolled distur-bance reserve
DK east Frequencysensing
Day ahead,Six-hourblocks
0,3 30 Sec Capacity 31,06 EUR F up
Table 2.1: A/S Market comparison - Comparison between ENTSO-E and PJM marketsA 2010, annual report, Regulation Market clearing price, including opportunity cost source:www.monitoringanalytics.com B 2010, annual report, Tier 2, Mid-Atlantic Subzone of the RFC SynchronizedReserve Market source: www.monitoringanalytics.com C 2010, average based on market data extract, source:www.energinet.dk D 2010, average based on market data extract, source: www.energinet.dk E 2010, averagebased on market data extract, source: www.energinet.dk F 2010, average based on market data extract, source:www.energinet.dk
By comparing the A/S markets listed in the table, the following observations can
be made. A/S contracting works in pretty much the same way across the ENTSO-
E and PJM A/S markets. The Transmission System Operator (TSO) or Regional
Transmission Organization (RTO)(Role for PJM) will choose from a set of bids for
up and down regulation reserves, the providers will be informed about accepted bids
and the final compensation will be settled. The length of the time interval for which
the A/S is contracted, and the time-of-contracting, however, varies from case to case.
These differences should mean little to a fleet operator.
Most of the ENTSO-E markets described here are frequency controlled. An ex-
ception is the secondary reserve of DK west which is somewhat comparable with the
regulation market of PJM in regard to activation mechanism i.e. a positive or negative
power set-point sent from the TSO/RTO to the provider. If a provider using an EV
fleet wish to participate in the frequency controlled A/S markets of DK west and DK
east it will need to use frequency sensing equipment as part of the control system.
24
2.3 Thesis Work and Contributions
This equipment will have to satisfy certain requirements on accuracy and measurement
resolution.
Power and responsiveness requirements differ somewhat from market to market. For
Frequency Controlled Disturbance Reserve (FDR) and primary reserve, the minimum
bid size is 0,3 MW while the other markets investigated operate between 1 MW to
10 MW. This makes FDR and primary reserve suitable for participation by smaller
EV fleets in the early stages of EV integration. The responsiveness requirements of
the markets are all easily satisfied by an EV fleet. A demo V2G vehicle as described
in (21) was able to respond on a sub-second timescale with its full capacity where as
the fastest Danish A/S markets listed in this report requires full capacity within 30
Seconds.
The payment in the A/S markets generally increase as a function of how much
power can be supplied in how short a time. Common for most ENTSO-E A/S markets
described here is that they only reward capacity and not energy. The manual regula-
tion reserve does not seem suitable for EV fleets since it offers a poor compensation
for capacity and requires substantial amount of energy to be available for continuous
supply. It is argued in (21) that it is currently less economically feasible to supply
larger amounts of energy back to the grid due to roundtrip losses and a relatively low
compensation pr. kWh in most markets.
The remaining four A/S markets in Denmark have much higher compensation.
This is especially true for Primary Reserve and Frequency controlled Normal operation
Reserve (FNR). FDR offers a lower average capacity compensation than FNR even
though the former has higher requirements to responsiveness. This can be attributed
to the fact that FDR is invoked less often. FDR can, in this aspect, be compared to
synchronized reserves in PJM and could offer the same trade-off between compensation
and EV battery lifetime preservation.
As previously mentioned, bid size requirements can be meet by the use of an aggre-
gated group of vehicles. The concept of using multiply resources to meet a demand is
mentioned in the “combined delivery” sections of the “Ancillary services to be delivered
in Denmark - Tender conditions, valid from 1 January 2011” manual of Energinet.dk.
Here it is stated that a delivery can be made up from several production or consump-
tion units with different properties which collectively can provide the required response
within the required response time.
25

2. MARKET INTEGRATION
For several of the markets, however, a delivery is not allowed from a combination
of producing and consuming units. It will therefore be relevant to establish if an EV
delivering power back to the grid (V2G) will be considered a “producer”. Will, for
instance, a fleet operator be allowed to meet an up regulation request by making some
EVs reduce load and having others deliver power back.
2.3.3 Providing Ancillary Services in Denmark
Having investigated A/S market participation by EVs, the Thesis Author participated
in two demonstrations where two kinds of physical units were made to react on market
signals.
Based on the market investigation, the secondary reserve market of DK was chosen
since the regulation sum signal, provided by Danish TSO Energinet.DK, is both a
meaningful and easily implementable input to the test. The secondary reserve signal
is a MW value sent from the TSO to a group of providers and is positive or negative
depending on the need of either up or down regulation. The sum signal is all the
individual signals added together and is used since individual “TSO to provider” signals
are kept confidential.
The first test was performed towards a battery setup as described in the core publi-
cation D. The test demonstrated how a set of lithium batteries through a controllable
charger and inverter, could be made to charge or discharge according to the real-time
balancing need of the TSO. The result can be seen in figure 2.4.
The upper graph in the figure shows the charging schedule sent to the battery
setup compared to the target value (sum signal) sent by the TSO. For this test Marra
D constructed and prepared the physical setup (nicknamed the “Table-To-Grid” setup).
The lower graph in the figure shows measurements from the battery management system
(BMS) attached to the batteries.
The Thesis Author decided to repeat the experiment, using the full system architec-
ture and communication solutions described later in this thesis, towards a real EV (the
Toyota Scion eBox). The exact same signal was sent to the EV as was used towards
the battery-setup. The result can be seen in figure 2.5.
It can be seen from the figure that the EV precisely follows the aggregated regulation
signal. The regulation signal in question represents a period with many fluctuations
with a close to equal amount of up and down regulation periods. This has a positive
26

2.3 Thesis Work and Contributions
Figure 2.4: Table-To-Grid setup - Using a set of lithium batteries to respond to a LFCsum signal sent by a TSO. source: Marra, core publication D
Figure 2.5: EV setup - Using an EV to respond to a LFC sum signal sent by a TSO
27

2. MARKET INTEGRATION
impact on the State-Of-Charge (SOC) which stays close to 50 percent throughout the
whole period. A stable energy level makes planning easier when having to meet a
certain energy target plus reduces wear on the battery due to deep cycles. For periods
with less variation, e.g., longer periods dominated by either up or down regulation, an
aggregator will have to depend on having sufficient vehicles in its portfolio as to even
out the influence on individual EV SOC levels.
The experiments prove that A/S via EVs is technically possible - proving the busi-
ness case and understanding the impact on batteries still is in need of research.
2.4 Sub-conclusion
The following sections concludes this chapter by presenting and discussing results and
by giving recommendations on future work.
2.4.1 Contributions and Results by the Thesis
The first findings and contributions, as part of the EDISON project, were that:
• EVs can be connected to the NordPool spot day-ahead energy market through a
VPP-based fleet operator if adhering to the appropriate market roles and respon-
sibilities.
• Backend software have been developed and have been used to charge EVs (real
and simulated) according to energy prices extracted from the energy market.
The next step taken was looking at A/S markets to understand how the market
used in UD V2G compares with the ones available in Denmark, the results were that:
• Although variations exists between the markets, most constraints and require-
ments can be overcome by the use of a fleet operator and the aggregation of
EVs.
• The FNR market of DK east is found to offer the highest average capacity com-
pensation but would require frequency sensing to be implemented.
• A/S based on power capacity rather than energy, is a good match for the capa-
bilities of an fast-response, high-power DER such as an EV.
28

2.4 Sub-conclusion
• The secondary reserve market of DK west is a close match to frequency regulation
in the PJM area and is a good starting point for a field test.
• The EnergiNet.dk rules on “combined delivery” will have to accommodate V2G
enabled EVs.
Based on the findings from the market analysis the following was demonstrated:
• One of the Danish markets were chosen and it was demonstrated that two units
- a Table-To-Grid setup and an eBox EV - can follow the sum signal sent out by
the TSO as would be the case when participating in said market.
• The experiments carried out by the Thesis Author have proven that an EV
can be made to react within a few seconds (full communication stack latency
+ charger/inverter ramp-time) which would easily satisfy all markets considered.
2.4.2 Discussion and Recommendations
Market integration concepts for EVs will vary based on local market conditions and
are, for the centralized architectures, tightly linked to the business cases chosen by the
fleet operator. Smart charging, as covered by EDISON and e-mobility, can be seen as a
first approach to market integration by allowing the EV to respond to variable energy
prices on the energy market. The V2G equipment tested by UD V2G can be seen as
the second step where the EV increases its potential as a resource to the grid and more
market integration concepts becomes possible. New market integration concepts might
occur over the coming years to better facilitate DERs as part of the smart grid concept.
It is recommended to further examine the FNR and Primary reserve markets since
they, at the time of the investigation, are found to offer the best economical com-
pensation. This would require new functionalities to be implemented in the technical
platform used by the fleet operator in order to facilitate frequency sensing as required
in these markets.
It is important to note that the economic attractiveness of a specific market can
change over time. If, for instance, several EVs enter a specific market they might, in
time, saturate the need of certain services. Also, nightly energy prices may increase as
more EVs delay their charging to the same hours. As long, however, as most European
29

2. MARKET INTEGRATION
countries keep their ambitious energy targets, it is likely that the flexibility of EVs will
be both needed and duly rewarded on the markets.
This chapter have described the use of the energy market for a charging cost re-
duction and the A/S market for a potential profit. An advanced scheme could be to
combine both of the above objectives, i.e., planning EV charging based on both energy
prices and balancing needs. This is left for future research.
30

3
Grid Integration
This chapter deals with the distribution grid as part of the “Domain interfaces” in-
vestigations of this thesis. The following publications constitute the core contributions
done by the Thesis Author to this area:
A Coordination Strategies for Distribution Grid Congestion Management in a Multi-
Actor, Multi-Objective Setting.
E Prediction and optimization methods for electric vehicle charging schedules in the
EDISON project.
The publications will be referred to by their letter (A,E) in the following.
3.1 Introduction
The local distribution grid, to which the Electric Vehicle (EV) will connect, has a large
part to play within intelligent EV integration and may be one of the most complex
issues that EV integration research will have to address. The core challenge is that
the EV represent a larger load than what is normally attached to residential feeder
lines and can therefore violate the Distribution System Operators (DSO) operational
constraints such as:
• Voltage limits. Keeping the voltage at any point in the grid within a certain
range (power quality obligation towards customer).
31

3. GRID INTEGRATION
• Thermal limits of cables and transformers. The energy transferred through
equipment and conductors compared to the current rating of such components
(equipment lifetime consideration).
• MVar limits. Bands for reactive power exchange at the connection between
the distribution grid and the transmission level (obligation towards transmission
system operator).
In this chapter the focus is on congestion issues, i.e., a situation in which the demand
for active power transfer exceeds the transfer capability of the grid.
Where charging according to market prices may be the first obvious approach when
talking about system-wide concepts (See chapter two “Market integration”), moving
the EV load away from the household peak load is an obvious first approach when
turning the attention to the distribution grid and congestion issues. It has, however,
been established that the combined load of EVs in themselves can cause problems for
the grid even if charging when base-load is typically low. Add to this that many of the
system-wide concepts considered will tend to cluster charging in time e.g. all reacting
to the same low charging cost or reacting to a regulation need at a higher level of the
power system. This behavior is by the IBM partners in the EDISON project termed
”The EV lemming effect”. (25)
Making the EV charging “compatible” with the local grid can either be implemented
as a hard requirement imposed on fleet operators, or as a new type of LV grid ancillary
service which a fleet operator will be compensated for supplying (but still may be forced
to provide).
When researching EV grid integration, the three following steps can be followed:
1. Conducting grid impact studies to assess the problem.
2. Suggesting strategies to mitigate grid issues.
3. Validating strategies using simulations and in-field tests.
The Thesis Author have sought to understand issues relating to the first of the above
points, grid impact studies, by going through a number of publications investigating this
topic. The emphasis of this thesis has been on the second point, suggesting strategies
to mitigate grid issues (in the form of congestion), and this primarily from the point
32

3.2 Related Work within Area
of view of a fleet operator. The Thesis Author’s main motivation is to understand the
kinds of impact that grid constraints may have on the implementation and operation
of an aggregator and the informatics on which it relies.
In the end the objective is to find out to what degree system-wide services can be
harmonized with local grid constraints.
3.2 Related Work within Area
The EDISON project has made contributions to the area of grid impact studies which
is documented as part of the projects technical reports (26). Here, a part of the
Bornholm grid has been simulated and the result of different EV penetration levels was
investigated in terms of cable and transformer loading as well as voltage drops for part
of the 400 V, 10 kV and 60 kV grid. The conclusion was that the 400 V grid was most
sensitive with voltage drops as the biggest problem. All grids could accommodate up
to 20 percent EV integration if the charging was limited to 1 phase/ 16 Amp / 230 V
charging (3,6 kW). The charging strategy (“dumb” charging vs. smart charging) was
shown to have a major impact on the EV integration level supported. An important
comment relating to the fleet operator made by the report is ”The fleet operator has
the ability to limit its consumption, however, with the current market setup, there are
no incentives to do so.”.
Another project, MERGE, have performed comprehensive investigations on the
topic (27) and concludes that for LV networks ”large scale EV integration affects quality
of service and may cause significant technical problems”. MERGE bases the study on
several EV penetration scenarios, grid topologies and charging methods. MERGE sim-
ulations indicate that congestion problems increase when considering ”Dumb” charging
and rural grid topologies.
The effect grid topology has on simulation results is also visible when comparing
publications done by Shao (28) and Marre (29) respectively.
Shao demonstrates that a strong urban distribution grid supports a 100 percent EV
integration considering both voltage limits, harmonics and thermal loading of cables and
transformer. In contrast Marra demonstrates that the transformer of a rural/residential
topology can be overloaded at relatively low EV integration levels.
33

3. GRID INTEGRATION
It can be concluded from the above that grid impact is a real issue and should be
handled accordingly. This is especially true when considering the provision of system-
wide market services done by V2G UD (20) (using an EV fleet for regulation services),
Here EV charging will both be clustered in time and to be done a high power levels,
i.e., 120 V, single phase with up to 80 Amps (9,6 kW) thus adding to a potential grid
issue.
The next step for academia is to suggest congestion mitigation strategies. Also in
this area some good contributions are available.
In (30) Shao describes a demand response strategy for load shaping considering the
constraints of the local transformer. The strategy also includes considerations to user
preferences, the priority between the individual loads in a household and the privacy
of data. It is shown how household base load plus controllable load (AC, Water heater,
EV) will exceed transformer ratings in certain hours. A home area network control
flowchart illustrates how the controllable loads are scheduled depending on their priority
and convenience preference. By employing the strategy it is shown how the combined
load of the households is kept within the transformers capacity rating.
As part of the EDISON project, dynamic grid tariffs were investigated. In this
scheme, a price is sent that can reflect system-wide energy prices while including a
cost-component representing the state of the grid to which the individual recipient is
connected. This means that even if energy prices are low, a local price may be high due
to local congestion. The use of dynamic grid tariffs have been described by Connell in
(31).
Another notable contribution to congestion mitigation strategies combined with
smart charging has been done by Binding and Sundstroem in (32). The authors uses
discrete and continuous state variables to simulate a fleet of electric vehicles and the
distribution grid. The paper introduces a Charging Service Provider (CSP) which goal
it is to meet EV owner energy demand, minimize charging energy cost and at the same
time avoid grid bottlenecks. The solution may depend on a number of iterations be-
tween a DSO and the CSP before the fleet charging plan of the CSP is “pre-approved”.
The DSO uses a load flow or flow Network method to validate the impact of a certain
fleet charging plan sent to it by a CSP. The solution represent an advanced approach
to handling congestion issues.
34

3.3 Thesis Work and Contributions
The latter two of the above publications seek to combine grid congestion mitigation
with the minimization of charging costs. This type of combined objectives is an ad-
vanced and very relevant area of EV integration research and is also the area to which
this thesis wish to contribute.
3.3 Thesis Work and Contributions
The focus of this section is on how grid constraints may influence the operation of the
fleet operator.
Ideally a grid congestion mitigation strategy should be implemented that respects
and supports the operational goals of all stakeholder involved in EV integration. The
key stakeholders identified in core publication A is the DSO, the fleet operator and EV
owner. The approach used is to list the key operational tasks that each stakeholder
would need to undertake based on their value drivers. These tasks are then divided
into stages based on in what phase they are performed. Se figure 3.1.
Figure 3.1: Map of base-case operations - Mapping of stakeholder key operations tostages.
The stages used are inspired by functional levels found within industrial automa-
tion. “Planning” is the stage in which commitments and contracts are made. In
the “Scheduling” stage, available resources are known and they are coordinated and
prepared for the operation stage. The stage “Operation” is about pure execution of
35

3. GRID INTEGRATION
schedules and the handling of real-time events. Finally the “Settlement” stage is about
the financial aftermath.
The purpose of the map is to illustrate the task of each participant before a conges-
tion mitigation strategy is introduced. One special operation ”Charging interruption”
found in the “Operation” stage is suggested since it could represent a vital last resort
function for the DSO to stop the charging of an EV if all other grid congestion miti-
gation strategies fail. The suitability of a strategy could then, among other things, be
measured on the amount of times it would be necessary to invoke such a function.
Core publication A then describe the concept behind three individual strategies
which are:
• Distribution grid capacity market
• Advance capacity allocation
• Dynamic grid tariff
For each approach, a new map is drawn where operations required specifically for
the strategy in question are presented. The dynamic grid tariff strategy is similar to
what is proposed by Connell (31), i.e., generate a time and grid-location dependent
price for grid usage based on expected nodal consumption levels.
The distributed grid capacity market strategy introduces a ”market operator” which
defines prices based on demand and supply. Aggregated schedules for demand and
prices are sent back and forth between market operator and fleet operators in an iter-
ative process.
The final strategy, advance capacity allocation, the one described and proposed by
the Thesis Author, is illustrated in figure 3.2.
The idea behind this approach is that the DSO would calculate available capacity for
each feeder-line based on transformer and cable ratings and the expected conventional
load curves. The households attached to a certain feeder-line would then be given a
certain share of available capacity (kW), which could be allocated to the fleet operator
representing them. To avoid inefficient utilization of available grid capacity due to
unused capacity shares, a second step is added to the strategy where fleet operators
can trade their allocated capacity in an over-the-counter manner.
36

3.4 Sub-conclusion
Figure 3.2: Advance capacity allocation - Operational tasks and interactions for the“advance capacity allocation” strategy. Key operation “boxes” for this strategy are bolded.
Possible advantages and drawbacks of each strategy is discussed in A in terms of
complexity, value and risk.
A benefit for the advance capacity allocation strategy is that it would be relatively
easy to implement. The strategy, however, relies on efficient and reliable trading be-
tween fleet operators in order for the capacity to be used efficiently. The strategy does
not deal with real-time operational requirements such as harmonics and voltage limits
which needs to be handled separately.
A very early attempt to incorporate grid constraints in EV charging is found in core
publication E where the charging power can be limited based on a time based constraint.
This time-based constraint could be based on the capacity allocation strategy.
3.4 Sub-conclusion
The following sections concludes this chapter by presenting and discussing results and
by giving recommendations on future work.
3.4.1 Contributions and Results by the Thesis
A number of grid impact studies have indicated that congestion issues may occur at
EV penetration levels as low as 20-40 percent depending on charging strategy, charging
power and the topology and level (e.g. 400 V vs 10 kW) of the grid in question.
37

3. GRID INTEGRATION
The Thesis Author have contributed to the area with an investigation on grid con-
gestion mitigation strategies in which it is concluded that:
• Operation maps can help understand the impact of coordination strategies on the
operations and interactions of stakeholders.
• Grid considerations may have to co-exist with other objectives in the charging
management of EVs (such as system-wide services).
• Coordination and information exchange in earlier stages can reduce complexity
and benefit both the fleet operator and DSO.
• There may be a trade-off between ease of strategy implementation and optimality.
A compromise may be necessary for the first real-life implementations.
• A suitable strategy for coordination between DSOs and fleet operators will im-
prove each stakeholders ability to reach its objectives considerably.
If a strategy such as advance capacity allocation is used, the available per-feeder
capacity may be known by the fleet operator when planning EV charging in correspon-
dence with market contracting. These capacity limits can be included as constraints in
an optimization method.
3.4.2 Discussion and Recommendations
Full penetration of EVs will undoubtedly mean extending and enforcing the grid in
some locations. If EV charging is coordinated appropriately, however, such extensions
may not need to accommodate a worst-case scenario where all EVs are charging at the
same time.
An important question is what objective will have the greatest monetary value:
using EVs for system wide services or to charge according to local grid conditions.
Short term, with the existing distribution grids, the DSOs operational limits will
trump any objective that a fleet operator may have in the power market. For the
planning of future distribution grids, however, the many possible system-wide uses of
the EV must be thoroughly considered.
Should distribution grids be subject to heavy extensions so that they can facili-
tate a lot of EVs charging simultaneously in response to e.g. transmission level wind
38

3.4 Sub-conclusion
availability!? or should expansions, and the associated cost, be kept at a minimum by
requiring all EVs to charge according to available grid capacity.
It is reasonable to assume that the DSO will require an real-time emergency in-
tervention mechanism that curtails EV charging if some of the operational limits are
violated. It would represent a big challenge to EV introduction in general if such events
are allowed to occur frequently.
39

3. GRID INTEGRATION
40
4
EV Owner
This chapter deals with the Electric Vehicle (EV) owner as part of the “Domain in-
terfaces” investigations of this thesis. The following publications constitute the core
contributions done by the Thesis Author to this area:
A Coordination strategies for distribution grid congestion management in a Multi-
Actor, Multi-Objective Setting.
E Prediction and optimization methods for electric vehicle charging schedules in the
EDISON project.
The publications will be referred to by their letter (A,E) in the following.
This chapter also present some material not yet published in the ”Early investigation
of real driving data” section. While the work in this area is not yet complete, it is
included here to supply some early examples on how real EV usage data may be used
by a fleet operator in its operation. The data can be used as input to the prediction
and optimization method employed by a fleet operator.
4.1 Introduction
The EV owner is easily the most important stakeholder in EV integration. Intelligent
EV integration depends both on the EV owner accepting her or his role as an active
prosumer and that the behavioral patterns of said owner support flexibility in charging.
41

4. EV OWNER
Regarding the first point, owner acceptance, it is important to understand the
motivations of EV owners. Early research (33) point to three main parameters that
influence people’s willingness to invest in an EV:
1. The EV’s ability to meet transportation needs - especially in regards to range.
2. The total cost of ownership compared to a traditional car.
3. The availability of sufficient EV charging infrastructure.
The intelligent EV utilization concepts investigated as part of this thesis, can po-
tentially influence the second of the above factors - total cost.
For any software developed to achieve controlled charging, it is reasonable to assume
that owners would like to have interfaces (mobile apps, web pages etc.) through which
they can stay informed and empowered. Also, the owner is more than likely to favor
convenience and ease of use.
Such convenience can be achieved trough:
1. Transparent frame conditions for the use of controlled charging captured in a well-
formed Service Level Agreement between owner and fleet operator. (Example:
always charge immediately to 50 percent energy for emergency trips)
2. That the fleet operator can precisely predict the needs and flexibility of the EV
owner and approach the owner with accurate and relevant suggestions for con-
trolled charging. (Example: The fleet operator can suggest that charging can be
delayed until morning hours if the owner never leaves home before noon)
The second of the above points, assessing the precise flexibility of the EV owner, is
also important in order to maximize the EVs value as a resource. The flexibility relates
to EV owner plug in patterns which are defined as the periods in time in which the
EV is connected to the power system and thus capable of uni or bi-directional energy
transfer. While the EV owner may plug in the vehicle at many different locations and
for different need scenarios, only one type of plug in period is of interest for smart grid
integration:
• A period that is long enough, compared to the energy need, so that they grant
flexibility for delaying charging in time.
42

4.2 Related Work within Area
• A period that is predictable in nature and recurs according to a certain pattern.
In general, two categories of commuter charging suit the two above criteria: work-
place charging and night charging. In contrast, most fully-public charging options (such
as DC fast charging) are used for range extension, i.e., used sporadically to gain extra
kilometers of range. The latter category therefore does not meet either criterion.
A general expression of the flexibility can be formulated as:
Flexibility = f(duration, energyNeed, predictability) (4.1)
The work presented in the thesis investigates plug in periods in terms of the above
parameters and it is shown how such periods can be predicted and what role they may
play for intelligent EV utilization concepts and the fleet operator.
4.2 Related Work within Area
Most driving pattern studies conducted have relied on data from traditional internal
combustion engine (ICE) cars for their investigations. This is due to the fact that any
large quantity of driving data collected from EVs are, as of yet, difficult to come by.
ICE vehicle data is a reasonable starting point if EVs are expected to fulfil the same
role as the ICE vehicles investigated, e.g., urban commuting.
Using ICE vehicle data can, for instance, be useful in studies investigating an EVs
ability to meet driving needs. Comparing a typical EVs range of 100-180 km with the
average Danish driving distance by commuters of 29,48 km (Danish National Transport
Survey) it seems that most daily driving patterns can be satisfied. It is, however, also
necessary to consider the variance e.g. how often people drive much longer than the
29,48 km.
In (34) Pearre conducts a statistical study based on 484 ICE vehicles to asses a
vehicle owners range needs compared to what would be supported by an EV. Pierre
approaches the problem by investigating how many times, over one year, the range
of an EV would not suffice. It is shown that nine percent of the sampled vehicles
never exceeds a daily driving need of 160 km, meaning that this group would be viable
candidates for adopting EVs. Pierre then shows that allowing six “range violations”
per year would increase this number to 32 percent. This means that if roughly one third
43

4. EV OWNER
of the sample group would find an alternative solution, e.g., rent an ICE vehicle, for
the up to six days with the longest driving distance, an EV could satisfy the remaining
driving need for this entire group.
Having investigated an EVs ability to meet the primary function, driving, the at-
tention can be turned towards the EVs potential for intelligent EV utilization concepts.
A study by Wu (35) address daily driving patterns as done by Pierre, but also
investigates EV availability for controlled charging. Here ”availability” is interpreted
as all the time periods in which the vehicle is not driving. The sample presented by
Wu shows a very high degree of availability - especially at night and during noon. This
availability, if representing times in which an EV is both parked and plugged in, is an
early first measure of the degree to which it can participate in concepts such as smart
charging.
The investigation of such “availability periods” is taken further in (36). Here, the
authors uses a semi-Markov model to predict the next place of arrival and stay duration
of a vehicle. The arrival locations are shown to be predictable with 84 percent accuracy
using the proposed method. As with the above studies, ICE vehicle data is used and
are based on GPS measurements.
The authors clusters geographically close GPS measurements for when the vehicle
is parked to create a number of locations. The importance of each location, in terms
of usefulness for controlled charging, is then estimated using a point system. Points
are given depending on the number of stopovers at the location, the average stopover
duration and the spread of this duration. The method is very useful when going beyond
night charging for EVs and identifying other periods that are sufficiently long and
predicable. For private commuting vehicles this would, however, most likely be limited
to the home and workplace location. Hidden Markov models have previously been
applied to trip prediction by Simmons in (37) which also addresses the specific purpose
of a trip.
There are, however, investigations for which you need ”real” EV data. For instance
when it comes to understanding how often the EV owner will perform the action of
plugging in the vehicle. Some of the largest organised EV trails yielding such data,
are the German Mini E Berlin project and the Danish Test-An-EV programme. An
investigation of EV owner acceptance and behavior based on Mini E Berlin is described
by Cocrona in (38)
44

4.3 Thesis Work and Contributions
The research on owner patterns based on real EV trails and the impact on EV fleet
charging optimization is still in need of investigation and is therefore pursued by the
Thesis Author.
4.3 Thesis Work and Contributions
As stated above, this thesis focuses on the use patterns of the EV owner as they relate
to smart charging. It is especially important that the fleet operator understands and
adheres to driving demands. See core publication A for a short description of expected
EV owner requirements and value drivers.
4.3.1 Simple Prediction based on Driving Data
The first study was based on ICE vehicle patterns as part of the AKTA driving set
(Centre for Traffic and Transport (CTT)). The AKTA data was based on a total of 360
vehicles, which were followed from 14 to 100 days between 2001 and 2003 and is biased
towards driving seen in the greater Copenhagen area.
It was, in core publication E, suggested to use a simple exponential smoothing
model for predicting the duration of night stopovers ( see figure 4.1).
Figure 4.1: Expected night availability as function of variance - Illustration ofhow the period used by a fleet operator for controlled charging may depend on the averagevalue and standard deviation of plug ins and outs.
In the driving data, stopover periods were periods in time where the car would be
parked. The authors filtered the data to only include nightly stopover periods and some
outliers were removed. These periods could then be considered suitable candidates for
smart charging and where used as input to a binary optimization (described in chapter
seven: ”Optimization”). The following exponential smoothing function was used:
45

4. EV OWNER
Xn+1 = (1− δ)Xn + δSn (4.2)
In the above, X1 = S1 and S ∈ Rn is historic stopover data for a given vehicle.
δ ∈ [0; 1] is a fixed parameter determining the weight that new observations are given
compared to historic data. A low δ-value will result in new observations having a higher
impact on the prediction.
The paper went further by investigating the relationship between the variance and
mean of start and stop times and the value of the objective function and to test the
robustness of the solution. A suggestion of the authors was to let the time interval
used for smart charging depend on the variance (standard deviation) in stop and start
times. A drawback of the above method is that cyclic daily or weekly variations are
not taken into account.
The method was included by the Thesis Author in the demonstration software de-
veloped in EDISON. The following figure 4.2 shows a part of a fleet operator interface
where the lines in the top portion “EV charging availability” illustrate how the fleet
operator transitions from using a static guess/profile of night availability to using a pre-
diction based on exponential smoothing. The upper line is the “measured availability”
while the dashed line underneath is the “predicted availability”.
Figure 4.2: Implementation of predictions - Illustration of EV charging availabilityprediction by a fleet operator as implemented in EDISON software.
The above represents a first approach to making predictions on night plug in avail-
ability and its active use by fleet operator aggregation software.
46

4.3 Thesis Work and Contributions
4.3.2 Early Investigation of Real Driving Data
The Thesis Author has investigate real EV driving patterns as part of the Danish Test-
An-EV programme. The programme, orchestrated by the electric mobility operator
(EMO), Clever, includes over 1600 Danish households over a three year period with
a fleet of 184 EVs. The project is supported by the Danish Energy Agency and the
Danish Transport Authority. The data has been stripped of personal information to
protect the identity of the participants.
In the study, groups of eight to ten EVs are distributed to cities in Denmark, here
the groups participate in a number of ”rounds”, each with a duration of approximately
3 months. In every round, each EV is given to a household. The households all receive,
and hand back, the EVs at the same time. For this study, six cities have been chosen,
each with two rounds as illustrated by figure 4.3.
Figure 4.3: Full sample of vehicles - Approximately 50 EVs and 100 families drivingin six different cities throughout the winter, spring and summer months of 2012.
The above is the data used for the plug in investigation.
Figure 4.4 visualises the charging periods for a single vehicle from the Test-An-EV
dataset during spring 2012. Notice that charging periods lies in the very beginning of
each plug in period signifying that, what is commonly known as ”instant” or ”dumb”-
charging, is used.
47

4. EV OWNER
Figure 4.4: Plug in periods - Visualisation of plug in periods for a single vehicle.
It has already been argued that the most important parameters for a plug in, in
regards to controlled charging, are the duration, predictability and the energy demand
for the next trip. These parameters are now investigated based on the recorded plug
ins.
First, however, the sample is filtered to only include ”workday night charge plug
ins”, i.e. a plug in starting after noon and terminating the following day before noon
on a workday (monday to friday). Some of the vehicles have been excluded due to
inactivity and/or lack of data.
Since a plug out event is not recorded in the data, it is assumed that the EV will
remain plugged in until the next drive if it was plugged in at the end of the previous
drive.
The averages for the full sample (illustrated in figure 4.3.) is listed in table 4.1.
It can be seen from the numbers that the charge period is only roughly one third
of the plug in period meaning that there, based on the average, is a lot of flexibility
available in when to charge the battery. This is even though the batteries are charged
to 100 percent and it typically takes considerably longer charging the last 5-10 percent
48

4.3 Thesis Work and Contributions
Parameter Mean value Standard Deviation
Plug in period duration 12:43:03 41 (Min)
Charge period duration 04:00:12 17 (Min)
Plug in period start SOC 49 4 (Percent)
Plug in period end SOC 100 2 (Percent)
Plug in period start 19:10:28 39 (Min)
Plug in period end 07:53:32 29 (Min)
Table 4.1: Plug in period averages - full set.
due to the BMS and its management of battery lifetime.
It can also be seen that the average State-Of-Charge (SOC) is relatively high at
plug in, and that the plug out (Could be when EV owner leaves for work) is subject
to less variance than the plug in (Could be when EV owner returns to his/her house).
Such ”fleet” information is valuable to an fleet operator for accessing the potential for
controlled charging.
Subsets of the above data have been put to use in a few investigations described in
the following sections. In these investigations, the sample sizes have been kept relatively
small, this is due to the fact that the 2012 data, especially from late 2012, still needs
to be thoroughly tested for completeness and correctness before it can be included in
a larger study.
4.3.3 Plug in Patterns: Seasonal Changes
This study is an investigation of possible changes in plug in behavior due to seasonal
changes. To this aim two samples are compared from the month of February and June
2012 - see figure 4.5.
Figure 4.5: Winter vs. summer month - Comparison between the plug in periodparameters of the month of February and June 2012.
A study have been conducted to compare the plug in periods of ten EVs driving in
February (February-set) with ten EVs used in June (June-set). Both the February-set
49

4. EV OWNER
Parameter February -Mean
February -SD
June - Mean June - SD
Plug in period duration 12:32:30 66 (Min) 11:38:20 85 (Min)
Charge period duration 04:06:02 31 (Min) 04:12:35 20 (Min)
Plug in period start SOC 50 7 (Percent) 46 5 (Percent)
Plug in period end SOC 100 1 (Percent) 99 7 (Percent)
Plug in period start 19:40:15 64 (Min) 20:06:29 56 (Min)
Plug in period end 08:12:45 22 (Min) 07:44:49 72 (Min)
Table 4.2: Plug in period seasonal averages - February and June set.
and June-set of EVs are equally distributed between the same two cities. The results
can be seen in table 4.2.
From an fleet operator point of view the February-set vehicles seems to have greater
flexibility in that they are plugged in for longer durations. A possible reason could be
an altered behavior due to changes in hours of daylight (People might get up later and
arrive home earlier during winter).
It is however dangerous to claim such causality based on the limited amount of
samples used in the data. Even if having the same distribution of vehicles betweens
cities in each set may remove some geographical bias, it is still different families driving
the vehicles and such bias can only be compensated for by increasing the sample size.
The above should therefore be supplemented by other larger investigations.
4.3.4 Plug in Patterns: Familiarization
Another interesting study question is whether there is a change in plug in behavior
when comparing the initial part of the test period with the last.
If, for instance, an EV owner plugs in less often due to increased “range confidence”,
it will result both in less availability and, when the EV is available, a higher energy
demand. The result is a significant reduction in flexibility as expressed in the flexibility
function described in the introduction 4.1.
This study is illustrated in figure 4.6 and includes 12 EV test families distributed
equally between four cities. The first, approximately 90 days, of a test period constitutes
the initial period while the last 90 days represents the mature period. The result is
presented in table 4.3.
50

4.3 Thesis Work and Contributions
Figure 4.6: Initial vs. mature use - Comparison between the first half and last halfof the test periods during the winter/early spring months of 2012.
Parameter Initial -Mean
Initial - SD Mature -Mean
Mature -SD
Plug in period duration 13:03:43 52 (Min) 12:41:44 32 (Min)
Charge period duration 04:06:08 23 (Min) 04:03:55 15 (Min)
Plug in period start SOC 48 4 (Percent) 49 4 (Percent)
Plug in period end SOC 99 4 (Percent) 100 0 (Percent)
Plug in period start 19:04:47 47 (Min) 19:21:25 45 (Min)
Plug in period end 08:08:30 37 (Min) 08:03:09 27 (Min)
Table 4.3: Plug in period familiarization averages - Initial and mature set.
51

4. EV OWNER
Based on this sample there seems to be little difference between the initial and
mature part of the test periods. Also the amount of plug ins are relatively stable
throughout the two sets. The EVs seems, however, to be connected a bit longer (13:03
vs 12:41) in the initial period and for these 12 vehicles and test families, this results in
the fleet having greater flexibility 4.1 and perhaps, value, for the fleet operator.
The relatively small sample size and time period in consideration makes the result
more sensitive to vacation periods. Again, it is the aim to repeat the study when more
data have become available.
4.3.5 Plug in Variance Case and Relation to Smart Charging
This section will concentrate on a single vehicle to illustrate how charging flexibility may
be used for different purposes. An EV driving in northern Jutland have been selected.
The EV has a total of 55 night workday plug ins over the three month trail period
signifying a very frequent and consistent use. Figure 4.7 shows the SOC distribution
at the start of plug in.
Figure 4.7: SOC distribution for case EV - Distribution of 55 SOC measurementswith a mean of 39 (SD 19).
The vehicle is used for long daily commutes which is reflected in the relatively low
average plug in SOC.
For the same vehicle, the cumulative distribution of plug in and plug out times are
illustrated. For the sake of the illustration the distribution of the plug in times are
”inverted” so that the ”valley” in the graph represents a high probability of the EV
being available to the grid. The variance of the SOC and Plug in/out distributions
matters since a high standard deviation may can result in a higher risk for controlled
charging. I.e. the fleet operator can underestimate the energy need or the amount of
time available. It may be necessary to consider a trade-off between risk and benefit.
52

4.4 Sub-conclusion
For this case it is riskier to postpone charging to the early morning hours between
5:30 and 6:45. The ”risk-area” would increase if the distribution were more negatively
skewed i.e. left tailed. If a specific ”expected time of plug out” is chosen (i.e. 6:20) the
fleet operator can tell the owner that this, based on the plug out distribution, would
be appropriate roughly 90 percent of the time. The EV owner should than accept the
slight risk of leaving with less energy than planned when plug out happens earlier than
expected.
The only reason the fleet operator and owner would take such a risk is if the benefit
of charging is high in the same hours where there is a small chance a plug out may
occur. Decision making under uncertainty is left to chapter seven: ”Optimization”
later in this thesis.
This section concludes by showing some of the possible drivers for controlled charg-
ing. Data for all sources are collected for the same period (April to June) and part of
Denmark (Western Denmark) as was the case for the family testing the EV.
Of the sources both wind and market prices seems to favour night charging. For
wind, the average production is a bit lower during night but remains more stable than
the demand which falls considerably. It is important to add that looking at the dynamic
behavior in a sub-hour time-scale, wind production can exceed demand at several points
in time. The graph only hints to the possibility of charging based on wind energy - not
on power services such as regulation/ancillary services.
For a house-mounted PV however, there is little synergy to be found. The short
period during the morning (around 6:20) where energy potentially could be drawn from
PV to EV represents a high risk (for the EV leaving) small benefit (only few Watts of
power) scenario.
In chapter seven ”Optimization”, the price of energy is used as motivation for
controlled charging.
4.4 Sub-conclusion
The following sections concludes this chapter by presenting and discussing results and
by giving recommendations on future work.
53

4. EV OWNER
Figure 4.8: Plug in/out cumulative distributions and input for value functions- Visualisation of availability compared to the sources that may motivate controlled nightcharging.
54

4.4 Sub-conclusion
4.4.1 Contributions and Results by the Thesis
In a study based on ICE vehicles the following have been done:
• An approach to simple plug in period prediction based on exponential smoothing
have been proposed.
• The above method have been implemented in demonstration software for EV fleet
management as part of the EDISON project.
Next, it is demonstrated how real EV data may be used to investigate plug in
behavior. This includes:
• A description of the main parameters that determines plug in periods usefulness
for controlled charging.
• Early indications on the effects that EV familiarisation and different seasons may
have on plug in behavior.
• A specific EV is used to illustrate plug in availability compared to different value-
sources for controlled charging.
The author hopes that such investigations can help uncover the role and impact
that EV owner plug in behavior has in regards to intelligent EV utilization concepts.
4.4.2 Discussion and Recommendations
The control systems managing charging, should know the plug in patterns of the EV
owner as well as possible. This can both increase convenience by reducing the need
of EV owner intervention in smart charging management, and at the same time make
sure that the flexibility of the vehicle is used optimally without violating the driving
needs of the EV owner.
Investigations on the Test-An-EV data indicates that there is a lot of charging
flexibility available for the families included in the test programme (plug in period
duration compared to energy demand). For a specific sample investigated, there seemed
to be more flexibility available during a winter month compared to a summer month.
EV driving familiarization does not seem to have a great impact on flexibility based on
55

4. EV OWNER
the small sample investigated. The studies should, however, be validated using a larger
sample to reduce the sampling error.
The fleet operator will have to describe the risk/benefit trade-off of controlled charg-
ing to the EV owner, i.e., the EV owner must accept that the fleet operator may mis-
calculate the charging flexibility 1 out of X times. Based on the plug out probability
distribution the fleet operator may, for instance, choose an expected plug out time that
in three percent of the cases will be later than the actual plug out. If the owner then
plugs out earlier than expected, and the fleet operator had planned charging after that
point in time, the EV may leave with less energy than intended. A risk described by a
percentage may be easier to communicate to the EV owner than a more sophisticated
expression of the risk/benefit trade-off.
There are numerous ways in which EV owner behavior can be modelled and pre-
dicted. These can, however, be kept relatively simple if night charging is the only
period considered and mechanisms such as ”instant charging” and ”minimum range”
features are used to handle outliers (e.g. extraordinary mid-night driving needs).
An important issue in relation to data collection and prediction of behavioral pat-
terns, is the protection of EV owner privacy. This have to be dealt with pro-actively
by the fleet operator.
56

5
Control Architecture
This chapter deals with the control architecture as part of the “Supporting informatics”
investigations of this thesis. The following publications constitute the core contributions
done by the Thesis Author to this area:
B A comparison of electric vehicle integration projects.
C Smartly Charging the Electric Vehicle Fleet.
The publications will be referred to by their letter (B,C) in the following.
5.1 Introduction
When the purpose of controlled charging and the requirements and impacts of key
stakeholders have been established, the next task will be to build a suitable control ar-
chitecture. Choosing the control architecture comes down to deciding what entities will
have control over charging, where physically to place the necessary control systems and
software logic and finally to establish the, possibly hierarchical, relationship between
such systems.
The same aim, for instance smart charging, can be achieved by several different
control architectures. There may, however, be differences in what is most practical
and efficient to implement. This chapter is the first within the supporting informatics
part of this thesis since the choice of control architecture will shape the form of the
communication solutions and optimization models to be used. Basically there are two
57

5. CONTROL ARCHITECTURE
high-level architectures to choose from - Centralized or distributed. These options are
shown in figure 5.1
Figure 5.1: Centralized and distributed architecture - The high-level architecturaloptions for EV integration.
A centralized architecture is generally characterized by having the control and de-
cision making delegated to a common coordinator and letting each Distributed Energy
Resource (DER) be directly controlled by this entity. In contrast, a distributed design
means that each DER will act as an independent, intelligent, and autonomous agent
that responds according to a set of incentives and information. The above is a coarse-
grained distinction and several flavors and variations exist. The centralized approach
maps nicely to the Virtual Power Plant (VPP) concept while the distributed approach
can be related to the field of agent theory.
Another important aspect is how a resource, in this case an Electric Vehicle (EV),
is described to the surrounding world. Another useful distinction can be introduced:
Structural decomposition Each detailed component, all measurements and the ex-
act operational state of a unit is communicated to external entities with the
proper permissions to receive such information.
Functional decomposition Internal details is hidden and the resource is rather de-
scribed by the functional services that the unit may provide.
The former category fits well with the approach in classical SCADA-like automation
approaches as that of IEC 61850 which will be described in the next chapter. The latter
58
5.2 Related Work within Area
fits with the more autonomous, lowly coupled, approach followed in the service oriented
concept seen within contemporary internet use. A final consideration covered by this
chapter is what high-level functionalities that should be implemented in the control
system after a control architecture has been chosen. In this thesis the centralized control
architecture is chosen and the “Thesis work and contributions” section describes why.
5.2 Related Work within Area
One of the largest and first European projects to thoroughly explore the use of the VPP
concept was the FENIX project (2). This project introduced a distinction between a
commercial VPP (CVPP) and a technical VPP (TVPP). The commercial version would
act on the power market to meet a financial goal. In contrast, the technical version
would be used to provide technical services to the grid.
Another thorough study of the VPP concept has been done by Shi in (4). Shi
has focused on another type of the VPP concept - the generic virtual power plant
(GVPP). The reason for a VPP being generic is that it would be able to handle and
aggregate various types of DERs. As will be done for the EDISON VPP/fleet operator
in this chapter, Shi has suggested the generic, high-level functions that would need to
be implemented to support the operation of the aggregator. See figure 5.2
For reference, it can be interesting to investigate the control architecture chosen by
a set of EV integration projects. This was investigated in core publication B and is
illustrated in figure 5.3.
As can be seen, both the e-mobility project Berlin and the University Of Delaware
(UD) Vehicle-To-Grid (V2G) programme uses partly-centralized approaches. The e-
mobility project, like what is the case for UD V2G, lets the EV itself implement software
that will dictate the degree to which the EV will participate in intelligent EV utilization
concepts.
The UD V2G programme depends on the area of agent theory by defining local
software agents (JADE framework) for each device in the system (39) - e.g. an EVSE
agent, an EV agent and an aggregator agent. Each of these have distinct and unique
objectives and the communication between them is “negotiation-like” in nature. In-
terestingly, since the implementation is aimed at current markets designs in the PJM
area, a number of the responsibilities still have to be left to the aggregator and thus the
59

5. CONTROL ARCHITECTURE
Figure 5.2: Function-based design for a GVPP - A generic and reusable model thatgeneralizes the objective of the VPPs via a function-based approach. Source: Shi You (4)
Figure 5.3: Comparison of architectures - Architectures chosen in a set of state-of-theart electric vehicle demonstration projects
60

5.3 Thesis Work and Contributions
solution can be considered a hybrid between the centralized and de-centralized design,
i.e., the individual EV agent will be given responsibility of making sure that driving
demands are meet - but will depend on the aggregator agent in connecting and adhering
to the power market.
5.3 Thesis Work and Contributions
This section presents the architecture chosen as part of the EDISON project and how
it was used to implement a EDISON VPP back-end system, used to demonstrate the
operation of a fleet operator.
5.3.1 System Architecture of EDISON
In the EDISON project, the choice of control architecture for demonstration software
was left to Work Package 3 (WP3) in which the Thesis Author participated. Here the
choice became using a centralized design. The main reason being that this approach
best suits the current market models and available EV/EV Supply Equipment (EVSE)
technology.
The use of agents is projected to allow for a more flexible and dynamic forming of
ad-hoc groups of DERs for meeting a broad array of goals (39). It is, however, the
opinion of the Thesis Author and the other participants of EDISON WP3, that agent
technology may take more years to implement in the power system than is the case of
a centralized approach.
EDISON WP3 was inspired by the distinctions made in FENIX between a technical
and commercial VPP and therefore explored both options. In the end, the choice fell
on the commercial VPP since the market allows for providing technical services to the
power system while at the same time releasing a monetary benefit to stakeholders. This
also made the implementation easier as the interface to the market is better defined
than an interface directly to a system operator would be. The two possible approaches
are illustrated in figure 5.4.
Relating the choice of VPP control architecture in EDISON to the variations de-
scribed by FENIX and Shi, The EDISON VPP then becomes centralized, non-generic
(focused on the EV as a resource) and commercial (interface with the market). Again,
61

5. CONTROL ARCHITECTURE
Figure 5.4: Architecture in EDISON - Approaches for interfacing with the powersystem either directly (Via DSO) or to the market (Via market players) Source: BernhardJansen, IBM, EDISON internal report
it can be argued that participating in present and future ancillary service market prod-
ucts (see market chapter) makes it is less necessary to distinguish between a technical
and commercial purpose of a VPP - both would be done at once.
5.3.2 High-level Functions
Having defined the architecture, the focus was then put on the functions needed in the
EDISON VPP used by the fleet operator. Figure 5.5 presents such functions.
This functionalities are presented in a book chapter as part of the core publication
C The figure conveys that the control system would have to handle the EV fleet as
an aggregated group when acting and optimizing toward market players, but will have
to take individual considerations into account when managing the charging behavior
of individual EVs. This observation has an impact on how to form the optimization
problem for the fleet. Another property of the figure is that functionality is divided
into three distinct groups. Namely ”data”, ”analytics”, and ”logic”:
Data This group stores previous market prices and fleet behavior on an aggregated
62

5.3 Thesis Work and Contributions
Figure 5.5: High-level centralized fleet operator functionalities - Functions at theindividual and aggregated level, subdivided into ’data’, ’analytics’ and ’logic’ )
63
5. CONTROL ARCHITECTURE
level, enabling better forecasting and optimization for acting on the power market.
On an individual level, data is stored that describes the service level agreement
between the EDISON VPP and an EV owner, EV hardware specifications and
the EV owner’s plug in habits.
Analytics This group covers the mathematical computations necessary to support the
logic of the EDISON VPP. Forecasting relies on historical data to predict market
prices on an aggregated level which supports better bid strategies. Forecasting
also determines future individual EV usage patterns. Optimization is used to
minimize charging costs of the EVs on both the aggregated and individual level.
The individual optimization is limited by the constraints introduced by the dis-
tribution grid, EV specifications and EV owner energy requirements. On the
aggregated level, profit maximization can be done when acting on the regulating
and reserve markets.
Logic This group defines the main operational goals of the EDISON VPP, namely to
act on the power market to generate savings or revenue for itself and its clients,
and to intelligently manage the charging behavior of EVs through individually
tailored charging schedules.
The demonstration software developed as part of EDISON implements the above
functionalities.
5.4 Sub-conclusion
The following sections concludes this chapter by presenting and discussing results and
by giving recommendations on future work.
5.4.1 Contributions and Results by the Thesis
The architectural choice in EDISON has been inspired by architectures explored by
other research projects and academia. The Thesis Author have participated in building
an architecture that is:
• Centralized, and thus depends on an aggregating entity.
• Based on an commercial objective, trading on the market.
64

5.4 Sub-conclusion
• Focused on managing EVs, rather than being generic.
Having established the control architecture, the Thesis Author participated in building
a back-end system to demonstrate coordinated charging. To this end the follow was
done:
• Necessary functionalities were defined in terms of data, analytics and logic.
• The backend system was developed in code and was used in end-to-end tests in
EDISON.
• The developed back-end system facilitated tests of communication, prediction and
optimization as well as the EV and EVSE hardware included in the field trails.
5.4.2 Discussion and Recommendations
The EDISON project have identified a centralized approach as the most suitable short-
term architecture for EV integration. As the power markets and power system evolves,
the attention may be turned to a more decentralized approach, e.g., using software
agents.
An interesting aspect of the placement of intelligence and control inside or outside
the EV itself, is the approach chosen by car OEMs. OEMs involved in early smart
charging schemes such as Nissan and the Daimler group have promoted solutions where
the EV is in charge of the charging process. This is not necessarily because the OEMs
are strong believers in agent technology but rather because they want to protect the
EV and its battery from external mismanagement and at the same time protect the
business potential of intelligent charging.
A conclusion drawn from the core publication B, regarding the architecture chosen
by different projects is that the placement of control logic and responsibilities between
EV, EVSE and aggregator, differs between the integration projects investigated. One
key question is how much intelligence will implemented at the EV. If a common archi-
tecture is not found, then standardization efforts must respect and manage the resulting
diversity.
65

5. CONTROL ARCHITECTURE
66

6
Communication
This chapter deals with communication as part of the “Supporting informatics” inves-
tigations of this thesis. The following publications constitute the core contributions
done by the Thesis Author to this area:
B A comparison of electric vehicle integration projects.
C Smartly Charging the Electric Vehicle Fleet.
F Facilitating a generic communication interface to distributed energy resources - Map-
ping IEC 61850 to RESTful Services.
The publications will be referred to by their letter (B,C,F) in the following.
6.1 Introduction
Having established a control architecture, the next question is how to transfer the
necessary pieces of information between the control systems in a reliable, robust, secure,
and standardized way.
Typically a communication standard consists of the following components:
Data model The formalized description of the structuring and formatting of data.
Protocol mapping The protocols and technologies that are used to transfer the data
across a network.
67

6. COMMUNICATION
Smart grid informatics research has already presented a host of possible communi-
cation solutions. Often smart grid integration sub-areas have their own set of communi-
cation solutions. Most types of Distributed Energy Resources (DER), for instance, have
their own set of standards. Take for instance the IEC 61400-25 communication interface
standard for wind power plants, home automation standards such as Open Building
Information Xchange (oBIX), AS 4755.3.1-2008 (Air Condition demand response), and
the work of the OPEN meter network to standardize smart meter communication. Such
standardization efforts are also found within Electric Vehicle (EV) integration.
It can be useful to divide communication standards into a few categories:
Firstly, communication solutions can either be said to be generic or application
specific in nature depending on how many scenarios and devices they are designed to
cover. New smart grid application areas can either be addressed by extending existing
standards or by proposing new ones.
Secondly, as touched upon in chapter five, “Control architecture”, communication
standards can either use a structural of functional decomposition of resources, i.e.,
describe a device in terms of its exact operational parameters and physical components
or in terms of the high-level functions and services that it can provide.
In relation to the categories mentioned above, IEC 61850 can be called a generic
standard using structural decomposition. It also represent a relatively mature standard
and it therefore seems reasonable to investigate its potential in EV integration before
suggesting new solutions.
6.2 Related Work within Area
The use of the IEC 61850 standard for substation automation is thoroughly investigated
and documented (40, 41). Such publications describe the potential that IEC 61850 has
in providing monitoring and control capability of in-field equipment in an interoperable
and standardized fashion. Also, the extension of IEC 61850 to applications beyond
substations have also been thoroughly researched (42, 43).
As mentioned in the introduction, most communication standards can be described
in terms of their data models and protocol mappings.
An investigation regarding the IEC 61850 protocol mapping can be found in (44)
by Schmutzler. Here, Schmutzler demonstrates how Devices Profile for Web Services
68

6.2 Related Work within Area
(DPWS) can be mapped to IEC 61850. DPWS describes how the web service concept,
and the WS* technologies behind it, can be used towards embedded devices. Schmutzler
have thereby demonstrated how a popular and feature-rich web technology can be
applied to IEC 61850 to increase interoperability.
Other research also cover the data description of IEC 61850. In (45), Sui suggests
using OPC UA instead of MMS and supplementing the data model of IEC 61850 with
OPC UA information modelling. The purpose of applying OPC UA is to promotes
DERs as Service Oriented Architecture (SOA) ready devices.
The possibility of extending IEC 61850 standard to many different applications, us-
ing different contemporary communication technologies, increases its potential towards
EV integration.
In B, a comparison is made between the communication technology solutions chosen
by three projects as seen in figure 6.1.
Figure 6.1: Project comparison of communication technologies - Comparison ofthe communication technologies chosen by three EV integration projects.
The projects all use the internet and the associated TCP/IP stack on the net-
work/transport layer as well as Power Line Communication (PLC) on the physical
layer (between EV and EVSE). While the projects are aligned on the lower parts of the
OSI stack, they are very divided on the application level protocols. The solutions span
from the structural decomposition used by IEC 61850 to the use of agent software.
The EDISON project is the only of the investigated projects to use a standardized
communication protocol (IEC 61850).
If IEC 61850 is used between fleet operator and EVSE, as described in the following
section, there is still a need of communication solutions between EVSE and EV.
69

6. COMMUNICATION
Some of the options available for EV to EVSE communication have been investi-
gated in a special project (46) supervised by the Thesis Author. In the project report,
Johansen compared the use of Negative Side Signaling (NSS) and PLC for the physical
communication layer. The report points to PLC as being the most likely candidate
for use in future EV integration. For PLC the main choice is between using wide- or
narrow band technologies. HomePlug GP is described as a wideband solution with
a data rate of up to 10Mbps. There are some technical (limited range, no support
for both DC and AC) and regulatory (reserved frequency bands) limitations on using
wideband technologies. One of the main advantages of wideband, however, is a higher
data rate compared to narrowband. The rates given by narrowband is sufficient for
controlled charging-related communication but may not support additional communi-
cation applications, e.g., multimedia. The report also investigates the use of a tentative
version of the ISO/IEC 15118-2 standard for the upper communication layers. The use
of IEC 15118 and PLC, as part of the EDISON project, is also touched upon in C. The
emphasis in the thesis and the following sections is on communication between EVSE
and fleet operator.
6.3 Thesis Work and Contributions
This section will describe the Thesis Authors experience with the IEC 61850 standard
for the application of EV integration.
6.3.1 Research on the IEC 61850
Figure 6.2 illustrates the main components of IEC 61850 based on the structural de-
composition of a Micro Combined Heat and Power Unit (CHP).
The figure includes the reusable “building blocks” of the data model (logical nodes,
data sets etc.) and the suggested communication protocol mapping (Manufacturing
Message Specification (MMS) on top of the TCP/IP stack using Abstract Communi-
cation Service Interface (ASCI) definitions). For a description of the standard refer to
core publications C and F.
While working with the standard, the Thesis Author together with co-authors in F
have suggested extensions and additions to both the protocol mapping and data model.
70

6.3 Thesis Work and Contributions
Figure 6.2: The 61850 standard - Main concept and components of the 61850 standard- data model and protocol mapping, source: Anders Bro Pedersen(47).
6.3.1.1 Using REST Services
As mentioned above, the IEC 61850 standard initially pointed only to MMS as the
recommended application level protocol. While MMS represents a valid choice for IEC
61850 implementation, there are certainly other approaches which can and should be
explored.
An obvious candidate is the use of web service technologies, which have seen use
in a broad set of domains to promote SOA. Web services represents a well-understood,
open, interoperable and feature-rich framework to grant access to information services
on the web. Web services have, for instance, seen early support in standards such as
61400-25 for wind power plants.
Web services are often associated with the Simple Object Access Protocol (SOAP).
The addition of SOAP based extensions to web services provides a rich list of features
and extensions. These features and extensions are captured in a set of specifications
referred to as “WS-*”. Instead of focusing on SOAP-based services, however, another
alternative exists; REpresentational State Transfer (REST) services. REST services
(48) is considered a simpler and more web-centric approach to web services that uses the
basic features and methods (GET, POST, PUT and DELETE) of the HTTP protocol.
71
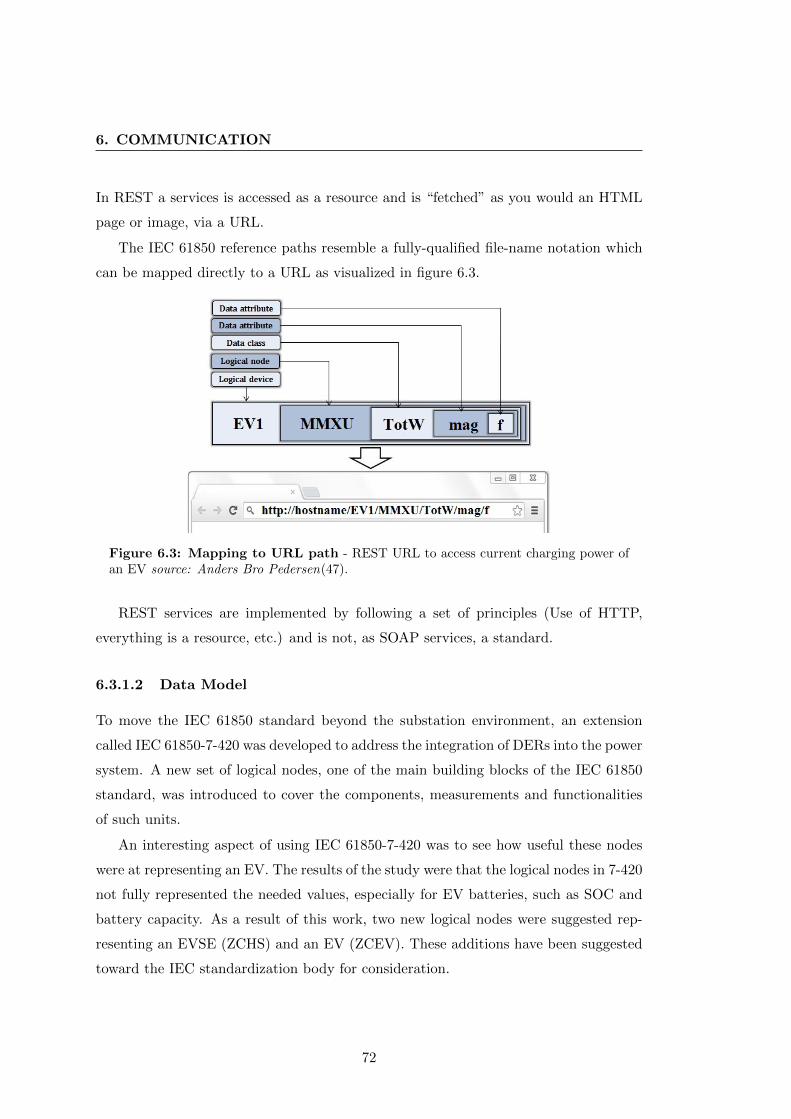
6. COMMUNICATION
In REST a services is accessed as a resource and is “fetched” as you would an HTML
page or image, via a URL.
The IEC 61850 reference paths resemble a fully-qualified file-name notation which
can be mapped directly to a URL as visualized in figure 6.3.
Figure 6.3: Mapping to URL path - REST URL to access current charging power ofan EV source: Anders Bro Pedersen(47).
REST services are implemented by following a set of principles (Use of HTTP,
everything is a resource, etc.) and is not, as SOAP services, a standard.
6.3.1.2 Data Model
To move the IEC 61850 standard beyond the substation environment, an extension
called IEC 61850-7-420 was developed to address the integration of DERs into the power
system. A new set of logical nodes, one of the main building blocks of the IEC 61850
standard, was introduced to cover the components, measurements and functionalities
of such units.
An interesting aspect of using IEC 61850-7-420 was to see how useful these nodes
were at representing an EV. The results of the study were that the logical nodes in 7-420
not fully represented the needed values, especially for EV batteries, such as SOC and
battery capacity. As a result of this work, two new logical nodes were suggested rep-
resenting an EVSE (ZCHS) and an EV (ZCEV). These additions have been suggested
toward the IEC standardization body for consideration.
72

6.3 Thesis Work and Contributions
The logical nodes from IEC 61850-7-420 which were used in the implementation,
as well as the new ZCEV and ZCHS nodes (Marked with “61850 Extension”), are
illustrated in figure 6.3
Figure 6.4: Logical nodes used in implementation - List of logical nodes used torepresent the EVSE and EV as part of the data model of IEC 61850 source: Anders BroPedersen.
6.3.1.3 Test of IEC 61850/REST Implementation
An IEC compliant server have been developed as described in (47) and have been tested
in a series of demonstrations towards electric vehicles as part of the EDISON project.
The full EDISON communication setup is illustrated by figure 6.5.
The communication setup have been tested towards different brands of EVs in
EDISON. Most vehicles were monitored in a read-only fashion while a single vehicle
was controlled via IEC 61850 based schedules (”DSCH - Energy and/or Ancillary Ser-
vices Schedule” and “DSCC - Energy and/or Ancillary Services Schedule Control”). A
screenshot from a demonstration with such vehicles can be seen in figure 6.6.
73

6. COMMUNICATION
Figure 6.5: Communication setup in EDISON - Communication standards used toconnect the EV, EVSE and fleet operator.
Figure 6.6: Test of IEC 61850 communication - Use of IEC 61850 towards a vehiclefleet - data such as status and SOC is displayed in a fleet operator interface.
74

6.4 Sub-conclusion
6.4 Sub-conclusion
The following sections concludes this chapter by presenting and discussing results and
by giving recommendations on future work.
6.4.1 Contributions and Results by the Thesis
The Thesis Author have contributed to the following activities relating to communica-
tion solutions for EV integration:
• IEC 61850 have been evaluated for the application of EV Integration.
• The use of REST services as a protocol mapping for IEC 61850 have been inves-
tigated.
• A list of logical node extensions have been suggested as an addition to IEC 61850-
7-420 to better represent EVs and EVSEs. They have been sent to IEC WG17
for possible inclusion in an updated version of IEC 61850-7-420.
• The suggested communication setup have been tested in a set of EDISON-related
demonstrations.
The communication qualities, focused upon throughout this chapter, have been
simplicity and interoperability. Other qualities, such as security and latency, are of
course also important and are discussed in the following section.
6.4.2 Discussion and Recommendations
Security is an important topic, both for EV integration and for smart grids in general.
A lot of solutions for providing confidentiality, integrity and availability can be pro-
vided by “of-the-shelf” technologies already tested in other applications. For the IEC
61850/REST implementation the use of the Transport Layer Security (TLS) as a cryp-
tographic protocol can be used to ensure confidentiality and integrity. This protocol
have seen applications in security-critical applications such as web banking.
If using SOAP based web services on top of the IEC 61850 standard, Web Service
Security (WS-security) can be used. WS-security describes the use of signed SOAP
messages for integrity, encryption in SOAP messages for confidentiality and the use of
security tokens for guaranteeing sender identity.
75

6. COMMUNICATION
If MMS is used as the application layer protocol, on top of IEC 61850, a security
profile is recommended in the “IEC 62351-4 Security for any profiles including MMS”.
The IEC 62351 standard was made specifically to define security for a number of IEC
Technical Committee 57 communication standards - including IEC 61850. IEC 62351
also points at TLS as a protocol for providing security.
In general, it is recommended to align EV communication security with smart grid
related security standardization work from standards organisations such as IEC (e.g.
IEC 62351) and NIST (e.g. “Smart Grid Cyber Security guidelines”).
Latency in communication depends in part on the inevitable delay caused by the
use of the internet and the associated routing of data over the nodes in a huge meshed
network. Another part is the overhead, in term of size, that the protocols used add to
the data packages.
Theoretically, the use of REST should reduce the amount of data to be sent since
the overhead of using SOAP is avoided. It is, however, unknown if this makes a mea-
surable difference. Latency in communication have not been a topic of investigation in
this thesis, but the following observation can be made; In demonstrations performed
over the internet with the IEC 61850/REST stack, data was received within a sub-
second time scale. If the application domain is ancillary service market integration
(”Market integration” chapter) and the shortest required response time here is 30 sec-
onds (”Primary reserve” and “Frequency controlled disturbance reserve”) then latency
is not a problem. In some of the most time-critical intelligent EV integration concepts
proposed, the EV would react directly on local measurements of net-frequency, and
communication latency would not matter.
There are several other communication issues that should also be considered, among
them are scalability, accessibility and firewall traversal. For the latter issues a solution
using SIP have been suggested by Jansen in (49). SIP provides a means for creating a
point-to-point connection between clients not accessible through a global fixed IP. For
firewall traversal, Session Traversal Utilities for NAT (STUN) and the Traversal Using
Relay NAT (TURN) is suggested. This approach is also described in C.
Looking to the future, it is likely that new standards covering EV communication
will emerge. This chapter have already touched upon the ISO/IEC 15118 which defines
how EV to EVSE communication can be implemented. A protocol possibly rivalling
76

6.4 Sub-conclusion
IEC 61850 for EV use, is the Open Charge Point Protocol (OCPP). Flavours of OCPP
is already supported by a series of EVSE vendors.
Communication standards should support as many intelligent EV utilization con-
cepts as possible. For the IEC 61850 implementation described in this chapter this
meant adding logical nodes to describe battery SOC and the use of energy Schedules
to control charging - this allowed for the concept of smart charging to be realised.
It will be interesting to see if future smart grid standards will be as broad and
generic as IEC 61850 or more application specific like IEC 15118 and OCPP. It will
also be interesting to see whether structural or functional decompositions will be the
norm. It can be argued that the latter is a better match with the SOA paradigm often
pursued in modern web implementations.
77

6. COMMUNICATION
78

7
Optimization
This chapter deals with charging optimization as part of the “Supporting informatics”
investigations of this thesis. The following publication constitute the core contributions
done by the Thesis Author to this area:
E Prediction and optimization methods for electric vehicle charging schedules in the
EDISON project.
The publication will be referred to by the letter (E) in the following.
In addition to the existing publication, new material, mentioned in the sections on
markets and stochastic optimization, are presented in this chapter. This work is part of
a study attempting to combine real Electric Vehicle (EV) data (new material in chapter
four “EV owner”) with stochastic programming (this chapter).
7.1 Introduction
Mathematical optimization is used to make the best possible decisions given a well
defined objective and a specific domain. Applied to this domain (intelligent EV inte-
gration), objectives can be dictated by the market (chapter two) and the constraints
by the distribution grid (chapter three) and the EV owner (chapter four). The transfer
of EV owner, grid and market data must be supported by the used control architecture
(chapter five) and communication technologies (chapter six).
An important issue is the information on which the optimization will be based. It is
necessary to understand what information will be available at each operational stage,
79

7. OPTIMIZATION
the possible uncertainty of such information and the information “certainty gain” as
time progresses.
Chapter three “Grid integration” described how grid capacity information may be
made available to the fleet operator and chapter four: “EV owner” described how
plug in behavior may be predicted. The latter chapter links directly to this one, by
presenting the data which can be used for scenario generation.
The following figure illustrates the approach used in this chapter where predicted
or known information is used for defining a suitable charging schedule for an EV.
This process could be repeated as new information is made available throughout the
operational stage.
Figure 7.1: Optimization approach - Approach for calculating a cost minimized charg-ing schedule based on known and uncertain information.
The figure also shows how the schedule is used on an individual (towards EV) and
aggregated level (towards market). The distinction between operating on an individual
and aggregated level was introduced in chapter five “Control architecture”. Using the
approach in this chapter would mean that the fleet operator would first make individual
schedules and then “sum them up” to arrive a the aggregated bids and actions on the
market.
The fleet operator can not avoid individual charging management, due to individual
hard constrains, but a possible refinement of the above approach, not explored here,
would be to consider the EVs as a fleet until the operational stage.
Using fleet averages on demand and availability may be sufficient for acting on the
market since there will be a “smoothing effect” when enough EVs are part of the fleet.
This approach would also be computationally less heavy.
80

7.2 Related Work within Area
Making individual EV schedules during the planning phase, might, on the other
hand, yield the most accurate market bids. These issues of individual vs. aggregated
portfolio management is briefly discussed in the last section of the chapter, but mostly
left to future research.
This chapter will focus on charging cost minimization for a single vehicle considering
the access to different markets and uncertainty in plug in, demand and grid capacity.
The mathematical model which will be presented here has been implemented and
tested using ”General Algebraic Modeling System” (GAMS) software.
7.2 Related Work within Area
In a first wave of research within EV fleet optimization, different combinations of opti-
mization objectives and constraint have been investigated. Two commonly investigated
objectives are either the minimization of charging costs or the maximization of the num-
ber of EVs the distribution grid can support.
From the former category numerous publications have demonstrated the use of
linear optimization for controlled charging. In the paper (50) the authors demonstrates
the minimization of charging cost using two different approaches for including battery
considerations. One using a quadratic approximation of battery behavior and another
using a linear approximation. The authors found that linear approximation sufficiently
represents the battery and is much faster to compute than the quadratic approach. In
(51), Sundstroem, Corradi and Binding introduces the use of time and energy margins
to compensate for prediction errors in plug in duration and energy demand. This is a
simple approach for handling stochastic EV owner behavior. In (52) Sundstroem and
Binding propose an optimal charging method where the fleet operator is aware of grid
constraints. Here, a cost-minimized charging schedule is validated by building a flow
network and solving the maximum flow problem.
The above papers have demonstrated that optimization methods can reduce the
energy cost for the EV owner and fleet operator while considering several different
constraints.
Concerning the objective of maximizing EV grid integration, a publication by Lopes
in (53) demonstrates that smart charging, specifically aimed at maximising EV pene-
tration, can successfully increase the number of EVs a distribution grid can support.
81
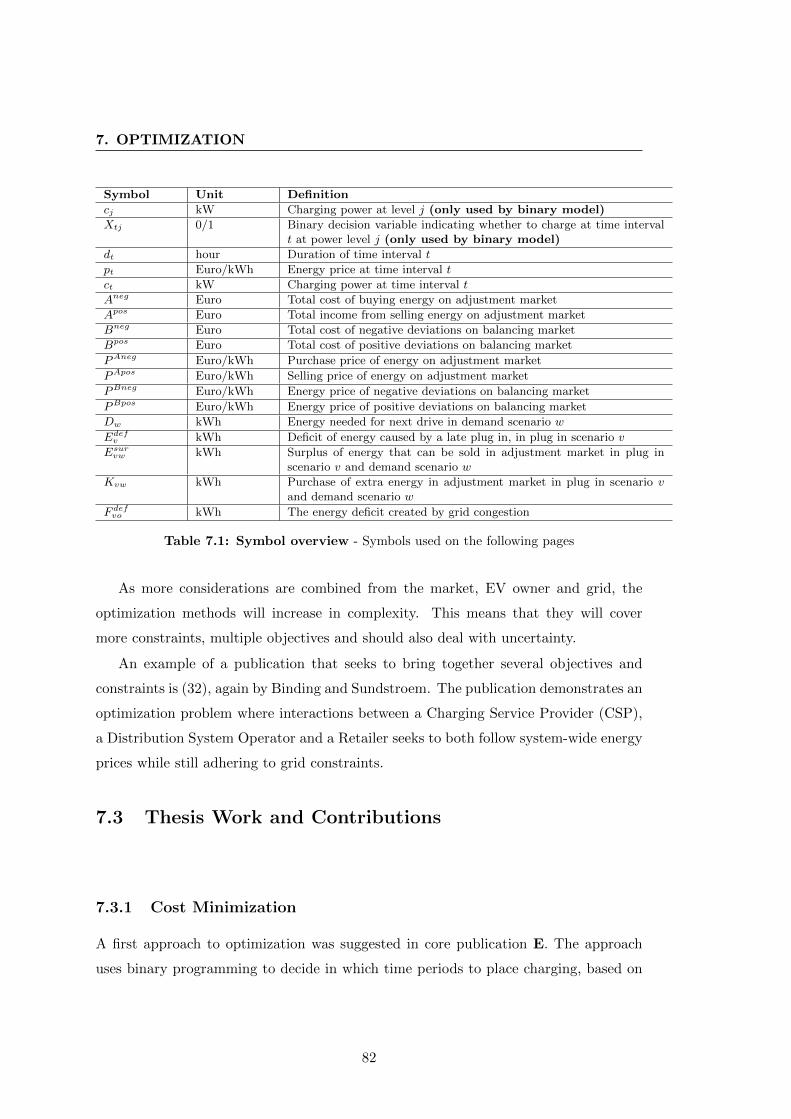
7. OPTIMIZATION
Symbol Unit Definition
cj kW Charging power at level j (only used by binary model)
Xtj 0/1 Binary decision variable indicating whether to charge at time intervalt at power level j (only used by binary model)
dt hour Duration of time interval t
pt Euro/kWh Energy price at time interval t
ct kW Charging power at time interval t
Aneg Euro Total cost of buying energy on adjustment market
Apos Euro Total income from selling energy on adjustment market
Bneg Euro Total cost of negative deviations on balancing market
Bpos Euro Total cost of positive deviations on balancing market
PAneg Euro/kWh Purchase price of energy on adjustment market
PApos Euro/kWh Selling price of energy on adjustment market
PBneg Euro/kWh Energy price of negative deviations on balancing market
PBpos Euro/kWh Energy price of positive deviations on balancing market
Dw kWh Energy needed for next drive in demand scenario w
Edefv kWh Deficit of energy caused by a late plug in, in plug in scenario v
Esurvw kWh Surplus of energy that can be sold in adjustment market in plug in
scenario v and demand scenario w
Kvw kWh Purchase of extra energy in adjustment market in plug in scenario vand demand scenario w
F defvo kWh The energy deficit created by grid congestion
Table 7.1: Symbol overview - Symbols used on the following pages
As more considerations are combined from the market, EV owner and grid, the
optimization methods will increase in complexity. This means that they will cover
more constraints, multiple objectives and should also deal with uncertainty.
An example of a publication that seeks to bring together several objectives and
constraints is (32), again by Binding and Sundstroem. The publication demonstrates an
optimization problem where interactions between a Charging Service Provider (CSP),
a Distribution System Operator and a Retailer seeks to both follow system-wide energy
prices while still adhering to grid constraints.
7.3 Thesis Work and Contributions
7.3.1 Cost Minimization
A first approach to optimization was suggested in core publication E. The approach
uses binary programming to decide in which time periods to place charging, based on
82

7.3 Thesis Work and Contributions
an energy demand and known prices. The availability time periods is predicted using
exponential smoothing. The objective function is defined as follows:
MinT∑
t=1
M∑
j=1
cjdtptXtj (7.1)
Where pt is the cost of energy at time interval t = 1, ..., T . The length of each time
interval is dt and cj is the charging power used from a set of available levels j = 1, ...,M.
In the objective function Xtj is used as the decision variable specifying whether
charging should be carried out at time t with charging level j. The function is then
subject to the following constraints:
M∑
j=1
X1j ≤ 1, ...,M∑
j=1
XTj ≤ 1 (7.2)
M∑
j=1
T∑
t=1
cjdtXtj ≥ D (7.3)
The first of the constraints 7.2 states that in all periods, charging can only be
carried out using one of the available charging levels. The second constraint 7.3 is used
to satisfy an energy demand D for the next trip. It could be possible to include grid
constraints in terms of charging limits using a matrix c ∈ RT×M+ of possible charging
powers where each row would be a timeslot and each column a supported charging
power.
The above represents a first approach to charging optimization using a deterministic
model.
7.3.2 Introducing Markets
In this section the above optimization problem is extended to include decision stages
where the fleet operator can use markets to meet the energy demand of an EV, while
minimizing the cost of charging. The following markets are considered:
Day-ahead market Market in which the fleet operator bids on energy before the day
of operation.
83

7. OPTIMIZATION
Intra-day adjustment market Intra-day market that allows the fleet operator to
compensate for positive or negative deviations after the day-ahead market has
closed.
The model will include two stages - one for each of the above markets. First the
fleet operator will attempt to meet the demand on the day-ahead market based on
the predictions on EV owner plug in time, demand and grid capacity. In the second
stage, when the actual plug in occurs, the exact demand and plug in time will be known
(certainty gain). The fleet operator must then use the adjustment market to compensate
for any energy surplus or deficit caused by the uncertainty. A final market - the
balancing market - is also included as a way to settle real-time imbalances introduced
by the fleet operator. This is not modelled as a stage since it is assumed that there is
no recourse for the kind of real-time events that necessitates the use of this market.
The stages are illustrated in figure 7.2. The picture uses the same terminology
(planning, scheduling, operation) as was introduced in core publication A regarding
the operational stages of a fleet operator.
Figure 7.2: Markets and stages - Use of markets in relation to charging cost minimiza-tion for EVs.
The above approach is not meant to accurately reflect the structure and mechanisms
for any specific market, but rather illustrate how the use of different sub-markets may
influence the optimization done by the fleet operator.
84
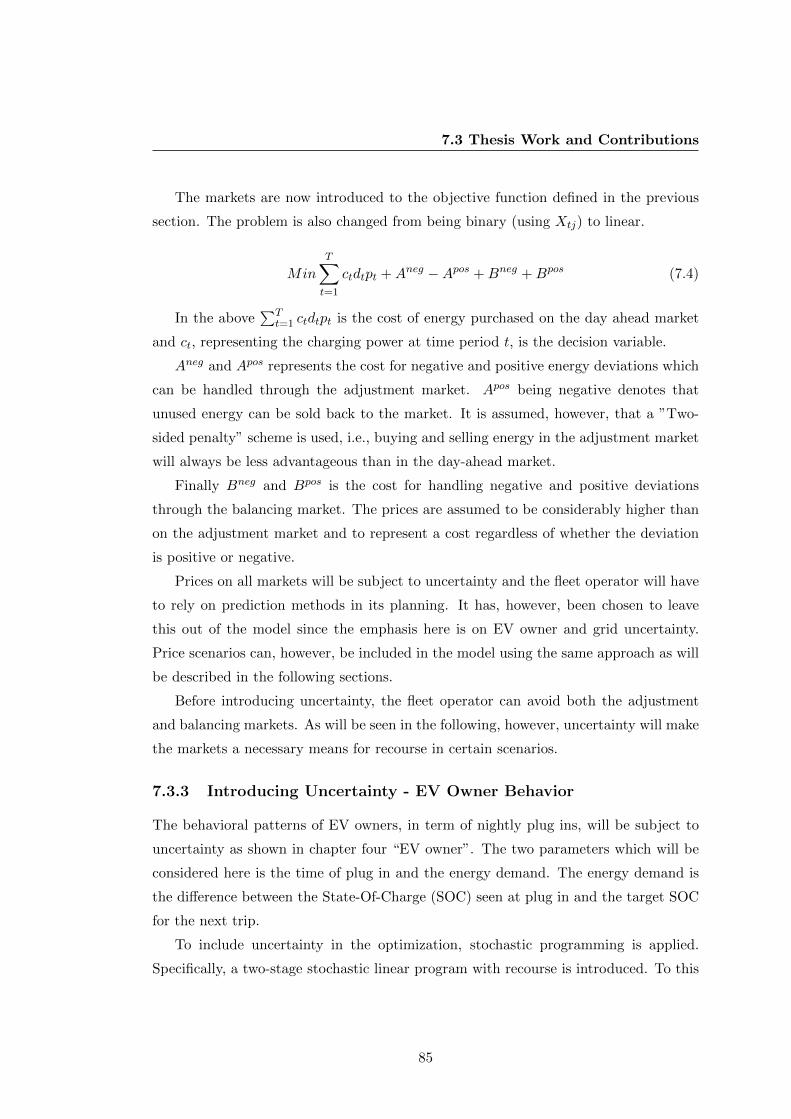
7.3 Thesis Work and Contributions
The markets are now introduced to the objective function defined in the previous
section. The problem is also changed from being binary (using Xtj) to linear.
Min
T∑
t=1
ctdtpt +Aneg −Apos +Bneg +Bpos (7.4)
In the above∑T
t=1 ctdtpt is the cost of energy purchased on the day ahead market
and ct, representing the charging power at time period t, is the decision variable.
Aneg and Apos represents the cost for negative and positive energy deviations which
can be handled through the adjustment market. Apos being negative denotes that
unused energy can be sold back to the market. It is assumed, however, that a ”Two-
sided penalty” scheme is used, i.e., buying and selling energy in the adjustment market
will always be less advantageous than in the day-ahead market.
Finally Bneg and Bpos is the cost for handling negative and positive deviations
through the balancing market. The prices are assumed to be considerably higher than
on the adjustment market and to represent a cost regardless of whether the deviation
is positive or negative.
Prices on all markets will be subject to uncertainty and the fleet operator will have
to rely on prediction methods in its planning. It has, however, been chosen to leave
this out of the model since the emphasis here is on EV owner and grid uncertainty.
Price scenarios can, however, be included in the model using the same approach as will
be described in the following sections.
Before introducing uncertainty, the fleet operator can avoid both the adjustment
and balancing markets. As will be seen in the following, however, uncertainty will make
the markets a necessary means for recourse in certain scenarios.
7.3.3 Introducing Uncertainty - EV Owner Behavior
The behavioral patterns of EV owners, in term of nightly plug ins, will be subject to
uncertainty as shown in chapter four “EV owner”. The two parameters which will be
considered here is the time of plug in and the energy demand. The energy demand is
the difference between the State-Of-Charge (SOC) seen at plug in and the target SOC
for the next trip.
To include uncertainty in the optimization, stochastic programming is applied.
Specifically, a two-stage stochastic linear program with recourse is introduced. To this
85

7. OPTIMIZATION
aim, scenarios for both energy demand and plug in time, are defined with an associated
probability for each scenario.
These scenarios are added to the objective function as follows:
MinW∑
w=1
πw
V∑
v=1
πv
T∑
t=1
ctdtpt +Anegwv −Apos
wv +Bposv (7.5)
In the above, the two summations∑W
w=1 and∑V
v=1 are added and the adjustment
and balancing market costs are altered to depend on the scenarios. It is, for this
case, assumed that handling negative deviations on the balancing market (Bneg) can
be avoided. For the first summation, w is a demand scenario with a probability πw.
For the second summation, v is a plug in time scenario with a probability πv. The
cost of each scenario is then calculated, weighted based on its probability and summed
together to give the expected average cost of the problem.
The cost of using the adjustment and balancing markets are calculated by the fol-
lowing equations. First the energy constraint defined in the first section 7.3 is redefined
as follows:
Dw ≤T∑
t=1
ctdt − Edefv +Kvw (7.6)
Here∑T
t=1 ctdt is purchased day ahead energy. Edefv is a possible deficit of energy
caused by plug in scenario v. Kvw is extra energy that would have to be purchased
depending on the demand w and plug in scenario v. Finally, Dw is the energy demand
that must be satisfied for demand scenario w.
The energy deficit Edefv is simply calculated by summing energy for the periods in
which energy were purchased, but where the EV has not yet plugged in:
Edefv =
T∑
t=1,avt=0
ctdt (7.7)
Here avt is the availability for the given time period t and plug in scenario v. Next,
the definition of a energy surplus becomes:
Esurvw = (
T∑
t=1
ctdt − Edefv +Kvw)−Dw (7.8)
86

7.3 Thesis Work and Contributions
Esurvw , the purchased energy minus the demand, is then the energy that can be sold
on the adjustment market.
Using the above equations the market costs become:
Anegwv = pA,negKvw (7.9)
Aposwv = pA,posEsur
vw (7.10)
Bposv = pB,posEdef
v (7.11)
In equation 7.9, 7.10 and 7.11 the market prices (pA,neg,pA,pos,pB,pos) are multiplied
with the energy deviations found at the time of plug in.
These cost calculations assumes that the fleet operator will be able to use the
adjustment market at the 2nd decision stage to compensate for most of the energy
deviations caused by the realized scenario for plug in and energy demand. An exception
is the positive deviation Edefw caused by energy being purchased in hours prior to plug
in. These will have to be handled through the balancing market and thus carries a
higher cost.
The above model have been implemented and tested in GAMS. If there is a large
probability of a late arrival and high demand, the fleet operator will tend to purchase
more energy in the day-ahead market and at a later point during the night, to avoid
adjustment and balancing market costs.
7.3.4 Introducing Uncertainty - Grid Constraints
Grid constraints were discussed in chapter three “Grid integration” and it was argued
that certain strategies could be used to provide the fleet operator with knowledge on
available capacity in the planning phase. This section describes how grid constraints
may influence the cost of charging.
In the following, grid constraints is defined as a reduction of the available active
power during one or more time periods due to congestion.
If the fleet operator has knowledge on grid constraints at the time of day-ahead
energy bids and purchases , then deviation costs can be avoided. The cost of charging
87

7. OPTIMIZATION
may, however, still increase if the constraints means that the fleet operator is unable
to utilize certain, low-price, periods.
If the grid constraints are only revealed during the operational phase, then the
fleet operator will most likely attempt to predict the periods where such constraints
may occur. These predictions can, as was done for the plug in uncertainty, be used to
generate a set of scenarios. The objective function defined in the previous section 7.5
becomes:
Min
W∑
w=1
πw
V∑
v=1
πv
O∑
o=1
πo
T∑
t=1
ctdtpt +Anegwv −Apos
wv +Bposvo +Bneg
o (7.12)
In 7.12 the summation∑O
o=1 is added and the balancing market costs have been
altered.
o is a scenario for grid congestion with probability πo. It can be seen that grid
constraints may incur additional costs in the balancing market for both positive and
negative deviations (Bposvo and Bneg
o ).
The following equation defines the energy deviation created by grid congestion:
F defvo =
T∑
t=1,avt=1,cot=0
ctdt (7.13)
The above sums up the contracted energy in hours where the EV is plugged in
(available avt = 1) but can not charge due to a charging constraint (constraint cot = 0).
The balancing market costs can now be expressed as:
Bposv = pB,pos(Edef
v + F defv o) (7.14)
Bnegv = pB,neg ∗ F def
vo (7.15)
The above equations, 7.14 and 7.15 , assumes that deviations caused by charging
constraints can not be handled through the adjustment market but must be handled
using the balancing market. The positive deviation caused by not being able to charge
due to grid constraints are added to the positive deviation created by late plug ins in
7.14. It is assumed that the energy missing from the battery, due to grid constraints,
88
7.4 Sub-conclusions
would still be needed and that the balancing market is used for such unplanned charging
7.15.
The above model have been simplified in that the costs of charging constraints only
applies to energy bought in the day ahead market, not the energy bough and sold in
the adjustment market.
The above grid constraint scenarios have been implemented in GAMS. High balanc-
ing costs will generally keep the fleet operator from purchasing energy in hours where
there is a risk of grid congestion.
7.4 Sub-conclusions
The following sections concludes this chapter by presenting and discussing results and
by giving recommendations on future work.
7.4.1 Contributions and Results by the Thesis
This chapter have described the use of optimization methods to minimize charging costs
for a fleet operator. It have been shown that:
• A binary optimization method can be used to minimize charging costs for EV
charging.
• Markets and stages can be introduced as a means for deviation recourse.
• EV owner-related uncertainty in terms of time of plug in and energy demand can
be managed using stochastic optimization with recourse.
• Scenarios for grid constraints can be included in the model.
The following have been done to implement and test the methods:
• In the EDISON fleet operator software, the binary optimisation method was
implemented via Microsoft Solver Foundation (MSF).
• The stochastic version of the optimisation problem have been implemented and
tested in GAMS.
89

7. OPTIMIZATION
7.4.2 Discussion and Recommendations
The fleet operator will always have to manage charging based on individual and hard
constraints, and initial methods have therefore been formulated for a single vehicle.
There are, however, certain differences when considering an entire fleet. Energy devia-
tions can, for instance, be balanced out via running adjustments and rescheduling for
a larger group of EVs. Advanced portfolio management, and the real-time relationship
between individual and fleet level operations by a fleet operator, will be the subject of
further studies.
The stages presented here are rather course-grained and the fleet operator will most
likely include many more stages. Rescheduling and adjustments could be done every
15 minutes and/or at certain events. A scenario could be that if a specific vehicle have
not plugged in at 5 PM, the fleet operator would, according to its probability scenarios,
not expect the vehicle to plug in before 10 pm. Replanning could then be done at 5
PM rather than waiting until the plug in occurs as is done in the above model.
The model reflects that grid uncertainty would incur a higher cost than EV owner
uncertainty. This is because most EV owner-related uncertainty is resolved at the time
of plug in, while grid constraints may occur throughout the entire operational stage.
Also, all deviations caused by grid constrains may have to be settled via the balancing
market.
Future extensions to the proposed model could be the addition of more constraints,
e.g. battery, and uncertainties, e.g. price. Finally it may also be desirable to extend
the planning period to cover a longer period e.g. an entire week. This may better
incorporate variable patterns in EV owner behavior and market costs.
90

8
Conclusions
This chapter will summarize the results of each of the two parts of this thesis; Domain
interfaces and supporting informatics. Finally, it will be illustrated how the topics
investigated in the first part relate to the topics of the second part.
8.1 Domain Interfaces
The chapters, part of the domain interfaces investigation, have sought to uncover
the objectives and requirements of the three key stakeholders - market, distribution
grid, and Electric Vehicle (EV) owner. The chapters also demonstrate how such con-
siderations will impact the informatics solutions for intelligent EV integration. Results
for each stakeholder is covered in the following.
Market Integration
First, EV integration towards the existing spot market was investigated. Demonstra-
tion software was developed that showed that EVs could be charged in correspondence
with energy prices from the spot day-ahead market. Next, ancillary service markets
were investigated in a comparative study between ENTSO-E and American PJM mar-
91

8. CONCLUSIONS
kets. The outcome of this study was recommendations on EV Ancillary Service (A/S)
market integration and a set of proof-of-concept tests.
This study has shown that both the day-ahead energy markets and ancillary service
markets are possible targets for EV market integration.
It is recommended to pursue the market products (existing and new) that can best
match and reward the EV’s potential as a fast-response high power resource. Charging
in correspondence with dynamic energy prices may represent the low-hanging fruit and
the short-term aim of EV market integration. More advanced uses, including A/S
market participation, can both increase the complexity, but also the potential value.
Impacts on battery lifetime must be included in the equation for A/S provision.
Future research should focus on new markets and the best possible utilization of
EVs in the power system.
Grid Integration
The Thesis Author has sought to understand how grid congestion may influence the
operation of a fleet operator. A set of grid congestion mitigation strategies have been
suggested and evaluated in terms of complexity, risk and value. Operation maps with
functional stages have been employed as a tool to analyze the tasks and possible stake-
holder interactions that each strategy would entail.
The study has revealed the necessity of understanding and harmonizing the objec-
tives and operational tasks of stakeholders that would directly be impacted by con-
trolled EV charging. Early coordination of grid capacity sharing is found to benefit
both a fleet operator and the distribution system operator, and would better allow EV
participation in system-wide services.
It is recommend to consider whether the future distribution grid should be extended
to a degree where it can support charging schemes which would cluster charging in time.
This is a trade-off between the value of allowing EVs to target system-wide needs and
the value in reducing the need of local grid reinforcement.
Future research should continue to target grid congestion mitigation and the impact
congestion will have on the overall use of EVs in the power system.
92

8.1 Domain Interfaces
EV Owner
The Thesis Author has concentrated on plug in behavior and its impact on the flexibility
of controlled charging. First, a set of internal combustion engine vehicle data was used
to show how a prediction could be performed as input to an optimization method.
This approach was implemented and tested as part of the EDISON project. Next,
attention was given to a set of real EV driving data, and some early investigations of
plug in behavior, including the impact of seasonal changes and driver familiarization,
were conducted.
The study revealed a high degree of flexibility for the EVs and owners investigated;
The plug in periods were rather deterministic and stretched over long periods of time
compared to the energy demand they had to fulfil. The study has also hinted at some
of the external stimuli that this flexibility may be used towards. The results of the EV
owner plug in behavior investigation can be seen as an input to the optimization chapter
where historic data can be used to generate scenarios for stochastic programming.
The Thesis Author recommends using the analytic capabilities of a back end system
to predict and utilize the flexibility of an EV. This will strengthen the EV’s value as a
resource and can help reduce the required involvement of the EV owner as long as some
clear frame conditions for controlled charging are made. A benefit/risk trade-off must
be understood and accepted by the EV owner. The risk can be based on the empirical
distribution of plug outs and energy demand while the benefit depends on the target
of controlled charging.
Future research for the Thesis Author will include a more comprehensive investi-
gation on the Test-An-EV data. A better understanding of plug in behavior is key in
understanding the EV’s potential in the future power grid.
93

8. CONCLUSIONS
8.2 Supporting Informatics
The chapters part of the supporting informatics investigation are influenced by
what was found in the domain integration study. The findings are summarized in the
following:
Control Architecture
Based on studies of the virtual power plant concept, a centralized, commercial, EV
specific architecture was defined. Next, the functionalities that should be part of such a
platform were specified. Finally, the architecture and functionalities were implemented
in code and used in the demonstration of EV fleet management.
The architecture chosen is meant to reflect a viable and readily implementable
way of interfacing an EV fleet with the market. The architecture developed is largely
similar to a set of other large EV integration research projects investigated by the Thesis
Author. It is concluded that the suggested architecture is well suited to facilitate EV
integration.
It is recommended that original equipment manufacturers and fleet operators come
together in standardization to establish what systems and entities should be allowed to
influence charging. It can be recommended to focus on centralized control short-term
and then move towards a more decentralized scheme as research in this area matures.
Future research could focus on combinations of centralized and decentralized con-
trol and establish where controlling logic is best placed.
Communication
In this study IEC 61850 was investigated in regards to EV integration. It was sug-
gested to extend the IEC 61850 mapping with representational state transfer services
for increased simplicity and interoperability. For the data model a new set of logical
nodes was suggested to better accommodate EV and EV supply equipment hardware.
94

8.2 Supporting Informatics
These nodes have been sent to IEC for consideration. The IEC 61850 with REST
communication scheme have been implemented and tested as part of EDISON.
The study revealed that using the IEC 61850 standard is a valid option for monitor-
ing and controlling the charging of an EV. There are, however, a number of competing
standards which could challenge the use of IEC 61850.
The main recommendation is to use a standard that will not limit the use of the EV
in present or future scenarios. This means defining a broad and flexible information
model which will facilitate the necessary information and control. The standards also
have to meet certain requirements on security which can be ensured by using the right
protocols and following standardized security profiles.
Academia should follow standardization to ensure the continued support of future
smart grid concepts. It is also recommended to start the transition from the original
top-down SCADA approach to a service oriented architecture for EV integration.
Optimization
It was shown how optimization can be used as a tool to reduce the cost of charging.
First, a simple binary optimization method was proposed. Then the model was ex-
tended to include markets and the use of two-stage stochastic programming to include
uncertainty in regards to both EV owner plug in behavior and grid capacity.
The study showed how several constraints and considerations can be combined in
an optimization model and how uncertainty can be included in the form of scenarios
as part of stochastic programming. The model also illustrated that uncertainty in the
distribution grid and EV owner behavior can have an adverse effect on charging cost
minimization.
One of the main recommendations is to make optimization models that includes as
broad a set of stakeholder considerations as possible.
Future research by the author will extend the model with more constraints and
extend the use of stochastic programming. The continued examination of real EV data
can help shape and test future models.
95

8. CONCLUSIONS
8.3 Intelligent EV Integration - Closing Remarks
The following figure 8.1 illustrates the relationship between the chapter topics of this
thesis. More specifically it shows how findings and conclusions of initial chapters have
been picked up and reflected in later chapters.
Figure 8.1: Chapter topic relationships - Illustration of how information and choicesfrom the domain investigations map into the informatics chapters
The above figure, along with the findings described above, have shown how the two
objectives of this thesis have been fulfilled by conducting a thorough domain investiga-
tion and by identifying suitable informatics solutions.
It is hoped that the findings presented, both concerning stakeholders and solution
technologies, can be used to release the potential of EVs and promote and support the
intelligent integration of EVs into society.
96

9
Core publications
97

9. CORE PUBLICATIONS
A Coordination Strategies for Distribution Grid Conges-
tion Management in a Multi-Actor, Multi-Objective
Setting
This paper has been accepted for publication as part of the 3rd IEEE PES Innovative
Smart Grid Technologies, 2012, Berlin.
98

1
Coordination Strategies for Distribution GridCongestion Management in a Multi-Actor,
Multi-Objective SettingPeter Bach Andersen, Junjie Hu, Kai Heussen
Abstract—It is well understood that the electric vehicle asa distributed energy resource can provide valuable servicesto the power system. Such services, however, would have toco-exist with hard constraints imposed by EV user demandsand distribution grid operation constraints. This paper aimsto address the interactions between the stakeholders involved,mainly considering the distribution grid congestion problem, andconceptualize several approaches by which their diverse, poten-tially conflicting, objectives can be coordinated. A key aspect to beconsidered is the relationship between the operational planningand the handling of real-time events for reliable grid operation.This paper presents an analysis of key stakeholders in terms oftheir objectives and key operations. Three potential strategiesfor congestion management are presented and evaluated basedon their complexity of implementation, the value and benefitsthey can offer as well as possible drawbacks and risks.
Index Terms—Electric vehicle integration, Distribution grid,Congestion management, Smart charging
I. INTRODUCTION
Grid integration of electric vehicles, distributed generation,and other distributed resources has been a driver for a rangeof smart grid research activities. Here, the field of intelligentelectric vehicle (EV) integration is aimed at minimizing theadverse effects of introducing electric vehicles into the powersystem and maximizing the value for EV owners, the powersystem, and society as a whole.
A large part of intelligent EV integration research has beenaimed at such topics as optimal charging of electric vehiclesin term of charging cost [1]–[3], enabling renewable energy[4]–[6] as well as providing ancillary service to the powersystem [1], [7]–[9]. Such studies have primarily been aimedat system-wide power services and energy markets while notconsidering the distribution network. Concurrently, studieshave been carried out that look at charging management solelyfor the purpose of avoiding distribution level grid congestion[10]–[14].
Lately, research done in [15], [16] have been striving tocoordinate these objectives, i.e., to optimize the utilizationof electric vehicles while still respecting the hard constraintsimposed by consumers’ needs and distribution operation con-straints. In [15], a conceptual framework consisting of boththe technical grid operation and a market environment wasproposed to integrate EVs, the activities of all the actors
This work was supported in part by the iPower project.Peter, Junjie and Kai are with the Center for Electric Technology, Technical
University of Denmark, Denmark. Email: {pba,junhu,kh}@elektro.dtu.dk
including fleet operator (FO), distribution system operator(DSO) and consumers are described and the simulation resultsindicate that smart charging can maximize the EV penetrationwithout exceeding grid constraints. However, further researchon the coordination between FO and DSO and the interactionbetween FOs and consumers are not addressed clearly. Afurther development can be seen in [16], in which a complexscheduling problem involving consumer, fleet operatoor andDSO were analyzed. The results shows that both power andvoltage constraints due to electric vehicle charging can beavoided while the FO and consumer can achieve the objec-tive of minimizing charging costs and fulfilling the drivingrequirements. This approach requires a somewhat complexcoordination between DSO and FO but can potentially delivera very good solution in terms of optimal grid utilization andsafety.
This paper aims to add to the existing research by addressingthe interactions between the various actors and conceptualizeseveral approaches, by which their diverse, potentially con-flicting, objectives can be coordinated with respect to theoperational constraints of the low voltage distribution grid.A key aspect to be considered is the relationship between theoperational planning done by the actors and the handling ofreal time events which is vital for the DSO and the distributiongrid that it represents.
While this paper focuses specifically on the case of EVintegration, the coordination strategies presented, aiming atcongestion management in general, can to a large extendbe translated to a more generic demand side managementperspective.
The remainder of this paper is organized as follows: Sec-tions II presents three key stakeholders along with theirobjectives and operational tasks. In Section III a full mapof the operations identified is presented and Section IV thenexpends the map in the examination of three different coor-dination strategies. Finally, key contributions are summarizedand discussed in Section V.
II. ACTORS: OBJECTIVES AND OPERATIONAL TASKS
An overview of the actors, the grid and the main controloperations is presented in Figure 1. The figure conveys howthe actors’ operations are coupled through interactions via a)a common physical infrastructure, b) control relations andc) other information exchange. The coordination of theseoperations needs to reflect each actor’s objectives as well

2
Fig. 1. Actors (stakeholders), problem domain and main information andcontrol flows.
as operational constraints. In this problem formulation, wefocus on describing the following key stakeholders and theirobjectives.
• Distribution System Operator (DSO),• Fleet Operators (FO),• Customers (controllable loads / EVs).Other relevant influencers include the transmission system
operator (TSO), other market actors and conventional demand.Their influence is conveyed via control signals, market prices,and physical network utilization, respectively. They do nothave to be considered here explicitly as their role with respectto the distribution level is encapsulated via the DSO and FO.
In the following, these key actors are described in termsof objectives and the operations performed to satisfy theseobjectives.
A. Distribution System Operator
The main purpose of the distribution grid is to enablereliable power delivery to customers at a low-voltage level.Grid operation by the DSO is therefore aimed at effectivelybalancing two main objectives a) reliable grid operation and b)low cost of operation. We identify the following value driversfor a DSO:
1) Grid component investments,2) Capacity utilization factor,3) Component lifetime,4) Operation cost (incl. resistive losses),5) Instrumentation and automation efforts.Provisioning of distribution grid transfer capacity is planned
to be sufficient in all cases, that is, capacity is provided by thestandard of annual peaks, plus safety factors for anticipateddemand increases. In practice this means that distributiongrids tend to have a relatively low utilization factor. On theother hand, the distribution grid planners calculate with a high
‘diversity factor’: it could be safely expected that due to theindependent nature of most electricity consumption would leadto a smoothing effect that would reduce the absolute peak. Asa result, secondary transformers in the distribution grids canbe expected to be dimensioned at lower capacity than the totalcurrent capacity of all connected households.
The operating state of the distribution grid is limited by thefollowing operation constraints:
• Voltage limits (voltage quality),• Thermal limits of cables & transformers,• MVar bands (interface to TSO), or• Protection settings.
In this paper the focus is on the distribution grid’s ability totransfer active power.
1) Congestion management: The term ‘congestion’ in dis-tribution grids refers to a situation in which the demand foractive power transfer exceeds the transfer capability of thegrid. As the electricity grid cannot physically get congested,the term subsumes the complex mapping of the above men-tioned grid constraints to the network active power transfercapacity as seen for each connection point and the need fordeferring demand (or generation1). Whereas the constraintslisted above are specified in terms of limits for specificparameters (voltage, current, reactive power, active power),they all may influence the active power transfer capabilityavailable at a connection point. Their mapping is non-trivial,as it depends on properties of the physical infrastructure,characteristics of consumption devices and built-in controlbehaviours required by the respective grid code.
In general, the term ‘congestion mitigation’ can then beassociated with two types of strategies: a) to (locally) increasethe transfer capacity by means of reactive power and voltagecontrol and b) by coordinating the throughput via deferral orcurtailment of demand [17]. Both strategies aim at increasingthe utilization factor of the distribution grid.
Here, the term ‘congestion management’ explicitly refers tostrategies of type b), which aim at the coordination of activepower demand with respect to congested grid locations. Itcan be assumed that available strategies of type a) will beexhausted before type b) strategies are applied. Building onthe proposal in [17], the base case for congestion mitigationwill be considered active power curtailment.
2) Distribution System Operation Today: DSO tasks inconventional system operation, are mostly focused on ‘off-line’ tasks related to asset management and maintenance.Distribution systems today tend to be weakly monitored ascompared to transmission grids, and controlled in a decentral-ized fashion on the basis of preconfigured local controls (e.g.by means of grid codes and protection settings). Supervisorycontrol is then reduced time-of-day controlled adaptation ofcontrol settings, configuration management in response tooutages and maintenance related challenges.
Key Operations:• Grid dimensioning (incl. contigency planning and load
curve estimation),
1For the remainder of this paper, the perspective of distributed generationis implied.

3
• Maintenance and outage related topology reconfiguration,• Adjustment of transformer taps,• Fuses and relay operation,• Fault-analysis and repair.3) Operations in active distribution grids: To illustrate a
future operation scenario with a higher level of automation,it is considered how the above operations can be extendedwith additional online- and data intensive operations. In orderto identify and solve congestion problems, the DSO requiresadditional measurement equipment and/or technology enablingthe anticipation of load patterns and grid ‘bottlenecks’.
Key Operations for DSO congestion management in ‘ad-vanced’ distribution grids:
• Demand forecasting• Grid state estimation• Online grid measurements• Real-time intervention in case of unexpected deviations
challenging grid reliability• Meter data collection and aggregation
economically and reliably and shows a relation between VPPsand DSO. In this control system, several families are suppliedunder one feeder and they own controllable devices, i.e,electric vehicles, besides some conventional load, such as light,TV etc. For these controllable devices, they are divided intotwo groups according to the method controlled by the VPP,one group is directly controlled by the VPP, which meansan extra cards or relays are installed on the user’s device,and the VPP can turn on/off the devices; another group iscontrolled by price, in which the devices are assumed to beprice-responsive. VPP starts to make an energy schedule forits customers with the purpose of minimizing the electricitycost and meanwhile fulfilling their requirement. This problemcan be formulated as a linear programming or dynamicalprogramming way [1], [2]. The congestion problem mayfirst happened during the scheduling making, this problemshould be solved by the coordination between DSO and VPPs.After the charging schedule was set up, ideally, the users areexpected to totally follow the schedule. However, in general,deviation may happen. With the purpose of avoiding thepossible congestion (happened again in real time), DSO willmonitor the system’s operation conditions dynamically andcoordinate with VPPs. The following subsection will discussthe mechanism of solving these congestion problems.
B. Fleet Operators
The fleet operator (FO) is a commercial entity that aggre-gates a group of EVs in order to actively integrate them intothe power market, and in so doing, utilizing their chargingflexibility to meet a financial goal. The financial goal couldbe to achieve savings on the purchase of energy or makeearnings by selling ancillary service products or, possibly, acombination of the two.
A FO follows the concept of a ’virtual Power Plant’which was first introduced to allow market participation fordistributed energy resources.
In the current European power and energy markets, the FOcould be a retailer with either a load balance or production
balance responsibility, depending on the market/service thatthe FO would address.
The value drivers for a FO are:1) Maximize profits or minimize costs by participating in
markets.2) Providing services (cost reductions, convenience etc.) that
will attract EV owners as customers.Due to the participation in markets and customer services,
the FO is subject to operating constraints defined by contrac-tual commitments:
• Market schedule (energy/h)• Customer demand (driving needs)• TSO driven ancillary service requirements (e.g. reserve
capacity)How the economic value obtained through the market is
shared with the customers would be business case specificto the FO. It is also assumed that the FO would maintain aService Level Agreement (SLA) with its customers that woulddictate the degree to which it may control and manipulate theEV charging patterns to achieve goals other than customerdriving. This would represent a trade-off between energysavings and EV driving availability that should be understoodand accepted by the customer.
The operations of the fleet operator can be divided into fleetlevel operations and individual level operations as follows.Fleet level:
• Selection of market products and services• Contracting• Market/service forecasting
Individual level:• Customer SLA management• Driving pattern prediction
C. Customers
The customers, here EV owners and drivers, are not as-sumed to be particularly interested in grid issues. Their mainvalue drivers are expected to be:
1) Availability of EV for driving2) Total cost of ownership/energyIt is assumed here, that the customer will opt for conve-
nience and delegate most of the charging control to the FO.The customer is expected to rely on the frame conditionsexpressed in the SLA for the daily charging managementfor ’typical’ and predictable driving patterns. An optionalfeature would be to let the customer communicate his or hersexact driving intentions to the FO. This would strengthen theFO ability to utilize the specific EV’s flexibility. The mainoperations of the customer, besides transportation, would thenbe:
• Accept, and possibly modify, the SLA with the FO.• Inform the FO of any non-typical driving needs.
III. MAP OF OPERATIONS
The operations outlined above will in this section be mappedgraphically to enable an analysis of different coordinationstrategies.

4
Fig. 2. Map of base-case operations.
A. Analysis FrameworkIn this section a classification approach is introduced, based
on the understanding that the coordination approach is both anautomation problem and a market design problem.
A widely accepted hierarchical decomposition of processcontrol into four functional levels describes integrated indus-trial automation [18]:
• Level 4: plant(s) management• Level 3: production scheduling and control• Level 2: plant supervisory control• Level 1: direct process control
This level-hierarchy is associated with several characterizingparameters, including e.g. time scale, time resolution, planninghorizon, and hierarchical dependency of objectives. No singleone of these parameters can be considered directly decisivefor forming the levels, but together they generate the needfor distinguishing qualitatively different levels of automation.The hierarchical dependency of objectives, i.e. that one level ishigher and another is lower in ordering, is associated with themeans-ends structure of objectives: A higher-level objective isbroader in scope and more closely associated with the businessobjectives of the respective process, and thus ‘higher’ in thevalue chain; a lower-level objective, in contrast, is there tosupport and enable other process functions.
In the present multi-actor, multi-objective setting, the sin-gle hierarchy does not hold: different actors have differentobjectives, and yet they must interact with respect to the sameprocess. The present means-ends perspective shall be strippedfrom the automation hierarchy, to allow for a high-level mapof operations. Key elements to be captured in the new mapare:
• Key operations and their allocation to actors• The association of operations with a time scale including
a distinction of operational and administrative functions
• The possibility to map interaction sequences betweenoperations
Removing the means-ends perspective, we are left with amostly time-driven decomposition. We consider the followingfundamental stages:
I. Offline PlanningII. Online Scheduling
III. Real-time Operation (Execution)IV. Offline Settlement
These stages model a logical sequence: each stage is basedon a completion of the previous stage. The timing aspect is notessential here as certain types of operation can be performedfaster with improved technology. The stages are characterizedin the following:
Settlement is about the aftermath: recordings (measure-ments, sent commands, etc.) of executed operations are con-solidated and (financial) responsibility is allocated. The op-eration stage is about pure execution in real-time. Plans areonly executed, and unplanned events occur and physical aswell as automatic controls respond without deliberation. The’online’ scheduling stage can in time be closely coupled withoperation (e.g. reactive scheduling with a 5min resolution) orextend hours or days ahead of it. Scheduling is the stage inwhich available resources are best known and the platformfor execution is to be prepared. Finally, the first stage, herecalled ’planning’ has been distinguished from scheduling inthe same fashion as unit commitment is distinguished fromdispatch: Depending on the specific coordination strategy, wedistinguish operations that can be coordinated in a ad-hocfashion and those that provide the basis for such ad-hoc deci-sions. Due to these clear distinctions, the framework supportsthe discussion of interactions between key operation tasks forcross-stakeholder coordination for the complete process. Asthe operations can be associated with operation objectives of

5
the respective stakeholder, this map allows for an analysis ofthe incorporation of the respective value drivers by a givencoordination strategy. This ’horizontal’ level means that theoperations have to be considered at the same level of abstrac-tion. A ’vertical’ perspective would unfold more details of theoperations, eventually also revealing physical interactions [19].The goal is to analyze the benefits and trade-offs involved inspecific coordination strategies. Value is hereby understood ina generic sense as to contribution to a stakeholder’s objectives.Given the Operation-Stakeholder allocation and the analysisof value drivers, a similar framework can be employed to alsoanalyse value-network constellations, as exemplified in [20].However, that type of analysis is beyond the scope of thispaper.
B. Base Case Map
To establish a firm foundation for the analysis of differentmarket-based coordination strategies, we identify a base casewith a minimum set of operations that will be common toall considered congestion-coordination strategies (Figure 2).This base-case maps out the operations DSO, FO and EVowner would be required to execute in either of the coordinatedcongestion management schemes.
The base case uses the following assumptions:- As discussed in [15] and [19], the introduction of con-
trollable demand with significant power capacity such as thatof electric vehicles implies a significant risk for distributionassets. To avoid potentially harmful charging configurations,we include the concept of an ’emergency brake’ in all EVcharging post: it enables the unconditional interruption of EVcharging on request by the DSO. It could be implemented onthe basis of a ’keep-alive’ signal, the failure of which wouldimmediately interrupt the EV charging process
- The maps allocate all optimization and coordination intel-ligence to the FO. It is understood that many of the operationscould be implemented using distributed algorithms e.g. in theelectric car or charging post.
- Vehicle-to-Grid (V2G) is not considered in this publica-tion. The technology’s potential for congestion relief and itsimpact on power quality are, however, relevant for conges-tion management and should be further addressed in futurepublications.
IV. COORDINATION STRATEGIES FOR CONGESTIONMANAGEMENT
Approaches to the congestion problem are outlined and thenclassified and analysed using the map described in the previoussection. All three strategies represent very new approaches todistribution grid congestion management and none of themhave been investigated in very great detail.
The strategies investigated are:• Distribution grid capacity market• Advance capacity allocation• Dynamic grid tariffFor each approach a new map is drawn where operations
required specifically for the strategy in question are presented
Fig. 3. Distribution Grid Capacity Market.
in bold. Shared supporting operations beyond the main traceof operations have been omitted for compactness.
To describe how technically and administratively demandingit would be for a DSO or FO to implement and operate the newprocedures required by the coordination strategy the parametercomplexity is used. A second parameter value denotes the de-gree to which the strategy would help the stakeholder achieveits operational goal. Finally, the parameter risk describespotential problems associated with the respective strategy incontext of a currently uncertain external environment.
A. Distribution grid capacity market
As proposed in [21], this strategy would require a newmarket for trading distribution grid capacity. For this paper theterm ‘Distribution Grid Capacity Market’ is used; Also a newrole ’market operator’ is introduced which is responsible formarket operation. The FO will submit requests for their ’aggre-gated schedule’ consisting of their scheduled consumption foreach node (aggregated capacity), in response they will receivea price for each node, reflecting the respective congestion, andare requested to update their charging schedules. The processis iterated until all constraints are satisfies. The concept usedin this strategy can be found in a similar form for the powertransmission system [22].
1) Operation sequence:• First, the FO will make an aggregated energy schedule
for EV owners based on its objectives. Afterwards, thisaggregated schedule will be sent to the market operator.
• The Market operator will generate a price for the grid ca-pacity according to the schedules. This price is associatedwith the power difference between the sum of scheduledpower and upper power limits of the grid.
• FOs would inform the market operator of their newenergy schedule under the initial price. The schedule canbe calculated based on the marginal value of a utilityfunction, e.g., cost function in term of the power deviationor satisfaction degree with the ’preference difference’(the difference between energy schedule after congestionmanagement and energy schedule before congestion man-agement).
• The market operator then determines whether the distri-bution grid is overloaded or underutilized and comes upwith a new corresponding price. After a certain number

6
Fig. 4. Advance Capacity Allocation.
of iterations, the price will eventually converge andaccepted by all FOs, which establishes a binding chargingschedule.
2) Evaluation: Complexity:With this strategy, a new market is required which means
that the corresponding platform for trading grid capacity needsto be designed and implemented. Also, new communicationflows are needed to support the market operations. The marketitself will be rather complex to establish and operate.
A lot of complexity is transfered from DSO to the capacitymarket. Here the DSO will be required to provide the measuredand estimated power information to the market operator. TheFOs will take on the task of trading capacity and reschedulingthe energy consumptions for their customers etc..
Value: With this new market, FOs will have more flexibilityto trade and utilize the grid capacity of a distribution system.If the market and capacity information is reliable and well-designd it will ease the operation of the DSO, enable acomparatively high utilization factor and reliable schedules forFOs as well. A further benefit is that no actual consumptioninformation is revealed to other market parties, as only acommon congestion price is established per node.
Risk: It must be guaranteed that all FOs adhere to the rulesof the market. Another risk lies in the algorithms used toarrive at prices based on utility functions i.e. the computationalrequirements and time needed for a solution to converge.
B. Advance Capacity Allocation
The simple concept behind this strategy is that the DSOcould identify and pre-allocate available capacity by defininga conservative static capacity limit (kW) for each feeder-linebased on the capacity rating of the respective transformers andcables and the expected conventional load curves. The EV-equipped households attached to a certain feeder-line wouldthen be given a certain share of available capacity which wouldbe allocated to the FO representing them. To avoid inefficientutilization of available grid capacity due to unused capacityshares, a second step is added to the strategy where FOs cantrade their allocated capacity in an over-the-counter manner.
1) Operation sequence:
• The ’Contracting for capacity sharing’ operation wouldinvolve letting the DSO know the mapping between grid
connected EV-equipped customers and FOs and thendetermining how capacity is shared.
• During the scheduling stage, the DSO would via grid loadforecasting estimate the available capacity and communi-cate this to the FOs as defined in the contracts establishedin the planning stage. After having received its share, theFO could then optionally engage in capacity trading withother FOs operating on the same feeder.
• The DSO should be informed of the bilateral capacitytrading so that, in case of violations (i.e. total load ob-served from EV charging in specific part of grid exceedssum of allocated shares) penalties for violations can beappropriately placed at the responsible FO.
• Finally the strategy would involve settlement both be-tween DSO and the individual FO and possibly aninternal settlement between the FOs that engaged in thebilateral trade.
2) Evaluation: Complexity: Here, rather than dimension-ing the physical characteristics of the grid depending on loadprofiles and simultaneity factors, the DSO would limit thecontrollable load based on the physical characteristics of thegrid. In addition to the location-based grid capacity the DSOwould also need to map each grid customers endpoint to anassociated FO. There is also some complexity in how theFOs will trade capacity internally and how violations of gridcapacity will be dealt with in the settlement stage when tradinghas been involved.
Value: This strategy represents a rather simple coordinationmechanism between FOs and DSOs. The DSO is only requiredto communicate a single value (capacity) to each FO and isthen removed from the equation until the settlement stage. Thiswill simplify the responsibilities of the DSO considerably andleave the detailed capacity allocation to the entities directly incontrol of EV charging i.e. the FOs. There are also advantagesto the FO since it will see a guaranteed capacity, free fromstochasticity, early in the planning stage. Early information isvaluable to an FO attempting to optimize charging to meet avariety of goals such as market services and individual drivingneeds.
Risk: There is the risk that a single kW limit set-point pergrid node is too crude a mechanism to handle thermal loading- any unexpected change in base load during operation mayvoid the DSO’s estimation of capacity shares which has beenhanded out to the FOs during scheduling. The risk in thisapproach also lies in the effectiveness and reliability of theFO bilateral capacity trading. If the FOs can not be trustedto handle the management and trading of capacity amongthemselves, there will be the need of a more formal framework,e.g a market, and new definitions of responsibilities, such asthe balance responsible parties seen in the energy market.
C. Dynamic Grid Tariff
In this solution, the distribution system operator generatesa time and grid-location dependent price for grid usage basedon expected nodal consumption levels.
The DSO anticipates the size and the price-responsivenessof the load at critical grid nodes and calculates the price to

7
Fig. 5. Dynamic Grid Tariff.
optimally reflect the expected congestion problem. FOs willthen see a dynamic nodal tariff and can make an optimalschedule with respect to the e.g. spot price and dynamic gridtariff.
The method considered here has been presented in [23].1) Operation sequence: The key operation aspects for this
coordination strategy are outlined in Figure 5.• In the planning stage, a distribution system operator
would create models for the price-sensitivity of relevantdemand clusters. These models would be updated ona regular basis based on learning from smart meterfeedback.
• In the scheduling stage the forecasted demand, gridsituation and present spot market prices will be employedto calculate appropriate branch prices for distribution gridutilization.
• The dynamic tariff is published to subscribers. Theadapted branch prices are received by the fleet operatorand employed to compute an optimal charging plan.
• During the operation stage, the charging schedule is ex-ecuted. In case of severe underestimation or fluctuationsof the actual demand, DSO controlled interruptions mayoccur in real-time.
• For settlement the timed consumption data is collected bythe responsible DSO and the published prices will thenbe employed to bill the actual grid usage individually.
2) Evaluation: Complexity: The main characteristic fea-ture of this approach is the simplicity of the interactions andalso the simplicity of integrating simple prices in distributiongrids.
The implementation complexity is high on the side ofthe DSO. This scheme cannot be established safely withoutinterruptability of the vehicle charging.
For the Fleet Operator–Consumer interaction, the establish-ment of a satisfactory service quality may require a specialattention to potential bottlenecks in the system from the sideof the Fleet Operator.
Value: As compared to the base case, this model enablesan increase of the grid utilization factor. The small number ofparticipants at a feeder level means that random behaviour(fluctuation consumption level) might be stronger than theprice sensitivity of the controllable demand. Even though theincrease of the utilization factor is therefore highly uncertain,the simplicity of the approach could justify its implementation.
TABLE ISTRATEGY OVERVIEW
Actor Complexity Value RiskDistribution Grid Capacity Market
FO High High LowDSO High High Low
Advance Capacity AllocationFO Medium High LowDSO Low Medium Medium
Dynamic Grid TariffFO Low Low HighDSO Medium Medium High
For fleet operators and consumers, the benefits are alsoindirectly associated with the increased grid utilization. Afurther benefit can be seen in the flexibility this approach offerswith respect to integrating other flexible demand units, as theprice, in theory, could interpreted by any unit.
Risk: It is unclear whether a meaningful price-sensitivityof demand can be established.
There is a risk that there is no ‘right’ price to avoidoverloading, if a sufficient number of EVs is connected tothe same feeder, there is no way for them to negotiatecapacity utilization in the given framework. Due to the re-quired interruptability, the high chance for unplanned charginginterruptions also implies an additional risk is on the side ofthe Fleet Operator / EV Owner.
V. DISCUSSION AND CONCLUSION
This paper has investigated the concept of congestionmanagement for distribution grids, detailing the operationsand interactions of two main stakeholders in three differentcoordination strategies. The purpose of the analysis was tohighlight the cross-actor dependencies that each such strategyentails along the operation timeline, and thus to globally assesscomplexity, value and risk for each strategy.
Table I summarizes these evaluation parameters across thestrategies and stakeholders. In this table the customer isrepresented by the FO.
The ‘distribution grid capacity market’ is expected to offerhigh value and low risk for both FO and DSO assuming aformalized, optimal and secure framework supplied by a well-designed market. such a market, however, may represent themost complex strategy to implement, which may hinder ordelay its real-life implementation.
‘Advance grid capacity’ is relatively easy to implement,but would require over-the-counter trading to efficiently useavailable grid capacity. The strategy removes complexity fromthe DSO but some risk may have to be managed due to thebilateral FO trading and the advance capacity allocation mightrequire more conservative estimates of the available capacity.The FO gains high value from early information on capacityavailability.
‘Dynamic tariffs’ would also be easier to implement thana capacity market, but may prove challenging to the fleetoperator due to added uncertainty and a possible conflict withsystem-wide smart charging schemes. It could also imposesome extra risk for the DSO to rely on prices rather than hardcapacity limits when considering individual feeder lines.

8
A few general observations can be summarized as:• Grid considerations will have to co-exist with other
objectives in the charging management of EVs.• Coordination and information exchange in earlier stages
can reduce complexity and benefit both the FO and DSO.• There may be a trade-off between ease of strategy
implementation and optimality. A compromise may benecessary for the first real-life implementations.
• A suitable strategy for coordination between DSOs andFOs will improve each stakeholders ability to reach itsobjectives considerably.
The analysis framework developed in this paper can beconsidered sufficiently generic for analysing operations withrespect to other distributed resources.
An important mechanism included in this paper is the ‘real-time intervention’ functionality used by the DSO. This last-resort ability to directly and immediately reduce or disconnectcharging may be a prerequisite for the deployment of effectivecoordination strategies.
In the end, it is hoped that this paper contributes to a betterunderstanding of the multifaceted challenge of EV chargingand helps the development of open, robust, and meaningfulstrategies for low voltage grid congestion management.
VI. REFERENCES
[1] N. Rotering and M. Ilic, “Optimal charge control of plug-in hybridelectric vehicles in deregulated electricity markets,” IEEE Transactionson Power Sy, 2010.
[2] O. Sundstrom and C. Binding, “Optimization methods to plan thecharging of electric vehicle fleets,” in Proceedings of the InternationalConference on Control, Communication and Power Engineering, 2010,pp. 28–29.
[3] T. Kristoffersen, K. Capion, and P. Meibom, “Optimal charging ofelectric drive vehicles in a market environment,” Applied Energy, 2010.
[4] F. Tuffner and M. Kintner-Meyer, “Using electric vehicles to meetbalancing requirements associated with wind power,” Pacific NorthwestNational Laboratory (PNNL), Richland, WA (US), Tech. Rep., 2011.
[5] J. Pecas Lopes, P. Rocha Almeida, and F. Soares, “Using vehicle-to-gridto maximize the integration of intermittent renewable energy resourcesin islanded electric grids,” in Clean Electrical Power, 2009 InternationalConference on. IEEE, 2009, pp. 290–295.
[6] J. Lopes, F. Soares, P. Almeida, and M. da Silva, “Smart charging strate-gies for electric vehicles: Enhancing grid performance and maximizingthe use of variable renewable energy resources,” in EVS24-The 24thInternational Battery, Hybrid and Fuel Cell Electric Vehicle Symposium& Exhibition, Stavanger, Norway, 2009.
[7] W. Kempton and J. Tomic, “Vehicle-to-grid power implementation: Fromstabilizing the grid to supporting large-scale renewable energy,” Journalof Power Sources, vol. 144, no. 1, pp. 280–294, 2005.
[8] ——, “Vehicle-to-grid power fundamentals: Calculating capacity and netrevenue,” Journal of Power Sources, vol. 144, no. 1, pp. 268–279, 2005.
[9] S. Han, S. Han, and K. Sezaki, “Development of an optimal vehicle-to-grid aggregator for frequency regulation,” IEEE Transactions on SmartGrid, vol. 1, no. 1, pp. 65–72, 2010.
[10] G. Heydt, “The impact of electric vehicle deployment on load manage-ment straregies,” Power Apparatus and Systems, IEEE Transactions on,no. 5, pp. 1253–1259, 1983.
[11] ——, “The impact of electric vehicle deployment on load managementstraregies,” IEEE Transactions on Power Apparatus and Systems, no. 5,pp. 1253–1259, 2007.
[12] R. Green II, L. Wang, and M. Alam, “The impact of plug-in hybridelectric vehicles on distribution networks: A review and outlook,”Renewable and Sustainable Energy Reviews, vol. 15, no. 1, pp. 544–553, 2011.
[13] J. Lopes, F. Soares, and P. Almeida, “Identifying management pro-cedures to deal with connection of electric vehicles in the grid,” inPowerTech, 2009 IEEE Bucharest. IEEE, 2009, pp. 1–8.
[14] K. Clement-Nyns, E. Haesen, and J. Driesen, “The impact of chargingplug-in hybrid electric vehicles on a residential distribution grid,” PowerSystems, IEEE Transactions on, vol. 25, no. 1, pp. 371–380, 2010.
[15] J. Lopes, F. Soares, and P. Almeida, “Integration of electric vehicles inthe electric power system,” Proceedings of the IEEE, vol. 99, no. 1, pp.168–183, 2011.
[16] O. Sundstrom and C. Binding, “Flexible charging optimization forelectric vehicles considering distribution grid constraints,” Smart Grid,IEEE Transactions on, vol. 3, no. 1, pp. 26–37, 2012.
[17] T. Sansawatt, L. Ochoa, and G. Harrison, “Integrating distributed gen-eration using decentralised voltage regulation,” in Power and EnergySociety General Meeting, 2010 IEEE, july 2010, pp. 1 –6.
[18] D. Popovic and V. Bhatkar, Distributed computer control for industrialautomation. CRC, 1990.
[19] K. Heussen, “Control architecture modeling for future power systems,”Ph.D. dissertation, Technical University of Denmark, 2011.
[20] K. Kok, Z. Derzsi, J. Gordijn, M. Hommelberg, C. Warmer, R. Kam-phuis, and H. Akkermans, “Agent-based electricity balancing withdistributed energy resources: A multiperspective case study,” in Pro-ceedings of the 41st Annual Hawaii International Conference on SystemSciences, 2008.
[21] B. Biegel, P. Andersen, J. Stoustrup, and J. Bendtsen, “Congestionmanagement in a smart grid via shadow prices,” in Proceedings of the 8thIFAC Symposium on Power Plant and Power System Control, Toulouse,France, Sep. 2012.
[22] S. Stoft, Power system economics. IEEE press Piscataway, NJ, 2002.[23] N. O’ Connel, Q. Wu, J. stergaard, A. Nielsen, S. Cha, and Y. Ding,
“Electric vehicle (ev) charging management with dynamic distributionsystem tariff,” in proceeding of 2011 ISGT, 2011.
VII. BIOGRAPHIES
Peter Bach Andersen has a M.Sc. in Informaticsand is currently finalizing a PhD at the Departmentof Electrical Engineering within the Technical Uni-versity of Denmark (DTU). His research focus is onsmart grids in general but with a special emphasis onelectric vehicle integration. Peter is an IEEE studentmember.
Junjie Hu received the Master of Engineeringin Control Theory and Control Engineering fromTongJi University, ShangHai, China, in 2010. Cur-rently, he is a PhD student at the Department of Elec-trical Engineering within the Technical University ofDenmark (DTU).His research focuses on integratingcontrol policies on controllable load, mainly electricvehicle, for active power distribution system, ofwhich the control policies are direct control andindirect (price) control. Junjie is an IEEE studentmember.
Kai Heussen is assistant professor at the TechnicalUniversity of Denmark, where he also obtained hisPhD on Control Architecture Modeling for FuturePower Systems. He received his Dipl.Ing. in En-gineering Cybernetics in 2007 from University ofStuttgart. His current research focus is the design ofheterarchical and service-oriented control architec-tures for distributed control of power systems, withspecial attention to functional modeling and decisionsupport for automation design.

B A Comparison of Electric Vehicle Integration Projects
B A Comparison of Electric Vehicle Integration Projects
This paper has been accepted for publication as part of the 3rd IEEE PES Innovative
Smart Grid Technologies, 2012, Berlin.
107

1
Abstract -- It is widely agreed that an intelligent integration of electric vehicles can yield benefits for electric vehicle owner, power grid, and the society as a whole. Numerous electric vehicle utilization concepts have been investigated ranging from the simple e.g. delayed charging to the more advanced e.g. utilization of electric vehicles for ancillary services. To arrive at standardized solutions, it is helpful to analyze the market integration and utilization concepts, architectures and technologies used in a set of state-of-the art electric vehicle demonstration projects. The goal of this paper is to highlight different approaches to electric vehicle integration in three such projects and describe the underlying technical components which should be harmonized to support interoperability and a broad set of utilization concepts. The projects investigated are the American University of Delaware’s V2G research, the German e-mobility Berlin project and the Danish EDISON project.
Index Terms – Electric Vehicles, Distributed Energy Resources, Smart Grid, Standardization, Information and Communications Technology.
I. INTRODUCTION ommon to most electric vehicle (EV) power system integration projects are that they aim to prove that the EV,
when seen as a distributed energy recourse, can offer value and services that exceeds its primary function as a means of transportation. The value and services investigated can, for instance, be the minimization of charging costs, adherence to grid constraints or adjustment of charging behaviour to renewable energy production [1]-[3]. In practise, however, projects often differ in how the above is actually achieved.
A standardized approach to electric vehicle integration has many benefits including the support of roaming and a consistent support of advanced grid related services.
A good input for standardization is the research and demonstrations already done in the area of EV integration. For three such projects we use a set of parameters to categorize and compare the approaches and components used in each.
The parameters used in this paper are:
• Market integration and EV utilization concept • Architecture • Technology and standards
The work is supported by the project “Electric vehicles in a Distributed
and Integrated market using Sustainable energy and Open Networks', EDISON. (ForskEL Project Number 081216). Mr. Andersen and Mr. Garcia-Valle are with the Centre for Electric Technology, Department of Electrical Engineering, Technical University of Denmark, 2800 Kgs. Lyngby, Denmark (e-mail: [email protected]). Mr. Kempton is with the University of Delaware, College of Earth, Ocean, and Environment, USA.
By 'market integration' is meant the way that the EV, directly or indirectly, is connected to the power market to generate savings and possibly revenue for the EV owner. The number and composition of market stakeholders involved depends heavily on the business models and market environments under consideration. Market integration approaches could both be aimed at current energy and power markets or future, more dynamic, near real-time markets using price signals. The latter is researched in the ECOGRID.EU project [4].
Related to market integration is the 'utilization concept' in question. 'Utilization concept' covers which functionalities the EV will support and can roughly be categorized into the two following categories:
• Smart charging - Where the charging of an EV battery is delayed or advanced in time based on energy costs, grid constraints or renewable contents. Essentially the EV is used as a controllable load.
• Energy backup and power services - The Vehicle-to-Grid (V2G) concept, where power is delivered back to the grid from the EV battery, belongs in this category. V2G can increase the EV’s ability to provide regulating services.
The market integration and utilization concept chosen shapes the architecture of a project. By 'architecture' is meant the stakeholders and mechanisms used to influence the EV’s behaviour and interface it with the power system and market.
Three different 'generic' architectures are proposed by You Shi et. al. [5] for the concept of Virtual Power Plants, which also represents the architectural options in EV integration.
• Centralized control - In which a single entity (an aggregator) directly controls the behaviour of a group of electric vehicles.
• Partly centralized - In which a negotiation is taking place between the individual EV and the aggregator. The aggregator would thus only indirectly influence the behaviour of the EV.
• Fully distributed - In which the EV behaves as an autonomous and intelligent agent that could interface directly with the power grid and/or the market.
The fully distributed architecture is strongly related to the market integration concept of price signals while projects aimed at existing markets and grid dispatch systems tend to go for the more centralized architectures.
The final parameter used for the comparison is ‘technologies
A Comparison of Electric Vehicle Integration Projects
Peter Bach Andersen, Rodrigo Garcia-Valle, Willett Kempton
C

2
and standards’. The technology descriptions of the projects cover two topics. First, the components in both soft- and hardware which has been developed to support the computation and logic necessary for managing smart or bi-directional charging are mentioned. Secondly, the communication protocols used for transferring data between the entities are listed.
Related to technologies are the standards used by the projects. The standards can be subdivided into those dealing with communication and information models and those that deal with equipment and hardware.
The remainder of the paper is organised as follows. The following, 'EV integration projects' section will describe the EV integration approach used in three different EV integration projects by using the parameters defined above. Next, the 'Project comparisons and recommendations' section will highlight the similarities and difference between them and then explore the potential of standardization. Finally, the paper will summarize its findings and suggest future focus areas in the 'Conclusion' section.
II. EV INTEGRATION PROJECTS This section will introduce two European and one American
EV integration project. They have been chosen since they represent some of the biggest and most innovative research projects within the field. These are however far from the only ones and projects such as MERGE [6] (Mobile Energy in grids of electricity) could also have been included. Such projects represent mature investigations where a lot of experience have already been accumulated. The experience gathered is, apart for an input to standardization, also a good point of departure for a new generation of EV projects. Among the absolutely largest among the newest generation of projects are the European ‘Green eMotion’ project [7] with more than 40 partners and a 42 Mio. EUR budget. In the states the huge ‘The EV Project’ [8] represents the largest EV charging infrastructure project to date counting more than 60 participants and including thousands of EVs.
The three projects specifically chosen in this paper all share certain traits when it comes to the integration approach followed. They are all 'economic' integrations where money is earned through market participation. They also share a focus on existing markets and implement an either centralized or partly centralized architecture. Such similarities could be seen as a prerequisite for arriving at common solutions applicable for all such projects. There are, however, still many differences in the implementations which illustrates the challenges to standardization.
This paper focuses on four main entities which are present in all three project; The EV, the EV User, the Electric Vehicle Supply Equipment (EVSE) and the more generic Aggregator role, which would represent the 'interface' between a group of EVs and the power system or energy market.
As will be shown by the following, the projects differ in by which means the above entities should communicate, what information should flow between them and, in the end, which entity will control the behaviour of the EV.
A. The Edison project EDISON [9]-[10] is short for 'Electric vehicles in a
Distributed and Integrated market using Sustainable energy and Open Networks' and is a research project partly funded through the Danish Transmission System Operator (TSO) - Energinet.dk.
The goal is to develop optimal solutions for EV integration, including network issues, market solutions, and optimal interaction between different energy technologies. The technical platforms developed by EDISON should be globally applicable and is tested on the Danish island of Bornholm.
The EDISON consortium consists of the Danish utilities DONG Energy and Østkraft, the Danish Technical University (DTU), as well as IBM, Siemens, Eurisco and the Danish Energy Association. The three year project will conclude in 2012 but might be followed by an EDISON 2 project. The project webpage can be found at www.edison-net.dk.
Fig. 1. The architecture of EDISON
1) Market integration and EV utilization concept While several market integration concepts are within the research scope of EDISON, the initial focus is on the current Nordic NordPool market. Within NordPool the EVs can either be connected to the day-ahead energy market, be used for intraday regulation or for reserves. The first project phase puts its emphasis on the first and indirectly connect the EVs with the day-ahead spot market by controlling the charging in correspondence with hourly energy prices. This follows the smart charging utilization concept. 2) Architecture
The setup shown in figure 1 represents the implementation done in EDISON. The setup uses a centralized architecture where an aggregator, called the 'fleet operator' in EDISON, directly controls the charging patterns of the EV to facilitate smart charging. The conceptual role of a fleet operator could be maintained by any commercial party willing to adhere to the requirements of the Nordic power market. An EV in EDISON is seen as relatively simple with little local

3
intelligence. The argument is that most OEM EVs initially will lack the capabilities for local optimization. The EV needs only to implement an interface that would allow the fleet operator to extract status information, such as state-of-charge, and possible constrains set by the OEM. In Edison the charging spot would play the role of a 'proxy' in that it would extract EV information and manage smart charging on behalf of the fleet operator. The user will in EDISON communicate her or his charging preferences directly to the aggregator. 3) Technologies and standards
Between EV and EVSE, EDISON utilizes the IEC 61851 standard which describes the charging of EVs using different AC or DC power voltages over a conductor using on- or off-board equipment. Apart from specifications for equipment interoperability and safety, the standard also defines simple EV-EVSE communication via a control pilot wire using a pulse width modulated (PWM) signal with a variable voltage level. This allows the EV to communicate its state to the EVSE. IEC 61851 is used in EDISON since it helps satisfy safety requirements and will improve interoperability.
The IEC 62196-2 Type 2 Mennekes plugs are used on the conductor connecting EV and EVSE.
Apart from the control pilot wire, EDISON uses Power Line Carrier (PLC) communication to support the exchange of information. Although not part of IEC 61851, this technology is a valid candidate for future standardization.
An EDISON I/O board is installed at the EV and the EVSE and includes a PLC adapter.
To connect the EVSE with the aggregator, the IEC 61850 standard is used. IEC 61850 was originally aimed at substation automation, but has been expanded to cover the monitoring and control of distributed energy resources. The standard includes a reusable data model which can be used to monitor and control both the EVSE and the EV.
The EVSE implements an IEC 61850 compliant server which uses HTTP/HTTPS based RESTful web services, instead of the MMS protocol traditionally associated with IEC 61850. The REST interface is combined with the SIP application level protocol to better facilitate scalability. The use of Transport Level Security (TLS) is used to provide data confidentiality.
After the aggregator has extracted information through the REST interface of the IEC server it uses a software platform called the EVPP (EDISON Virtual Power Plant) that, through prediction and optimization, will compute a suitable charging strategy. The strategy is described using an IEC 61850-7-420 Energy and/or Ancillary Services Schedule (DSCH) which is sent to the EVSE IEC server. The schedule consists of a set of power set points and timestamps which will be followed by the EVSE during the charging of the EV.
An iPhone App and a webpage have been developed for the user to define charging requirements.
B. Vehicle to Grid technology, University of Delaware Vehicle-to-Grid (V2G) technology [11]-[12] is researched
and developed at the at the University of Delaware (UD). The
research focuses on the potential that V2G technology has for improving the utilization of the EVs as active resources in the grid and market. The research done by UD V2G spans a broad set of disciplines such as soft- and hardware development, grid impact and driving pattern analysis and aggregated fleet optimization. In addition to the technical aspects, UD V2G also covers policies, standards, legislation and user adoption. For testing and demonstrating, UD V2G uses a fleet of V2G enabled vehicles.
UD V2G is both a project and a research program and will continuously work within research, development and commercialization of V2G. Recently the group has stating replacing the term 'V2G' with 'Grid Integrated Vehicle' to emphasize the importance of grid integration.
AC Propulsion, a manufacturer of battery and propulsion systems, is an active partner in the project. The research is supported by the US Department Of Energy (DOE) as well as several American utility companies.
More information is available at www.udel.edu/V2G.
Fig. 2. The architecture of UD V2G
1) Market integration and EV utilization concept The UD V2G market integration concept has been tested by
participating in the regulation services market where the vehicle responds to regulation power requests sent from an Transmission System Operator (TSO). The Bi-directional charging utilization concept will allow the EVs to react to TSO requests for both up and down regulation and the EV User will be economically compensated for such services [13]. Regulating services has been implemented by UD V2G since it represents one of the most profitable markets to participate in. UD V2G publications have noted that their control mechanisms are also designed for other TSO markets such as spinning reserves, and for distribution system services such as peak load reduction, valley filling, reactive power, and transformer upgrade deferral, but UD V2G cars are not actually participating in these markets yet. 2) Architecture
The UD V2G architecture depicted in Fig. 2 can be classified as partly distributed since the EV implements an intelligent agent that will use a negotiation-like communication towards the aggregator. The EV will control the charging

4
process and be responsible for predicting and satisfying the energy requirements of the EV user.
Adding local intelligence and control in the EV can supply a better separation of concerns where a 3rd party, like the aggregator, would not have full control over charging and free access to utilization data. This secures the EV against external mismanagement (e.g. driver’s need for driving range has priority) and simplifies the optimization in the aggregator.
The purpose of the EVSE in the UD V2G architecture, aside from facilitating the power supply and internet connection, is to supply information on possible grid-related charging constraints. The user can through a web interface formulate her or his driving requirements. The collected trip information is then feed to the vehicle. 3) Technologies and standards
In the UD V2G project setup, an electric vehicle contains a Vehicle Smart Link (VSL) implemented on a automotive-grade Linux computer. The VSL will communicate with the Vehicle Management System (VMS) and Battery Managements System (BMS) of the EV to get battery information and to control charging. The Society of Automotive Engineers (SAE) J1772 standard is used for the equipment connecting EV and EVSE. J1772 defines the electrical and physical characteristics of conductive charging for EVs including requirements to inlets and connectors. Either in-band communication over the pilot line, or Power Line Carrier (PLC) communication is used for sending data via the charging cord.
Knowledge of grid and EVSE constraints will be captured by an XML file residing in the EVSE and will be sent to the VSL upon plug-in. This and direct wired communications ensure that the vehicle knows its electric power system node location, and the constraints, billing, and allowed services at that point. The EVSE is a repository of information (in the XML file) rather than a computing agent with active control over V2G.
The VSL will communicate the battery status and trip predictions to the aggregator to signal the capacity of each EV. The aggregator uses the UD V2G 'Coalition server' software to calculate the capacity of the EV (including grid constraints, battery state of charge, and scheduled or anticipated driver needs) and dispatch the TSO regulation requests accordingly. The result is a stream of 'power requests' from the aggregator to the vehicle that states the number of watts with which the EV should charge or discharge.
Both the VSL and the aggregator use software agents based on the Java Agent Development Framework (JADE). The agents communicate via the Agent Communication Language (ACL) as defined by Foundation for Intelligent Physical Agents (FIPA). The concepts of coalition formation and multiagent systems are applicable to the project in the sense that multiple entities (EVs) will group and cooperate to achieve some common goal, in this case revenue through TSO services. The UD V2G architecture, however, differs from the
above concepts in that a coordinating entity, namely the aggregator, will be present.
C. E-Mobility Berlin pilot project The German E-Mobility Berlin [14] project was initiated by
Daimler AG (Mercedes-Benz) and the utility RWE. Among the participants are also battery, EVSE and other automobile OEMs. The project introduces a fleet of 100 EVs supplied by Daimler and 500 EVSE’s which are delivered and powered by RWE in the streets of Berlin for a large field test. The project is aimed at developing and testing standardized solutions for electric vehicles.
Daimler is heavily involved in EV standardization in Europe and supports the vision of roaming. The project was launched in 2008 and will continually expand the field tests with new vehicles and technologies. More information is available at www.rwemobility.com.
Fig. 3. The architecture of e-mobility Berlin
1) Market integration and EV utilization concept The aggregator in the e-mobility project is initially seen as
the utility company e.g. RWE, who could sell energy to EV users and reward them for flexibility. By letting the user specify an 'end of charge' time the utilization concept of smart charging is supported. E-mobility does not directly address bi-directional charging and the use of the EV for ancillary services. The protocols and use cases of the project, however, is designed to be open for additional unspecified utilization concepts. 2) Architecture
The e-mobility project puts a lot of emphasis on the EV-EVSE interaction in its architecture. As illustrated in Fig. 3 the EV acts as a client towards a server implemented at the EVSE. The tariffs and charging options of the utility company will be represented by the EVSE which will serve as a proxy. Despite the presence of an aggregating entity, the setup is only partly centralized since the EV will implement a lot of decision logic by knowing the needs and requirements of the end-user and use them in a negotiation-like communication with the EVSE. 3) Technologies and standards
Each car is equipped with a Smart Charge communication unit which can communicate with the EVSE by using the e-mobility Smart Charge Protocol (SCP) over PLC. The SCP

5
defines a series of application level messages which are sent back and forth in the following sequence. After a plug-in has been detected, 'identification' messages will be used to configure the connection session and to establish identification, billing and contract details (for roaming). The EV will then request a list of EVSE provided services in a 'service discovery' message. Services include the charging and payment options available at the specific EVSE. The EV will then send its energy demand and intended charging behaviour in a 'power discovery' message. The EVSE will compare the charging behaviour with knowledge on local grid and equipment capabilities and send back price listings. When charging and billing has been settled, a series of messages initiates the power connection and monitors the charging process. SPC messages are encoded according to the Smart Message Language (SML) which is a mark-up language similar to XML that has been used for smart meter communication. Transport Layer Security (TLS) is used to supply data confidentiality through encryption. The DoIP protocol is used for EV diagnostics.
The e-mobility project has contributed significantly to the standardization of the IEC IEC 62196-2 Type 2 compatible Mennekes plug. The EVSE equipment supports conductive charging in accordance to IEC 61851.
III. PROJECT COMPARISONS AND RECOMMENDATIONS The investigation of the three EV integration projects has
revealed a series of differences and similarities which can be used to identify the areas that should be addressed by standardization. Fig. 4 compares the three projects based on the parameters described in the previous sections.
Fig. 4. Project comparison overview
A. Comparison - Market integration and EV utilization concept
Markets integration concepts for EVs will most likely vary based on local market conditions and are, for the centralized architectures, tightly linked to the business cases chosen by the aggregator. Smart charging, as covered by EDISON and e-mobility, can be seen as a first approach to market integration by allowing the EV to respond to variable energy prices on the energy market. The V2G equipment tested by UD V2G can be seen as the second step where the EV increases its potential as
a resource to the grid and more market integration concepts becomes possible. New integration concepts might occur over the coming years as markets will adjust to better handle distributed energy resources as part of the smart grid concept. By letting standards support as many utilization concepts as possible, it is ensured that a broad set of integration concepts will be possible in both present and future markets.
B. Comparison - Architecture The differences in the architectures of the three projects are
an indication of a fundamental question in EV integration: Which entity is responsible for influencing or controlling the EVs utilization behaviour? Is it the aggregator, the EVSE or the EV itself? Both e-mobility and UD V2G uses an EV-centric approach where an embedded computer in the vehicle will take certain decisions. Both the centralized and distributed architecture comes with a set of advantages. Theoretically, however, whether the controlling logic is placed at the aggregator or in the individual EV should not matter as long as optimization objectives are the same and EV User SLA's are strictly followed. One solution could be to have the infrastructure support a set of standardized architectures so that, for instance, both 'self managing' and 'non self managing' EVs can charge using the same equipment.
C. Comparison - Technologies and standards As can be seen on figure 4, EDISON is the only project to
use a standardised communication approach between EV and aggregator, namely IEC 61850. There are advantages to using an approach as well-described and widely applied as IEC 61850 and initial tests by EDISON indicates that the standard either supports, or can be extended to support, the utilization concepts described in this paper. A possible drawback of IEC 61850 is that it offers a structural decomposition of equipment as it is typically seen in SCADA applications. Technical de-composition means that the data model of IEC 61850 is designed to precisely represent physical components (inverters, chargers, relays etc.) and their operational status values. This can be argued to only make sense in a fully centralized architecture where direct and detailed access to equipment is appropriate. New standards will appear that ultimately might replace IEC 61850. Both e-mobility and EDISON have partners involved in the standardization around 'ISO/IEC 15118 – Vehicle to grid communication interface' which could have a major influence on future EV communication. On the SAE side J2836, J2847 and J2931 are addressing similar issues. Standards that describe the equipment used for conductive charging are used in all three projects. The IEC 61851 and IEC 62196-2 standards used in the European projects are similar to SAE standards used in the American UD V2G project. Adoption of these standards bodes well for roaming support. Especially Daimler in the e-mobility project is deeply involved in both IEC, ISO and SAE standardization work.

6
These efforts could help bridge the gap between European and American EV standards. The projects all use the internet and the associated IP stack in the communication solution as well as PLC on the physical level. The UD V2G group claims that wired communication is required to precisely identify the EVs location on the grid. Wireless communication, however, might become standard in EVs as new features and services become popular and it is claimed that 4G will have a major role in smart grids in general. If the localisation issues mentioned by UD V2G can be overcome, Wireless technologies should be considered a potential candidate for future EV communication standardization. While the projects are aligned on the lower parts of the OSI stack, they are very divided on the application level protocols. The solutions span from the structural decomposition used by IEC 61850 to the use of agent software. Application level protocols for EV communication must be aligned, or at least compatible, to support roaming above the equipment level.
All projects use the transport level security (TLS) cryptographic protocol as part of the communication stack. This is a well tested protocol used, for instance, in internet banking. This protocol alone, however, does not address all cyber security issues that the ICT architecture will face. It is recommended to align EV communication security with smart grid related security standardization work of IEC TC57 WG 15 (e.g. IEC 62351) and NIST (e.g. 'Smart Grid Cyber Security guidelines')[15].
IV. CONCLUSION The following are the key findings and recommendations by
this paper based on the project comparison:
• Market integration - Present and future market integration concepts will improve the utilization of EVs as active resources in the power market and system. Market integration concepts could take many forms and should ultimately be left to the businesses driving the aggregators. Equipment and communication standards should support as many utilization concepts as possible, so that the EV may be used in as broad a range of market integration concepts.
• Architecture - The placement of control logic and responsibilities between EV, EVSE and aggregator, differs between the integration projects investigated. One key question is how much intelligence will implemented at the EV. If a common architecture is not found, then standardization efforts must respect and manage the resulting diversity.
• Communication standards - A new class of standards covering EV communication, such as ISO/IEC 15118, are emerging. These standards should ideally support a broad set of utilization concepts. If, however, vehicles and EVSEs will be built to support very different architectures, one common solution is less feasible.
• Equipment standards - The Projects in question aligns nicely with the European and American standardization work - This trend brings great promise for roaming on the equipment level.
• Communication protocols - While the use of the internet protocol stack on top of PLC is used in all projects, application layer protocols differs significantly. These protocols should be aligned, or at least be compatible. Wireless communication for EVs is not used in any of the projects but could be considered a valid candidate for future work.
• Security - Transport level security, as used by all three projects, does not address all security concerns, but is a well-tested internet protocol suitable for handling confidentiality. Standardization aimed at smart grid security in general is also applicable for EV integration. Existing standards and guidelines by IEC and NIST should be considered.
If the above recommendations are considered, it will help promote a standardized platform for EV interoperability and grid integration. Such a platform can help realise two different potentials. The first is roaming that can help better servicing of driving requirements of EV owners and improve the utilization of infrastructure. Another potential is that most home charging equipment and EVs, across a series of different OEMs, will support smart grid integration and smart charging. Realising both of the above potentials will substantially aid and promote the cause of electric transportation.
V. REFERENCES [1] O. Sundström and C. Binding, “Optimization methods to plan the
charging of electric vehicle fleets,” in Proc. 2010 ACEEE International Conference on Control, Communication and Power Engineering, pp. 323-328.
[2] K. Clement, E. Haesen, and J. Driesen, "Coordinated charging of multiple plug-in hybrid electric vehicles in residential distribution grids," in Proc. Power Systems Conference and Exposition 2009, pp. 1–7.
[3] 29.F. Tuffner and M. Kintner-Meyer, “Using electric vehicles to meet balancing requirements associated with wind power,” Pacific Northwest National Laboratory (PNNL), Richland, WA (US), Tech. Rep., 2011.
[4] J. M. Jørgensen, S.H. Sørensen, K. Behnke, P. B. Eriksen, "EcoGrid EU- A prototype for European Smart Grids," Energinet.dk, 2011, Available: http://www.eu-ecogrid.net/index.php/documents-and-downloads
[5] S. You, C. Træhold, and B. Poulsen, "A market-based virtual power plant," in Proc. 2009 IEEE International Conference on Clean Electrical Power (ICCEP).
[6] N. Hatziargyriou et al. "Mobile Energy Resources in Grids of Electricity: the EU MERGE Project" in Proc. 2010 2nd European Conference on Smart Grids and E-Mobility, pp. 14-21.
[7] Green eMotion, Project web page: www.greenemotion-project.eu [8] The EV Project, Project web page: www.theevproject.com/ [9] C. Binding, D. Gantenbein, B. Jansen, O. Sundstroem, P. B. Andersen,
F. Marra, B. Poulsen, C. Traeholt "Electric Vehicle Fleet Integration in the Danish EDISON Project – A Virtual Power Plant on the Island of Bornholm". in Proc. 2010 IEEE Power & Energy Society General Meeting. Also available as IBM RZ 3761.
[10] J. Østergaard, A. Foosnæs, Z. Xu, T. A. Mondorf, C. A.Andersen, S. Holthusen, T. Holm, M. F. Bendtsen, K. Behnke,

7
"Electric Vehicles in Power Systems with 50% Wind Power Penetration : The Danish Case and the EDISON programme" Presented at the European Conference Electricity & Mobility. Würzburg, Germany, 2009
[11] W. Kempton and J. Tomic,, "Vehicle-to-grid power implementation: From stabilizing the grid to supporting large-scale renewable energy," Journal of Power Sources, vol. 144, no. 1, pp. 280–294, June 2005.
[12] S. Kamboj, N. Pearre, W. Kempton, K. Decker, K. Trnka, C. Kern "Exploring the formation of Electric Vehicle Coalitions for Vehicle-To-Grid Power Regulation" in Proc. 2010 AAMAS workshop on Agent Technologies for Energy Systems.
[13] W. Kempton and J. Tomic, "Vehicle-to-grid power fundamentals: Calculating capacity and net revenue" Journal of Power Sources, vol. 144, no. 1, pp. 268–279, June 2005.
[14] E-Mobility Berlin project, RWE project description: https://www.rwe-mobility.com/web/cms/de/1158022/emobility/
[15] NIST Smart Grid Cyber security guidelines, http://csrc.nist.gov/publications/PubsNISTIRs.html#NIST-IR-7628
VI. BIOGRAPHIES Peter Bach Andersen has a M.Sc. in Informatics and is currently finalizing a PhD at the Department of Electrical Engineering within the Technical University of Denmark (DTU). His research focus is on smart grids in general but with a special emphasis on electric vehicle integration. Peter is an IEEE student member.
Rodrigo Garcia received the electrical engineering degree and the MSc.degree in Electric Power Systems in Mexico, in 2001 and 2003 respectively. He obtained his Ph.D. degree from the University of Glasgow, U.K., in 2007. He holds the position as Assistant Professor at the Department of Electrical Engineering within the Technical University of Denmark (DTU). Among his research interests are dynamics, stability and control of electric power systems; renewable energy integration; modelling
and simulation of FACTS and custom power controllers; Synchrophasor Measurements; and Wide Area Monitoring, Protection and Control. He is the Secretary/Treasurer for the IEEE-PES Denmark Chapter. He is an IEEE, IET and CIGRE member.
Willett Kempton is Associate Professor in the Collage of Marine Studies, and Senior Research Scientist at the Center for Energy and Environmental Policy, both at the University od Delaware. He is conducting research and developing projects on both offshore wind power and V2G.

C Smartly Charging the Electric Vehicle Fleet
C Smartly Charging the Electric Vehicle Fleet
This chapter is part of the book “Smart Grid Applications, Communications, and
Security”, Lars T. Berger, Krzysztof Iniewski, Wiley, ISBN: 978-1- 1180-0439-5, pages:
381-408, 2012.
115


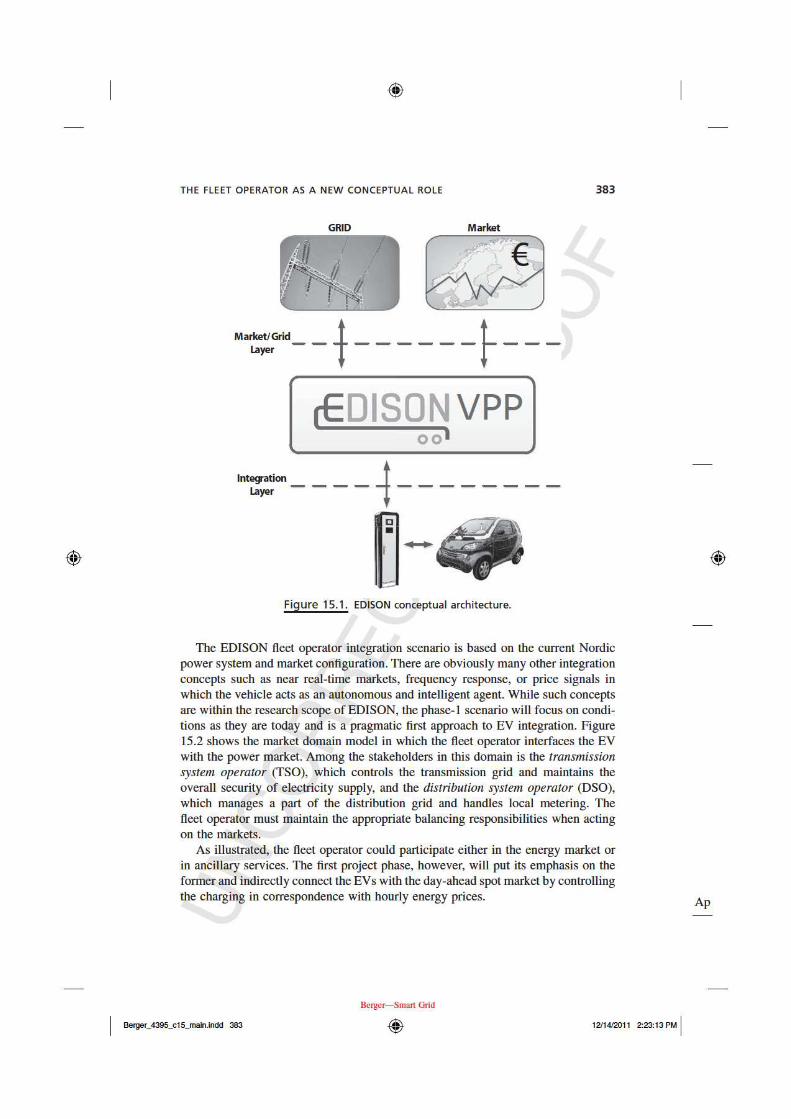


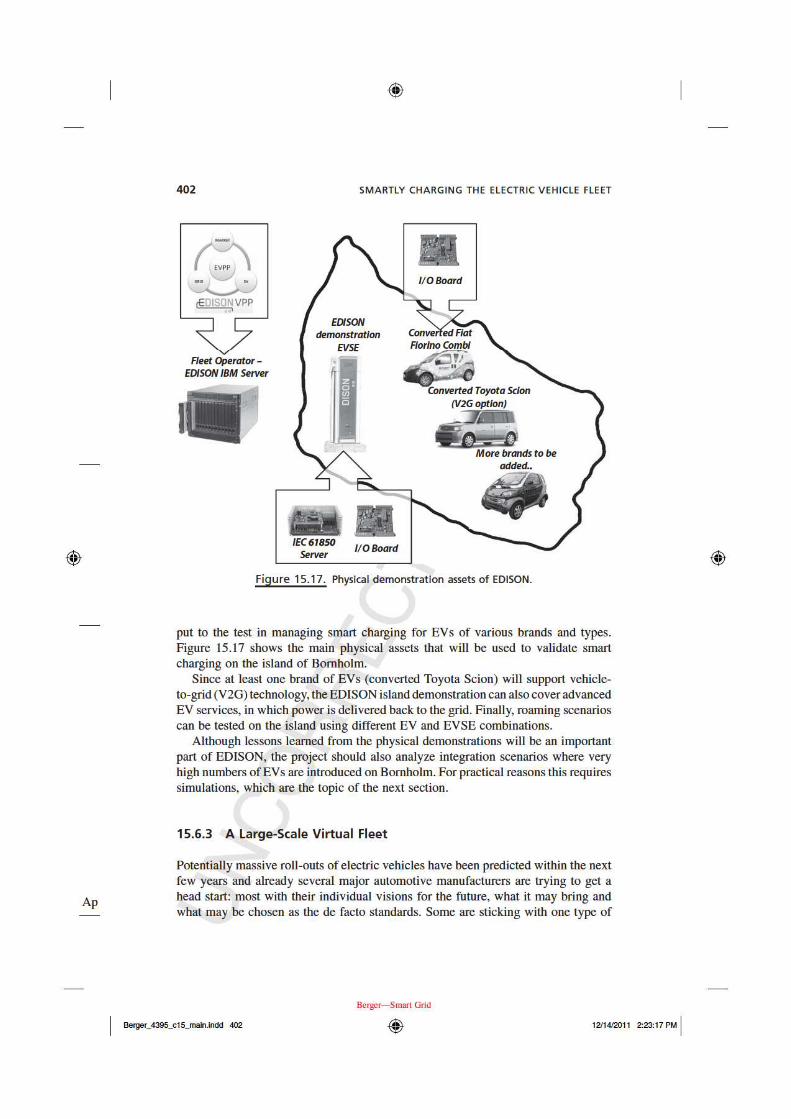


9. CORE PUBLICATIONS
D Implementation of an Electric Vehicle Test Bed Con-
trolled by a Virtual Power Plant for Contributing to
Regulating Power Reserves
This paper was published in the Proceedings of the IEEE Power and Energy Society
General Meeting, 2012, San Diego, CA, USA.
144
1
Abstract-- With the increased focus on Electric Vehicles (EV)
research and the potential benefits they bring for smart grid applications, there is a growing need for an evaluation platform connected to the electricity grid. This paper addresses the design of an EV test bed, which using real EV components and communication interfaces, is able to respond in real-time to smart grid control signals. The EV test bed is equipped with a Lithium-ion battery pack, a Battery Management System (BMS), a charger and a Vehicle-to-Grid (V2G) unit for feeding power back to the grid. The designed solution serves as a multifunctional grid-interactive EV, which a Virtual Power Plant (VPP) or a generic EV coordinator could use for testing different control strategies, such as EV contribution to regulating power reserves. The EV coordination is realized using the IEC 61850 modeling standard in the communication. Regulating power requests from the Danish TSO are used as a proof-of-concept, to demonstrate the EV test bed power response. Test results have proven the capability to respond to frequent power control requests and they reveal the potential EV ability for contributing to regulating power reserves.
Index Terms— Electric vehicles, Test Bed, Regulating power, Virtual Power Plant
I. INTRODUCTION HE Electric Vehicles and Plug-in Hybrid EV (PHEV) are expected to play an important role in the future power
system. Within smart grids research, electrical transportation has a complementary role in the overall system management of energy and power [1]; moreover the European target on reducing CO2 emissions and increasing penetration of renewable energy are among the major drivers for the research [2].
The energy storage capability is the key factor for smart grid applications of EV in power system. When parked and plugged into the grid, EV are expected to either charge intelligently, or discharge feeding power back to the grid [3]. In the latter case, EV would enter a mode known as Vehicle-to-Grid (V2G), permitting the provision of several grid
This work was in part funded through the EDISON project, a research
project of the public Danish transmission system operator Energinet.dk’s research program FORSKEL, (Project Number 081216).
F. Marra, D. Sacchetti, A. B. Pedersen, P. B. Andersen, C. Træholt, and E. Larsen are with the Centre for Electric Technology, Department of Electrical Engineering, Technical University of Denmark, 2800 Kgs. Lyngby, Denmark (e-mail: [email protected]).
services [4]. In general, if the individual EV can be intelligently managed, a large number of such vehicles can become an asset in the future power system. The charging process could be controlled by modulating the charging power, as well as the discharging process, by enabling the V2G mode when there is a need from the grid [5]. Many projects are addressing the aforementioned EV operation, as coordinated charging using different simulation tools. In [6], the authors analyze, through dynamic simulations, the potential daily profits for EV users, with the provision of regulating power. In [7], the authors studied the benefits offered by EV for facilitating the integration of large scale wind power in Denmark; EV fleets are modeled in a simulation platform as storage units when charging or as small generators during V2G operation. Galus et al. in [8] presented a method for tracking secondary frequency control using groups of PHEV and a simulation platform to simulate an EV aggregator.
The participation of EV in regulating power schemes is possible using an aggregation entity for EV coordination. This is done in the Danish EDISON project [9]-[10], where the contributors proposed a centralized coordination solution for an efficient integration of EV in the power system. The aggregation technology is based on the Virtual Power Plant (VPP) concept [11], where the Edison VPP is the EV coordinator.
Evaluating the contribution of an EV for regulating power reserves in a VPP framework, where a huge amount of communication and hardware interfaces are involved, gives raise to the need of new grid-interactive evaluation platform.
This paper describes the implementation phases of an EV test bed, working under the coordination of a VPP and contributing in regulating power reserves, as secondary frequency control [12]. A real regulating power request from the Danish Transmission System Operator (TSO) is processed by the VPP and sent in form of a charging/discharging power schedule to the EV test bed.
Test results performed using the EV test bed show that an EV is in fact capable of real-time communication with a VPP and can quickly react to contribute to grid power reserves.
II. ELECTRIC VEHICLES FOR SMART GRIDS
The interaction between EV and the electric power system is only possible if the vehicles can connect to the electrical
Implementation of an Electric Vehicle Test Bed Controlled by a Virtual Power Plant for
Contributing to Regulating Power Reserves F. Marra, Student Member, IEEE, D. Sacchetti, A. B. Pedersen, P. B. Andersen, C. Træholt,
and E. Larsen
T

2
grid for charging. An effective interaction between EV and grid requires the
combinations of different factors such as:
- Grid interactive vehicle architectures; - Controllable charging/discharging operation;
A. Electric vehicle architectures Among different types of hybrid electric vehicles and pure
electric vehicles, a general distinction is based on their ability to plug-in. In this work, non plug-in hybrid vehicles will be disregarded, as an interconnection with the grid is not possible.
This section lists the system architectures capable of charging using the grid [13]. There are mainly two classes of plug-in EV: plug-in hybrid EV (PHEV) and battery-powered EV. An overview on the different architectures is depicted in Fig. 1.
Fig. 1. Plug-in Electric Vehicles system architectures. (a) Series-parallel hybrid EV. (b) Series hybrid EV. (c) Parallel hybrid EV. (d) Battery-powered EV
In the PHEV class, three variants have been developed so far:
- Series-parallel hybrid - Series hybrid - Parallel hybrid
The main difference among the topologies is the drive system used and the interconnection of its components, before the power is transferred to the wheels.
In the series-parallel hybrid vehicle, Fig. 1 (a), the system is designed to operate both in a series or parallel configuration. The reconfigurable system is made possible by the use of a planetary gear, which is the mechanical coupling (MC) for the three machines. In the series hybrid vehicle, Fig. 1 (b), the electric traction system and Internal Combustion Engine (ICE) system operate in a series connection. In sequence, the ICE is coupled with a generator (Gen.) which generates the electric power for recharging the battery, the battery then supplies an electric motor driver to transfer power to wheels. In the parallel hybrid vehicle, Fig. 1 (c), the ICE and electric motor (EM) operate in parallel mode, where the ICE supports the electric traction at certain points of the driving pattern, e.g. when higher power is needed to the wheels.
In the battery-powered EV class, Fig. 1 (d), the drive system is realized using only an electric motor and a motor driver. Therefore the only energy source is the battery pack.
In this work a battery-powered EV is the architecture chosen for the EV test bed implementation.
B. Controllable charging/discharging operation All plug-in EV are able to absorb power from the grid while
charging their battery packs. The controlled charging or discharging (V2G) process can be achieved using different infrastructure concepts, such as home charging or public charging stations [14]. According to the IEC 61851 standard [15], the most common power rates for domestic and public charging are depicted in Table I.
TABLE I CHARGING POWER RATES
AC current AC voltage Grid connection Power 10 A 230 V single phase 2.3 kW 16 A 230 V single phase 3.7 kW 32 A 230 V single phase 7.4 kW 16 A 400 V three-phase 11 kW 32 A 400 V three-phase 22 kW
All power rates, regardless of charging or discharging, are characterized by an AC current, usually 16A or 32A, and based on the grid connection type, single-phase or three-phase.
In this work a charging/discharging power rate of ± 2.3 kW is used for the experimental validation.
C. Planned EV test bed operation with Virtual Power Plant The EV system architecture is planned to respond to
different control signals from a centralized EV coordinator. The control signals for the vehicles can be generated by a
VPP and based on different variables such as the power system frequency, the market spot price and others.
In this paper, the centralized control concept for EV fleet management as described by Binding et al. in [10] is used as a study framework. The EV test bed operation is planned within the VPP framework depicted in Fig. 2. Different interfaces have been defined to establish communication between the Edison VPP and other entities in the architecture. While a
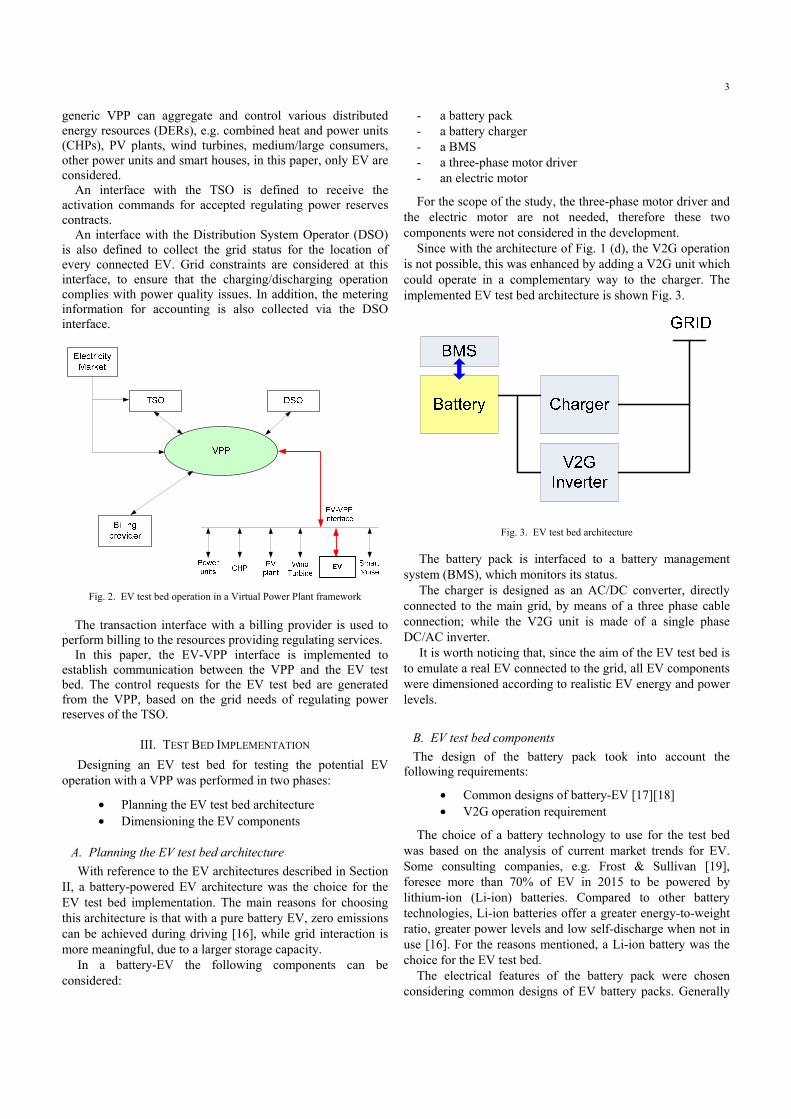
3
generic VPP can aggregate and control various distributed energy resources (DERs), e.g. combined heat and power units (CHPs), PV plants, wind turbines, medium/large consumers, other power units and smart houses, in this paper, only EV are considered.
An interface with the TSO is defined to receive the activation commands for accepted regulating power reserves contracts.
An interface with the Distribution System Operator (DSO) is also defined to collect the grid status for the location of every connected EV. Grid constraints are considered at this interface, to ensure that the charging/discharging operation complies with power quality issues. In addition, the metering information for accounting is also collected via the DSO interface.
Fig. 2. EV test bed operation in a Virtual Power Plant framework
The transaction interface with a billing provider is used to
perform billing to the resources providing regulating services. In this paper, the EV-VPP interface is implemented to
establish communication between the VPP and the EV test bed. The control requests for the EV test bed are generated from the VPP, based on the grid needs of regulating power reserves of the TSO.
III. TEST BED IMPLEMENTATION Designing an EV test bed for testing the potential EV
operation with a VPP was performed in two phases:
• Planning the EV test bed architecture • Dimensioning the EV components
A. Planning the EV test bed architecture With reference to the EV architectures described in Section
II, a battery-powered EV architecture was the choice for the EV test bed implementation. The main reasons for choosing this architecture is that with a pure battery EV, zero emissions can be achieved during driving [16], while grid interaction is more meaningful, due to a larger storage capacity.
In a battery-EV the following components can be considered:
- a battery pack - a battery charger - a BMS - a three-phase motor driver - an electric motor
For the scope of the study, the three-phase motor driver and the electric motor are not needed, therefore these two components were not considered in the development.
Since with the architecture of Fig. 1 (d), the V2G operation is not possible, this was enhanced by adding a V2G unit which could operate in a complementary way to the charger. The implemented EV test bed architecture is shown Fig. 3.
Fig. 3. EV test bed architecture
The battery pack is interfaced to a battery management system (BMS), which monitors its status.
The charger is designed as an AC/DC converter, directly connected to the main grid, by means of a three phase cable connection; while the V2G unit is made of a single phase DC/AC inverter.
It is worth noticing that, since the aim of the EV test bed is to emulate a real EV connected to the grid, all EV components were dimensioned according to realistic EV energy and power levels.
B. EV test bed components The design of the battery pack took into account the
following requirements:
• Common designs of battery-EV [17][18] • V2G operation requirement
The choice of a battery technology to use for the test bed was based on the analysis of current market trends for EV. Some consulting companies, e.g. Frost & Sullivan [19], foresee more than 70% of EV in 2015 to be powered by lithium-ion (Li-ion) batteries. Compared to other battery technologies, Li-ion batteries offer a greater energy-to-weight ratio, greater power levels and low self-discharge when not in use [16]. For the reasons mentioned, a Li-ion battery was the choice for the EV test bed.
The electrical features of the battery pack were chosen considering common designs of EV battery packs. Generally

ba40pabaVpno
is
cowa4 aroint
baopopVPtem oufor
Thful
is
attery-EV have00V and a batteack was designattery cells, whpack, of 363 V. Eominal capacity
Based on the valid for calcu
E
where N is the
The requiremonverter with inas used. The rakW, which leound 16 A. Tternal transformA battery m
attery pack. Theperation of thperation. It estiPP and monmperature. The charger w
utput voltage rmula shown b
dcV
he current Idc oll load, which lThe implemendepicted in Fig
e battery pack ery capacity oned integratinhich leads to Each cell has ny Cn, of 40 Ah.nominal param
ulating the nom
n pack nE V C= ⋅
e number of cel
ment of V2G nput DC voltagated output powads to a maxi
The V2G invemer, which serv
management sye main functionhe battery paimates the SOCnitors the b
was designed Vdc was dim
below, accordin
1.25 packV= ⋅
on the battery leads a charginnted test bed wg. 4.
Fig. 4. E
voltages in thf at least 10-1g 110 Li-ion a total nomin
nominal voltage
meters, the follminal battery en
n n nN V C= ⋅ ⋅
lls.
operation, age in the rangewer of the V2Gimum generateerter is also eves as galvanic
ystem (BMS) n of the BMS i
ack during chC information battery voltag
as a single-phmensioned usinng to [20]:
453 V=
side is dimensng power of abwith integrated
V test bed
he range of 35 kWh. A battseries connec
nal pack voltae Vn, of 3.3 V a
owing expressnergy:
n (1)
a DC/AC powe of 250 – 500
G inverter is abed AC currentequipped with c isolation. is linked to is to ensure a sharging or Vwhich is used
ge, current a
hase AC/DC. Tng the empiri
(2)
sioned of 10 Aout 4.5 kW.
d EV compone
00-tery cted age, and
sion
wer 0 V bout t of
an
the safe
V2G d by and
The ical
A at
ents
IAs pr
operate the direpurposeadapt thcontrol
F
To finterfacecommun
The 61850 sattempt system to HTTP
The Val. [23] schedulepower re
Thouare simpassociatapplicab[24].
IV. COMMUNI
reviously mentas part of a ce
ect control of e of future resehe software syschemes.
Char
Inverter
PowerMeasuremControl
Fig. 5. EV test bed
facilitate cente was impnication and cocommunicatiostandard [22].to promote thecommunicatioP/REST. This wVPP used for and has been
es, in responeserves specifi
ugh used for anply based on pted time stampble to any type
ICATION AND Ctioned, the EVentralized aggr
a VPP, as dearch, it will bystem in order
V
IECS
IEC
B
B
rger
relay
ment
d communication
tralized coordlemented in ontrol architecton is based on. As an acadee use of existin
on, the IEC 61work was presthis paper wasused for gene
nse to the reqied by the TSO
n EV test bed inpositive/negativp. For this ree of Distributed
CONTROL WITH
V test bed was regation frame
described in [2be possible, in r to e.g. test d
VPP
C 61850 Server
C Module
BMS
Battery
relay
and control archite
dination, the accordance
ture depicted inn the well-estaemic exercise ng web standar850 standard w
sented in details designed by erating and senquirements for
O. n this case, theve power requason, they ared Energy Reso
4
VPP designed to
ework, under 21]. For the any case, to
decentralized
ecture
VPP-to-EV with the
n Fig. 5. ablished IEC
and in the rds in power was mapped s in [23]. Pedersen et
nding power r regulating
se schedules uests with an e potentially ource (DER)

5
A. IEC 61850 Server and Module The server, which was developed in compliance with the
IEC 61850 standard, is designed based on a modular plug-in architecture, in order to facilitate an easier adaptation and installation of new devices of virtually any type [23].
A device specific plug-in, or IEC Module, was implemented, in order to enable direct control of the test bed from the VPP, as well as to facilitate the collection of battery status information along with any other measurements.
Because the charger and inverter are two separate pieces of hardware connected to the same battery, an algorithm was written into the plug-in module to guarantee the mutually-exclusive operation of the connecting relays. This prevents the simultaneous operation of both devices.
Another communication link is established between software plug-in and the BMS to extract the state-of-charge (SOC) information from the battery.
B. Charging As indicated by Fig. 6, there is no direct control link
between the IEC Module and the charger; this is because the charger has not communication interface for remote control. For the purpose of this paper, the charger is fixed to a fixed power rate and is coupled or decoupled from the battery by means of a DC relay, which is controlled via RS232, as illustrated in Fig..
IEC Module
Relay
RS232
Charger
Grid
Fig. 6. Charging communication in detail
As previously mentioned, the charger and inverter are both connected to the battery pack using two mutually exclusive relays. In order to ensure that the devices have exclusive “access” to the battery, a simple timing scheme was used in the IEC Module. As depicted in Fig., a time gap was added between two switching events to ensure a safe transition.
Fig. 7. Relay timing scheme
C. V2G The coupling of the V2G inverter is achieved by means of an
identical DC relay as for the charger. Under V2G operation, the generated power level is controllable and this is managed through an attached communication hub. The same hub implements an HTTP/JSON web interface. A more detailed illustration of the V2G architecture used for the EV test bed is depicted in Fig. 8.
Fig. 8. V2G communication in detail
D. Battery Status Information The real-time status of the battery is monitored by the BMS.
The BMS information is acquired by the IEC Module using RS485 based serial communication link. By means of this link, all battery data can be extracted as a set of values and made available to the VPP via IEC 61850 for detailed monitoring. The set of values includes:
• Battery pack voltage • Current • State of charge • Temperature in different areas of the battery pack • Remaining energy and single cell voltages
Fig. 9. BMS communication in detail
The BMS comes equipped with an RS232 port for remote monitoring of the battery pack, as well as controlling various limits/alarms. Connected to the BMS are a series of sensors, which connection are depicted as a series of smaller wires in Fig..

6
Fig. 10. Test results of EV test bed contribution in regulating power service – Secondary control. (a) Target regulating power of the Danish TSO and VPP
generated schedule for the EV test bed and the other EV. (b) Measured power response and battery SOC of EV test bed.
V. EXPERIMENTAL RESULTS The EV test bed participation in regulating power reserves
was tested considering the regulating power required for secondary control, by the Danish TSO, on the 1st of January 2009 [25]. The regulating power profile sent from the TSO to the VPP is given in 5-minutes average MW values as shown in Fig. 10(a). The target regulating power is derived by the sum of all up and down regulation requests sent out by the TSO to an array of providers in the same 5-minutes. The target anyway does not reflect the exact need of the system but rather the value is used to drag the providers in the right direction.
Nevertheless, the target value is a very good approximation to the real-time need of regulation reserves. A new schedule, related to the TSO power target, was generated by the VPP every 5-minutes, and sent to the EV test bed. The regulation was tested in the time interval 16h30 to 19h30. The schedule is shaped as ±2.3 kW power requests with time stamps, indicating the activation/deactivation time of charging and V2G mode, Fig. 10(a). Since each EV has a very small capacity compared to the grid needs, it was assumed that the VPP meets the TSO target by aggregating a number of simulated EV. The EV system response, Fig. 10(b), is taken measuring the electric power flow at the point of
-2.5
-2
-1.5
-1
-0.5
0
0.5
1
1.5
2
2.5
-100.0
-80.0
-60.0
-40.0
-20.0
0.0
20.0
40.0
60.0
80.0
100.0
Sche
dule
(KW
)
Targ
et V
alue
(MW
)
Targetvalue (MW) Schedule (KW)Target value(MW) Schedule (kW)
0.2
0.3
0.4
0.5
0.6
0.7
0.8
0.9
-3-2.5
-2-1.5
-1-0.5
00.5
11.5
22.5
3
SOC
Mea
sure
d Po
wer
(kW
)
ActivePower SOCMeasured Power (MW) SOC
7
common coupling (PCC) of the EV test bed with the grid. The power was recorded with 1 minute sampling time. Test results are depicted in Fig. 10(b). It is possible to observe that the EV test bed is able to react in real-time to the power schedule sent by the VPP. The measured power profile in Fig. 10(b) validates the effectiveness of the EV architecture proposed in this work. Furthermore, the SOC profile shows the energy variation in the EV test bed battery, during the regulation service. The EV test bed started to contribute to regulating power service with an initial SOC of about 0.5 or 50%.
VI. CONCLUSIONS Testing the capabilities of EV for smart grid applications
requires the development of adequate evaluation platforms. In literature it was demonstrated that EV can potentially operate under a number of coordination schemes, including the participation in regulating power reserves. While this was extensively presented by simulation scenarios, in this paper, a real implementation of regulating power reserve performed by a full-scale EV test bed was presented. The test bed was designed to flexibly interact in real-time with an EV coordinator and the electricity grid, under different coordination concepts. To do so, real EV components and communication interfaces were used, that make possible an end-to-end interaction with a VPP. The implementation of an EV test bed from scratch enabled the management of the single components involved in the EV system: charging/discharging units and BMS. With the implemented communication and control architecture it was possible to establish a stable communication between the EV the test bed and the Virtual Power Plant. The potential offered by EV for regulating power was demonstrated testing the EV test bed hardware and software interfaces. An array of regulating power requests (load frequency control) within a 3-hours time interval, sent by the Danish TSO on the 1st of January 2009, was used as study case. The TSO target values were converted to an EV compatible schedule by the Edison VPP and sent down to the EV test bed among the other simulated EV. Test results revealed the potential capability of EV to respond in real-time to different charging/discharging requests based on different coordination plans. Further investigations will be performed for evaluating the reliability of the communication involved, when several fleets of EV are simultaneously coordinated.
ACKNOWLEDGMENTS The authors would like to thank Sammarco Elettronica,
Italy, for the technical support offered in the realization of the Electric Vehicle test bed.
REFERENCES [1] J. A. Pecas Lopes, F. Joel Soares, and P. M. Rocha Almeida,
“Integration of Electric Vehicles in the Electric Power System”, in Proc. IEEE, Vol. 99, 2011
[2] European Commission, “20 20 by 2020 Europe's climate change opportunity”, COM (2008) 30 final, Brussels, 2008.
[3] A. Brooks, “Integration of electric drive vehicles with the power grid – a new application for vehicle batteries”, in Battery Conference on Applications and Advances. The Seventeenth Annual, 2002.
[4] W. Kempton and J. Tomic, “Vehicle-to-grid power fundamentals: Calculating capacity and net revenue”, J. Power Sources, vol. 144, no. 1, pp. 268–279, Jun. 2005.
[5] S. Deilami, A.S. Masoum, P. S. Moses, M. A. S. Masoum, “Real-time coordination of Plug-in Electric Vehicle Charging in Smart Grids to Minimize Power Losses and Improve Voltage Profile”, in IEEE Transactions on Smart Grid, Vol. 2, no. 3, pp. 456-467, 2011.
[6] N. Rotering, M. Ilic, “Optimal Charge Control of Plug-in Hybrid Electric Vehicles in Deregulated Electricity Markets”, in IEEE Transactions on Power Systems, Vol. 26, no. 3, pp. 1021-1029, 2011.
[7] J. R. Pillai and B. Bak-Jensen, “Vehicle-to-grid systems for frequency regulation in an Islanded Danish distribution network”, in IEEE Proc. Vehicle Power and Propulsion Conference (VPPC), 2010.
[8] M. D. Galus, S. Koch, G. Andersson, “Provision of Load Frequency Control by PHEVs, Controllable Loads, and a Cogeneration Unit”, in IEEE Transactions on Industrial Electronics, Vol. 58, Nr. 10, 2011.
[9] B. Jansen, C. Binding, O. Sundstrom, D. Gantenbein, “Architecture and Communication of an Electric Vehicle Virtual Power Plant”, in IEEE Proc. First IEEE International Conference on Smart Grid Communications, 2010
[10] C. Binding, D. Gantenbein, B. Jansen, O. Sundstrom, P. B. Andersen, F. Marra, B. Poulsen and C. Træholt, “Electric Vehicle Fleet Integration in the Danish EDISON Project - A Virtual Power Plant on the Island of Bornholm”, IEEE Power & Energy Society General Meeting, 2009.
[11] N. Ruiz, I. Cobelo, J. Oyrzabal, "A Direct Load Control Model for Virtual Power Plant Management", in IEEE Transactions of Power Systems, Vol. 24, No. 2, pp. 959-966, 2009.
[12] J. L. Aguero, M. C. Berequi, F. Issouribehere, “Grid Frequency Control. Secondary frequency control tuning taking into account distributed primary frequency control”, in IEEE Proc. of Power and Energy Society General Meeting, 2010.
[13] K. Chen, A. Bouscayrol, A. Berthon, P. Delarue, D. Hissel, and R. Trigui, “Global modeling of different vehicles”, IEEE Vehicular Technology Magazine, 2009
[14] B. Lunz, T. Pollok, A. Schnettler, R. W. De Doncker, D. U. Sauer, “Evaluation of Battery Charging Concepts for Electric Vehicles and Plug-in Hybrid Electric Vehicles”, Advanced Automotive Battery Conference (AABC), 2009
[15] IEC 61851, Electric vehicle conductive charging system – Electric vehicles requirements for conductive connection of an a.c./d.c. power supply.
[16] P. Morrison, A. Binder, B. Funieru, C. Sabirin, “Drive train design for medium-sized zero emission electric vehicles”, 13th European Conference on Power Electronics and Applications, 2009.
[17] General Motors, “Chevrolet Volt – Quick reference sheet”, online [18] Nissan, “Overview of Nissan Leaf”, in News Releases,
www.nissan-global.com, 2010 [19] Frost & Sullivan, “M5B6-Global Electric Vehicles Lithium-ion Battery
Second Life and Recycling Market Analysis”, public report, 2010. [20] Thunder Sky, Li-ion battery user manual [21] EDISON project, “WP3 report D3.1”, www.edison-net.dk [22] IEC 61850 Part 7-420 [23] A. Bro Pedersen, E. Bragi Hauksson, P. Bach Andersen, B. Poulsen, C.
Træholt, and D. Gantenbein “Facilitating a generic communication interface to distributed energy resources”, in IEEE Proc. First IEEE International Conference on Smart Grid Communications, 2010
[24] A. Timbus, M. Larsson, and C. Yuen, “Active Management of Distributed Energy Resources Using Standardized Communications and Modern Information Technologies”, in IEEE Transactions on Industrial Electronics, Vol. 56, Nr. 10, pp. 4029-4037, 2009
[25] Energinet.dk, “Load Frequency Control - Secondary Reserve data”, January, 2009.

9. CORE PUBLICATIONS
E Prediction and Optimization Methods for Electric Ve-
hicle Charging Schedules in the EDISON Project
This paper was published in the Proceedings of the IEEE PES Conference on Innovative
Smart Grid Technologies (ISGT), 2012, Washington, D.C, USA.
152

Prediction and optimization methods for electricvehicle charging schedules in the EDISON project
Andreas Aabrandt, Peter Bach Andersen, Anders Bro Pedersen, Shi You,Bjarne Poulsen, Niamh O’Connell and Jacob Østergaard
Dept. of Informatics and Mathematical Modelling & CET at Dept. of Electrical Engineering,Technical University of Denmark
Abstract—Smart charging, where the charging of an electricvehicle battery is delayed or advanced in time based on energycosts, grid capacity or renewable contents, has a great potentialfor increasing the value of the electric vehicle to the owner, thegrid and society as a whole.
The Danish EDISON project has been launched to investigatevarious areas relevant to electric vehicle integration. As part ofEDISON an electric vehicle aggregator has been developed todemonstrate smart charging of electric vehicles.
The emphasis of this paper is the mathematical methods onwhich the EDISON aggregator is based. This includes an analysisof the problem of EV driving prediction and charging optimiza-tion, a description of the mathematical models implemented andan evaluation of the accuracy of such models. Finally, additionaloptimization considerations as well as possible future extensionswill be explored.
This paper hopes to contribute to the field of EV integrationby coupling optimized EV charging coordination with the EVutilization predictions on which the former heavily relies.
I. INTRODUCTION
Besides offering a means of cleaned transportation, the elec-tric vehicle (EV) represents a high-powered, quick responding,controllable load that can adjust its charging behavior tothe day-ahead energy prices and even participate in ancillaryservice markets.
The Danish EDISON project [11],[12] has been launchedto explore the above potential by investigating topics relevantto EV integration and to demonstrate how the charging andpossible discharging of electric vehicles (EVs), if handledintelligently, can yield benefits to the EV owner, the grid andsociety
A wide range of different EV integration concepts arealready being investigated in numerous similar projects. In-tegration concepts typically differ in what needs the EV isused to fulfill in the power system and what mechanisms,designs and technologies are used to control or influence theEVs interaction with the grid.
The approach used in EDISON is having an Aggregatorentity control the interaction between an electric vehicle fleetand the electrical grid to facilitate ’smart charging’. TheEDISON aggregator is demonstrated both towards real EVsand a simulated fleet.
The aggregator software implemented in EDISON relies ona set of algorithms in order to predict the charging availabilityof the fleet and minimize the charging cost based on day-ahead energy markets. The main focus of this paper is on
the description and evaluation of a prediction method usingexponential smoothing. Besides minimizing the charging cost,a set of additional considerations imposed by the owner of thevehicle, the distribution grid and the EV battery should alsobe added to the optimization.
The remainder of the paper is organized as follows. SectionII will describe work by IBM and the University of Delawarerelevant to the EDISON project and this paper. In section IIIwill describe the mathematical problems that will be addressedby the models described in sections IV and V. Sections VIIand VIII will present results based on the empirical data used.Section IX will introduce regulation services on top of smartcharging. Finally, section X will summarize the findings of thepaper.
II. RELATED WORK
Sundstrom and Binding have, in a set of papers, focusedon coordinated EV fleet charging. In [13] the authors uselinear and quadric programming to minimize charging costs.In [8] the same authors propose an optimal charging methodwhere the aggregator is aware of the grid constraints. In athird paper [14] Sundstrom and Binding investigate how thecharging planning of an aggregator can be made to meet userrequirements.
This paper adds to these papers by focusing on the avail-ability prediction and by suggesting additional considerationsand constraints.
According to research by Kempton et al. from the UniversityOf Delaware (UD), an EV would be parked 95% of the timeand would thus represent a vastly underutilized resource if itspotential for servicing the grid is not used [15],[16]. From thesame research group, Kamboj has developed algorithms thatcalculate an electric vehicles ability to participate in frequencyregulating services while considering the energy requirementsand time constraints of the EV owner [17]. The EDISONAggregator software could borrow from the experiences of UDand there are plans to add regulating services to the objectivesof the EDISON aggregator software.
III. ANALYSIS OF THE PROBLEM
For an EV to adjust its charging behaviour according today-ahead energy prices and still meet the energy demandof the individual EV owner, mathematical models need to bedeveloped. A major concern is that reliable data of EV driving

Fig. 1. Meta model
behaviour is hard to come by. Some studies have been con-ducted but most of them are geographic and demographicallybiased.
The AKTA data [19] was originally collected in a collab-oration between the city of Copenhagen and the TechnicalUniversity of Denmark in order to investigate the drivinghabits of people living in the capital. The AKTA data, whichis used in this study, are collected by means of GPS wherea total of 360 vehicles were followed from 14 to 100 daysin 2001 - 2003. The AKTA data is biased towards drivingpatterns similar to everyday driving in the greater Copenhagenarea. The data is incomplete in that some observations aremissing. The data have been filtered to include only theobservations which have been plugged in during night timefor more than ten days during the period of the trial. Thereare 205 observations left in the sample after this filtration.
The present study is aiming at developing a robust frame-work not too sensitive to the errors of prediction. It isassumed that the day-ahead energy prices are known. It willbe investigated how to model the day-ahead demand of an EVowner and using the just stated estimation along with the day-ahead energy prices to calculate the optimal charging schedulefor a single EV.
The overall framework used in the present proceeding isdepicted in figure 1. At the individual level every EV will havea static energy demand until enough data has been collected.Once enough historic information is available a predictionmodel will be employed. Since mathematical models in gen-eral are sensitive to the topology of the data a simple predictionmodel will be developed. The prediction model and the day-ahead energy prices are fed to the optimization model at thelast expected plugin of the day which will produce a chargingschedule 24 hours ahead.
It is an advantage to let the prediction model and the opti-mization model have a low coupling. This makes it possible toplugin a new prediction model if a more appropriate model islater developed. This also allows for a static prediction modeluntil enough data has been collected.
IV. MATHEMATICAL MODEL FOR PREDICTION
For relatively small and biased data sets, simpler modelsare more suitable. If the model is very complex then it shouldtake into account the cyclic variations of the data, e.g. theremay be daily and weekly variations in driving patterns. Thesevariations may be different between geographical regions andculture. An exponential smoothing model is proposed whereno such variations are taken into account. This will be donesuch that the model can be homotoped between upper andlower bounds of the data. The ideal placement will be differentfor each EV.
Consider figure 2. The interval available for charging to bepassed to the optimization model is the period between themaximum of the plugin prediction interval and the minimumof the plugout prediction interval.
Fig. 2. Stopover duration.
An exponential smoothing model for estimating pluginintervals will be used. The model is given by the recursiveequation
Xn+1 = (1− δ)Xn + δSn, (1)
where δ ∈ [0; 1] is a fixed parameter, X1 = S1 and S ∈ Rn ishistoric data for a given vehicle.
Preprocessing the data to remove outliers will be necessaryfor sparse data. Let (Rn, ‖ · ‖) denote the usual n-dimensionalEuclidean space equipped with the usual norm, i.e
‖x‖2 =n∑
i=1
x2i , x ∈ Rn.
The variance of a sample x ∈ Rn is thus given by
σ2 =1
n− 1‖x− µ1‖2,
where µ is the mean of the sample and 1 is the identityelement in Rn. From now on the identity element will not bewritten when vector-scalar addition occur. Here x is interpretedas the time series of historic data for a given EV. It isassumed that behaviour which deviates sufficiently from themean is unpredictable and this leads to the following lemma,which states a criterion for an element in a sample to be”predictable”. This lemma will be used for variance reduction.
Lemma IV.1. Denote by µ and σ2 the mean and variance,respectively, of a sequence xn of positive real numbers. Letxnk be a subsequence of xn and let p be a fixed positiveinteger such that µ ≥ pσ. Then
{|xnk − µ| ≤ p σ, ∀k}m{xnk ∈ [µ− pσ; µ+ pσ] , ∀k}.

Proof: Since xnk , σ ≥ 0 for all k and x ∈ Rn it sufficesto consider
|xnk − µ|2 ≤ p2σ2 ⇔ x2nk + µ2 − 2µxnk − p2σ2 ≤ 0.
This is a quadratic inequality and solving it finishes the proofof the lemma.
Consider a sequence (xn) ∈ Rn with variance σ2 and meanµ. Let p ∈ N such that µ ≥ pσ. Then, for a subsequence(xnk) ∈ Rk, with variance σ2 and mean µ, satisfying
|xnk − µ| ≤ p σ, ∀k
then it is assumed that σ2 ≤ σ2.The above states that if a subsequence xnk is chosen such
that it is an integral number, p, of standard deviations σ awayfrom the mean µ, then the variance of this subsequence isbounded by the variance of the original sequence.
In [14], Sundstrom and Binding presents a linear pro-gramming model which uses time and energy margins tocompensate for prediction errors. The time and energy marginsare implemented by modifying the optimization constraints.
The method used here compensates for prediction errorsprior to optimization by considering the variance of thepredictions. This is done for time and could also be used forprediction errors of energy targets if energy was part of theprediction model.
After determining the stopover duration, the time periodwill be cropped in both ends depending on the standarddeviation of the prediction i.e. the more unpredictable thedriving behaviour, the more conservative the duration estimate.
V. MATHEMATICAL MODEL FOR OPTIMIZATION
A charging schedule defines the periods in time and charg-ing powers at which an EV should charge its battery. Theoptimization algorithm is the generator of the charging sched-ules.
Let α ∈ Rn+ denote the cost vector and write αi for the cost
at time interval i = 1, ..., n, where n is the number of timeintervals, and let the length of the time interval be βi, whereβ ∈ Rn
+. Let p ∈ Rm+ , such that pj denotes the power at which
the battery is charging, j = 1, ...,m, where m is the number ofpossible power configurations. Normally one could use the pvector as the decision variable, if {0} is included in the set ofpower configurations, but here it will be used that there existsa vector e such that pj =
∑pjej where ej ∈ Z2 = Z/2Z for
every j = 1, ...,m.The prediction model will be used to produce an estimate
of the lower and upper bounds for the number n.Let X ∈ Zn×m
2 , i.e. for every i it holds that Xi ∈ Zm2 .
Choose X as the decision variable and let f : Zn×m2 → R
be the cost function defined by multiplying every definedvariable in the obvious linear fashion. While the objective isto minimize the cost, the initial model to be used is then given
Fig. 3. Charging Schedule
by
min : fm,n =n∑
i=1
m∑
j=1
αiβipjXij
subject to :m∑
j=1
X1j ≤ 1
...m∑
j=1
Xnj ≤ 1
m∑
j=1
n∑
i=1
βipjXij ≥ E,
(2)
where E is the energy required by the EV. The product of theoptimization model is a charging schedule like the one shownin figure 3.
VI. VALIDATION OF RESULTS
The following example demonstrates the level of robustnessof the optimization model. This will also demonstrate that theprediction model need not be very precise, which is goodbecause it is very hard to make good predictions based onhuman behaviour.
Assume a given EV has an average stopover duration µ.Depending on the standard deviation σ of the predictionit can be determined how this influence the objective ofthe optimization model. Assuming that the data is normallydistributed, which may or may not be the case, a sample fromthe normal distribution N (µ, σ2) can be used to determinehow many times the linear model will produce false positiveestimates, i.e. predicting a EV is ready for charging whenit is not. This is done by only considering the prediction ofsome of the parameters of the optimization model, keepingin mind that true negatives are not considered bad estimateshere. Indeed these estimates are good by construction andcan be optimized further to yield less expensive results, i.e.minimizing the objective function further. However, the riskof getting false positives increases with the goal of minimizingthe objective function. To see how the errors may influencethe objective function, consider the surface w : U ⊂ R2 → R3
where the parameter space U is chosen to be the mean andstandard deviation of a series of predictions. The height usedhere is the probability of the EV being ready for charging aspredicted. This is expressed mathematically by
w(µ, σ) = P (a < x ≤ b), x ∼ N (µ, σ2).

In the current setting P (x ≤ b) = Fx(b) where
Fx(b) =1√2πσ2
∫ b
−∞e−
(µ−x)22σ2 dx
is the cumulative distribution function, it holds that
P (a < x ≤ b) = Fx(b)− Fx(a).
Fig. 4. Probability surface.
From this it is possible to deduce bounds for mean andstandard deviations from which the model works sufficientlywell. Let V ⊂ U be the set of parameters such that w(µ, σ) ≥0.95. Then the pairs (µ, σ) will belong to a closed and boundedregion V ⊂ R2.
Fig. 5. V cropped to the region [200; 1600]× [100; 300].
From this it can be concluded that predictions will get worseif:
1) For a fixed mean the standard deviation increases.2) For a fixed standard deviation the mean decreases.The estimator for the standard deviation of a sample x ∈ Rn
used here isσ =
1√n− 1.5
‖x− µ‖.
This estimator is not completely unbiased but it is sufficientfor the current analysis.
If the data for a particular EV is not normally distributedthen the above figures may look different. However it is likelythat the same considerations can be made based upon theparticular distribution.
VII. RESULTS
In the following the method described in the previoussection will be carried out on the AKTA data. The followingfigure illustrates that the predictions, in general, lie in thedesired region V .
Fig. 6. Results cropped to the region [200; 1600]× [100; 300].
Since the data set is quite small from a statistical viewpoint,it will be shown that these predictions may lie outside theregion V . Consider the 95% prediction interval
[µ− 1.96σ;µ+ 1.96σ].
From this the worst case scenario (assuming estimator for σ isgood) is that the predictions are placed in the lower part of theinterval. For the data set used here there are 205 observations
Fig. 7. Lower bound of the mean. Region [200; 1600]× [100; 300].
which have more than 10 days worth of observations. Thereare 13 observations which have a lower bound of the predictioninterval outside the region V . That is around 93.65% of thepredictions will lie in the region V . It is however unlikelythat all the predictions will be placed in the lower part of theprediction interval.
A example of how the optimization model performs whenthe variance of the predictions increases is now considered.The energy is assumed to be fixed, say E = 20000Wh, andthe prices αi have been sampled from a uniform distributionon the interval [80; 120].

α0 106.36 α10 99.58α1 88.41 α11 91.32α2 111.66 α12 112.49α3 114.88 α13 118.47α4 86.72 α14 110.87α5 105.41 α15 113.68α6 94.00 α16 105.70α7 105.81 α17 80.90α8 91.83 α18 97.57α9 110.45 α19 94.56
The possible charging periods βi are all assumed equal inlengths and measured in hours, i.e.
βi =1
2, ∀i.
The example demonstrates how the objective function isaffected when the stopover duration of initially 10 hours isincrementally cropped. This corresponds to increasing thestandard deviation of the prediction.
Fig. 8. Value of objective function.
In this example the crop is done by removing the first andlast elements of every parameter in the optimization model, seeequation 2. This can be different from actual events since thestandard deviation of last plugin prediction may be differentfrom that of first plugout prediction. The result shows theintuitive result that if the stopover duration decreases then thecost of charging is more.
A more thorough sensitivity analysis could be carried outon the parameters and these should at lease include chargingintervals, price time series and energy targets. Since datadescribing the energy targets was not available to the authorsat the time of writing this has not considered.
VIII. FURTHER EXTENSIONS OF THE MODEL
An interesting possibility is to let the EDISON EV aggre-gator target the ancillary services (A/S) markets. A/S marketsin general reward the capability of fast response which nicelymatches the capabilities of an aggregated group of EVs. InDenmark, markets such as ’Secondary reserve’ and ’Frequencycontrolled normal operation reserve’ are valid candidates for
EV participation, potentially offering a higher economic inven-tive than the earnings gained through smart charging alone. Afuture paper could seek to demonstrate how smart chargingand A/S can be combined by the aggregator to maximizethe overall economic value of controlled charging while stilladhering to all the constraints and considerations listed in thispaper.
IX. ADDITIONAL OPTIMIZATION CONSIDERATIONS
Although the optimization methods presented in this paperprimarily seeks to reduce the cost of energy, there are a greatmany additional parameters to be considered in the chargingof an EV. The primary sources of such considerations are thedistribution grid that connects the EV to the power system,the driving demands of the user of the EV and the internalbattery pack of the vehicle. The following will attempt to listthe most important of these considerations.
A. Distribution grid constraintsAnalyses of the impact of EVs on the power system have
revealed that without intervention, EV charging will placesubstantial pressure on the grid, particularly at the mediumand low voltage levels [1], [2], [3], [4]. The degree of gridcongestion is dependent on a number of factors includinglocal grid topology, penetration and distribution of EVs, andcharging management procedures [5]. Congestion will leadto reduced asset life expectancies, and in turn increasednetwork maintenance costs. Many studies have found thatcoordinated charging of vehicles is effective at reducing con-gestion, thereby increasing the penetration of EVs tolerableon any given network, and facilitating the deferral of gridreinforcement [1], [4].
Numerous approaches to dividing and managing availablegrid capacity are proposed within the literature. These can begenerally summarized as follows:
Static capacity allo-cation
Where each EV or aggrega-tor has a fixed portion of thecapacity allocated to them,i.e. a certain maximum al-lowed load in watts pr node.This approach is relativelyeasy to implement but willnot efficiently use the avail-able grid capacity.
Grid capacity market Where a dynamic market isimplemented in which theEVs, or the aggregators rep-resenting them, would bidfor certain amounts of theavailable capacity.
Dynamic tariff pricesignals
Aggregators or individualEVs respond to a price sig-nal that is representative ofthe congestion at each node,and optimize their chargingschedule accordingly.

Regardless of which of the above methods is used, an ag-gregator or fleet operator represents an efficient approach tocoordinate EV charging to avoid grid overload. In [10] a’Plug-In Hybrid Electric Vehicle (PHEV) manager’ is usedto coordinate all EV charging within a given zone, wherethe manager is aware of the grid capacity and can optimizecharging with respect to this. Alternatively, [9] proposes aniterative approach where by each aggregator coordinates thecharging of their fleet and reports this to the DSO.
A way to include grid considerations in the optimizationdefined in this paper is to limit the range of available chargingpowers at certain points in time.
If there is a need for incorporating grid constraints in model2 it may be useful to let p ∈ Rn×m
+ . Every row p is then thepossible charging configurations at time j where j = 1, . . . ,m.
B. Battery constraints
Another important area of research is on the lifetime ofEV batteries and the factors that influence it. Francesco et al.[18] has defined the following formula which summarizes themajor factors that has an influence on the battery lifetime L.
L = f(Cc, T,D,Cr),
where Cc is the charging cycles, T the temperature, D thedepth of discharge and Cr the charging rate. For most, if notall EVs, some sort of Battery Management System (BMS) willmonitor and to some degree control the above parameters as tomaximize the battery lifetime. One parameter relevant to theaggregator is the charging rate. For lithium Ion batteries, thecharging power should be reduced when the SOC exceeds acertain percentage. If this is not considered in the definition ofthe algorithm, less energy might be available at the beginningof a trip than defined by the energy target of the chargingschedule. One solution is simply to ignore the last roughlyten percent of the available energy capacity when generatinga charging schedule.
C. EV owner driving requirements
Driving predictions should be a tool to simplicity the EVowner’s management and control of smart charging. It should,however, always be possible for the EV user to assume directcontrol of the charging process. The main parameters that theEV user must be able to set are the energy demand and startingtime of the next desired trip. If such parameters are explicitlydefined by the user they will overwrite the values calculated bythe prediction algorithm. EV owner requirements can be meetby the optimization algorithm by simply setting the energytarget (E) and start time of the next trip to values defined bythe user.
At times, the EV owner might even wish to overwrite smartcharging all together, by choosing to instantaneously startcharging at the highest possible charging power. This woulddisable any kind of optimization.
X. CONCLUSION
This paper has presented the mathematical methods used bythe EV aggregator software developed in the EDISON project.
It has been demonstrated how a set of driving data fromcombustion engine vehicles in the Copenhagen area has beenused by a model to predict nightly stopovers. All of thepredicted stopover intervals lie in the 95% probability region(see figure 6). Considering the lower bound of the predictioninterval yields that 6.7% could lie outside the 95% probabilityregion (figure 7).
The prediction model is used by a suggested optimizationmodel as to minimize charging costs based on hourly spot mar-ket energy prices. It has been illustrated how the predictabilityof the data, measured on the standard deviation, will influencethe result of the objective function (figure 8).
Various additional parameters and constraints relating to thegrid, the EV owner and the EV battery have been discussedfor the sake of completeness, and it has been indicated howsome of these considerations can be added to the optimizationmodel.
Finally, ideas regarding further developments have beenmentioned. This includes adding revenue from acting on ancil-lary service markets to the savings earned by smart charging.
Figure 9 shows a screenshot from the aggregator softwareinterface. The screenshot includes three graphs that shows acharging schedule (bottom), the energy prices (middle) andthe predicted vs. measured availability (top) over a 24 hourperiod for a single simulated EV.
Fig. 9. Screenshot/EDISON EV aggregator.
REFERENCES
[1] A. Pecas Lopes, Soares, F.J., Rocha Almeida, P.M., Identifying Man-agement Procedures to Deal with Connection of Electric Vehicles in theGrid, presented at the Bucharest Power Tech Conference, IEEE 2009,Bucharest, Romania, 2009.
[2] K. Clement, Haesen, E., Driesen, J., Coordinated Charging of MultiplePlug In Hybrid Electric Vehicles in Residential Distribution Grids,presented at the Power Systems Conference and Exposition, 2009. PSCE’09. IEEE/PES Seattle, WA, USA, 2009.
[3] M. Arindam, Kyung, S.K., Taylor, J. , Giumento, A., Grid Impacts ofPlug-In Electric Vehicles on Hydro Quebec’s Distribution System, inTransmission and Distribution Conference and Exposition, 2010 IEEEPES New Orleans, USA, 2010.
[4] J. Taylor, Maitra, M., Alexander, D., Duvall, M, Evaluation of the Impactof Plug-In Electric Vehicle Loading on Distribution System Operations,presented at the Power & Energy Society General Meeting, 2009. PES’09. IEEE Calgary, AB, Canada, 2009.
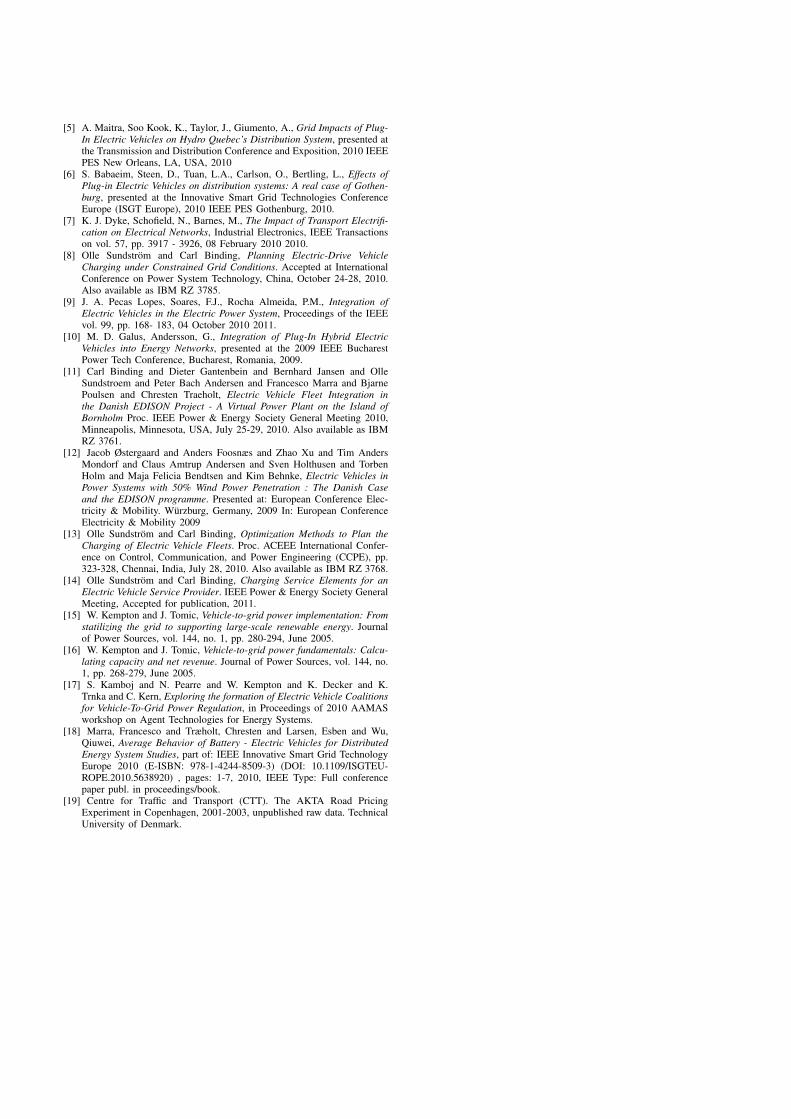
[5] A. Maitra, Soo Kook, K., Taylor, J., Giumento, A., Grid Impacts of Plug-In Electric Vehicles on Hydro Quebec’s Distribution System, presented atthe Transmission and Distribution Conference and Exposition, 2010 IEEEPES New Orleans, LA, USA, 2010
[6] S. Babaeim, Steen, D., Tuan, L.A., Carlson, O., Bertling, L., Effects ofPlug-in Electric Vehicles on distribution systems: A real case of Gothen-burg, presented at the Innovative Smart Grid Technologies ConferenceEurope (ISGT Europe), 2010 IEEE PES Gothenburg, 2010.
[7] K. J. Dyke, Schofield, N., Barnes, M., The Impact of Transport Electrifi-cation on Electrical Networks, Industrial Electronics, IEEE Transactionson vol. 57, pp. 3917 - 3926, 08 February 2010 2010.
[8] Olle Sundstrom and Carl Binding, Planning Electric-Drive VehicleCharging under Constrained Grid Conditions. Accepted at InternationalConference on Power System Technology, China, October 24-28, 2010.Also available as IBM RZ 3785.
[9] J. A. Pecas Lopes, Soares, F.J., Rocha Almeida, P.M., Integration ofElectric Vehicles in the Electric Power System, Proceedings of the IEEEvol. 99, pp. 168- 183, 04 October 2010 2011.
[10] M. D. Galus, Andersson, G., Integration of Plug-In Hybrid ElectricVehicles into Energy Networks, presented at the 2009 IEEE BucharestPower Tech Conference, Bucharest, Romania, 2009.
[11] Carl Binding and Dieter Gantenbein and Bernhard Jansen and OlleSundstroem and Peter Bach Andersen and Francesco Marra and BjarnePoulsen and Chresten Traeholt, Electric Vehicle Fleet Integration inthe Danish EDISON Project - A Virtual Power Plant on the Island ofBornholm Proc. IEEE Power & Energy Society General Meeting 2010,Minneapolis, Minnesota, USA, July 25-29, 2010. Also available as IBMRZ 3761.
[12] Jacob Østergaard and Anders Foosnæs and Zhao Xu and Tim AndersMondorf and Claus Amtrup Andersen and Sven Holthusen and TorbenHolm and Maja Felicia Bendtsen and Kim Behnke, Electric Vehicles inPower Systems with 50% Wind Power Penetration : The Danish Caseand the EDISON programme. Presented at: European Conference Elec-tricity & Mobility. Wurzburg, Germany, 2009 In: European ConferenceElectricity & Mobility 2009
[13] Olle Sundstrom and Carl Binding, Optimization Methods to Plan theCharging of Electric Vehicle Fleets. Proc. ACEEE International Confer-ence on Control, Communication, and Power Engineering (CCPE), pp.323-328, Chennai, India, July 28, 2010. Also available as IBM RZ 3768.
[14] Olle Sundstrom and Carl Binding, Charging Service Elements for anElectric Vehicle Service Provider. IEEE Power & Energy Society GeneralMeeting, Accepted for publication, 2011.
[15] W. Kempton and J. Tomic, Vehicle-to-grid power implementation: Fromstatilizing the grid to supporting large-scale renewable energy. Journalof Power Sources, vol. 144, no. 1, pp. 280-294, June 2005.
[16] W. Kempton and J. Tomic, Vehicle-to-grid power fundamentals: Calcu-lating capacity and net revenue. Journal of Power Sources, vol. 144, no.1, pp. 268-279, June 2005.
[17] S. Kamboj and N. Pearre and W. Kempton and K. Decker and K.Trnka and C. Kern, Exploring the formation of Electric Vehicle Coalitionsfor Vehicle-To-Grid Power Regulation, in Proceedings of 2010 AAMASworkshop on Agent Technologies for Energy Systems.
[18] Marra, Francesco and Træholt, Chresten and Larsen, Esben and Wu,Qiuwei, Average Behavior of Battery - Electric Vehicles for DistributedEnergy System Studies, part of: IEEE Innovative Smart Grid TechnologyEurope 2010 (E-ISBN: 978-1-4244-8509-3) (DOI: 10.1109/ISGTEU-ROPE.2010.5638920) , pages: 1-7, 2010, IEEE Type: Full conferencepaper publ. in proceedings/book.
[19] Centre for Traffic and Transport (CTT). The AKTA Road PricingExperiment in Copenhagen, 2001-2003, unpublished raw data. TechnicalUniversity of Denmark.

9. CORE PUBLICATIONS
F Facilitating a Generic Communication Interface to Dis-
tributed Energy Resources - Mapping IEC 61850 to
RESTful Services
This paper was published in the Proceedings of the First IEEE International Conference
on Smart Grid Communications (SmartGridComm), 2010, Gaithersburg, MD, USA.
160

Abstract—As the power system evolves into a smarter and
more flexible state, so must the communication technologies that
support it. A key requirement for facilitating the distributed
production of future grids is that communication and
information are standardized to ensure interoperability. The IEC
61850 standard, which was originally aimed at substation
automation, has been expanded to cover the monitoring and
control of Distributed Energy Resources (DERs). By having a
consistent and well-defined data model the standard enables a
DER aggregator, such as a Virtual Power Plant (VPP), in
communicating with a broad array of DERs. If the data model of
IEC 61850 is combined with a set of contemporary web protocols,
it can result in a major shift in how DERs can be accessed and
coordinated. This paper describes how IEC 61850 can benefit
from the REpresentational State Transfer (REST) service
concept and how a server using these technologies can be used to
interface with DERs as diverse as Electric Vehicles (EVs) and
micro Combined Heat and Power (µCHP) units.
I. INTRODUCTION
everal standards are currently under development that can
facilitate communication with DERs in a smart grid
constellation. Among these are OpenARD [1], OpenAMD
[2] and EMIX [3] as well as the IEC 61850 standard, on which
this paper will focus. The standard is thoroughly researched
and has been described in several papers [4] [5]. The standard
offers a structural decomposition of the units to which it
communicates. This means that each subcomponent of a DER
can be described by the information model of IEC 61850. This
makes the standard suitable for scenarios in which an
aggregator needs a fine-grained knowledge and control of the
state, structure and operation of a DER. The standard is a good
match for the virtual power plant concept, in which an
intermediate entity represents an aggregated group of DERs in
the power system and on the market. Apart from the syntactic
level, the standard also defines the protocols that carry the data
over a network. Without providing any recommendations on
the medium used, the standard proposes the use of the TCP/IP
protocols to enable internet communication. On the upper part
of the ISO OSI stack, the standard describes the use of the
Manufacturing Message Specification (MMS) standard as an
application-level protocol [6]. Replacing MMS with REST
services will, however, have certain advantages. A REST
service is a special flavor of web services which are connected
to the concept of a Service Oriented Architecture (SOA). As
REST services represent both a simple and well- documented
concept for achieving a high degree of interoperability, they
are a good candidate for use in the IEC 61850 protocol stack.
The next chapter describes IEC 61850 and REST in greater
detail. Then, the paper describes how an IEC 61850 server
was developed based on the above technologies, and finally a
case is defined for interfacing with a µCHP unit and an
electric vehicle. The IEC 61850 via REST implementation
suggested in this paper is used in the Danish EDISON project
[7], where a VPP-like aggregator should coordinate the
charging of electric vehicles, as well as in the Danish Generic
Virtual Power Plant project, where µCHPs are coordinated to
support the grid.
II. THE IEC 61850 STANDARD
The IEC-61850 standard was designed to enable
interoperability between different devices in the substation
environment, and to facilitate the adaptation of future
networking technologies. One of the cornerstones of the
standard is a layered data model (see Figure 1), which has
been designed to closely model the physical substation
environment.
A. Data model
The logical device is a virtual representation of a physical
device within the substation. It is comprised of a name, a path
to the object itself and a list of logical nodes. A logical device
contains one or more logical nodes, which represent various
components in the physical device.
As an example, the setup tested contains a logical node
called MMXN1. The MMXN part of the name refers to the type
of the node, which in this case is “Non-phase-related
measurements” [8]. Apart from the name, the MMXN class
must also contain all the data classes defined by the Logical
Node Class defined by the standard [8]. Beside this, instances
of the MMXN class can include a list of optional data classes
and attributes. The data classes represent meaningful
information inside the nodes and are declared recursively.
Facilitating a Generic Communication
Interface to Distributed Energy Resources Mapping IEC 61850 to RESTful Services
Anders Bro Pedersen Research Assistant
Technical University of Denmark
Einar Bragi Hauksson Research Assistant
Technical University of Denmark
Peter Bach Andersen PhD Student
Technical University of Denmark
Bjarne Poulsen Associate Professor
Technical University of Denmark
Chresten Træholt Associate Professor
Technical University of Denmark
Dieter Gantenbein Research Staff Member IBM Research, Zurich
S

Figure 1 – IEC 61850 data model hierarchy [9]
An attribute can either be a simple type, such as FLOAT32,
INT24 or BOOLEAN, or it can consist of both other simple
and complex attributes.
B. Data-Sets
The logical nodes can contain data-sets, which contain sets of
data that have a natural association [10]. Data-sets are
primarily used for reporting and logging [10], but can also be
requested directly. Included in the data-sets are properties
stating when a report/log should be triggered. An example of a
triggering condition is “Data Change”.
C. Logging and reporting
The IEC 61850 outlines a reporting mechanism, which is
essentially a payload-carrying event that is sent back to the
subscribing clients when triggered. Reporting is directly
linked to data-sets as it is the data attributes in the data-sets
that specify the trigger conditions. Closely related to reporting
is logging. They both rely on the data-sets for triggering, but
the reports are sent back to the clients, whereas the logs are
persisted locally [10].
D. Object references
Any object within the data model can be referred to directly
via its object path [10]. Because of the tree-like properties of
the model, this path resembles a fully-qualified file-name
notation. The path lists all the objects on the route from the
root of the model to the object in question. Where fully-
qualified file-name notation usually has a fixed delimiter
between object names, the IEC-61850 references use a slash to
separate the logical device from the rest of the path, which is
then separated by periods.
Figure 2 – Illustration of an IEC 61850 reference [9]
Included in the object reference is a filtering mechanism
called functional constraints (FC), which is used to group the
data-attributes. The functional constraints are usually specified
at the end of an object reference, incased in square brackets.
For the DC example, this would result in the path:
CHP1/MMXN1.Watt.mag.f[DC]
Because the paths resemble a fully-qualified file-name
notation, they can easily be mapped to a URL, which makes
the data model near perfect for REST. As the physical device
and the server are not referred in the object path, a REST URL
could look something like:
http://hostname/device/node/class/attribute
Included in IEC 61850 is also a service specification called
the Abstract Communication Service Interface (ACSI) [11],
which outlines a set of methods that are used when
communicating with the system. These methods have been
mapped to REST.
III. REST SERVICES
The REST architectural style was first described in 2000 in
a Ph.D. dissertation by Roy Fielding [12]. The industry did,
however, not embrace REST right away, probably because at
about the same time, the Single Object Access Protocol
(SOAP) [13] was embraced by most of the large software
vendors and therefore got a lot of attention. As time passed
and SOAP grew, adding numerous extensions, people started
looking for a lighter, more web-centric alternative. Today
many big web companies provide REST services for others to
interact with their systems. These include companies such as
Amazon, Google, Yahoo and Facebook.
Where SOAP comes complete with a seemingly ever-
growing suite of extensions, the primary aim of REST is to
stick closer to the basic functionality of the HTTP protocol on
which the web is based. Unlike SOAP, there is no standard
available that describes REST. Instead, developers should
follow the REST principles when creating a RESTful [14]
service.
The most important REST principle is to expose the
resources in a RESTful service as unique URLs. An example
of this might be a library service where the whole book
catalog could be accessed by using the URL
http://library.com/books/ whereas a single book could be
accessed using the URL http://library.com/books/123 (where
Substation(physical device)
Server
Logical Device
Logical Node
Data Object
Common Data Classes
Common Attributes
Standard Data Types
1
n
1
n
1
n
1
n
1
n
1
n
1
n
n..1
1..n
Lo
gic
al m
od
el
CHP1 MMXN1 Watt mag f
Logical device
Logical node
Data class
Data attribute
Data attribute

123 is the ID of the book). As opposed to SOAP services,
where you would issue a method call such as createBook,
deleteBook, RESTful services utilize the HTTP methods,
GET, POST, PUT and DELETE for reading, creating,
updating and deleting resources, respectively.
The REST principles do not define any specific format for
request or response data. Most common, however, is the XML
format, but other formats such as JavaScript Object Notation
(JSON) [15] are becoming increasingly popular, especially in
Asynchronous JavaScript And XML (AJAX) services. Ideally
the client is able to ask for specific representation by setting
the Accept request header to the desired format name.
Like the HTTP protocol itself, RESTful services are
stateless, meaning that no state should be stored on the server
between requests from the client. Each request should
therefore contain all the information necessary to serve the
client. RESTful services also embrace other aspects of the
HTTP protocol, such as status codes, conditional get and
caching.
Status codes are sent along with any HTTP response and
indicate the type of the response. Examples of common status
codes are 200 (OK) for a successful request and 404 (NOT
FOUND) for a request for a non-existing resource. HTTP
defines status codes in the range 1xx to 5xx.
Conditional Get allows the client to ask the server whether
the requested resource has changed since it was last retrieved.
This is achieved either by sending the If-Modified-Since
header with its value set to the time of the last retrieval or by
sending the eTag header that came with the last response. If
the resource has not been modified the server only returns
status code 304 (NOT MODIFIED). This can be important for
performance, as unchanged data does not need to be re-sent.
Another closely related header is the cache header, sent
along with the response from the server. The cache header
allows the server to tell the client whether and for how long
the client should cache the response. This improves
performance as it saves the client from requesting the same
data again, if it is not expected to change. This is mainly used
for static resources, such as images on the web, but can also be
utilized in RESTful services.
The functionality of RESTful services is very closely
related to the functionality of the web, which has been
extremely successful over the last couple of decades. This is
mainly due to its scalability, interoperability and the fact that it
is simple and easy to understand. HTTP and the WWW are
used for a wide variety of tasks ranging from personal home
pages to secure internet-banking and e-commerce. HTTP
already has a built-in authentication mechanism but since
many, if not all of the tasks mentioned call for strict security,
several protocols have developed to add things like encryption
to HTTP. Among some of the more well-known ones are open
standards, such as the TSL/SSL [16] protocols. Because of
technologies like these and the needs from which they arose,
the idea of using REST for communication in electrical
systems, as is the case with the VPP and the distributed energy
resources, could surely be considered safe.
IV. RESTFUL INTERFACE FOR IEC 61850
As mentioned, the IEC 61850 reference paths resemble a
fully-qualified file-name notation or a URL. This simplifies
the task of creating a RESTful interface for the IEC 61850
data model. The idea is that the various objects in the data
model hierarchy can be thought of as resources, which can be
accessed by using the IEC 61850 object reference. As an
example the data attribute
CHP1/MMXN1.Watt.mag.f
belonging to logical device “CHP1”, logical node “MMXN1”
and so on would have the URL
CHP1/MMXN1/Watt/mag/f
and the entire “Watt” data object could be retrieved with the
URL CHP1/MMXN1/Watt. For getting data, as in the example
above, an HTTP GET request would be used. The server
would then respond with the requested data in XML format as
shown in Figure 3. For setting data, the same URL would be
used, but with the HTTP method POST instead of GET.
Figure 3 - REST communication overview.
The ACSI interface described in IEC 61850-7-2 enables
clients to inspect the data model, to read and write data, and to
access data-sets, logs and more. To do so, the client calls
methods such as GetDataValues and SetDataValues. These
methods resemble traditional methods in a programming
language with input arguments and return values. As described
above, the REST architecture guidelines define services as a
set of resources instead of methods as in the case of ACSI.
To make a resource-oriented interface for the IEC 61850
standard, a mapping from the ACSI methods to URL and
HTTP method-pairs has been defined. The mapping for the
data model of the IEC 61850 standard is shown in Table 1.
Mappings for data-sets, reporting, logging, setting-groups
and substitutions can be made in a similar manner. These
mappings are presented in full detail in [9].
The first column in Table 1 shows the URL template of a
resource, the second column shows the HTTP method used to
get or set the URL, and the third column shows the ACSI
services this resource replaces. The response from the GET
requests to the resources shown in Listing 1 can be modified
by using query string parameters. Three query string
parameters have been defined: expandLevel, fc and
includeValues.
The expandLevel parameter controls how big a portion of
the data model is retrieved. The default value of this parameter
is zero, which results in only the requested level of the data
ServerRequest
Clients
RE
ST
Inte
rfa
ce
VPP
Monitor
...
Response
CHP1/MMXN1/Watt/mag/f
XML
IEC
61
85
0
Se
rve
r

model being retrieved, as can be seen in Listing 1. Setting the
expandLevel parameter to a higher number or to the value
“all”, allows the client to retrieve bigger portions of the data-
model hierarchy, as seen in Listing 2. By retrieving the whole
data model, the client can easily inspect an entire logical
device and a single URL can therefore replace multiple ACSI
services.
The two remaining parameters accepted by the RESTful
service are fc and includeValues. The fc parameter is used for
filtering the data-model hierarchy to include only data
attributes with the specified functional constraint. The
includeValues parameter specifies whether the data values
should be included in the response in addition to the data
model.
TABLE 1 - ACSI TO REST MAPPING
Url Meth. ACSI equivalent
/ GET GetServerDirectory (GetAllDataValues)
(GetDataValues)
/[LD]/ GET GetLDDirectory
(GetAllDataValues)
(GetDataValues)
/[LD]/[LN] GET GetLNDirectory (GetAllDataValues)
(GetDataValues)
/[LD]/[LN]/[DO] GET GetDataDirectory
GetDataDefinition (GetAllDataValues)
(GetDataValues)
/[LD]/[LN]/[DO]/[DA] GET (GetAllDataValues)
(GetDataValues)
/[LD]/[LN]/[DO]/[DA] POST SetDataValues
As Figure 3 illustrates, the response format of the RESTful
service is in XML. Because of XMLs ability to model
arbitrary data structures it is possible to represent the
hierarchical IEC 61850 data model in a concise and readable
format.
To show this, two URLs and their resulting output are
given. Listing 1 shows a response containing a single value;
Listing 2 is an example of what a larger view of the data
model might look like.
1. <DA Name="f" Type="FLOAT32"
Ref="EV1/ZCEV1/MaxRtDchPwr/setMag/f">16800</DA>
Listing 1 - Response for URI: /EV1/ZCEV1/MaxRtDchPwr/setMag/f
As seen in Listing 2, a request for an entire data hierarchy
can be quite verbose and might not be suitable for frequent use
in a production environment. This kind of request is, however,
very useful during the configuration and development phase
when new devices need to be discovered. As the RESTful
interface uses standard HTTP GET request, it is even possible
to use a web browser to discover an IEC-61850-enabled
device. As with ACSI methods such as GetServerDirectory
and GetLDDirectory, the RESTful interface also enables
clients to programmically discover devices in a generic
manner.
1. <DO Name="MaxRtDchPwr" Type="ASG"
Ref="EV1/ZCEV1/MaxRtDchPwr">
2. <DA FC="SP" Name="setMag" Type="Struct"
Ref="EV1/ZCEV1/MaxRtDchPwr/setMag">
3. <DA Name="f" Type="FLOAT32"
Ref="EV1/ZCEV1/MaxRtDchPwr/setMag/f">16800</DA>
4. </DA>
5. <DA FC="CF" Name="units" Type="Struct"
Ref="EV1/ZCEV1/MaxRtDchPwr/units">
6. <DA Name="SIUnit" Type="Enum"
Ref="EV1/ZCEV1/MaxRtDchPwr/units/SIUnit">Watt</DA>
7. <DA Name="multiplier" Type="Enum"
Ref="EV1/ZCEV1.MaxRtDchPwr/units/multiplier">Item</DA>
8. </DA>
9. <DA FC="DC" Name="dU" Type="Unicode255"
Ref="EV1/ZCEV1/MaxRtDchPwr/dU">Maximum rated discharging
power</DA>
10. </DO>
Listing 2 - Response for URI: /EV1/ZCEV1/MaxRtDchPwr/?expandLevel=all
Although XML has been chosen as the output format in the
example above, the RESTful interface could just as well use
other output formats. Thanks to the Accept header discussed
above, the same RESTful service could both accept and output
XML and JSON. One argument for using the JSON format is
that it is designed for serializing common objects, lists and
scalar values found in virtually all programming languages
and can therefore easily be deserialized by those languages.
And without the verbose declarations, it is definitely more
compact. JSON libraries exist for all major programming
languages/frameworks, including Java, .Net, C++, Python etc
[17].
As discussed in Section II, the IEC 61850 standard defines a
reporting mechanism. Because of the connection-less nature of
HTTP, and thereby of REST, implementing reporting
callbacks to the client is not entirely straightforward.
However, such mechanisms exist, for example the WebHooks
model [18] proposed by Jeff Lindsay, NASA Ames Research
Center. The approach is to have the IEC 61850 server enable
clients to subscribe to reporting events, similar to the approach
described in IEC 61400-25-3[19], and pass along with that
subscription request a callback URL which the IEC server can
use for sending reports to the client as HTTP POST requests.
Security must be kept in mind using this approach, because the
client must be able to validate that the callbacks received do
indeed come from the server. This could be solved using
HTTP-basic authentication or X.509 client certificates [20].
V. CASE STUDIES
To test the usefulness of REST for mapping to the IEC
61850 standard, a server complying with both of these has
been implemented. The server was designed “from scratch” to
support multiple devices and to test the scalability of the
REST implementation. The server has been written entirely in
C# for the .NET framework.
To facilitate the deployment to embedded devices and add
support for non-Windows systems, a small open-source in-
process web server was chosen to host the REST interface.
Except for the logging and reporting mechanisms, which run
in the background, the server waits for requests from potential
clients. When a request is received for a given URL, the server

looks up the requested object in its internal representation of
the data model. If the request is a “write” the server will
simply return a status code as confirmation. In the case of a
“read”, however, the requested object is serialized to XML
and returned to the client. One of the benefits of this approach
is that it is relatively simple to return not just the requested
object but the entire sub-model. In fact, if a request is received
for the logical device the server is able to return the entire data
model, including all the values, using a single response.
The goal of these case studies is to test the REST mapping
against different DERs, namely,
to describe the µCHP setup and briefly show how the
communication has been mapped
to touch upon the challenges of mapping the electric
vehicles and what was needed to accomplish this.
A. Case study: Interfacing with a µCHP
The server was designed using a modular plug-in architecture
with a generic interface, which enables easier adaptation and
installation of virtually any type of device.
Among the IEC-61850-enabled devices is a pair of Dachs
µCHP units from Senertec. The Dachs accepts a series of
different commands over the RS232 line and each of these
commands returns a different set of values. These values
include electrical and temperature measurements. When a
complex REST request is received, i.e., more than one data
attribute is requested, the IEC 61850 server requests each
required value from the Dachs module. The Dachs module
then locates the requested value in the set of values returned
by each of its commands. As the values are requested from the
Dachs module one at a time, the module caches the result of
each command for a fraction of a second to avoid having to
issue a command multiple times for each REST request.
Figure 4 - µCHP module RS232 communication.
Two client applications were developed to demonstrate the
system and to facilitate testing. One of these demo
applications is a web client showing the various devices
attached to the server, as well as all the measurements and
controls available. A screenshot from the client showing one
of the µCHPs can be seen in Figure 5.
Figure 5 - Screenshot of the web client.
B. Case study: Interfacing with an EV
Another example of a plug-in made for the server is for an
EV charging-spot. As no real vehicles were available at the
time of development, the plug-in was mapped to an EV
simulation instead, which further illustrates the versatility of
the system. The simulation includes both a charging-spot and
an EV, which contains a simulated battery. When the EV is
plugged into the charging spot an EV aggregator-server can
tell the charging spot to control the charging using schedules
sent via the IEC 61850 REST interface. Such an EV
aggregator-server is used in the EDISON project [21].
Figure 6 - Setup showing simulated EV and charging-spot.
The charging spot therefore acts as a proxy for the EV. This
is in accordance to [9] and [21] and means that the EV does
not need a wireless connection for being utilized by the
aggregator server. Because of this, even though the charging
spot and the vehicle are simulated as individual entities, they
are mapped with the charging spot as the logical device and
the currently connected EV represented as a logical node. The
aggregator server, or any other client, can read various values
from the charging-spot and the EV via the IEC 61850
interface, such as the current power usage, the phases in use
and the current state of charge.
Command
Result Set
Server Device
µCHP
Da
ch
s P
lug
-in
RS232
RS232
IEC
61
85
0
Se
rve
r
Server
Sim
ula
tio
n
Plu
g-in
IEC
61
85
0S
erv
er
Simulated Charging-spot and EV

There is an addition to the IEC 61850 standard, the IEC
61850-7-420 [22], that deals specifically with DERs. After
having analyzed the requirements for the charging spot and
EV, it became apparent that this standard needed further
extension. Logical nodes for charging-spots (ZCHS) and for
EVs (ZCEV) have been defined. These nodes contain essential
attributes such as the state-of-charge of the EV, power limits
and battery capacity. For controlling charging and discharging
of the EV, the logical nodes for energy schedule, defined in
[22], have been utilized. Since these extensions are outside the
scope of this paper and subject for a later publication they will
not be further described here.
Figure 7 - Demo showing the current state of an EV.
Together with the EV simulation, a small graphical client
was developed to show the current state of the EV and the
charging spot. This application, which is shown in Figure 7,
displays a small car that moves between the road and the
buildings, representing one of the three possible states “in
use”, “idle” and “plugged-in”.
C. Case study conclusion
Although µCHPs and EVs differ significantly in both function
and composition, the cases presented in this section show how
IEC 61850 with the REST interface can support
communication with both types of DERs. The units can be
monitored and controlled to optimize their behavior in relation
to energy prices, user requirements and the state of the power
system.
VI. CONCLUSION
The main aim of this paper has been to demonstrate how
RESTful services, in conjunction with the data model of IEC
61850, can be used to increase interoperability and simplicity
in DER communication. The IEC 61850 standard has a large
and well-defined set of logical notes describing the various
components and values of a DER unit. This paper has shown
that the object reference path of the IEC 61850 data model can
easily be mapped to the URL format in the resource-oriented
approach used by REST. Besides offering an intuitive way of
accessing information, REST also provides better
interoperability and simplicity by shedding much of the
complexity present in SOAP-based web services. The
advantages of using IEC 61850 with REST have been
demonstrated by building an IEC 61850 server and describing
its functionality in two case studies.
There is no doubt that the ambition of actively integrating
DERs into a smart grid constellation will rely on the
utilization of contemporary web concepts and standards. This
paper serves as an input to the identification of the ICTs
capable of satisfying the communication requirements for the
power system of the future.
REFERENCES
[1] OPENADR - Outreach Collaborative homepage.
http://www.openadrcollaborative.org/
[2] OPENAMD – standard sponsor. UCA International Users Group.
http://www.ucaiug.org/
[3] EMIX – standard sponsor. OASIS Blue Initiative. http://www.oasis-blue.org/
[4] "Communication networks and systems in substations," Commission
Electrotechnique Internationale (IEC), vol. 1, July 2003.
[5] S. Heights, R. Mackiewicz, "Technical overview and benefits of the IEC
61850," Oct. 2006.
[6] "Manufacturing Message Specification (MMS)", Partl:Service Definition, Part2: Protocol Specification,International Standard IS0 9506, 1989.
[7] Edison project homepage. http://www.edison-net.dk/
[8] "IEC 61850-7-4, Basic communication structure - Compatible logical node
classes and data object classes".
http://webstore.iec.ch/Webstore/webstore.nsf/ArtNum_PK/38211
[9] E. B. Hauksson, A. B. Pedersen, "Enabling distributed energy resources in
a virtual power plant using IEC-61850," Department of Informatics and
Mathematical Modeling at the Technical University of Denmark, Master Thesis 2010.
[10] "IEC 61850-7-1, Basic communication structure for substation and feeder
equipment Principles and models". http://webstore.iec.ch/Webstore/webstore.nsf/ArtNum_PK/30928
[11] "IEC 61850-7-2, Basic communication structure for substation and feeder
equipment - Abstract communication service interface (ACSI),". http://webstore.iec.ch/webstore/webstore.nsf/Artnum_PK/30581
[12] R. T. Fielding, "Architectural Styles and the Design of Network-based
Software Architectures," PhD Thesis 2000. University of California, Irvine
[13] SOAP Specification. http://www.w3.org/TR/soap/
[14] IBM developerWorks, A. Rodriguez. RESTful Web services: The basics.
https://www.ibm.com/developerworks/webservices/library/ws-restful/
[15] The application/json Media Type for JavaScript Object Notation.
http://tools.ietf.org/html/rfc4627
[16] The Transport Layer Security (TLS) Protocol.
http://tools.ietf.org/html/rfc5246
[17] JSON. http://www.json.org/
[18] WebHooks. http://www.webhooks.org/
[19] "IEC 61400-25-3, Communications for monitoring and control of wind
power plants - Information exchange models".
[20] Internet X.509 Public Key Infrastructure: Certification Path Building. http://tools.ietf.org/html/rfc4158
[21] Carl Binding, Dieter Gantenbein, Bernhard Jansen, Olle Sundström,
Peter Bach Andersen, Francesco Marra, Bjarne Poulsen, and Chresten Træholt, "Electric Vehicle Fleet Integration in the Danish EDISON Project
- A Virtual Power Plant on the Island of Bornholm," IEEE Power &
Energy Society, 2010 General Meeting , July 25-29, 2010, Minneapolis, Minnesota, USA.
[22] "IEC 61850-7-420, Basic communication structure - Distributed energy
resources logical nodes". http://webstore.iec.ch/Webstore/webstore.nsf/Artnum_PK/42706

References
[1] IEEE smart grid website
. http://smartgrid.ieee.org/ieee-smart-grid. 2
[2] C. Kieny, B. Berseneff, N. Hadjsaid, Y. Besanger, and
J. Maire. On the concept and the interest of vir-
tual power plant: Some results from the European
project Fenix. In Proc. IEEE Power and Energy Society
General Meeting, 2009. 3, 59
[3] You Shi, Chresten Traeholt, and Bjarne Poulsen. A
market-based virtual power plant. In Proc. Inter-
national Conference on Clean Electrical Power (ICCEP),
2009. 3
[4] You Shi, Chresten Traeholt, and Bjarne Poulsen.
Generic virtual power plants: Management of dis-
tributed energy resources under liberalized elec-
tricity market. In Proc. 8th IET International Confer-
ence on Advances in Power System Control, Operation and
Management., 2009. 3, 59, 60
[5] Carl Binding, Dieter Gantenbein, Bernhard Jansen, Olle
Sundstroem, Peter Bach Andersen, Francesco Marra,
Bjarne Poulsen, and Chresten Traeholt. Electric ve-
hicles as a new power source for electric utilities.
In Proc. IEEE Power and Energy Society General Meeting
2010, 2010. 3
[6] Willett Kempton and Steven Letendre. Electric vehi-
cles as a new power source for electric utilities.
Trans. Res. D 2 (1997), 2(3):pp. 157–175, 1997. 4
[7] Burden of disease from environmental noise -
Quantification of healthy life years lost in Europe.
Technical report, World Health Organisation (WHO),
2011. Download from http://www.who.int. 6
[8] Luftforurening med partikler i Kbenhavn. Techni-
cal report, Danmarks Miljundersgelser (DMU), Aarhus
university, 2003. Download from http://dce.au.dk. 6
[9] Dansk elbil komite website
. http://www.danskelbilkomite.dk. 6
[10] Effektiv anvendelse af vindkraftbaseret el i Dan-
mark. Technical report, Energinet.dk, 2009. Download
from http://www.energinet.dk. 7
[11] Smart Grid i Danmark. Technical report, En-
erginet.dk and Danish Energi Association. Download
from http://www.energinet.dk. 7
[12] EDISON website
. http://www.edison-net.dk. 8
[13] E-Mobility Berlin project, RWE project
description
. https://www.rwe-mobility.com/web/cms/de/1158022/emobility/.
8
[14] VATTENFALL project description (in german)
. http://www.vattenfall.de/de/wirtschaftsverkehr.htm.
8
[15] MERGE project website
. http://www.ev-merge.eu/. 8
[16] University Of Delaware, V2G website
. http://www.udel.edu/V2G/. 8
[17] IEC website
. http://www.iec.ch/. 9
[18] CENELEC website
. http://www.cenelec.eu/. 9
[19] EcoGrid EU website
. http://www.eu-ecogrid.net/. 20
[20] Jasna Tomi and Willett Kempton. Using fleets of
electric-drive vehicles for grid support. Journal of
Power Sources, 168:459468, 2007. 21, 34
[21] Willett Kempton, Victor Udo, Ken Huber, Keven
Komara, Steve Letendre, Scott Baker, Doug Brun-
ner, and Nathaniel Pearre. A Test of Vehicle-
to-Grid (V2G) for Energy Storage and
Frequency Regulation in the PJM Sys-
tem. Test report, University Of Delaware, 2008.
http://www.udel.edu/V2G/ArticlesandPapers.html.
21, 25
[22] N. Rotering and M. Ilic. Optimal charge control
of plug-in hybrid electric vehicles in deregulated
electricity markets. IEEE Transactions on Power Sys-
tems, 2010. 21
[23] T. Kristoffersen, K. Capion, and P. Meibom. Optimal
charging of electric drive vehicles in a market en-
vironment. Applied Energy, page 19401948, 2010. 21
[24] Bjarke Heesche. Algoritmer til prisstyret opladning
af elbiler. Bachelor report, Technical University Of
Denmark, Department of Electrical Engineering, 2012.
http://www.dtu.dk/centre/cet/English/education/. 21
[25] Dieter Gantenbein. WP3 Aggregation - The Advan-
tage of Coordinated Consumption Planning. EDI-
SON project website: http://www.edison-net.dk/. Tech-
nical web article. 32
[26] Qiuwei Wu, Jakob Munch Jensen, Lars Henrik Hansen, An-
dreas Bjerre, Arne Hejde Nielsen, and Jacob stergaard.
EV portfolio management and grid impact study.
Project report, EDISON, 2012. http://www.edison-
net.dk/Dissemination/Reports/. 33
[27] Andr G. Madureira, Andreas F. Raab, Andrs Ramos, Evan-
gelos Karfopoulos, Fernando Bez Chicharro, Jess La-
torre, Jianzhong Wu, Kostas Tsatsakis, Kristin Dietrich,
Manolis Voumvoulakis, Marco A. M. Saran, Mauro Rosa,
Ricardo Ferreira, Jos Lus Meirinhos, Ivo Costa, Mixalis
Stamoulis, Mohsen Ferdowsi, and Yunfei Mu. Evalua-
tion of the impact that a progressive deployment
167
REFERENCES
of EV will provoke on electricity demand, steady
state operation, market issues, generation sched-
ules and on the volume of carbon emissions. Wp
3 task 3.2 part ii of deliverable d3.2, MERGE, 2012.
http://www.ev-merge.eu/. 33
[28] Nan Shao. The Impact of Integration of Distributed
Energy Resources in a Danish Low-Voltage Dis-
tribution Network. Master thesis, Technical Univer-
sity Of Denmark, Department of Electrical Engineering,
2012. 33
[29] Francesco Marra, Morten Mller Jensen, Rodrigo Garcia-
Valle, Chresten Trholt, and Esben Larsen. Power Qual-
ity Issues into a Danish Low-Voltage Grid with
Electric Vehicles. In Proc. 11th International Confer-
ence on Electrical Power Quality and Utilisation (ISBN:
978-1-4673-0379-8), 2012. 33
[30] Shengnan Shao, Manisa Pipattanasomporn, and Saifur
Rahman. Demand Response as a Load Shaping Tool
in an Intelligent Grid With Electric Vehicle. 2011
IEEE Transactions on Smart Grid, 2, Issue 4:624–631,
2011. 34
[31] Niamh O’Connell, Qiuwei Wu, Jacob stergaard,
Arne Hejde Nielsen, and Seung-Tae Cha. Electric
Vehicle (EV) Charging Management with Dy-
namic Distribution System Tariff. In Proc. 2011
IEEE PES Innovative Smart Grid Technologies, 2011.
34, 36
[32] Olle Sundstroem and Carl Binding. Flexible Charg-
ing Optimization for Electric Vehicles Consider-
ing Distribution Grid Constraints. In Proc. 2012
IEEE PES, Power Engineering Society General Meeting,
2012. 34, 82
[33] Thomas Christian Jensen, Ole Kveiborg, and An-
ders Fjendbo Jensen. Vil bilisterne koebe elbiler?
Trafik og Veje (ISSN: 1903-7384), 12:4243, 2011. 42
[34] Nathaniel S. Pearre, Willett Kempton, Randall L.
Guensler, and Vetri V. Elango. Electric vehicles:
How much range is required for a days driv-
ing? Transportation Research 2011, ELSEVIER, page
11711184, 2011. available at ScienceDirect. 43
[35] Qiuwei Wu, Arne Hejde Nielsen, Jacob stergaard, Seung-
Tae Cha, Francesco Marra, Yu Chen, and Chresten
Trholt. Driving Pattern Analysis for Electric Ve-
hicle (EV) Grid Integration Study. In Proc. 2010
IEEE Inovative Smart Grid Technology Europe, 2010. 44
[36] Olle Sundstroem, Olivier Corradi, and Carl Binding. To-
ward Electric Vehicle Trip Prediction for a Charg-
ing Service Provider. In Proc. 2012 Electric Vehicle
Conference (IEVC), IEEE International, 2012. 44
[37] R. Simmons, B. Browning, Y. Zhang, and V. Sadekar.
Learning to predict driver route and destination
intent. In Proc. 2006 IEEE Intelligent Transportation
Systems Conference, 2006. 44
[38] Peter Cocrona, Franziska Bhlera, Isabel Neumanna,
Thomas Frankea, Josef F. Kremsa, Maximilian Schwalmb,
and Andreas Keinathb. Methods of evaluating elec-
tric vehicles from a users perspective the MINI E
field trial in Berlin. IET Intelligent Transport Systems
(ISSN: 1903-7384), 5(2):127–133, 2011. 44
[39] Sachin Kamboj, Willett Kempton, and Keith S. Decker.
Deploying Power Grid-Integrated Electric Vehi-
cles as a Multi-Agent System. In Proc. Tenth In-
ternational Joint Conference on Autonomous Agents and
Multiagent Systems, 2011. 59, 61
[40] S.A. Klein. Security, cost, and operational bene-
fits of IEC-61850. In proc. 2008 IEEE Power and En-
ergy Society General Meeting - Conversion and Delivery
of Electrical Energy in the 21st Century. 68
[41] R.E. Mackiewicz. Overview of IEC 61850 and Bene-
fits. In Proc. IEEE PES 2006 Power Systems Conference
and Exposition, pages 623–630, 2006. 68
[42] T.S. Ustun, C. Ozansoy, and A. Zayegh. Modeling of
a Centralized Microgrid Protection System and
Distributed Energy Resources According to IEC
61850-7-420. IEEE 2012 Transactions on Power Sys-
tems, 27(3):1560–1567, 2012. 68
[43] N. Honeth, Wu Yiming, N. Etherden, and L. Nordstrom.
plication of the IEC 61850-7-420 data model on a
Hybrid Renewable Energy System. In Proc. IEEE
2011 Trondheim PowerTech. 68
[44] Jens Schmutzler, Sven Groening, and Christian Wietfeld.
Management of Distributed Energy Resources in
IEC 61850 using Web Services on Devices. In Proc.
2011 IEEE SmartGridComm, 2011. 68
[45] Stjepan Sui and Ante Martini. Utilizing SOA-ready
Devices for Virtual Power Plant Control in
Semantic-enabled Smart Grid. In Proc. 2011 IEEE
SmartGridComm, 2011. 69
[46] Joachim Skov Johansen. Electric Vehicle Communica-
tion Methods. Special project report, Technical Uni-
versity Of Denmark, Department of Electrical Engineer-
ing, 2012. Report available through CEE, DTU (contact
thesis author). 70
[47] E. B. Hauksso and A. B. Pedersen. Enabling distributed
energy resources in a virtual power plant using
IEC-61850. Master thesis, Department of Informatics
and Mathematical Modeling at the Technical University
of Denmark, 2010. 71, 72, 73
[48] Roy T. Fielding. Architectural Styles and the Design
of Network-based Software Architectures. Phd the-
sis, University of California, Irvine, 2000. 71
[49] Bernhard Jansen, Carl Binding, Olle Sundstroem, and Di-
eter Gantenbein. Architecture and Communication
of an Electric Vehicle Virtual Power Plant. In Proc.
2010 IEEE International Conference on Smart Grid Com-
munications,, 2010. 76
[50] Olle Sundstroem and Carl Binding. Optimization
methods to plan the charging of electric vehicle
fleets. In Proc. 2012 International Conference on Con-
trol, Communication and Power Engineering, 2010. 81
[51] Olle Sundstroem, Olivier Corradi, and Carl Binding.
Charging Service Elements for an Electric Vehi-
cle Service Provider. In Proc. 2011 IEEE Power and
Energy Society General Meeting,, 2011. 81
168

REFERENCES
[52] Olle Sundstroem and Carl Binding. Planning Electric-
Drive Vehicle Charging Under Constrained Grid
Conditions. In Proc. 2010 International Conference on
Power System Technology, 2010. 81
[53] J. Lopes, F. Soares, and P. Almeida. Identifying man-
agement procedures to deal with connection of
electric vehicles in the grid. In Proc. 2009 IEEE Pow-
erTech, 2010. 81
169

REFERENCES
www.cee.dtu.dkDepartment of Electrical EngineeringCentre for Electric Power and Energy (CEE)Technical University of DenmarkElektrovej 325DK-2800 Kgs. LyngbyDenmark
Tel: (+45) 45 25 35 00Fax: (+45) 45 88 61 11E-mail: [email protected]
170