Embed Size (px)
Citation preview

KEMENTERIAN PERENCANAAN PEMBANGUNAN NASIONAL/ BADAN PERENCANAAN PEMBANGUNAN NASIONAL
Keynote Speech
Integrating Population Dynamics into Urban Development Plans: Sustainable Cities, Human Mobility and International Migration
Deputy Minister for Population and Labor
Kementerian PPN/Bappenas
Tuesday, November 28th 2017
1
Outline
2
• Overview
• Challenges
• Policy responses
Overview: Urban Development
3
Urban Population Significantly Rose between 1971-2015
4
20.000 10.000 0 10.000 20.000
0-4
10-14
20-14
30-34
40-44
50-54
60-64
70-74
Thousand
Female Male
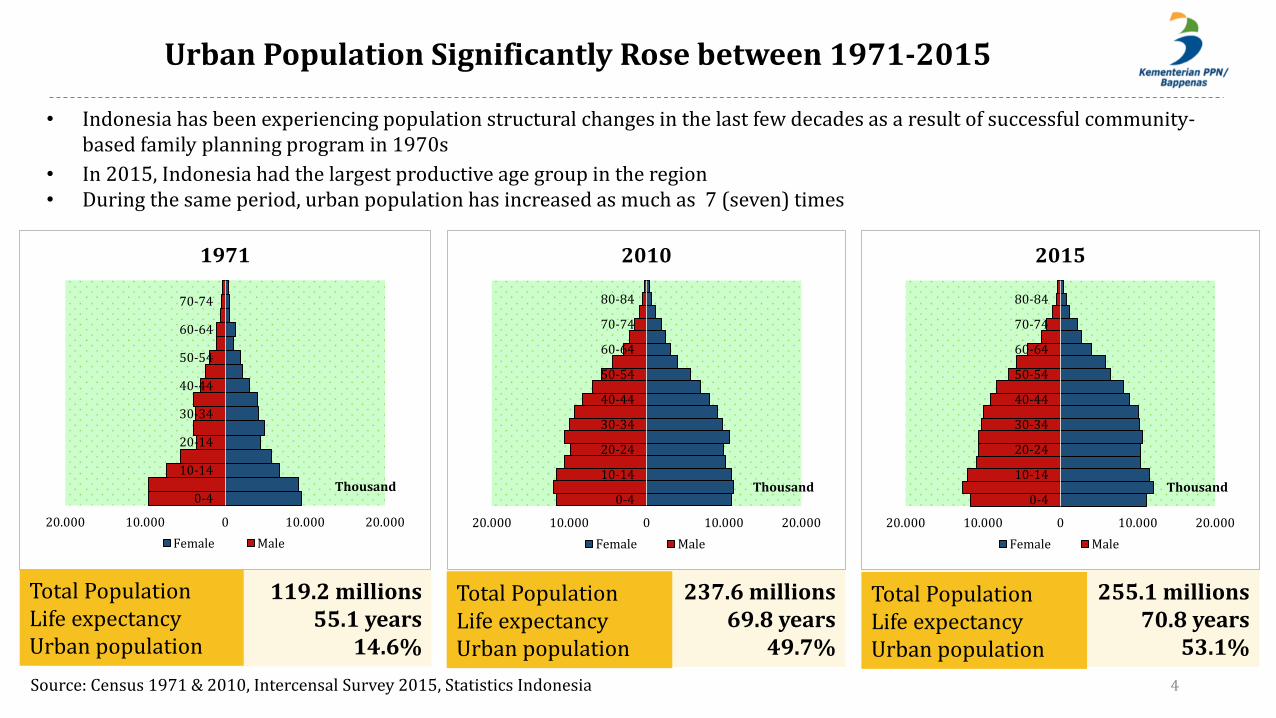
1971
119.2 millions 55.1 years
14.6%
Total Population Life expectancy Urban population
Source: Census 1971 & 2010, Intercensal Survey 2015, Statistics Indonesia
237.6 millions 69.8 years
49.7%
20.000 10.000 0 10.000 20.000
0-4
10-14
20-24
30-34
40-44
50-54
60-64
70-74
80-84
Thousand
Female Male
2010
Total Population Life expectancy Urban population
255.1 millions 70.8 years
53.1%
20.000 10.000 0 10.000 20.000
0-4
10-14
20-24
30-34
40-44
50-54
60-64
70-74
80-84
Thousand
Female Male
2015
Total Population Life expectancy Urban population
• Indonesia has been experiencing population structural changes in the last few decades as a result of successful community-based family planning program in 1970s
• In 2015, Indonesia had the largest productive age group in the region • During the same period, urban population has increased as much as 7 (seven) times
Unequal Distribution of Urban Population Among Regions
5
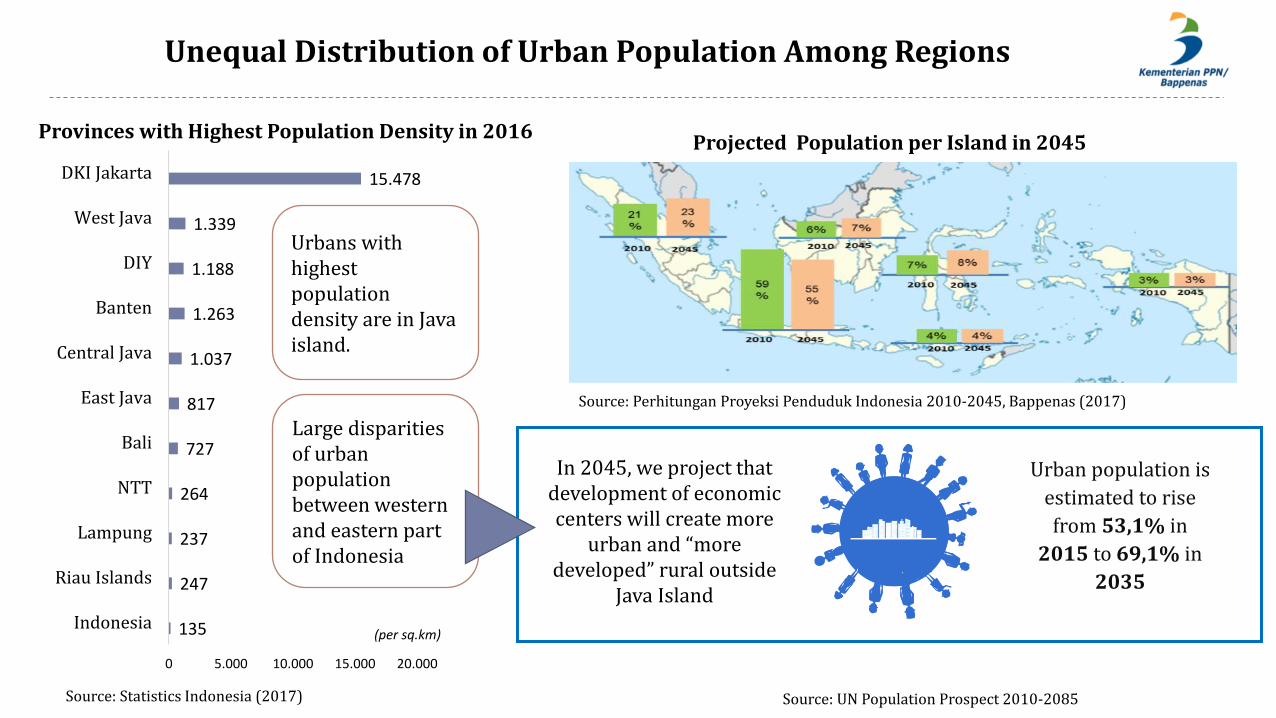
Urban population is
estimated to rise
from 53,1% in
2015 to 69,1% in
2035
In 2045, we project that development of economic centers will create more
urban and “more developed” rural outside
Java Island
135
247
237
264
727
817
1.037
1.263
1.188
1.339
15.478
0 5.000 10.000 15.000 20.000
Indonesia
Riau Islands
Lampung
NTT
Bali
East Java
Central Java
Banten
DIY
West Java
DKI Jakarta
Source: Statistics Indonesia (2017)
(per sq.km)
Urbans with highest population density are in Java island.
Projected Population per Island in 2045 Provinces with Highest Population Density in 2016
Source: UN Population Prospect 2010-2085
Source: Perhitungan Proyeksi Penduduk Indonesia 2010-2045, Bappenas (2017)
Large disparities of urban population between western and eastern part of Indonesia

Urban Agglomeration as an Engine of Economic Growth
6
0,67%
1,21%
2,18%
2,24%
3,08%
6,55%
16,20%
19,15%
Sarbagita
Mamminasata
Kedungsepur
Mebidangro
Bandung Raya
Gerbangkertosusilo
DKI Jakarta
Jabodetabek
Contribution of Metropolitan Areas to GDP in 2015
More than 90% of the richest Indonesians reside in Jabodetabek, controlling more than 50% of financial wealth
All metropolitan areas have contributed more than one third of National GDP in 2015
Almost half of the urban contribution to the National GDP comes from DKI Jakarta
Source: Boston Consulting Group (2017)
Challenges
7
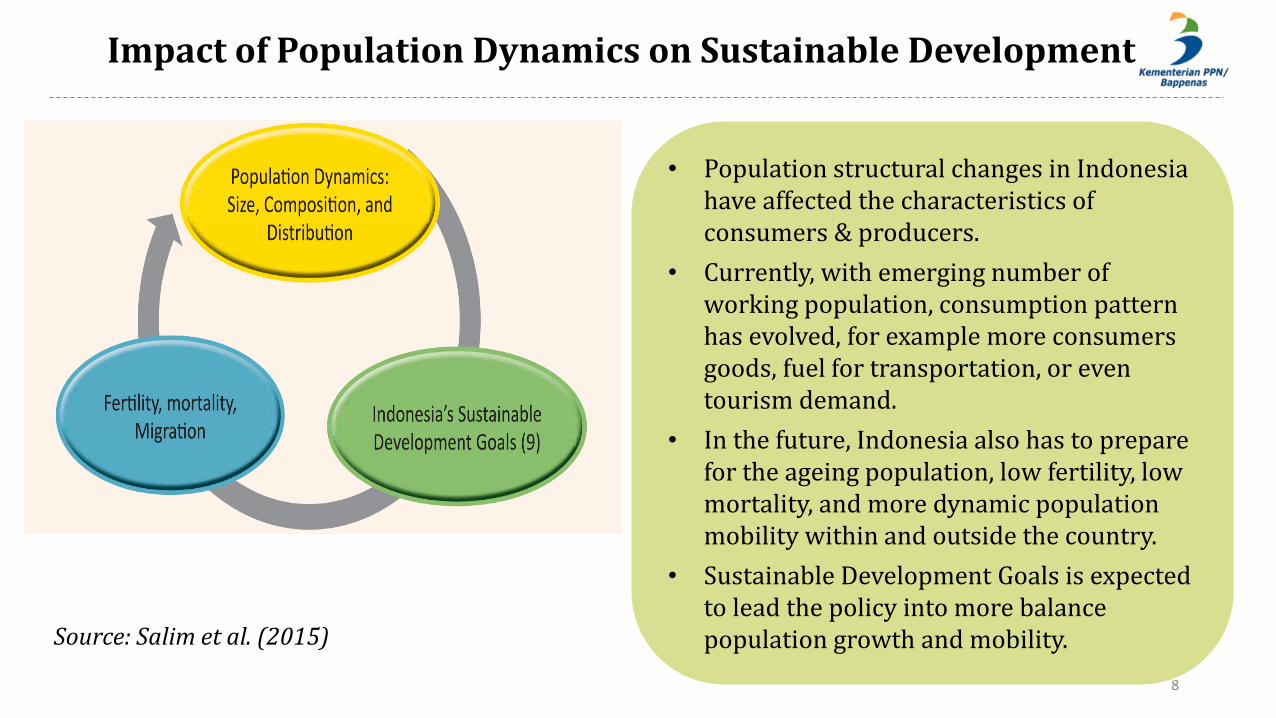
Impact of Population Dynamics on Sustainable Development
8
Source: Salim et al. (2015)
• Population structural changes in Indonesia have affected the characteristics of consumers & producers.
• Currently, with emerging number of working population, consumption pattern has evolved, for example more consumers goods, fuel for transportation, or even tourism demand.
• In the future, Indonesia also has to prepare for the ageing population, low fertility, low mortality, and more dynamic population mobility within and outside the country.
• Sustainable Development Goals is expected to lead the policy into more balance population growth and mobility.
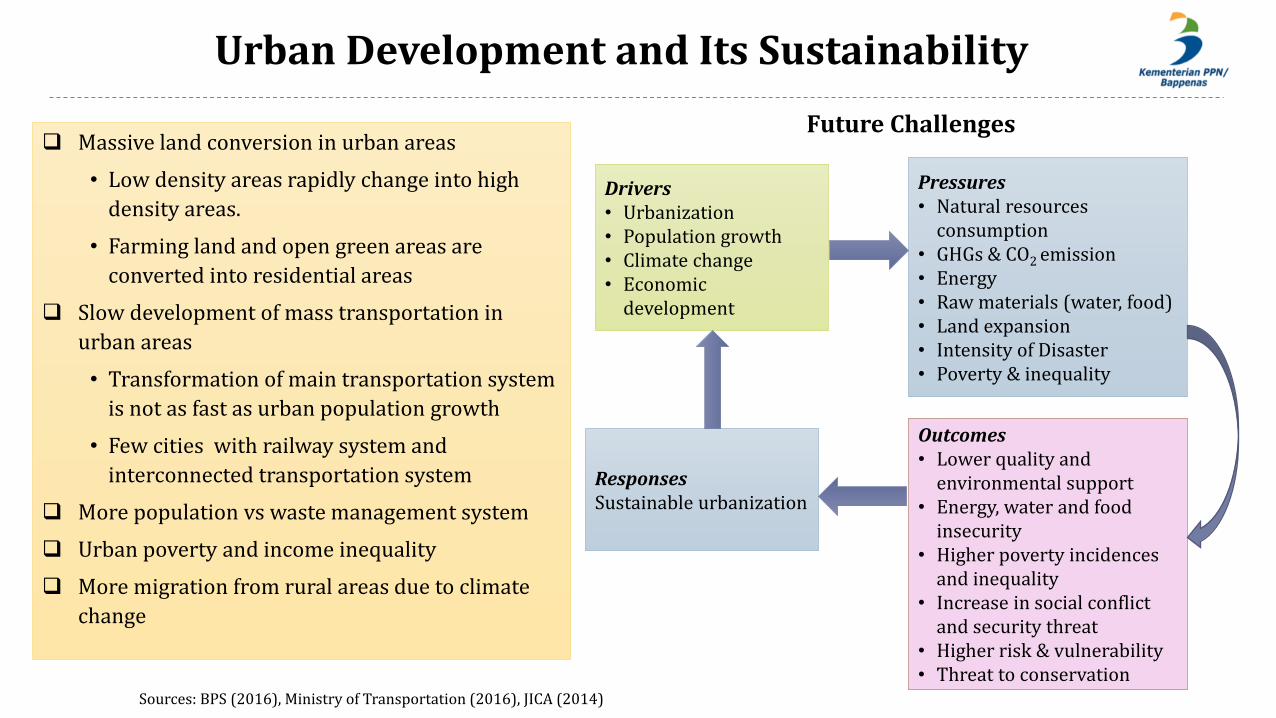
Urban Development and Its Sustainability
9 Sources: BPS (2016), Ministry of Transportation (2016), JICA (2014)
Massive land conversion in urban areas
• Low density areas rapidly change into high
density areas.
• Farming land and open green areas are
converted into residential areas
Slow development of mass transportation in
urban areas
• Transformation of main transportation system
is not as fast as urban population growth
• Few cities with railway system and
interconnected transportation system
More population vs waste management system
Urban poverty and income inequality
More migration from rural areas due to climate
change
Drivers • Urbanization • Population growth • Climate change • Economic
development
Pressures • Natural resources
consumption • GHGs & CO2 emission • Energy • Raw materials (water, food) • Land expansion • Intensity of Disaster • Poverty & inequality
Outcomes • Lower quality and
environmental support • Energy, water and food
insecurity • Higher poverty incidences
and inequality • Increase in social conflict
and security threat • Higher risk & vulnerability • Threat to conservation
Responses Sustainable urbanization
Future Challenges
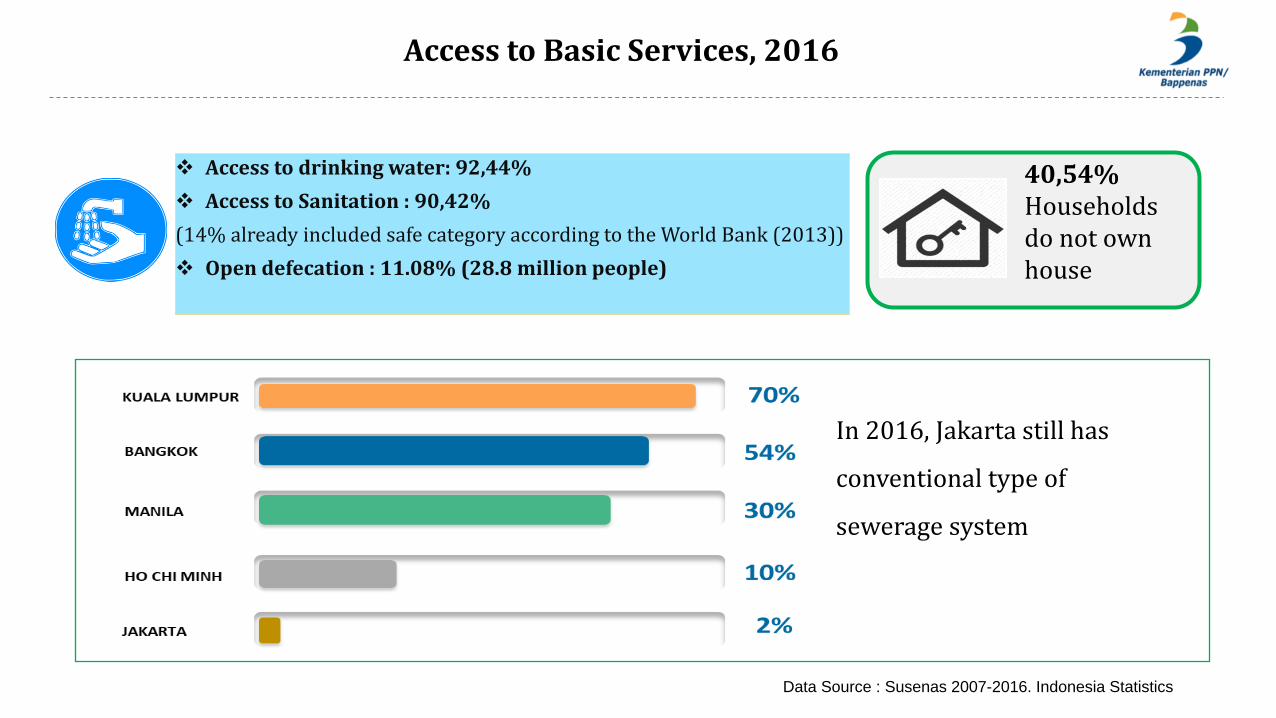
Access to Basic Services, 2016
10
Access to drinking water: 92,44%
Access to Sanitation : 90,42%
(14% already included safe category according to the World Bank (2013))
Open defecation : 11.08% (28.8 million people)
Data Source : Susenas 2007-2016. Indonesia Statistics
In 2016, Jakarta still has
conventional type of
sewerage system
40,54% Households do not own house
Policy Responses
11
12
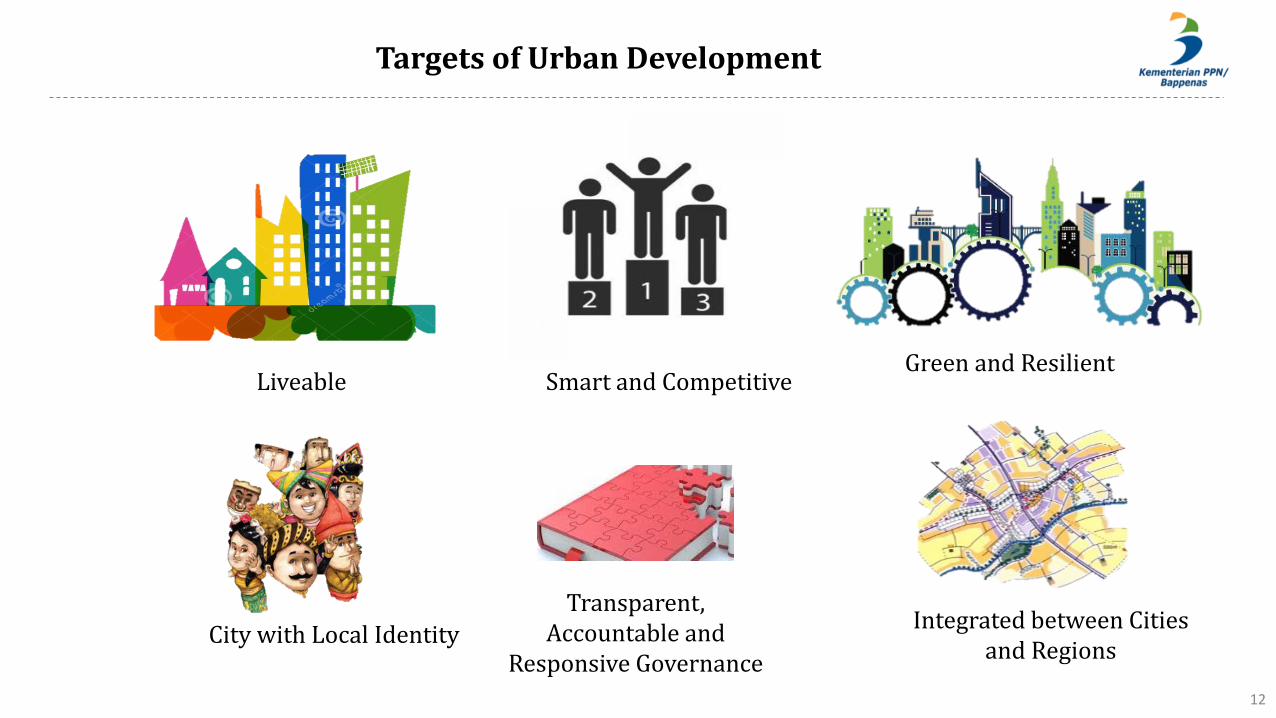
Liveable Smart and Competitive Green and Resilient
City with Local Identity Integrated between Cities
and Regions
Transparent, Accountable and
Responsive Governance
Targets of Urban Development
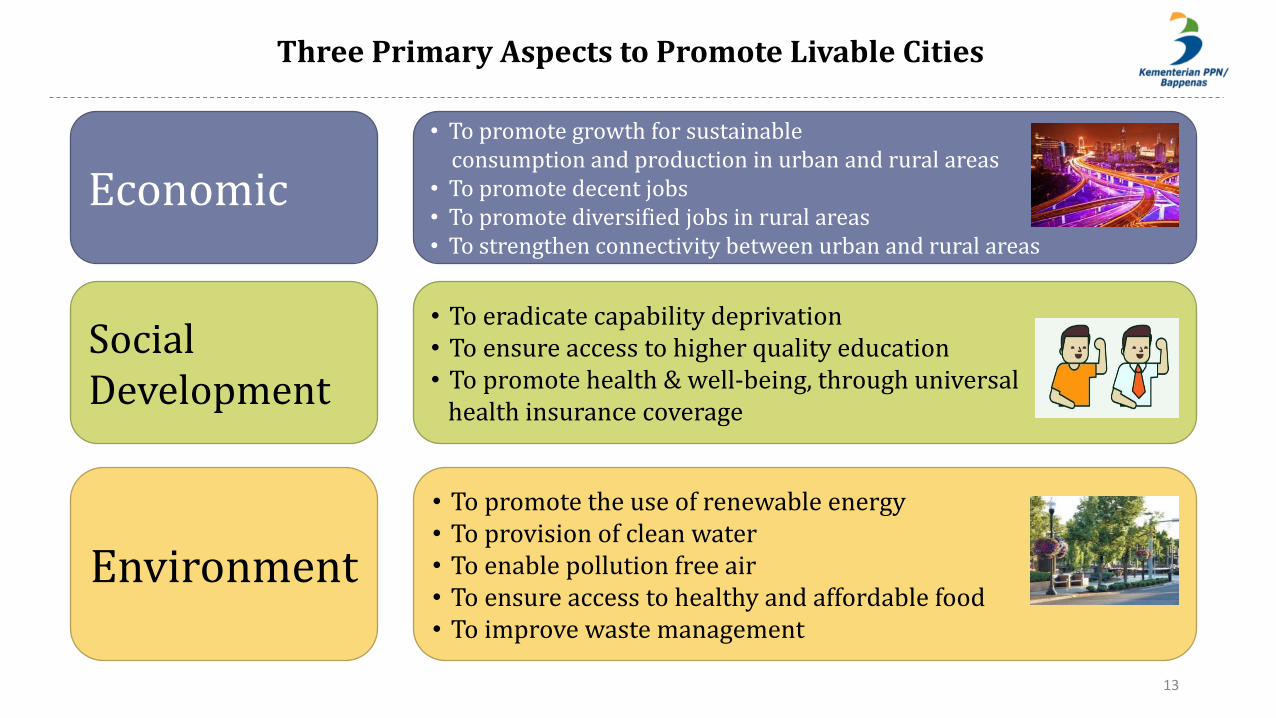
Three Primary Aspects to Promote Livable Cities
13
Economic
Social Development
Environment
• To promote growth for sustainable consumption and production in urban and rural areas • To promote decent jobs • To promote diversified jobs in rural areas • To strengthen connectivity between urban and rural areas
• To eradicate capability deprivation • To ensure access to higher quality education • To promote health & well-being, through universal health insurance coverage
• To promote the use of renewable energy • To provision of clean water • To enable pollution free air • To ensure access to healthy and affordable food • To improve waste management
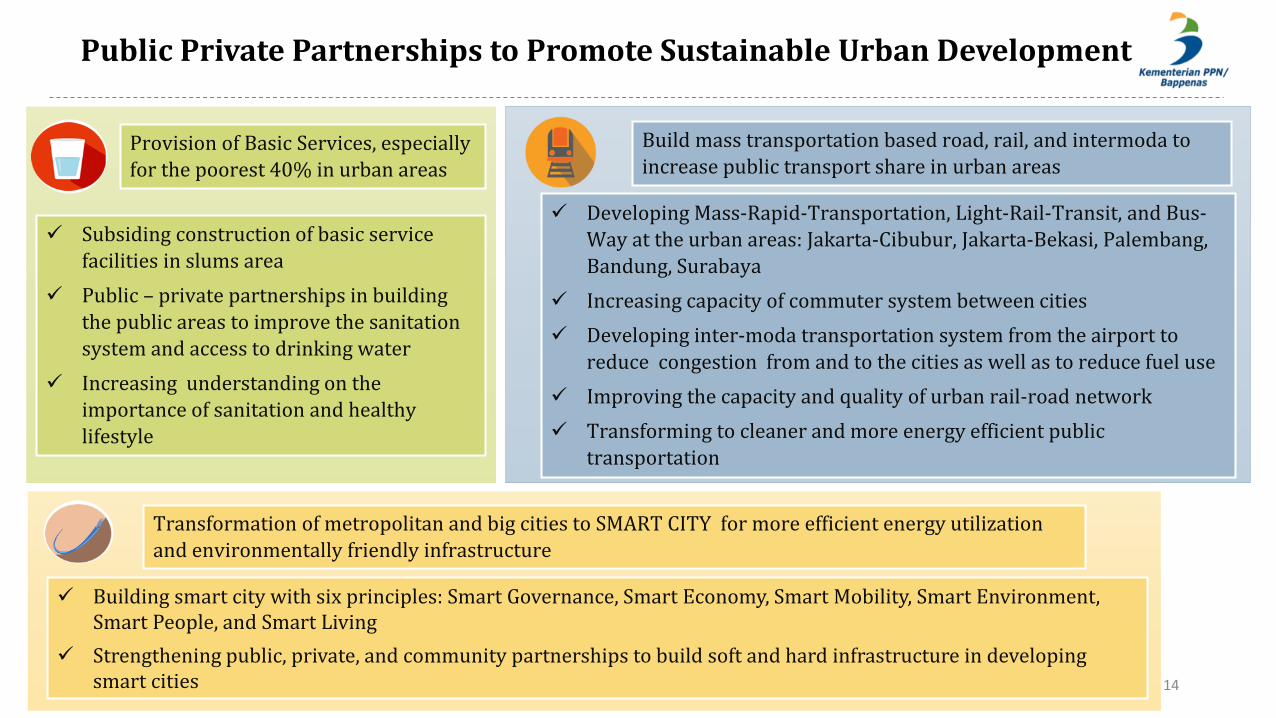
Public Private Partnerships to Promote Sustainable Urban Development
14
Provision of Basic Services, especially for the poorest 40% in urban areas
Subsiding construction of basic service facilities in slums area
Public – private partnerships in building the public areas to improve the sanitation system and access to drinking water
Increasing understanding on the importance of sanitation and healthy lifestyle
Build mass transportation based road, rail, and intermoda to increase public transport share in urban areas
Developing Mass-Rapid-Transportation, Light-Rail-Transit, and Bus-Way at the urban areas: Jakarta-Cibubur, Jakarta-Bekasi, Palembang,
Bandung, Surabaya
Increasing capacity of commuter system between cities
Developing inter-moda transportation system from the airport to
reduce congestion from and to the cities as well as to reduce fuel use
Improving the capacity and quality of urban rail-road network
Transforming to cleaner and more energy efficient public transportation
Transformation of metropolitan and big cities to SMART CITY for more efficient energy utilization and environmentally friendly infrastructure
Building smart city with six principles: Smart Governance, Smart Economy, Smart Mobility, Smart Environment, Smart People, and Smart Living
Strengthening public, private, and community partnerships to build soft and hard infrastructure in developing smart cities
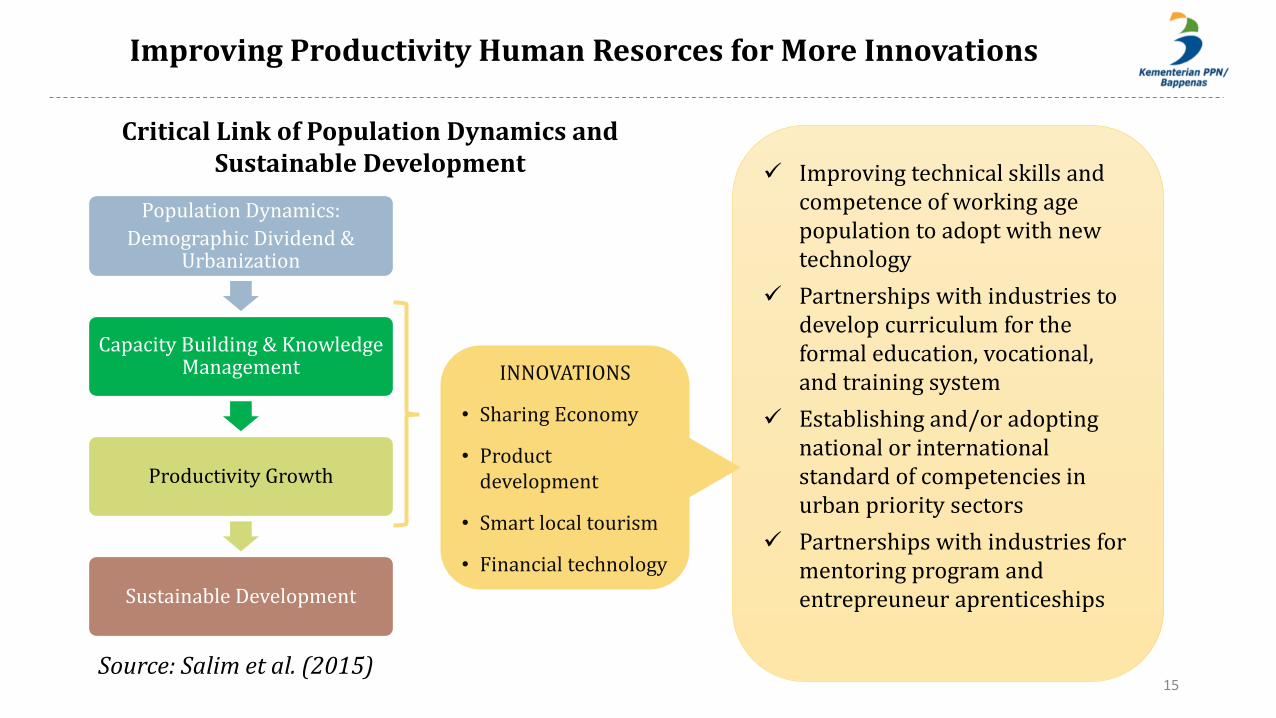
Improving Productivity Human Resorces for More Innovations
15
Improving technical skills and competence of working age population to adopt with new technology
Partnerships with industries to develop curriculum for the formal education, vocational, and training system
Establishing and/or adopting national or international standard of competencies in urban priority sectors
Partnerships with industries for mentoring program and entrepreuneur aprenticeships
Critical Link of Population Dynamics and Sustainable Development
Source: Salim et al. (2015)
Population Dynamics:
Demographic Dividend & Urbanization
Capacity Building & Knowledge Management
Productivity Growth
Sustainable Development
INNOVATIONS
• Sharing Economy
• Product development
• Smart local tourism
• Financial technology
Thank You
16