Embed Size (px)
Citation preview


Integrating global and local values
A review of biodiversity assessment
Sonja Vermeulen and Izabella Koziell
Natural resource issues paper 3
Biodiversity and livelihoods issues paper 5
International Institute for Environment and Development
2002

Copies of this report are available from:
International Institute for Environment and Development3 Endsleigh Street, London WC1H 0DD, UKTel: +44 (0)20 7388 2117 Fax: +44 (0)20 7388 2826
Correspondence should be addressed to:Sonja Vermeulen, Forestry and Land Use Programme, International Institute forEnvironment and Development, 3 Endsleigh Street, London WC1H 0DD, UK.email: [email protected] http://www.iied.org
Citation: Vermeulen, S. and Koziell, I. 2002. Integrating global and local values: a review of biodiversity assessment. International Institute for Environment andDevelopment, London, UK.
Cover photo: Variation in the fruits of the tree parasite Erianthemum dregei (Sonja Vermeulen)
Designer: Eileen Higgins, email: [email protected]: Russell Press, Nottingham, UK
Printed on Sovereign silk, 115gsm, chlorine free
ISBN 1 84369 028 4ISSN 1605-1017
Natural resource issues papers1. Rural livelihoods and carbon management2. Laying the foundations for clean development: preparing the land use sector (aquick guide to the clean development mechanism)3. Integrating global and local values: a review of biodiversity assessment
Biodiversity and livelihoods issues papers1. Diversity not adversity: sustaining livelihoods with biodiversity2. Living off biodiversity: exploring livelihoods and biodiversity issues in naturalresources management3. Integrating conservation and development experience: a review and bibliographyof the ICDP literature4. Stakeholder participation in policy on access to genetic resources, traditionalknowledge and benefit-sharing: case studies and recommendations5. Integrating global and local biodiversity values: a review of biodiversity assessment6. Making a killing or making a living: wildlife trade, trade controls and rurallivelihoods7. Lesson learnt: Mamiraua Sustainable Development Reserve, Brazil

An issues paper
i
As a resource, biodiversity is managed at local levels, but subject to wider claimsand influences. An important aspect of biodiversity management is assessment:measuring biological variety and variability, as well as the impacts on andoutcomes of this diversity. Biodiversity assessment is of interest to many groups,and regularly carried out at local, national and international scales by directusers and managers of biological resources, government departments, researchorganisations, international bodies and the private sector.
Demand is now growing for more exchange and integration among differentapproaches to biodiversity assessment. The fundamental drive behind this isdecision-makers’ realisation that effective management of land and naturalresources depends more and more on interacting constructively with otherinterest groups. More immediate drivers for biodiversity assessment include theConvention on Biodiversity (CBD), which advocates the Ecosystem Approach asa framework for putting decisions into practice – a framework that specifies theneed for pluralist, negotiated, adaptive management based at local levels.Approaches like these need shifts in governance towards greater directdemocracy. They also need good information. Biodiversity assessments, at best,deliver the sort of information that helps different interest groups tocommunicate and negotiate shared and divergent biodiversity values. As such,they might not only serve decision-making, but catalyse better governance.
Biodiversity is complex, too complex to be evaluated thoroughly. In practice thishas implications for all the many kinds of biodiversity assessments, so that theyhave common features such as being relative rather than absolute, framed in timeand usually also in space, and dependent on measuring more obvious features toestimate the less discernible. The complexity of biodiversity also means that weare not sure exactly what we gain from it. Benefits of biodiversity include directuse of a range of biological resources, indirect benefits such as stability ofecosystems and prevention of diseases, and non-use values, of which the mostimportant is the option to use biological resources in the future. However, morebiodiversity is not always better, and, as with any resource, management has tofind a compromise among outcomes that fulfill different values.
Executive summary
Integrating global and local values
ii
Of course, different interest groups identify and prioritise biodiversity valuesdifferently. One contrast is between “global values” – the indirect use values(environmental services) and non-use values (future options and intrinsicexistence values) that accrue to all humanity – and “local values” held by theday-to-day managers of biological diversity, whose concerns often prioritisedirect use of the goods that biodiversity provides. Assessments are based onvalues. Many of the current approaches to biodiversity assessment advocated bygovernments and advisory bodies emphasise global over local values, a biaswhich is seldom made explicit and is often not intended.
For organisations seeking to improve the techniques they use to assessbiodiversity, and particularly to find ways of integrating global and local values,guidance is now beginning to emerge. An overview of some of the scientific andother research tools shows many potentially useful techniques for combiningdifferent perceptions of biodiversity into shared assessments. Some of these havebeen pilot-tested successfully. Scientific tools have been applied mainly toassessing taxonomic diversity in terms of global non-use values, but there isconsiderable potential to apply the same techniques to evaluate biodiversity interms of local priorities. The most important limitations to the use of these toolsare their expense in terms of skills, time and equipment, and their dependenceon a shared quantitative understanding of biological phenomena (or at least atrust in results presented by scientists).
Economic and social science research have developed some rather differenttools, which offer ways to communicate local biodiversity values to wideraudiences. Approaches such as Participatory Rural Appraisal, ethnobotany andeconomic valuations have done much to enhance outsiders’ appreciation of localbiodiversity values, but have not been widely adapted or adopted to fit intoprescribed methods for evaluating biodiversity. Assessments done by localmanagers for their own purposes have received much less attention in the widerworld, as they are often not documented at all, or are difficult to adapt orextrapolate above the local level.
Official procedures for assessing biodiversity, as carried out or condoned byinternational agencies and national governments, have largely failed toincorporate local concerns. They tend to focus on indicators that represent non-use biodiversity values and conservation priorities, while remaining vague aboutthe exact purpose of the assessment and the justifications for chosenmethodologies. The private sector too is showing an increasing interest in

An issues paper
iii
biodiversity assessment, using methods that are sometimes ad hoc, but havepromise as the types of information bases that could assist negotiations overbiodiversity among stakeholders with different viewpoints.
Although biodiversity assessments do not always need to be done jointly, or forthat matter to be done at all, the demand for collaborative natural resourcemanagement – and hence for appropriate information to service thatmanagement – is growing. One obvious but not widely applied lesson from theexamples reviewed here is that assessments are most useful if their aims areclear, and the components of the assessment designed to meet those aims.Greater clarity about the purpose of assessment is helped by disaggregating thedifferent relevant values of biodiversity, identifying where there might be trade-offs, and trying where possible to assess the benefits derived from biodiversityrather than a surrogate biological indicator. Composite expressions of multiplebiodiversity values are certainly possible – there are several simple techniquesavailable – and might be useful tools for joint management in somecircumstances. Principles-based approaches could be appropriate frameworksfor assessments that strive to integrate local and global biodiversity values, asthey offer means of evaluating process as well as content, combining multipleperspectives, and providing plenty of local flexibility.
Integrating global and local values
iv
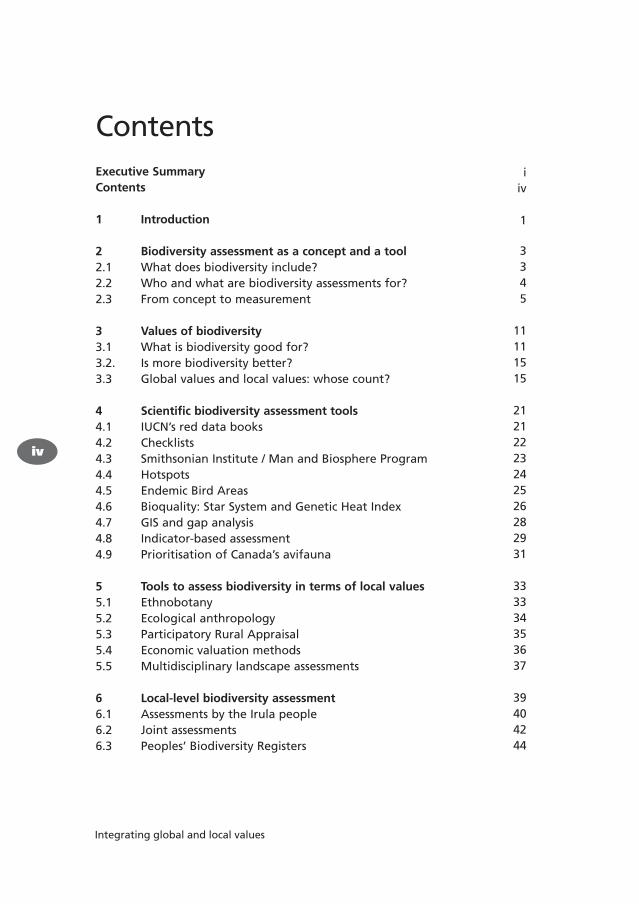
ContentsExecutive SummaryContents
1 Introduction
2 Biodiversity assessment as a concept and a tool2.1 What does biodiversity include?2.2 Who and what are biodiversity assessments for?2.3 From concept to measurement
3 Values of biodiversity3.1 What is biodiversity good for?3.2. Is more biodiversity better?3.3 Global values and local values: whose count?
4 Scientific biodiversity assessment tools4.1 IUCN’s red data books4.2 Checklists4.3 Smithsonian Institute / Man and Biosphere Program4.4 Hotspots4.5 Endemic Bird Areas4.6 Bioquality: Star System and Genetic Heat Index4.7 GIS and gap analysis4.8 Indicator-based assessment4.9 Prioritisation of Canada’s avifauna
5 Tools to assess biodiversity in terms of local values5.1 Ethnobotany5.2 Ecological anthropology5.3 Participatory Rural Appraisal5.4 Economic valuation methods5.5 Multidisciplinary landscape assessments
6 Local-level biodiversity assessment6.1 Assessments by the Irula people6.2 Joint assessments 6.3 Peoples’ Biodiversity Registers
iiv
1
3345
11111515
21212223242526282931
333334353637
39404244

An issues paper
v
7 Biodiversity assessment by international policy-makers7.1 Convention on Biological Diversity7.2 Natural Heritage (World Heritage Union)7.3 Commission on Sustainable Development7.4 International Development Goals (OECD)
8 Biodiversity assessment by bilateral donor agencies8.1 Swedish International Development Cooperation Agency (Sida) 8.2 UK Department for International Development (DFID)
9 Biodiversity assessment in national processes9.1 National biodiversity assessment in India9.2 Malawi National Forestry Programme9.3 World Conservation Monitoring Centre guidelines
10 Private sector approaches to biodiversity assessment10.1 Forest Stewardship Council certification10.2 Race to the Top10.3 Biodiversity credits
11 Summaries and conclusions from different approaches11.1 Scientific assessment tools11.2 Local-level assessments11.3 Assessments by higher-level decision-makers11.4 Lack of exchange among approaches
12 Ways forward12.1 New frameworks for biodiversity management and assessment12.2 Lessons learned: some guidelines for biodiversity assessment12.3 Combining multiple values into single indicators12.4 Principles-based approaches to biodiversity assessment
References
Annex
4747495152
535356
59596161
63636467
6969747882
8383868992
94
101

Integrating global and local values
vi
Acknowledgements
This review surveys only a small portion of the vast literature and experiencein measuring and evaluating biodiversity. We thank the many people whoprovided guidance and discussion, among them Steve Bass, Josh Bishop, Tony Cunningham, James Gordon, Brian Groombridge, Val Kapos, Gilles Kleitz, Pablo Inchausti, Natasha Landell-Mills, Anna Lawrence, James Mayers, Michel Pimbert, Jacqueline Saunders, Sian Sullivan, Krystyna Swiderska and Bansuri Taneja.
James Gordon, Ashish Kothari, Manju Raju and Bansuri Taneja providedwritten material that was incorporated into the document (their particularcontributions are acknowledged in the text). Chi-Chi Tang gave invaluableadministrative assistance.
We also thank the reviewers of a draft of this document: Peter Acquah, Colin Bibby, Linda Brown, Anna Lawrence, Dwi Rahmad Muhtaman, Michel Pimbert and Jo Treweek.
Financial support for this review was generously provided by the MacArthur Foundation.
While this review is indebted to the contributors mentioned above, theopinions expressed are those of the authors, and not necessarily those of IIED or the MacArthur Foundation.

An issues paper
1
Biodiversity is a good example of a resource that is managed locally, but is alsosubject to much wider claims as a public good – often a public good valued forthe diffuse actual or potential value to all humanity around the world. As publicconcerns about biodiversity management grow, so there is increasing demandfor communication between local and global approaches to valuing, and hencemanaging, biodiversity.
Intrinsic to managing a resource is tracking what’s there: evaluating, orassessing, the resource. In the case of biodiversity though, there are no obviousmeans of assessing all the ways in which it is or might be valuable, becausebiological systems are more complex than we fully understand. Actual (andproposed) approaches to biodiversity assessment depend ultimately onunderlying social values. Sometimes there are stark differences between thevalues that local people see to accrue locally, and what is valued for the publicgood. These differences are reflected in the ways that biological variety isdescribed and evaluated.
“I do not feel comfortable in assigning “value” to different species and other biodiversity facets, but the fact is that conscious priorities have to be made, andthese priorities are based on a “value”. In the absence of an open and formalvalue system, priorities will still be made, but based on hidden value systemswhich are beyond critical examination.”
Fredrik von Euler, in e-mail conference hosted by Swedish Scientific Council onBiodiversity, 1999. http://www.gencat.es/mediamb/bioind/econfsum.htm
But biodiversity assessments are not merely an outcome of different sets ofvalues and different ways of managing ecosystems. They are also a potentially a very useful tool for facilitating communication among these differentapproaches. In recent decades, central powers have moved towards agreeingwith local opinions that management of natural resources is more efficient,sustainable and equitable when done locally. For national governments,biodiversity management is perhaps one of the most advanced in this trend, at least in intent. The primary framework for the implementation of the
Introduction1

Integrating global and local values
2
Convention on Biological Diversity (CBD), which 179 countries have ratified, is the “ecosystem approach”, which endorses principles of negotiated localgovernance and adaptive management (discussed further in Section 2.2).
Shared, adaptive decision-making over management of ecosystems requiresbetter communication. For biodiversity assessment this means at best, jointevaluation, and at the least a mutual understanding and agreement about howthe variety of life is measured. This review presents a small sub-set of the widerange of biodiversity assessment tools, with the purpose of evaluating how they do, and how they could, adapt to integrate multiple values attached to biodiversity.

An issues paper
3
2.1 What does biodiversity include? Biodiversity, according to the widely accepted definition in the Convention onBiological Diversity, encompasses “the variability among living organisms fromall sources including, inter alia, terrestrial, marine and other aquatic ecosystemsand the ecological complexes of which they are part; this includes diversitywithin species, between species and of ecosystems” (CBD 1992).
In common usage, biodiversity means the sum total of living things and theecological processes associated with them – as such it can be, and is, used as asynonym for “nature” or “life on earth”. More strictly, though, the term refersspecifically to the variability and variety within species, among species andamong the ecological processes that connect them. Biodiversity is a combinationof the living world’s capacity to change – variability – and the range ofbiological forms and processes that derive as a result – variety (Box 1). In thissense, what is important about biodiversity to humans is the choice that itoffers, from the perspective of both present benefits of varied and variable lifeforms and the future options associated with variety and the capacity fororganisms to mutate and adapt.
The scale of biological variety is difficult to imagine, and the very notion ofvariability hard to conceptualise. Neither is easy to describe in tangible terms orto measure. Yet societies all over the world use the concept of variation andvariability in nature, albeit in very different ways. With an array of ways ofconceptualising biodiversity comes as many approaches to assessing variationand variability – techniques tailored to measuring the facets of biodiversity ofvalue to that individual or society.
Biodiversity assessment as a concept and a tool
Box 1. Variety, variation and variabilityVariety means the existence of differences. Variation is the measure of variety, the extent or range of difference.Variability means the ability to vary, or the capacity to change.
2

Integrating global and local values
4
2.2 Who and what are biodiversity assessments for?The primary purpose of biodiversity assessments is to provide the sort ofinformation to decision-makers that facilitates more effective management ofbiodiversity and associated resources. While we all depend on the variety of life,perhaps the most important of these decision-makers, in terms of how muchthey value and how much they influence biodiversity, are the most direct usersand managers: farmers and other people whose livelihoods depend immediatelyon the variation and variability of biological resources. These natural resourcemanagers have been assessing biodiversity for millennia, usually in ways that arenot documented or accessible by outsiders.
As biological resources became scarcer relative to human populations, claimshave been made for biodiversity as a global good. Over the past century, theperception that the benefits of biodiversity accrue globally has given rise to astrong international conservation lobby and a swathe of international processesand agreements that refer to biodiversity. Many of these agreements requiresignatories to conduct some form of biodiversity assessment. Signatories arenational governments, who are pulled by both national and internationalinterests. The rising interest in biodiversity assessment has not been confined togovernments and campaigners. The private sector too has had to complyincreasingly with environmental criteria that include standards for biodiversity,and companies have also been able to take advantage of new commercialopportunities for managing and monitoring biodiversity.
For all stakeholders, management of biodiversity is increasingly aboutinteracting with other interest groups, in particular interest groups made up oflocal residents and resource users. The shift towards acknowledging theauthority of local groups to analyse, plan, negotiate and act in the managementof biodiversity is borne out by the “ecosystem approach” adopted by theConference of Parties of the CBD. The operational guidelines of the ecosystemapproach are based on 12 principles that explicitly acknowledge the trade-offsbetween local and global biodiversity values and advocate an inclusive andpragmatic approach to decision-making (Box 2).
Of course, international agreements are far from guarantees of agreement oraction at the local scales that matter, but at least in principle a large number ofnational governments are committed to work towards decentralised andcollaborative modes of biodiversity management. Inter-governmental and non-
An issues paper
5
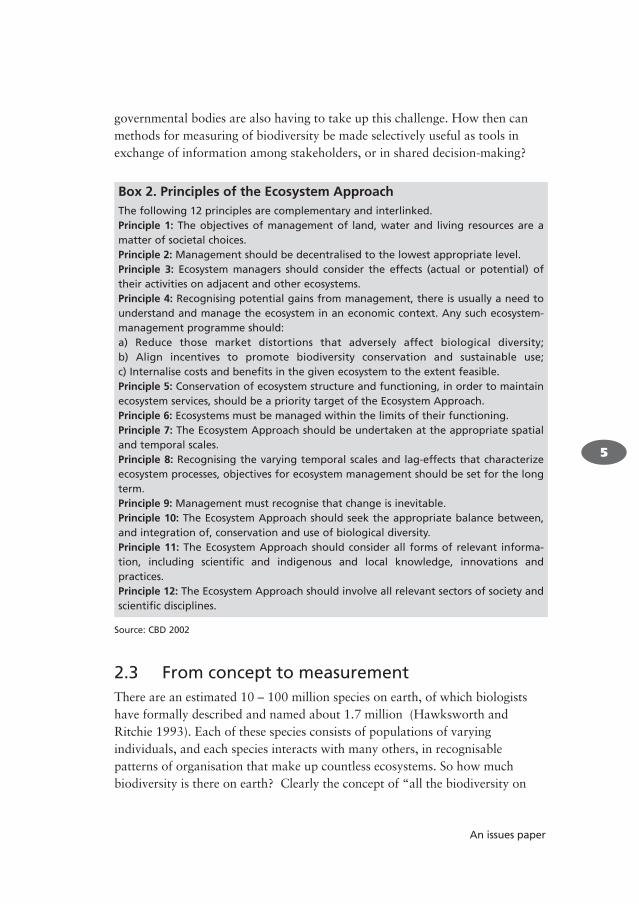
governmental bodies are also having to take up this challenge. How then canmethods for measuring of biodiversity be made selectively useful as tools inexchange of information among stakeholders, or in shared decision-making?
Box 2. Principles of the Ecosystem ApproachThe following 12 principles are complementary and interlinked.Principle 1: The objectives of management of land, water and living resources are amatter of societal choices. Principle 2: Management should be decentralised to the lowest appropriate level. Principle 3: Ecosystem managers should consider the effects (actual or potential) oftheir activities on adjacent and other ecosystems. Principle 4: Recognising potential gains from management, there is usually a need tounderstand and manage the ecosystem in an economic context. Any such ecosystem-management programme should: a) Reduce those market distortions that adversely affect biological diversity;b) Align incentives to promote biodiversity conservation and sustainable use;c) Internalise costs and benefits in the given ecosystem to the extent feasible.Principle 5: Conservation of ecosystem structure and functioning, in order to maintainecosystem services, should be a priority target of the Ecosystem Approach. Principle 6: Ecosystems must be managed within the limits of their functioning. Principle 7: The Ecosystem Approach should be undertaken at the appropriate spatialand temporal scales. Principle 8: Recognising the varying temporal scales and lag-effects that characterizeecosystem processes, objectives for ecosystem management should be set for the longterm. Principle 9: Management must recognise that change is inevitable. Principle 10: The Ecosystem Approach should seek the appropriate balance between,and integration of, conservation and use of biological diversity. Principle 11: The Ecosystem Approach should consider all forms of relevant informa-tion, including scientific and indigenous and local knowledge, innovations andpractices. Principle 12: The Ecosystem Approach should involve all relevant sectors of society andscientific disciplines.
Source: CBD 2002
2.3 From concept to measurementThere are an estimated 10 – 100 million species on earth, of which biologistshave formally described and named about 1.7 million (Hawksworth andRitchie 1993). Each of these species consists of populations of varyingindividuals, and each species interacts with many others, in recognisablepatterns of organisation that make up countless ecosystems. So how muchbiodiversity is there on earth? Clearly the concept of “all the biodiversity on

Integrating global and local values
6
earth” has qualitative meaning, but deriving an informative quantitativemeasurement of the world’s biodiversity is, in practical terms, impossible.
The important implication of this is that all measurements of biodiversity referto a subset of the facets of total biodiversity. Even at single sites we cannotmeasure the full range of species diversity, let alone the variation within thosespecies or their processes of interaction; we have not even named many of thespecies, especially the myriad micro-organisms in any habitat.1 Thus everybiodiversity assessment must be based on a chosen subset of characters thatmight (or might not) reflect overall biodiversity. Before tackling the morecontroversial and less explicit aspects of how these choices are made, somegeneral points about measuring biodiversity should be made:
Biodiversity measures are relative. Leading on from the fact that we areincapable of measuring the world’s biodiversity at any one moment in time,measures of biodiversity are not absolute. Rather they are used to comparedifferent areas over different periods of time.
Measured biodiversity is an attribute of a group of organisms, usually in aparticular area. We are forced to limit measures of biodiversity to a group oforganisms. The group could be defined non-spatially (e.g. diversity of a shoal ofmackerel, or of the family Rosaceae). More commonly though, measures (ordescriptions) of biodiversity refer to a specified area, such as the diversity oftrees in Uganda or the genetic diversity of the rice fields of Yunnan.
Biodiversity measures also have a time frame. The biodiversity of an area willtend to change over time, through the seasons, but also as populations rise orfall over longer periods of time or as they adapt to changing conditions. Thus tomeasure biodiversity, limits of time as well as limits of space need to be defined.For example, a desert will display much higher levels of diversity over the courseof a year than in a one-off assessment.2
Biodiversity is customarily divided into genetic, species and ecological diversity.Genetic and species diversity are both aspects of taxonomic diversity (Box 3),which refers to the variation in genetic make-up or observable characters among
1. The All Taxa Biodiversity Inventory at Guanacaste, Costa Rica, spent US$ 88 million over five years inthe closest science has come to a complete description of taxonomic diversity at a single site.2. Biologists are also aware that the longer one stays at a site the more variability is recorded. Thus manyinventory methods are deliberately time-limited.

An issues paper
7
a group of organisms. Ecological diversity is a less tangible concept, referring tothe variation within and between ecosystems (Box 4).
Biodiversity is sometimes invisible. Smaller, less visible species such as bacteria,fungi, nematodes and organisms found in the deep sea often get overlooked inassessments either because they are simply forgotten about or becausemeasurement is too expensive (and substituting visible organisms as indicatorsof other biodiversity is not always robust).
Box 3. Taxonomic diversityGenetic diversity is the variety of genes within a species, or the variety of observablecharacters that those genes produce. For example, the range of mangoes around theworld, from blue-skinned to yellow, from stringy to smooth, is a form of genetic varia-tion. Some useful species display a great deal of external variety; for example cabbages,cauliflowers, broccoli and brussels sprouts are all one species.
Species diversity is the variety of species within a community or collection of organisms.For example, a natural woodland will usually have higher tree species diversity than atimber plantation. What exactly is a species? There continues to be debate amongstbiologists over what constitutes a species, but essentially a species is defined as a groupof organisms that are able to interbreed with each other to produce fertile offspring.Thus all domestic dogs are one species, in spite of their wide variation in appearances,but the closely related wolf is another species because dogs and wolves cannot inter-breed successfully.
However, species are not the only level of classification of organisms. Taxonomistshave developed a standard hierarchy based on the similarities and known evolution-ary relationships among species. The basic levels are kingdom, phylum (plural phyla),class, order, family, genus (plural genera) and species. Thus an African elephant and anIndian elephant are not the same species but they are similar enough to be classifiedin the same genus. The overall term taxonomic diversity includes diversity at all thelevels from genetic diversity through to kingdom diversity, since they are all based onvariation in genes.

Integrating global and local values
8
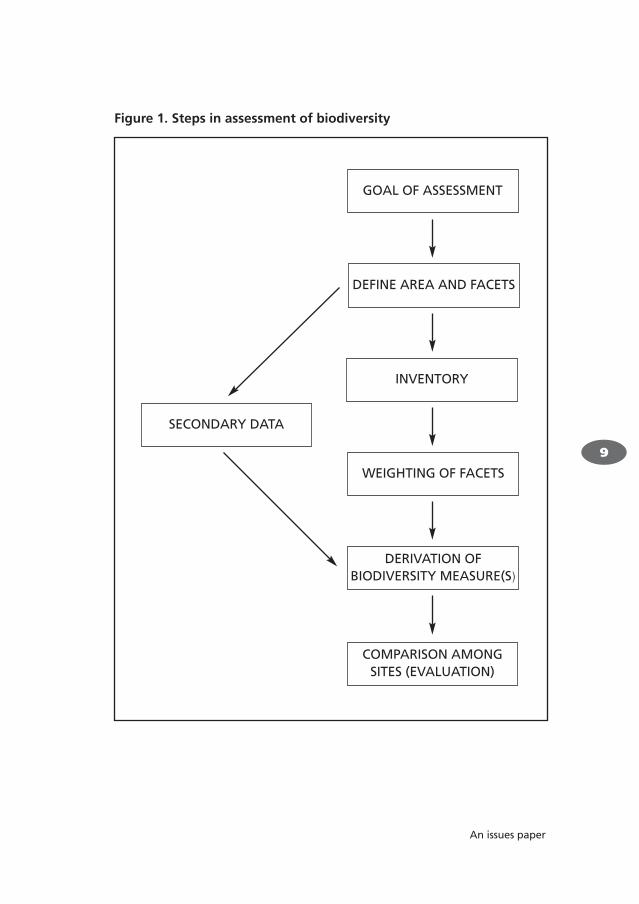
Biodiversity assessments arise from many different motives, contexts and cultures.But the many approaches to biodiversity assessment have some basic commonfeatures, such as frameworks of time and space, and reliance on observation of only a small sub-set of the facets of biological variety and variability. Allbiodiversity assessments, even of the most casual variety, also entail a general seriesof steps (Figure 1):
Motive for the assessment and hence its goalChoice of the areas to be measured (since biodiversity assessments are necessarilyrelative, there must be at least two areas, or one area at two points in time)Selection of the facets of biodiversity to be assessed (Box 5)An inventory of the facets in the area, or use of secondary dataDerivation of a comparative expression of biodiversity for each area at each timeOverall evaluation among areas and times, involving a method to compareamong areas (this evaluation is the information that feeds into managementplanning)
Box 4. Ecological diversityEcological diversity, or ecosystem diversity, is a much less tangible concept than taxo-nomic biodiversity. Overall ecological diversity is the diversity of ecological processeswithin and among ecosystems. Ecosystem and taxonomic diversity are inextricablylinked, each creating the other.
What is an ecological process? Ecological processes concern the interactions amongorganisms and interactions with their abiotic environment. The most fundamental eco-logical processes are about food and food webs. In these terms organisms can bedivided into producers (mainly plants and single celled organisms that use photosyn-thesis), consumers (mainly herbivores), predators (mainly carnivores) and decomposers(mainly soil fungi and bacteria in terrestrial ecosystems) and the related ecologicalprocesses are production, consumption, predation and decomposition.
Many other ecological processes also contribute to ecosystem functioning and diversi-ty. Important examples are competition (e.g. between two animals for one prey),mutualism (e.g. pollination of flowers by bees), dispersal (e.g. birds carrying seeds –another mutualism) and ecosystem engineering (e.g. termites building nests thatprovide new habitats for other organisms).
Ecological diversity is such a broad term that most authors avoid defining it (e.g.Harper and Hawksworth 1994; Gaston and Spicer 1998). This is not generally aproblem, as there is overall consensus about the types of processes that are included.However, one distinction that is not always made, but is useful, is to separate within-ecosystem biodiversity (emergent ecological features of taxonomic diversity) frombetween-ecosystem biodiversity (the different kinds of ecosystem in a landscape).
An issues paper
9
GOAL OF ASSESSMENT
DEFINE AREA AND FACETS
INVENTORY
WEIGHTING OF FACETS
DERIVATION OF BIODIVERSITY MEASURE(S)
COMPARISON AMONGSITES (EVALUATION)
SECONDARY DATA
Figure 1. Steps in assessment of biodiversity

Integrating global and local values
10
Each of these steps requires a decision, essentially a prioritisation of whatmatters more and what matters less, a value judgment. Within particulars oftime and space, biodiversity assessments face further choices must be madeabout which organisms or processes to measure, and what to measure aboutthem. Of course, given the complexity of the natural world, it is usually onlypossible to gauge a small sub-set of total variation. This complexity also meansthat there is no single universal objective measure of biodiversity. On thecontrary, all measurements and assessments of biodiversity are predicated onvalue judgments about which facets of biodiversity matter more and whichmatter less. The next section considers what we gain from biodiversity, andmost particularly how different people desire different – sometimes competing –products and outcomes.
Box 5. Facets of biodiversity to assessAn assessment will need to select a feasible set of facets to measure among the diversity of:
Genes, taxa (e.g. species or families) and ecosystemsStructure, process and threatNatural and agricultural landscapesPlants, animals (vertebrates and invertebrates), fungi and micro-organismsWithin-site and relevant above-site characters (metapopulation dynamics)
Understanding the diversity of these facets then requires assessment of one or more ofthe following:
Number of the chosen facet within the area (e.g. number of species)Abundance within each facet (e.g. how many individuals of each of those species)Relatedness among facets (e.g. whether the species belong to the same or different families)

An issues paper
11
3.1 What is biodiversity good for?Nobody would dispute that we are critically dependent on some basic level ofbiodiversity: we could not eat if there were no plants and we could not reproduceif all humans were female. The kind of biodiversity that we are interested inassessing tends to have more subtle, though important, impacts on our lives. Forexample, we might want to know what range of predators and parasites wouldoptimise pest control in a field. The value of biodiversity, like the measurement of biodiversity, is more useful as a relative than an absolute (“biodiversity isgood”) concept.
If biodiversity at large, or any facet of it, is good, then it is good because webenefit from it in some way. Biodiversity is not a good or service in itself but aprovider of goods and services. The general consensus internationally is that thesegoods and services fall into three categories – direct use, indirect use and non-usevalues – though perspectives on what each of these includes vary from author toauthor (Table 1). If we treat biodiversity as something extra to biological resources(Box 6) – as variability and variety among living things – then our next question iswhat extra goods and services do we derive from additional biodiversity?
Values of biodiversity
Box 6. Biodiversity values versus biological resource valuesThe actual valuation of biodiversity has often been based on the assumption that bio-logical resources are “the physical manifestation”3 of biodiversity. Thus, the value ofbiodiversity has often been taken as equal to that of the value of biological resources.However, if biodiversity is taken to represent the diversity of biological resources ratherthan the biological resources themselves, the value of one will not necessarily be thevalue of the other. Aylward (1991) argues that this way of valuing biodiversity has per-verse effects: valuing biodiversity as biological resources has meant that the role ofbiodiversity per se is actually overlooked in land use decision making. For example, taketwo competing land use investment alternatives with the same biological resourcevalues and the same direct costs. Plan A maintains a high level of diversity and Plan B alow level of diversity. If these two plans are compared on the basis of their biologicalresource value then there will be no discernible difference between the two plans. Thevalue of diversity needs to be made explicit to make the optimal land use decision inthese kinds of cases.
3. McNeely (1990) cited by Aylward (with emphasis added) : “Biological resources – genes, species andecosystems that have actual or potential value to people – are the physical manifestation of the globe’s bio-logical diversity”.
3

Integrating global and local values
12
Biological resources per se have direct use, indirect use and option values, so whatadditional value do we derive from a more biologically diverse compared to a lessdiverse ecosystem?
At a scientific level, our answers to this question, and indeed our ability toanswer the question, are only beginning to develop. Empirical evidence to linkbiodiversity with direct benefits of increased or more stable yields, indirectbenefits such as watershed protection or carbon sequestration, or option valuesof present or yet-to-evolve organisms, is scanty. Much of the challenge ismethodological, as experiments on biodiversity are costly and difficult togeneralise to other (or more complex) scenarios. Though it is difficult toquantify the benefits of more biologically diverse compared to less diversesystems, we do have a broad qualitative idea of the kinds of goods and servicesthat may be enhanced by increases in biodiversity:
Direct use values of biodiversity accrue from the benefits of a wider range ofraw materials (e.g. foodstuffs, medicines, building materials and fodder forlivestock). Often the most valuable aspects of biodiversity as a direct use areassociated with supply of resources during critical periods of time whenstaples are not available (e.g. dry seasons or droughts).
Indirect use values of biodiversity are mostly associated with theenvironmental services that ecological biodiversity sometimes enhances. More diverse ecosystems may be better providers of stable and effectivemicroclimate regulation, protection from erosion, or other services. A perhapsunderestimated indirect use value of greater biodiversity is protection frompredators, parasites and diseases (Box 7).
Non-use values of biodiversity consist primarily of the option to use biologicalresources in the future (Table 1). More diverse communities of plants andanimals offer a greater variety of potential future uses as well as a greatercapacity to evolve new forms and processes. Also included as a non-use valueis the concept of intrinsic value, which the school of “deep ecology” wouldargue overrides all other biodiversity values.

An issues paper
13
Box 7. The importance of biodiversity in protection againstpathogensBlench (1997), following Ehrlich and Ehrlich (1992), singles out one of the most impor-tant services of biodiversity, that of protection against pathogens. In fact evolutionarybiologists argue that pathogens are one of the main causes of taxonomic diversity (andthe evolution of sexual reproduction). Many plant diseases, such as the fungal rusts andblights that cause highest losses in yields globally, only infect hosts that have a very spe-cific gene-for-gene match with the attacking fungus. As genetic modification of cropsand associated intensive farming systems has led to large scale planting of geneticallyuniform crops, in turn pandemic diseases have caused catastrophic losses, such as theinfamous Southern Corn Blight in the USA in the early 1970s. Blench categorises pro-tection against pathogens as an indirect use value, though arguably it could bedescribed as a direct use value, since the disease prevention function of genetic varietywithin a field of crops contributes directly to yields.
Teasing out the values of biodiversity is worthwhile because it gives us aframework for looking at the different meanings of biodiversity to differentpeople and at different times. The various values of biodiversity can augment orcompete with each other, and augment or compete with other direct, indirect ornon-use values of biological resources. Of course there are also trade-offsbetween biodiversity values and the non-biological values associated withalternative land uses. Various stakeholders will rank these sets of competingvalues differently. Under the circumstances that we can assess only facets ofbiodiversity at any one time, stakeholders’ assessments are strengthened asdecision-making tools by clear links between what they measure and what theyvalue about biodiversity. Sections 3.2 and 3.3 look at trade-offs in biodiversityvalues in more detail.

Integrating global and local values
14
Tab
le 1
. Val
ues
of
bio
div
ersi
ty a
cco
rdin
g t
o d
iffe
ren
t au
tho
rs
Cat
ego
ries
DIR
ECT
USE
IND
IREC
T U
SE
NO
N-U
SE
Des
crip
tio
n
Thes
e co
nce
rn t
he
way
s in
wh
ich
bio
div
ersi
ty c
on
trib
ute
s d
irec
tly
top
eop
le’s
live
liho
od
s, f
or
exam
ple
by
imp
rovi
ng
nu
trit
ion
, hea
lth
and
inco
me.
Dir
ect
use
val
ues
are
freq
uen
tly
div
ided
bet
wee
nsu
bsi
sten
ce (
or
ho
use
ho
ld u
se)
valu
es a
nd
pro
du
ctiv
e (o
rtr
adab
le)
valu
es t
o d
isti
ng
uis
hg
oo
ds
that
do
no
t en
ter
the
mar
ket
fro
m t
ho
se t
hat
do
.
Thes
e d
eriv
e fr
om
th
e m
any
serv
ices
bio
div
ersi
ty p
rovi
des
th
atsu
pp
ort
hu
man
wel
l-b
ein
g. T
hes
ear
e p
red
om
inan
tly
envi
ron
men
tal
serv
ices
, su
ch a
s re
gu
lati
on
of
clim
ate,
air
qu
alit
y, w
ater
qu
alit
yan
d s
oil
form
atio
n.
Thes
e in
clu
de
thre
e co
mp
on
ents
:th
e o
pti
on
to
use
fac
ets
of
bio
div
ersi
ty in
th
e fu
ture
, as
use
sb
eco
me
app
aren
t (o
pti
on
val
ue)
;b
equ
est
to f
utu
re g
ener
atio
ns
(beq
ues
t va
lue)
; an
d t
he
bel
ief
that
dif
fere
nt
org
anis
ms
and
eco
syst
ems
sho
uld
be
allo
wed
to
exis
t re
gar
dle
ss o
f u
tilit
y to
hu
man
s (i
ntr
insi
c va
lue)
. Sev
eral
auth
ors
co
mb
ine
thes
e w
ith
ind
irec
t u
se v
alu
es.
CI 2
001
Inte
rnat
ion
al
exp
ort
Reg
ion
al
mar
ket
Loca
l mar
ket
Ho
use
ho
ld u
se
Eco
log
ical
G
eop
olit
ical
Taka
cs 1
996
Ble
nch
199
7Ec
on
om
icEc
on
om
icSo
cial
am
enit
y
Eco
log
ical
Ec
osy
stem
se
rvic
esPr
ote
ctio
n
agai
nst
p
ath
og
ens
Scie
nti
fic
Aes
thet
icB
iop
hili
c Et
hic
alTr
ansf
orm
ativ
e In
trin
sic
Spir
itu
al
Aes
thet
ic
Ko
ziel
l 200
1B
ass
et a
l. G
asto
n a
nd
20
01a
Spic
er 1
998
Sub
sist
ence
Co
nsu
mp
tive
Dir
ect
use
Tr
adab
le
Pro
du
ctiv
e (s
ub
sist
ence
an
d t
rad
able
)
Envi
ron
men
tal
Envi
ron
men
tal
Ind
irec
t u
sese
rvic
esse
rvic
es(e
colo
gic
al)
Info
rmat
ion
al/
evo
luti
on
ary
Op
tio
nA
esth
etic
s an
dO
pti
on
an
dIn
trin
sic
p
leas
ure
beq
ues
tO
pti
on
Intr
insi
c
N.B
. Co
rres
po
nd
ence
s ar
e n
ot
exac
t –
dif
fere
nt
auth
ors
mea
n d
iffe
ren
t th
ing
s b
y th
e sa
me
term
.

An issues paper
15
3.2 Is more biodiversity better?Much of the debate around biodiversity is preoccupied with the linked conceptsof conservation, human disturbance, biodiversity loss and naturalenvironments. Public opinion, especially in developed countries, is swayed bythe perceptions that “increased biodiversity = increased good” and “decreasedhuman activity = increased diversity”. Unfortunately these attractively simplepropositions can be misleading, as the following points illustrate:
Increased biodiversity can decrease biological resource values. To take thesimplest of examples, adding a swarm of locusts to a millet monoculture maydouble species diversity, but decimate yield.
Not all facets of biodiversity, or ranges of biodiversity change, are equallyvaluable. The species diversity of ants in a rainforest may have moresignificance to ecosystem processes than the far greater species diversity of beetles. Similarly, increasing a child’s diet from one vegetable to sixvegetables will no doubt have greater health benefits than an increase from 20 to 25 vegetables.
Different facets of biodiversity do not increase or decrease in tandem with each other. Species numbers can increase after clear-cutting a forest, but thenewcomers may consist of invader species that prevent regeneration ofendemic (local) species.
Biodiversity is a product of both natural evolutionary and human selectiveprocesses. There is now a growing awareness that, even those areastraditionally perceived by western scientists to contain “pristine” biodiversity,have actually been shaped and moulded by successive generations of people(Koziell 2001).
3.3 Global values and local values: whose count?Biodiversity is a moving target: its manifold facets, ever dynamic, confernumerous and sometimes competing goods and services. All humans value directuse, indirect use and non-use values of these goods and services in some consciousor subliminal way, but the specifics of those values are also liable to change overtime, and vary considerably among the people that hold them. Different peoplecan be expected not only to have very different understandings of whatbiodiversity means, but also to prioritise the various facets of diversity differently,and to make different judgments on the trade-offs between biodiversity and non-

Integrating global and local values
16
biodiversity values. The values that people attach to biodiversity will affect theways in which biodiversity is assessed, and in turn the land use and naturalresource management decisions that are based on these assessments.
“Understanding” refers to perceiving a complex and changing environment, butdifferent stakeholders perceive reality according to their own world views.Perception of environmental degradation may vary even between individualswithin a given stakeholder group as a result of socio-economic, religious, genderor age group differences…Perception is also greatly influenced by the media usedto capture and communicate it.
ILEIA (1996) in Abbot and Guijt (1998)
Management of biodiversity, then, is just as much a battleground asmanagement of any other aspect of biological resources – fraught withcompeting perceptions, competing claims and competing priorities – and chosenassessment methods are part of the battle (and potentially part too of sharedvision and alliances). However, the ways in which biodiversity assessmentsreflect different sets of values, and the links between these sets of values andmanagement decisions, are arguably even less explicit than is the case for otherdimensions of biological resource management.
One of the root causes of the lack of transparency in the biodiversity debate isour poor empirical understanding of how biodiversity delivers goods andservices, as noted in Section 3.1. Under these circumstances, a sensiblemanagement policy is the “precautionary principle” (Myers 1993), that wherethere are threats, we should not wait for full scientific knowledge before takingsteps to protect the environment. The precautionary principle tends to guidemanagement of biodiversity to the extent that the terms “biodiversity” and“conservation” are almost synonymous, at least at global and national levels4. Inthe absence of understanding which facets of biodiversity maintain which directand indirect use values, conservation of the broadest range possible of ecosystemand taxonomic diversity is the best way to maintain benefits to production,environmental services and options for the future. These benefits accrueultimately to everyone on earth, and thus can be described as “global values”.
For the vast majority of the world’s population who are poor and rural, theseglobal values matter, but may not matter as much as more immediate goods andservices gained from biodiversity locally, or “local values” (Box 8). This
4. Similarly biodiversity commentaries tend to be preoccupied with the concepts of biodiversity loss, extinc-tion and degradation.

An issues paper
17
Box 8. Some features of local biodiversity values, with illustrativeexamples
Biodiversity is especially important as a contribution to food security. In theAltiplano Andes of southern Bolivia, each family cultivates 3-4 varieties of quinoabelonging to two main groups: (a) varieties of high productivity in good years and(b) varieties of high resistance to frosts, pests and other environmental pressures,that yield a minimum production even in a bad year (Gari 1999).
The frontier between wild and domesticated biodiversity is dynamic. African cropsand livestock remain closely enough related to their locally occurring wild relativesthat gene exchange continues. Minor crops and “weeds” make critical contributionsto food security, particularly in marginal environments, and farmers regularly exper-iment with cultivation of “new” species (Blench 1997).
Links between the diversity of resources (species and genetic diversity) and thediversity in supporting processes (ecological diversity) are well recognised. TheDamara people of Namibia base their timetables and techniques for harvesting awide range of grass seeds on detailed knowledge of the habitats and habits of thevarious harvester ants that store the seeds in nests (Sullivan 1999).
Maintenance of biodiversity at the community level may be more important thandiversity maintained by individuals or households. In Idere, western Nigeria, indi-vidual farmers specialise in favourite crops – perhaps indigenous tobacco, aparticular green vegetable, or tangerines – and make use of local exchange to main-tain diversity in their own consumption (Guyer 1996).
difference in emphasis translates directly into different priorities for managementof land and biological resources. For example, given the choice between 100 haof a globally rare type of forest or 50 ha of that forest and 50 ha of diversecropland, global values would prioritise the first option and local values thesecond, even if overall biodiversity (say plant species diversity) were identical.
Applying a broad brush, there are some noteworthy contrasts between globaland local biodiversity values (Table 2). In particular, global values linkconservation primarily with indirect (environmental service) and non-use(option and existence) values of biodiversity rather than with direct use values.Sustainable use of biodiversity tends to be seen as a pragmatic, but not ideal,means to achieve conservation via compromise with local direct use values ofthe biological resources and their diversity – impacts on global direct use valuesare seldom mentioned. Meanwhile, local biodiversity values, of all kinds, remainpoorly documented and poorly represented in the global political arena.

Integrating global and local values
18 Biodiversity assessment as advocated and practised by national andinternational bodies – including governments, the private sector and NGOs – is overwhelmingly predicated on global values, dominated by implicitconservation goals based on the precautionary principle. There are perhaps twomain reasons for this. One is the strong influence of the internationalconservation lobby. The other is the absence of good information on localbiodiversity values, and a more fundamental dearth of good methods to assessbiodiversity in terms of these values.
Many institutions, such as national governments and bilateral donor agencies,are anxious to do biodiversity assessments that are more useful to decision-making, cost-effective, representative and communicable among differentinterest groups. One of the biggest challenges is integrating measures ofbiodiversity as it is important to different people. The gulf between global andlocal values is most apparent, but there are conceivably many other levels ofcontrasting values that may be difficult to weigh up against each other or tointegrate (Box 9). Rather than holding simple sets of global and local values,real stakeholders fit into a suite of competing and complementary groupings.The diversity of a single forest, for instance, might interest local people,national, provincial and village-level governments, farmers’ unions, traditional
Table 2. Differences between global and local biodiversity values
GLOBAL
Indirect use and non-use values are primary concerns
Emphasis on conservation, with or without sustainable use
Usually no specified user groups
Endemics (species that occur locally only) and other rare species given high values
Focus on genotypes (genetic information)
Wild and agricultural diversity treated separately
LOCAL
Direct use values as important or moreimportant than indirect use and non-use
Emphasis on sustainable use
Specified user groups
Endemics no more important than otherspecies
Focus on phenotypes (observable qualities)
No clear boundary between wild andagricultural biodiversity

An issues paper
19
rights activists, pharmaceutical firms, logging companies, tourism businessesand environmental groups.
The overall aim of the following sections of this study is to give a critical reviewof methods of biodiversity assessment, with emphasis on opportunities forintegrating local and global values. We are not advocating a pluralist approachfor every biodiversity assessment, nor are we suggesting that local values areinherently more important than global values. What we are arguing is thatpractical decisions about land use and natural resource management wouldbenefit from biodiversity assessments that, case by case, make explicit decisionsabout which values to incorporate, then use these decisions to shape the processof decision-making throughout the assessment cycle.

Integrating global and local values
20
Bo
x 9.
Dif
fere
nt
per
spec
tive
s o
n b
iod
iver
sity
FOR
EST
A is
mo
re d
iver
se b
ecau
se…
Fo
rest
erIt
has
a b
igg
er v
arie
ty o
f ti
mb
er s
pec
ies
Hea
ler
Even
in d
rou
gh
t ye
ars
I can
co
llect
ro
ots
fo
r m
edic
ines
Dan
a th
e fr
uit
mer
chan
tIt
has
so
ur
plu
m t
rees
th
at f
ruit
fr
om
No
vem
ber
to
Mar
ch
Nat
ion
al la
nd
-use
pla
nn
erIt
is t
he
on
ly e
xam
ple
of
dw
arf
fore
st
in t
he
wes
t o
f th
e co
un
try
FOR
EST
B is
mo
re d
iver
se b
ecau
se…
. C
on
serv
atio
nis
tIt
has
tw
o o
rch
id s
pec
ies
wh
ich
do
n’t
occ
ur
anyw
her
e el
se in
th
e w
orl
d
Ho
ney
co
llect
or
It h
as p
lan
ts t
hat
th
e b
ees
visi
t fo
r p
olle
n,
wh
ich
flo
wer
in w
inte
r as
wel
l as
sum
mer
Dan
i th
e fr
uit
mer
chan
tIt
has
ten
dif
fere
nt
spec
ies
of
fru
it I
can
get
on
on
e vi
sit
Loca
l lan
d-u
se p
lan
ner
It h
as a
wid
e ra
ng
e o
f va
luab
le r
eso
urc
es,
tim
ber
, fru
it, g
raze
& g
ame
FOR
EST
C is
mo
re d
iver
se b
ecau
se...
Ag
ricu
ltu
ralis
tTh
ere
are
plo
ts o
f cr
op
s w
ith
in it
as
wel
las
tre
es
Her
der
It h
as lo
ts o
f n
oxi
ou
s p
lan
ts t
hat
po
iso
nm
y ca
ttle
Din
a th
e fr
uit
mer
chan
tW
e h
ave
pla
nte
d b
anan
as a
nd
man
go
esam
on
g t
he
ind
igen
ou
s tr
ees
Reg
ion
al la
nd
-use
pla
nn
erIt
has
a p
rop
er u
nd
erst
ore
y th
at is
ver
yim
po
rtan
t in
pro
tect
ing
th
e es
carp
men
ter
osi
on
An issues paper
21
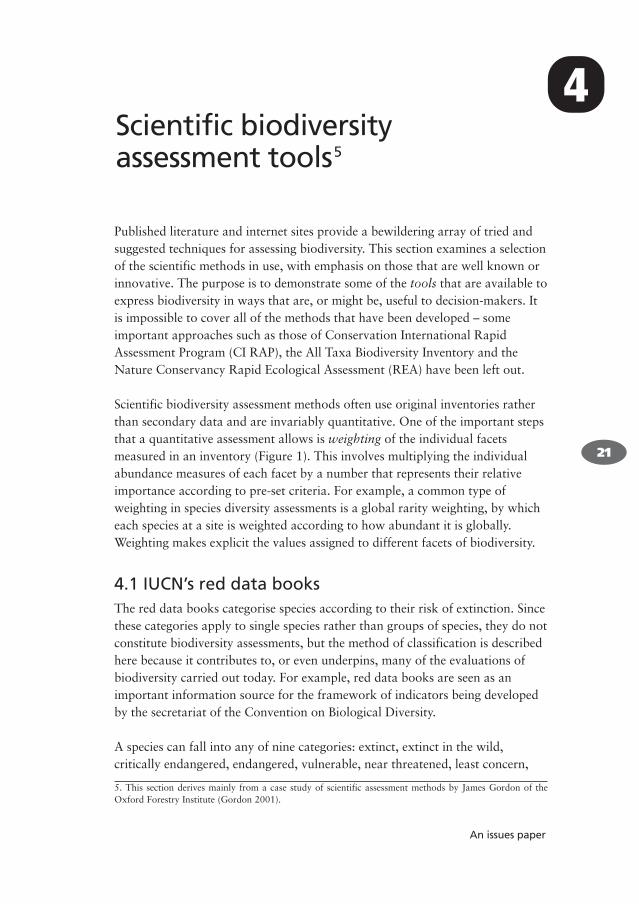
Published literature and internet sites provide a bewildering array of tried andsuggested techniques for assessing biodiversity. This section examines a selectionof the scientific methods in use, with emphasis on those that are well known orinnovative. The purpose is to demonstrate some of the tools that are available toexpress biodiversity in ways that are, or might be, useful to decision-makers. Itis impossible to cover all of the methods that have been developed – someimportant approaches such as those of Conservation International RapidAssessment Program (CI RAP), the All Taxa Biodiversity Inventory and theNature Conservancy Rapid Ecological Assessment (REA) have been left out.
Scientific biodiversity assessment methods often use original inventories ratherthan secondary data and are invariably quantitative. One of the important stepsthat a quantitative assessment allows is weighting of the individual facetsmeasured in an inventory (Figure 1). This involves multiplying the individualabundance measures of each facet by a number that represents their relativeimportance according to pre-set criteria. For example, a common type ofweighting in species diversity assessments is a global rarity weighting, by whicheach species at a site is weighted according to how abundant it is globally.Weighting makes explicit the values assigned to different facets of biodiversity.
4.1 IUCN’s red data booksThe red data books categorise species according to their risk of extinction. Sincethese categories apply to single species rather than groups of species, they do notconstitute biodiversity assessments, but the method of classification is describedhere because it contributes to, or even underpins, many of the evaluations ofbiodiversity carried out today. For example, red data books are seen as animportant information source for the framework of indicators being developedby the secretariat of the Convention on Biological Diversity.
A species can fall into any of nine categories: extinct, extinct in the wild,critically endangered, endangered, vulnerable, near threatened, least concern,
Scientific biodiversity assessment tools5
5. This section derives mainly from a case study of scientific assessment methods by James Gordon of theOxford Forestry Institute (Gordon 2001).
4

Integrating global and local values
22
data deficient, or not evaluated (IUCN 2001). A set of clear quantitative criteriadetermine placement into any of the nine categories. Three of the categories –critically endangered, endangered and vulnerable – rely on detailed observationsor predictions of population decline. Analysis is done by experts using currentknowledge and is reviewed by a panel established by IUCN. The system hasbeen under constant revision and refinement since its inception, for exampleimproving its usefulness for vascular plants (Keith 1998). The IUCNclassification is theoretically applicable to any species whether plant, animal,fungus or unicellular organism, and in practice is a dynamic analysis requiringperiodic revision to reflect changing circumstances.
Although the classification was originally intended for application at a globalscale, national and regional red data books have also been compiled. This haslead to some discussion of the relationship between global and regionalclassifications (Hilton-Taylor et al. 2000, Rodríguez et al. 2000). Is it logical, forexample, that a species could be classified as less threatened at a national levelthan it is at a global level? Despite such problems the system has considerableinfluence judging by how often the classifications are used in debate aboutconservation priorities.
4.2 ChecklistsChecklists do not in themselves constitute biodiversity assessments, but they areperhaps the most commonly used tools in measuring biodiversity. A checklist issimply a list of the names of species known to be found at a stated location. It isinvariably limited to a subset of organisms (e.g. vascular flora, Lott 1993) and ismade more useful by annotations. When these annotations include informationon local names and uses it has the potential to become a cheap and useful toolfor integrating external and local biodiversity values. The link between local andscientific names is especially important – primarily an issue of communication,but one that is likely to impact on methodology.
Checklisting usually involves no sampling design beyond delimiting the area ofinterest and is rarely accompanied by any immediate statistical analysis.Nonetheless, checklists can also provide the basis for comparative analysis.Based on information from previously published checklists, Gentry (1995) wasable to draw useful conclusions about conservation priorities by comparingspecies richness and endemism of different tropical dry forest sites in theneotropics. Similarly McLaughlin (1992) used a database of 101 checklists from

An issues paper
23
the United States to identify areas of high diversity and endemism. He was ableto apply simple diversity indices (Jaccard’s index and Simpson’s index) to thedata and used ordination techniques, based solely on presence-absence data, todelineate botanical areas.
This lack of technical sophistication makes checklisting an appropriate tool forassessments that rely on non-technical staff and amateurs. For example, Droegeet al. (1998) described an assessment of birds in Canada using checklists builtup by amateur ornithologists. Even though checklists are relatively cheap,however, the time and skill needed to identify considerable numbers of botanicalspecimens from tropical forests should not be underestimated. Further, if asystematic attempt is made to link scientific names to local names and otherannotations relating to local plant use, the required resources and expertise maybe enormous in ethnically diverse regions.
4.3 Smithsonian Institute/Man and the BiosphereProgramThe Smithsonian Institute and UNESCO’s Man and the Biosphere BiologicalDiversity Program (SI/MAB) has, since 1987, been developing a plot-basedmethodology for the assessment and long-term monitoring of forest biodiversityin UNESCO’s biosphere reserves. Standard protocols have now been applied atabout 200 research sites throughout the world, mainly in tropical forest. Theseprotocols are comprehensive including everything from plot establishment todata management and training activities (Dallmeier 1996, 1998). This “cradle-to-grave” approach gives the approach efficiency and analytical potential, but isvery expensive. To establish and collect baseline data for a single 1 ha plot,Dallmeier (1992) estimated labour costs of 832 person-days.
The overall goal of the programme is the provision of “timely information forother researchers and decision-makers concerned with the fate of temperate andtropical forest ecosystems” (Dallmeier 1996). The specific questions addressed(detailed in Dallmeier 1998) concern furthering understanding of global andregional patterns of diversity and endemism, and the identification of newconservation units for the protection of remaining habitats. Questions relatingto the use value of biodiversity appear not to be addressed directly, or onlyrarely so. This is despite a stated aim of the biosphere reserve programme being“the conservation of biological diversity and the sustainable use of itscomponents” (UNESCO undated).

Integrating global and local values
24
Despite the stated intention to influence policy-makers, the considerable literatureavailable (Dallmeier and Comiskey 1998 and references therein) suggests that sofar the primary audience has been the applied research community. Nonethelessthe SI/MAB Program will likely benefit biodiversity assessments elsewhere byproviding long-term, comprehensive, reliable data sets, especially useful in theidentification and validation of biodiversity indicators.
4.4 HotspotsThe use of the term “hotspot” in relation to the conservation of biodiversity hasbecome particularly associated with Russell Mittermeier and Norman Myers(Myers 1989) who apply the term to large geographical areas (e.g. “Mesoamerica”,“Cape Floristic Province”) where concentrations of important diversity are found.Their classification uses degree of endemism and degree of threat, rather thanspecies richness, to determine a hotspot. Hence lowland Amazonia is excludeddespite high diversity because the degree of threat is low. The analysis is based onpublished sources and expert opinion rather than primary data, which is notpractical to collect over such a large geographical scale. Plants were initially theprincipal “indicators” of hotspots, though vertebrates have been incorporated morefully in recent work (Myers et al. 2000).
Mittermeier et al. (1998) identified 24 global hotspots; this was increased to 25by Myers et al. (2000) who added the criterion that each hotspot should containplant species comprising at least 0.5% of all plant species worldwide. Given theirscale, hotspots are best interpreted as an initial stage in a hierarchical assessmentthat directs further finer scale assessment. However, it is possible that at finerscales there exist priority areas, such as mountain tops or islands, outside of theglobal hotspots. A strictly hierarchical assessment system would result in theseareas being overlooked.
A much discussed problem with the hotspot concept, at whatever geographicalscale, centres on the degree of congruence between different species groups intheir patterns of richness and endemism: are hotspots that are defined largely onplant data likely to occupy the same locations as those of other groups oforganisms? Myers et al. (2000) reported that for tropical hotspots, congruencebetween the plants and vertebrates under consideration was good, but less so inMediterranean climates. However at smaller scales several studies have foundthat congruence among different taxa is poor (e.g. Robbins and Opler 1997; Reid1998; van Jaarsveld et al. 1998). Regardless, the concept has had considerableinfluence on conservation planning, beyond a purely scientific audience. For

An issues paper
25
example, the MacArthur Foundation uses the system to direct grant-making(Reid 1998). Perhaps its popularity hinges on the idea that most of the world’sdiversity could be conserved by the successful conservation of a relatively smallpercentage of the Earth’s surface.
4.5 Endemic Bird AreasPerhaps the most comprehensive global conservation assessment attempted yetis the International Council for Bird Preservation’s identification of EndemicBird Areas (EBAs) described by ICBP (1992). Endemic species are prioritised forconservation because of the limited size of their habitats and their usually smallpopulations, which renders them particularly susceptible to extinction. Anendemic or “restricted range” species was defined in this case as having abreeding range of less than 50 000 km2. By this definition 27% of known birdspecies are of restricted range. An area qualified as an EBA if it contained atleast two such species. In this way 221 EBAs were identified across the world,with most in tropical latitudes and many on oceanic islands.
To distinguish among the 221 EBAs, methods were devised to compare them by“biological importance” and by “threat”. Biological importance was firstdetermined by the number of restricted-range species of birds in an EBA on aper unit area basis, giving a score of 1 - 3. Another refinement was weighting ofthe species by taxonomic distinctness, calculated by multiplying the reciprocalof the number of species in its genus by the reciprocal of the number of generain its family. Thus a member of a genus with 72 species from a family of 13genera would have a weighting of 1/13 x 1/72 = 0.001. Application of thismethod gave 17 EBAs outstandingly high scores for taxonomic distinctness:these had their biological importance score raised by one if not already in thehighest group.
The threat status of each EBA was evaluated both by consideration of each speciesusing the threat categories of Collar and Andrew (1988) – a precursor of theIUCN system – and by the percentage area of the EBA which fell within a pre-existing protected area. Each EBA was given a score of 1 - 3, in ascending order ofthreat. With three categories of threat and three categories of biologicalimportance a contingency table can be constructed (Table 3) with each EBA fallinginto one of the nine categories produced. From this is derived a three point scaleencompassing both importance and threat that denotes priorities among EBAs.This simple but effective methodology for combining two distinct biodiversity

Integrating global and local values
26
criteria has not been applied to other organisms – its feasibility and reliability inthis example is due to the wealth of pre-existing data on bird distribution.
Table 3. Combined categories of threat and biologicalimportance for 221 Endemic Bird Areas
Threat score Biological importance score
*** ** * Total
***
**
*
Combined score for importance and threat
*** 79 EBAs of high priority
** 87 EBAs of medium priority
* 55 EBAs of lower priority
12
46
31
89
21
28
19
68
28
25
11
64
61
99
61
221
4.6 Bioquality: Star System and Genetic Heat IndexThe star rating system is a methodology for comparing the conservation meritof plant species (Hawthorne 1996), based primarily on global distributions(endemism), but with the potential for other factors to be incorporated.Distributions are gleaned from herbarium specimens and botanical monographsand ranked in order of increasingly wide distribution, and therefore decreasingconservation importance, as black, gold, blue or green stars. Green star specieshave such wide distributions that they are considered of no conservationconcern. Secondary criteria used to make adjustments to species’ star typeinclude moving a species up a star if it is a close relation of an economicallyimportant species or if it is a species unique to its genus.
The Star System is analogous to the IUCN red data book system, providingratings for individual species. These ratings can then be used to generatebiodiversity measures for individual sites so that sites can be prioritised for

An issues paper
27
various land uses. First relative weights for black, gold, blue and green starspecies are calculated, by finding the average number of degree squares (oflatitude and longitude) occupied by species of that star rating, using only speciesfor which recent monographs are available. Weights are then calculated ininverse proportion to these distributions based on green stars having a weight of1. Finally the green star score is arbitrarily reduced to zero to reflect the lack ofconservation importance given to these species. In this way Hawthorne andAbu-Juam (1995) arrived at scores of 27, 9, 3, 0 for black, gold, blue and greenstar species respectively.
Different sites or samples can then be assigned a “Genetic Heat Index” (GHI), ameasure of biodiversity based on the abundance of species in different stargroupings (Box 10). Hawthorne coined the word “bioquality” to describe theGenetic Heat Index of sites: the site with the highest GHI does not necessarilyhave the highest diversity of tree species, but it does have the highest abundanceof rare species and therefore the highest quality in conservation terms. The termbioquality makes explicit the human values (in this case global non-use values)that shape assessment of biodiversity.
Two points about the formula in Box 10 are worth emphasising. Firstly, the zeroweighting for green star species ensures that they make no contribution to thenumerator, thus reflecting the lack of conservation concern attached to suchspecies. Secondly, because the denominator, N, is all species in the sample, theGHI is effectively an average per species, that therefore allows comparison ofsamples with different numbers of species. Ideally N should be reasonably large(> 25) to ensure GHIs are not overly sensitive to the inclusion or loss of singleblack or gold star species.
Box 10. Calculation of genetic heat index
GHI = [(BkS x BkW) + (GS x GW) + (BuS x BuW)] x 100N
where:BkS = Number of black star speciesBkW = Weight applicable to black star speciesGS = Number of gold star speciesGW = Weight applicable to gold star speciesBuS = Number of blue star speciesBuW = Weight applicable to blue star speciesN = Total number of species in a sample.

Integrating global and local values
28
Hawthorne (1996) proposed a second classification system of “reddish” stars,running perpendicular to the black star to green star scale, developed to identifylocal tree resource priorities. Species given reddish stars are not globally rare butare of local economic importance and under threat of over exploitation. Theclassification was developed to identify areas in Ghana where logging hadseverely diminished populations of commercial species. It is equally applicableto non-timber species.
A fundamental difference between the reddish star scale and the black to greenstar scale is the data requirements of each. A reddish star is assigned accordingto percentage reduction of a population and therefore requires abundance datafor a given area. This contrasts with the requirement for global presence/absencedata for the black to green scale. Reddish stars are common green star speciesthat are subject to significant exploitation and are defined as follows:
Scarlet: Common but under serious threat from heavy exploitation.Exploitation needs to be curtailed if usage is to be sustained. Protection on allscales vital.Red: Common but under pressure from exploitation. Need careful controland some tree by tree area protectionPink: Common and moderately exploited. Also non-abundant species of highpotential value.
Reddish stars are assigned weights proportional to the degree to which they areexploited. In the Ghanaian example cited, the weighting was 3:2:1 forscarlet:red:pink, because populations of scarlet star species were reduced by afactor of 3 times more than those of pink stars. This reddish star rating could beseen as another type of bioquality, one where the quality is in terms of a userather than a non-use value.
4.7 GIS and gap analysisGeographic information systems (GIS) are not a biodiversity assessmentmethodology, but an important tool that can be used to combine different strataof information and hence potentially different biodiversity values. GIS hasreceived increasing attention as a useful tool in conservation assessment,particularly as computer technology has advanced and remotely sensed data hasbecome readily available. The advantage offered by GIS that it allows the“layering” and simultaneous visual display of various geographic data sets. GISoffers the opportunity to approach biodiversity assessment in a hierarchicalmanner reflecting the classification of ecosystem-species-gene. Indeed

An issues paper
29
proponents of GIS contend that the inherent flaws in species assessments maketop down assessments, starting with ecosystem or landscape assessments, theonly realistic way forward. It also offers the possibility of combining biologicaland socio-economic data.
One of the most comprehensive applications of GIS technologies in conservationis the Gap Analysis Program (GAP) developed jointly by the US Fish and WildlifeService, the US National Park Service and other organisations (Scott et al. 1993)for the assessment of habitat protection in the USA. Vegetation types weremapped from LANDSAT satellite imagery whilst predicted species distributionsfrom existing range maps and other distributional data. These are then overlaidwith different land management and ownership categories to identify gaps in thebiodiversity protected areas network. Similar applications of GIS have been madeelsewhere, for example in the Western Ghats of India (Ramesh et al. 1997).Other GIS based technology has been designed specifically with biodiversityconservation in mind. A good example is WORLDMAP, which is capable ofassessments from global to relatively local scales (Natural History Museum2002). It accommodates large amounts of species distribution data making itsuitable for the analysis of endemism and rarity.
However GIS imagery should be interpreted with caution. The emerging analysiscan only be as good as the information that goes in. The danger is that theattractive images and use of technology associated with GIS may give a spuriousappearance of accuracy and reliability. The main use of GIS is that it provides thebest way of integrating the results of biodiversity assessment – it is not anassessment method in itself, but an aid to assessment methods.
Prendergast et al. (1999) showed that GIS-based approaches to reserve selectionhave not been readily incorporated into management planning. From discussionwith conservation practitioners in Europe and the USA, they concluded that lackof awareness of the potential of such tools was the main reason, followed by “lowlevels of funding, lack of understanding of the purpose of these tools, and generalantipathy towards what is seen as a prescriptive approach to conservation”.
4.8 Indicator-based assessmentThe recognition that complete assessments of biodiversity are rarely if everpracticable has led to interest in indicators as tools that summarise and simplifydata on the complex series of environmental and social variables related to forestecosystems (Box 11). The prevailing argument is that the use of simply

Integrating global and local values
30
understood measures, which are (hopefully) indicative of other facets ofbiodiversity, bridges the gap between scientists and decision-makers. In fact theindicator approach is not new to biodiversity assessment. For instance Peterken(1974) used indicator species as a tool for identifying ancient woodland. Morerecently interest has grown and a wide range of sets of indicators have beenproposed and debated, though they are applied less frequently.
International organisations are leading in more widespread testing andapplication of indicator sets, for example the Centre for International ForestryResearch (Stork et al. 1997; Boyle et al. 1998) and working groups of theConvention on Biological Diversity (CBD; see Section 7.1). One of the biggestchallenges to these initiatives is how to capture the complexity of biodiversity ina cost-effective and easily understood set of indicators. WWF and IUCN aredeveloping landscape-level criteria (standards for judging quality) and indicators(measures of those standards) to identify shortcomings in current forestplanning, and to measure progress towards improving forest management forthe supply of human and ecological needs (WWF/IUCN 1999). Indicators offorest quality are grouped under three headings: authenticity, environmentalbenefits, and economic and social benefits. The protection of biodiversity isconsidered an indicator of environmental benefit and hence demands anappropriate assessment technique itself. Application of these indicators, which isbeing tested in various parts of the world, may be through “Rapid ForestQuality Assessment”, an expert-driven process, where time and resources arelimiting, or by “Participatory Forest Quality Assessment”, which requiresstakeholders’ participation in both the selection and assessment of indicatorsappropriate to each site and context.
For indicators to work as a comparative evaluation tool as well as a tool formonitoring change at one site, they must be equally applicable at different
Box 10. What makes a good indicator?
Indicators are measurable surrogates of broader phenomena. In general, indicators ofbiodiversity should be:
Relevant to objectives of assessmentSensitive to changeConciseUnambiguousRepeatableFinancially and technically feasible

An issues paper
31
locations. However the current level of interest in indicators is not yet matched bysuccessful validation (Lindenmayer 1999). As part of the CBD secretariat’s widerdevelopment of indicators, WCMC undertook to investigate the applicability ofindicators of ecosystem quantity and quality for biodiversity assessment in OECDcountries (WCMC undated). They chose two relatively simple indicators: amountof natural ecosystem as a measure of biodiversity quantity, and population time-series data as a measure of biodiversity quality. In both cases digitised data wasavailable for manipulation by GIS. While they concluded that the methodologywas robust because they were able to chart changes in the chosen indicators, theyalso acknowledged that “the extent to which trends in species characteristic of agiven habitat class can be taken as indicative of prevailing trends in that habitat,and whether this might be a property of all habitat types and communities ofspecies, have been little explored”.
4.9 Prioritisation of Canada’s avifaunaDunn et al. (1999) proposed a novel method to prioritise bird species forconservation in Canada. Each species occurring in Canada was ranked in twoways, by “concern” and by “responsibility”. Concern is a composite based onpopulation decline and vulnerability (abundance, sizes of breeding andwintering ranges), which reflects both future and current risk of extinction. The assessment was made relatively easy by the ample information available onCanada’s birds, including national surveys and abundance rankings – detailedsecondary sources like these do not exist for most groups of organisms in mostparts of the world. The second ranking, responsibility, is the degree to which aspecies is concentrated within a politically defined area (in this case Canada)and therefore the responsibility of the corresponding political entity (theCanadian government).
The system does not try to combine concern and responsibility into a singleindex: since they are biological and socio-economic scales which do not runalong parallel axes, a combined index would be difficult to interpret. Insteadpriority species are identified by the overlap of concern and responsibility. Of the297 species assessed in this case, 22 were considered both of high concern andhigh responsibility at a national level (Figure 2). Digitised maps of summer andwinter ranges revealed the additional information that the priority species weremainly summer migrants that winter further south. Although it is not yet clearhow much effect this work has had on conservation policy in Canada, it standsout as an attempt to consider both biological and political criteria together.

Integrating global and local values
32
Figure 2. Combined plot of responsibility and concern for 297bird species in Canada
22 priorityspecies
highConcern
Responsibility
high

An issues paper
33
National and international policy (notably the CBD) is creating demand forassessment of local biodiversity values. What is needed is not so much a meansfor people to assess local biodiversity for themselves, but a means tocommunicate their values and assessment of local biodiversity to otherstakeholders. A number of methods, mostly external in origin, are nowemerging as potential tools to evaluate biodiversity as it is perceived locally inways that are meaningful to outsiders. Here we describe some of the mostpromising approaches.
5.1 EthnobotanyEthnobotany is the study of how cultural groups classify and use plants.Ethnobotanical surveys typically produce annotated checklists of local plantspecies, detailing their local uses and names in various languages. The usual aimis to be as comprehensive and as accurate as possible, which means thatethnobotanical checklists can be invaluable sources of information about localuse of plants of different types. Information linking biodiversity to locallivelihoods can also be included, such as indications of which plants are used incarpentry, herbal medicine, domestic cooking (firewood and food) and so on(e.g. Dounias et al. 2000; Pandey and Kumar 2000).
A major advantage of ethnobotanical checklists is that they present informationlargely in the terms of local people, for instance without drawing falsedistinctions between “wild” and “cultivated” species. Ethnobotanical studieshave also revealed some fascinating general principles, for example that all overthe world ethnobiological systems of classification are based primarily on theaffinities that humans observe among the taxa themselves, quite independent ofthe actual cultural significance and uses of those taxa (Berlin 1992).
In general, ethnobotanical studies are not conducted with the primary aim ofinforming local or national policy. The usefulness of simple checklists asassessments of local biodiversity utilisation and values may be limited by theabsence of prioritisation among species. Furthermore, they do not usually
Tools to assess biodiversity interms of local values
5

Integrating global and local values
34
include estimates of abundance and they tend to deal only with species diversitywithout reference to genetic or ecological diversity. Despite these kinds oftechnical limitations, ethnobotanical checklists can provide a good startingpoint for more detailed quantitative or qualitative assessments of biodiversity interms of local values. Of course, ethnobotanical data can feed into quantitativestatistical analyses or other discriminatory techniques (Hoft et al. 1999).However, there remains an ethical challenge in that publication of localknowledge about plants and their uses without full permission can constitute aninfringement of intellectual property rights.
5.2 Ecological anthropologyCase studies by ecological anthropologists can provide much deeperunderstanding of local biodiversity values than any of the other methodsdescribed here. Ecological anthropologists investigate the links between humanbeings and their environments, or how culture and nature are interdependent inthe broadest sense. Their holistic approach draws on sociology, economics andbiology, though with an emphasis on qualitative rather than quantitativeperspectives. Not surprisingly, work in this field draws attention to both culturaland biological diversity.
Over time, ecological anthropology has moved from a paradigm of materialism,in which human culture is interpreted as a product of adaptations to our naturalenvironment, towards a less deterministic and more historical approach.Furthermore, many ecological anthropologists now present their work in anexplicitly political context, as constructive critiques of prevailing environmentalpolicy. For example, a careful study in Africa has refuted the popular concept of“virgin” rainforest and shown instead that human beings have practised shiftingcultivation over wide areas of forest for thousands of years (Fairhead and Leach1996). This kind of evidence has indisputable implications for the level ofhuman activity allowable in protected areas.
Through their particular interest in the cultures of societies who live close tonature, ecological anthropologists regularly act as a voice for poor rural peopleto the outside world. This role is strengthened by the strenuous efforts thatanthropologists make to articulate peoples’ own perceptions of theirenvironments. For instance, a recent study in Namibia reveals not only theextensive use and trade among women of a wide variety of perfumed plants, an“invisible” resource to official natural resource managers, but also conveys the

An issues paper
35
importance that women attach to these plants and their preparation, asmanifestations of their identity and autonomy (Sullivan 2000).
To sum up, ecological anthropology tends to be skills-intensive, labour-intensiveand academic, but very useful in providing critical insights into local systems ofinteraction with biodiversity that can inform more standardised assessmentmethodologies and provide a wider perspective of value than can be expressedin formal economic terms (see below).
5.3 Participatory rural appraisalPRA methodologies are now well known and used throughout the world. Theycomprise selections of tools to elicit group knowledge and perceptions – tools suchas maps, time-lines, transect walks and ranking exercises – used to guide andstimulate discussion. Ideally, the methods are introduced by outsiders but becomeco-opted and adapted by local people into ongoing planning processes. Themethods can also be useful to provide other decision-makers, including regionaland national policy-makers, with a practical understanding of how the day-to-daymanagers of biodiversity use and value their natural environments. PRA has thecapacity to draw attention to facts obvious to local people but obscure tooutsiders. For instance, PRA can demonstrate how availability of useful species isnot simply a function of their abundance per area (as measured in scientificbiodiversity assessments) but also of the many factors that limit access toresources, such as tenure rights, seasonality or proximity to roads or paths.
During the 1990s, a great deal of research effort was put into applying theprinciples of PRA to economic valuation techniques (see Section 5.4 below) inorder to evaluate the total value of goods and services provided by biologicalresources to local people. The rationale was that formal methods tend to ignorethe wide suite of goods and services that are not marketed in the monetaryeconomy (dubbed the “hidden harvest” by Guijt et al. 1995) and the multiplevalues co-existing within a single community. The new participatory valuationsnot only incorporated a wider range of biodiversity and functions ofbiodiversity, as valued locally, but also drew attention to some of theshortcomings of conventional economic assumptions, for example thathouseholds seek to maximise economic welfare, rather than, say, socialobligation (Guijt and Hinchcliffe 1998). Put to best use, PRA techniques are ameans of empowerment, for example by giving communities tools to track thesustainability of local development (Lee-Smith 1996).

Integrating global and local values
36
Of course, PRA also has several limitations. Direct comparison betweenquestionnaire-based and participatory valuations suggests that many of theclaims made for PRA, such as its superior capacity to capture real behaviourand attitudes, are overstated (Davies et al. 1999). Another important problem isthat while PRA expresses data in an easily accessible, often visual, format,national-level policy-makers can find micro-macro linkages difficult to makefrom what appears as very locally specific information. To date participatoryvaluation has focussed on individual resources, treating biodiversity as the sumof these rather than as the added value of variety and variability. A further needmight be to elicit to what extent this bias reflects local perceptions ofbiodiversity and, if appropriate, to develop PRA methods for discussing thevalue of diversity itself.
5.4 Economic valuation methodsIn recent years economic valuation techniques have become sophisticated toolsfor comparing and evaluating goods and services from biological resources, withparticular emphasis on valuation of non-marketed benefits. There are five broadtypes of approach (IIED 2001):
market price valuation, including estimating the benefits of subsistenceproduction and consumption;surrogate market approaches, including travel cost models, hedonic pricingand the substitute goods approach;production function approaches, which focus on biophysical relationshipsbetween forest functions and market activities;stated preference approaches, mainly the contingent valuation method andvariants; cost-based approaches, including replacement cost and defensive expenditure.
These techniques are useful for assessing biodiversity in terms of individualbiological resource values. Each technique has a suite of advantages anddisadvantages, beyond the scope of the present discussion, but all in all theyprovide a flexible approach to assessment of local values attached to varioustaxa (e.g. Grieg-Gran et al. 2002) or to various goods and services provided byone taxon (e.g. Lynam et al. 1994). There are several strengths of these types ofeconomic valuations as assessments of local biodiversity values. They giverelative estimates of value that permit comparisons of resources within sites andamong sites. By assigning monetary values to non-marketed values they allowdirect comparisons among different goods and services. The use of monetary

An issues paper
37
terms also facilitates communication to a wide audience, including local people,though to many people to express a cultural value – say the value of a group oftrees as a social meeting place – in monetary terms is meaningless. Anotherweakness of these techniques for assessing biodiversity is low cost-effectivenessin terms of time and required expertise. Also these tools have not been wellapplied to biodiversity in its strict sense, meaning variety and variability.
Biodiversity with this strict meaning is usually classed by economists as beingexclusively an option value (Aylward 1991; IIED 2001). Future options arebased on utilisation in the pharmaceutical and agro-chemical industries. In anunusual example of economic assessment of the added value of diversity on topof the underlying biological resource value, the biodiversity value of Indonesianforests has been calculated in terms of their pharmaceutical bioprospectingpotential based on estimates of the number of plant species in the country,probability of any single species providing a commercial drug and averageroyalties earned from new drugs (Aylward 1995).
5.5 Multidisciplinary landscape assessmentsA major initiative to improve methods of assessing biodiversity in terms of localvalues, and of expressing express this information in ways useful togovernmental decision-makers, is presently underway at the Centre forInternational Forestry Research (CIFOR). The central premise is the same as thecentral premise of this study: that biodiversity assessments are predicated onparticular value systems. Thus practical methods of assessment require moreexplicit attention to what is important to whom and how to weigh upalternative land use options in terms of these values.
“Many biodiversity scientists claim that policy-makers ignore their research. Theremay be a number of reasons, but perhaps the most important is that the policy-makers do not see why it matters. The research described here is based aroundthe development of a new paradigm that explicitly recognises the value-ladenaspects of real world decision making. We cannot just record species, formationsand sites and expect that to be useful, we need to indicate the relevance of thisinformation and how it might be weighed against other considerations.”
Sheil (2000)
As a start to developing appropriate methods of local valuation, amultidisciplinary case study is underway at Paya Seturan village in Bulungan,Indonesia (Sheil 2000). The researchers aim to derive what they term “decisive

Integrating global and local values
38
information” about biodiversity, meaning information that is feasible to obtainand that reduces the level of uncertainty in decision-making. The study hascombined a short technical biophysical assessment (e.g. soil samples) to give abasic characterisation of the environment with a holistic set of qualitative andquantitative assessments of how the natural landscape is used and valued by local people. Innovative methods are emerging from the research. For example a classic PRA group ranking exercise – in this case ranking a number of forestspecies (both plants and animals) under various use categories – was combinedwith a statistical analysis for salience (Smith’s S). This technique can give a rangeof useful outputs, such as overall values of the forest for different uses and therelative values of different landscape types. The results from Paya Seturanrevealed that forest products were used for subsistence while most cash incomecame from non-forest products, but that people did not value the forest belowother landscape types.
The study has also identified some key unsolved methodological challenges, such as:
A way to measure the accessibility of productsA way to measure the scarcity of productsA way to measure the frequency of use of productsA way to measure the quantity of a product (i.e. how much product can beharvested from an individual plant)How to weight species, products and landscapes according to their importance
This pilot study illustrates that there is great possibility for novel approaches toassessing biodiversity in usefully value-specific terms. At the same time therationale for the CIFOR study is a reminder that we have a long way to go before we arrive at an adequate array of methods for cost-effective, reliable andpolicy-conversant assessments of local biodiversity values.

An issues paper
39
Not much literature is available on how people assess local biodiversity forthemselves. This would not normally be remarkable – why should localassessments of local conditions be of interest elsewhere? – but in the modernworld, as territory becomes more hotly contested (e.g. locations of protectedareas or commercial activities like mining), local residents need increasingly todefend their own values against outside threats. Many rural people, especiallythose living outside the cash or market economy, are very much reliant on diversebiological resources to fulfil their nutritional, productive, health, clothing,housing, social and spiritual needs. Local biodiversity assessments occur as partof normal livelihood routines, as rural people gather practical information on thecurrent and future availability and health of the different resources they require.The CBD and other processes are also realigning towards greateracknowledgement of local understandings of and priorities for biodiversity.
Section 5 reviewed some of the most promising methods for outsiders to assessbiodiversity in terms of local values. This section considers how localpractitioners have assessed biodiversity in real situations, either on their own –as in the case study of the Irula people of India – or in collaboration withoutsiders. Local biodiversity assessments may not be recognised as such. Giventhat the word “biodiversity” is a relative newcomer to the English language (itdid not get listed in the Concise Oxford Dictionary until 1995), describing anddiscussing biodiversity assessment activities at local level – especially in othercultures and other languages – can seem paradoxical. However, whilst directtranslations of biodiversity do not yet exist in all languages, this does not meanthat the notion of biodiversity has not been pertinent and prominent for manyother cultures and societies for many years (e.g. Box 12).
Local-level biodiversityassessment6
6. This section is based in large part on a case study of biodiversity assessment in India by Bansuri Taneja,Ashish Kothari and Manju Raju.
6

Integrating global and local values
40
6.1 Assessments by the Irula people7
The Irula hunter-gatherers, a semi-nomadic tribe living in the plains of Northernand Eastern parts of Tamil Nadu, South India, have traditionally depended onforests for their entire livelihood needs. Living in small groups on the outskirtsof other villages and renowned for their snake catching skills and their ability totreat snakebites, they are often landless and lie low in the socio-economichierarchy. The following statements demonstrate how they continually assess(mainly wild) biodiversity, and the indicators they use in the search for thebiodiversity they use.
“We decide on where to settle down (near which village or forest) afterassessing the area from our livelihood point of view.”“When I enter the forest I will, at a first glance, look for medicinal plantsbecause collecting them for treatment and sale is my means ofsustenance. I then look for snakes … and then other animals (rats,rabbits, mongoose, etc.) that I can catch for food. There is no uselessplant in these forests. Those not used for anything else can always beused for fuel.”“When in a forest, I will first look for rabbit, mongoose, wild cat, whichI hunt for food and money. We look for tracks/pug-marks of theseanimals. By the frequency of their spotting we know the extent of theiravailability; by the kind of vegetation in the forest patch we know whatwe can get there. For example, we can find rabbits near a patch ofarugampullu (a kind of grass). We also keep in mind the medicinal plantsthat we have seen, so that we can collect them when needed.”
As nomads, the Irulas must make continual “biodiversity” assessments of newterritory, as follows:
7. This case study is based on interviews held during a brief visit to the Irula Tribal Women’s Welfare Society(ITWWS), aimed to investigate how they assessed biodiversity themselves.
Box 12. A view of biodiversity among the Yoruba people of NigeriaThe “principle of asuwada” [is] the purposive clumping of diverse “iwa” (iwa referringto existence, being, character). Iwa refers to diverse different creatures and also to thediversity of people; iwa are maintained, however, by asuwada, “purposive clumping”into communities that is a fundamental condition of their existence.
Source: quoted from Guyer (1996), from original work by Akiwowo (1986)

An issues paper
41
“We would always use the picture we have in our minds of the forest weusually frequent in order to assess the new forest. For example, in thehumid forests of Kutralam (we visited) we found more greenery andvegetative growth. But the plants in our area have a stronger medicinalcontent.” “After getting married, I moved to my husband’s village. During my tripsto the forest I would keep observing, which plants are available andwhich are not, by comparing with the forests I frequented from myparental home.”
They also study species interactions in order to identify other species with usevalues or to assess the condition of the ecological services necessary to supportthem. For the Irulas:
“We get to know which plant grows where by keenly observing animalsthat use them. For example, the mongoose knows where to findmedicinal plants that are used to treat snake bites.”“Those of us who catch snakes can identify species from tracks,droppings and shed skins and trace them to their burrows. We also lookout for typical sounds made by other animals as clues to locate snakes.”
For others it is about improving understanding about future options, asidentified below by Shivram Duga, a resident of the village of Mendha Lekha,Maharashtra State in India. This sort of assessment for future use purposes isperhaps closest in its underlying motives to some of the assessmentsundertaken by conservationists today, focussed on the option and bequestvalues of biodiversity.
“Very often forest officials think villagers are thieves of forest resourcesbecause they like to roam around in the forest. If a villager has to passthrough the forest, as a habit, he will never just follow the road andcome back without having seen much else. Being in the forest is aquestion of survival, our eyes are always open, we are taking ineverything: new things that have come up; what has been cut; what hasbeen planted. This is because next time when we need something fromthe forest we won’t go looking for it then, we would already know wherewe can get the best deal and all we would have to do is go and get it.”

Integrating global and local values
42
6.2 Joint assessmentsSometimes local level assessments have been carried out as a joint effort withoutsiders. While researchers are endeavouring to improve the process of thesekinds of joint evaluations into more thoroughly participatory biodiversityassessments (Section 12.2), experience on the ground remains scattered. Forinstance, wild biodiversity might be jointly assessed at the start of a community-based conservation initiative, or to measure during the implementation of theinitiative, to measure progress. Agricultural biodiversity may be measured toassess whether it poses a threat, as with pests and diseases, or a benefit, such asnew crop varieties with attractive characteristics.
One example of this sort of agrobiodiversity assessment was carried out by theDeccan Development Agency (in collaboration with IDRC) in two districts ofAndhra Pradesh in India. A detailed study on farmer perceptions of agriculturalbiodiversity was undertaken to better understand reasons for its disappearanceand to use this information to develop strategies for conserving agro-biodiversity. The study revealed that an appraisal of the characteristics of
Box 13. Songs of the IrulasThese songs are often sung when we move in groups through the forest, hunting orgathering food or other useful items.
….about the different trees in the forest, and why the messenger has not eaten its fruit….about the different birds we see in the forest and they trees on which they perch….while we collect honey in the forest we sing about the varieties of honey we can find….about the interdependence of different elements of nature (including us ashuman beings)
It is important to note that the methods used by local people to gaininformation about biodiversity and the surrounding environment have evolvedthrough extended processes of observation, testing and use, much in the waythat modern science developed. They build on rigorously studied and finelytuned collective knowledge that has been handed down through thegenerations. For example, the transfer of knowledge from the observation andassessment of biodiversity is so integral to the Irulas lifestyle that it istransmitted through their folk songs, articulated in Box 13.

An issues paper
43
Box 14. Exploiting ecological niches and fulfilling differentlivelihood needs with crop diversity
Different crops suit different soil types, e.g. chickpea, safflower and winter jowarare grown on black soils, pearl millet, monsoon sorghum, niger, horsegram, drysown paddy and little millet are grown on less fertile soilsSome crops mature earlier than others thus helping maintain regular food crop pro-duction throughout the year, e.g. gareeb jonna matures earlier than other varietiesof sorghumPlanting different varieties of the same crop can allow two or more harvests to takeplace during a year, e.g. green & black gramsThere are crops that rejuvenate soil fertility, e.g. niger Or which do not require weeding, e.g. niger and sunhempThere are crops which help ward off/reduce pest incidence, e.g. mustard, marigoldand others which are prone to pest attack, e.g. pigeonpea, field beans and lablabOthers help prepare the land and soil for the next crop, e.g. green manure cropssuch as sunhempThe existence of diverse crop species also enables different livelihood needs to befulfilled, e.g. Bishop’s Weed for income; sorghum and pulses for pod mix/straw/dryfodder; pigeonpea for thatching/fencing material and fuelwood; amaranthus andsunhemp for fibre; safflower for oil; mustard for medicinal purposesSome store well but require more labour for processing, e.g. foxtail millet, kodomillet and little millet Different crops are appropriate for different festivals, e.g. pyalala jonna and foxtailmillet are austere seeds used as offerings to salute the snake and to respect depart-ed ancestors respectively, while peanuts and chickpeas are rich seeds used tocelebrate the new year and other joyous occasions
Source: Taneja et al. 2001
various seeds, no doubt learnt through long-term uses of these seeds, led to eachvariety being imbued with particular significance. For example, specific grainsassume importance in different festivals (Box 14).
As a reaction to the Green Revolution and the dependence on singular varietiesof rice that it imposed on farmers, the Save the Seeds Movement, based inHemvalghati, Uttar Pradesh in India, started to document and conserve (both bystorage and by bring the seeds into cultivation) the agricultural diversity of thearea in the early 1990s. Members of the Movement travelled throughout theUttar Pradesh Himalayas, carrying out assessments of agrobiodiversity in orderto identify traditional varieties and the areas where they were still activelycultivated. By the mid-1990s, 126 varieties of rice, 8 of wheat, 40 of fingermillet, 6 of barnyard millet, 100 of common beans and 8 of traditional soybeanand 10 of French beans were once again being cultivated in the region.

Integrating global and local values
44
6.3 Peoples’ Biodiversity RegistersThe Biodiversity Conservation Prioritisation Project in India instituted a seriesof People’s Biodiversity Registers (PBRs) across seven states in India in the late1990s, in one of the first formal approaches to integrating local knowledgeabout biodiversity with more standard techniques. PBRs are called people-centred assessments, in that while they were initiated locally, they were carriedout in close collaboration with local people, and the outputs were madeaccessible to as wide an audience as possible (Gadgil et al. 2000). The aims ofthe PBR exercise were firstly to transfer biodiversity knowledge, from both localpeople and professional biologists, into the public realm, secondly to informstate and national level conservation policy (especially the Biodiversity Strategyand Action Plans) of local people’s views and natural resource managementpractices, and thirdly to regenerate faith in local wisdom and local capacity forself-governance.
PBRs followed the same basic format at all sites. Taking a broad view ofbiodiversity, information was collected under the following headings, mainlyduring village meetings:
Peoplescape: Local people were divided up into social classes based on theirbiodiversity use (“primary” e.g. hunters and fishers, “secondary” e.g. rubberplanters and land-owners, “non” e.g. road builders and potters). Genderdifferences, seasonality and influence of outsiders were also considered.Individuals with specialist knowledge in the community were identified.Lifescape: The local landscape was classified by use. Species lists were
Another attempt at incorporating community stakeholders’ perceptions andassessments in formal monitoring of forestry operations is being conducted bythe International Network on Ethnoforestry at the Indian Institute of ForestManagement. A course – Measures of Success for Sustainable Forestry – hasbeen developed for various representatives of community, government forestdepartments and voluntary agencies working in sustainable forestmanagement in south Asia. The course aims to improve participants’understanding of criteria and indicators that can measure progress towardssustainable forest management and also to equip the participants withparticipatory design and field application skills. It remains to be seen howeffective this attempt will be in achieving this and whether or not it canintegrate local and global level interests.
An issues paper
45
collected from group meetings (plants, birds, mammals, reptiles, amphibians,fish) and from professional surveys. Social class values attached to variousspecies were mapped out and the overall 30 most important species listed. Ecological history: Time line and maps of major trends and events in land usewere drawn out.Development aspirations: Local trade-offs between development andbiodiversity were analysed.Institutions: Key decision-making bodies and mechanisms for resolving socialconflicts and building consensus (e.g. between rich and poor and betweenlocals and outsiders) were noted.Management options and action points were devised, identifying speciesconsidered too abundant (e.g. Bonnet monkeys, wild boars and fruit bats) aswell as those that are rare.
PBRs attached biodiversity values to individual species, rather than at broaderecological scales or in terms of the value of variety or variability. Nonetheless, a broad view of value was taken, incorporating subsistence, cultural, religious,commercial, environmental, ethical and medicinal values, and treating wild andagricultural biodiversity equally (Bhatta and Bhat 1997). In general, the 30species rated as most important were valued for their economic importancerather than cultural, religious or subsistence values.
The PBR process illustrates the difficulty of attempting assessments that are aimfor as much local determination as possible, but also a workable level ofstandardisation and comparability across sites. For example, reports of PBRsfrom two different villages (Achar 1997; Bhatta and Bhat 1997) both stated, “A need was felt to gradually standardise the local nomenclature so thateventually every patch had a name which indicated both its geographicallocation as well as ecological habitat type”. Clearly this need was felt not somuch by local people as by the external facilitators of the PBRs! Amongvillagers involved in these PBRs, most felt excluded from decision-making overland management, but unable or unwilling to suggest alternatives within thePBR process.
Along the same tack, proponents of PBRs draw attention to the high valueboth of indigenous knowledge and of making knowledge public. Localresource users may find more of conflict than synergy between these two goals.For instance, Chatterjee et al. 2000 found that villagers in Arunachal Pradesh

Integrating global and local values
46
declined to participate in a local PBR through fear that surveying their landwould lead to occupation of the land by government. Joint assessments may beuseful for collating information and even for capacity-building, but they do notusually make much progress in tackling the real challenges to self-determination faced locally.

An issues paper
47
The last decade has seen a surge in international agreements and policy processesthat address biodiversity. Several of these stipulate biodiversity assessment, eitheras an essential activity for signatories (e.g. the Convention on BiologicalDiversity), or as a selection process for inclusion within the terms of theconvention (e.g. the World Heritage Convention). Other international processesthat have a broad developmental focus include biodiversity assessment as ameasure of environmental sustainability at the national level (e.g. Commission on Sustainable Development). Whatever their aim, most of these ongoingcaucuses have endorsed indicator-based methods of biodiversity assessment.
7.1 Convention on Biological DiversityArticle 7 of the Convention on Biological Diversity (CBD) calls explicitly forparties (national governments) to assess biodiversity (Box 15). Other articles,specifically 8(j), 12 (a), 25 and 26 also refer to biodiversity assessment, albeit less directly, for example by referring to the need to maintain relevant indigenousknowledge. Overall, these articles stipulate the need for the identification andmonitoring of: biodiversity, activities that are likely to have significant adverseimpacts on biodiversity, and progress on implementation of the conservationmeasures of the CBD and the effectiveness of these measures.
Biodiversity assessment byinternational policy-makers
Box 15. Article 7 of the CBD: Identification and MonitoringEach Contracting Party shall:a. Identify components of biological diversity important for its conservation and sus-
tainable use having regard to the indicative list of categories set down in Annex I;b. Monitor, through sampling, and other techniques, the components of biological
diversity identified pursuant to subparagraph (a) above, paying particular attentionto those requiring urgent conservation measures and those which offer the great-est potential for sustainable use;
c. Identify processes and categories of activities which have or are likely to have sig-nificant adverse impacts on the conservation and sustainable use of biologicaldiversity, and monitor their effects through sampling and other techniques; and,
d. Maintain and organise, by any mechanism data, derived from identification andmonitoring activities pursuant to subparagraphs (a), (b) and (c) above.
7

Integrating global and local values
48
Under the terms of the CBD, a liaison group of experts has been workingtogether over a period of years to develop a core set of indicators of biodiversityto guide policy-makers (Box 16; CBD 1997). The originally suggested set ofcore indicators aimed to respond to multiple levels: genes and species, andforest, marine, coastal, inland water, dryland, mountain and agriculturalecosystems. Many parties considered it premature to establish a proposed coreset of biodiversity indicators (CBD 1999). This reluctance could be amanifestation of the political concerns inherent in biodiversity assessment andthe indicators selected: individual countries were perhaps reluctant toparticipate in what could be construed as a “league table” of biodiversity statusand protection, which was in itself based on various assumptions and a veryrough approach to what is best for biodiversity. It is also likely that mostcountries could not dedicate sufficient resources or capacity to carry out theextensive assessments that the indicators proposed would require.
Annex I includes:1. Ecosystems and habitats: containing high diversity, large numbers of endemic orthreatened species, or wilderness; required by migratory species; of social, economic,cultural or scientific importance; or, which are representative, unique or associatedwith key evolutionary or other biological processes.2. Species and communities which are: threatened; wild relatives of domesticated orcultivated species; of medicinal, agricultural or other economic value; or social, scien-tific or cultural importance; or importance for research into the conservation andsustainable use of biological diversity, such as indicator species; and, 3. Described genomes and genes of social, scientific or economic importance.
Box 16. The 1997 CBD core set of indicators: a state-pressure-response approachThe Conference of Parties (COP) chose to develop a two-track approach to biodiversityassessment: the first track considers existing and tested indicators of state and pressures related to the conservation and sustainable use of biodiversity; the secondtrack should consider the identification, development and testing of responseindicators for the three objectives of the CBD.
Those related to pressure should measure: The most important direct and indirect threatsWhether these primary threats to biodiversity stable, declining or worsening?The nature of linkages between primary threats and changes in biodiversity status?
Proposed indicators: habitat loss, overharvesting, species introductions, pollution andpotential climate change.

An issues paper
49
Instead, parties requested the liaison group to develop a set of key questions andguidelines for national monitoring, plus a menu of existing and potentialindicators, all of which had to take account of the Ecosystem Approach adoptedby the Convention. COP 5 (the fifth Conference of the Parties) adopted asimilar decision, and urged the GEF to fund projects that enable countries tostrengthen capabilities to develop monitoring programmes and suitableindicators, but there has been very limited progress on this to date – at present,a menu of possible indicators is being circulated among the parties. This meansthat the requirement for actual assessment of biodiversity by nationalgovernments continues to be delayed.
While the CBD is a slow machine, especially in terms of operationalisingagreements, what it does offer is a widely known and respected model forunderstanding and evaluating biodiversity in a way that gives credence tomultiple values. The Ecosystem Approach of the CBD, as discussed in Section2.2, offers a broad set of principles to guide both assessment and decision-making over biodiversity at national and sub-national levels. The EcosystemApproach explicitly advocates negotiation and acknowledgement of trade-offsamong different biodiversity values, with decision-making vested at the lowestappropriate local scale. These principles could provide a suitable framework forgovernments and civil society groups, if and where they are able to overcomeinstitutional and resource constraints and implement thorough systems ofbiodiversity monitoring and evaluation (discussed further in Section 12.4).
7.2 Natural Heritage (World Heritage Union)Over 160 countries have ratified the World Heritage Convention, which wasadopted in 1972 to “provide for the protection of those cultural and natural
Response indicators should answer questions such as: How much capacity there is to implement the Convention How much financial support and incentives are currently provided by Parties toimplement their commitments under the CBDHow much financial support is provided by developed country to developingcountry partiesWhat additional means are still needed to address the threats
Proposed indicators: habitat management (e.g. %protected), special habitat (e.g. % remaining and % protected) and financial resources.
Source: UNEP/SBSTAA/3/9 10 July 1997 Recommendations for a core set of indicators of biological diversity.

Integrating global and local values
50
properties deemed to be of outstanding universal value”. Types of “naturalheritage” sites worthy of protection are defined as the following in Article 2 ofthe World Heritage Convention:
Natural features consisting of physical and biological formations or groups ofsuch formations, which are of outstanding universal value from the aestheticor scientific point of view.Geological and geographical formations and precisely delineated areas thatconstitute the habitat of threatened species of animals and plants ofoutstanding universal value from the point of view of science or conservation.Natural sites or precisely delineated natural areas of outstanding universalvalue from the point of view of science, conservation or natural beauty.
In principle, a site is inscribed on the World Heritage List if it satisfies at least fourof a list of criteria, as well as compulsory conditions of integrity (Box 17).However, in practice, many inscribed sites meet only two criteria. Roughly 60 %of nominations for “natural heritage” sites attain World Heritage status. Sites arenominated by national governments, but evaluations of the suitability ofindividual sites are carried out by the Protected Areas Programme of the WorldConservation Union (IUCN) and then sent on to the World Heritage Bureau forreview. The evaluation process involves five elements: data assembly, external
Box 17. Quality indictors used for assessing the importance of aproposed World Heritage site
Distinctiveness. Does the site contain species/habitats/physical features not dupli-cated elsewhere? There is nowhere, for instance, that is comparable to Uluru inAustralia, which is not only a natural site but also a cultural landscape.
Integrity. Does the site function as a reasonably self-contained unit? This is a keyfeature for biologically important areas such as the 5 million ha Salonga NationalPark in the Democratic Republic of Congo.
Naturalness. To what extent has the site been affected by human activities? TheNahanni World Heritage site in northern Canada is obviously a landscape wherenature dominates and where human impact has been minimal.
Dependency. How critical is the site to key species and ecosystems? The KomodoNational Park in Indonesia is an example of a site where 95% of the world’s popu-lation of Komodo dragon occurs.
Diversity. What diversity of species, habitat types and natural features does the sitecontain? Sites like Sian Ka’an in Mexico with a combination of marine, coastal andforest habitats along with cultural values are usually more favourably received thansingle feature sites.

An issues paper
51
review, field inspection, panel review (within IUCN) and final recommendations. It is not clear whether broader participation is sought from local or at least regionalexperts, nor is it clear which are the relevant local and national authorities.
World Heritage sites must of “outstanding universal value”. Therefore, criteriaand indicators used to select and evaluate a site are more likely to incorporateglobal values, as these should correspond most IUCN and the World HeritageBureau’s notions of universality. Advocacy groups that have most access to thesefora will have the greatest influence over what is treated as being of “universal”value. Whether or not these groups represent a sufficiently broad base of opinionis a moot point. Of course, it could also be argued that as any new nominationcomes through the national government, this part of the process should providespace for national interpretation of “outstanding universal value”, and nationalpriorities should represent the priorities of its citizenry, but without clearprocedures for participatory decision-making, this is unlikely to happen.
7.3 Commission on Sustainable DevelopmentThe Commission on Sustainable Development (CSD) is developing Indicators ofSustainable Development (ISDs) in response to Agenda 218. The aim of thisinitiative was to have an agreed set of indicators available for all countries to useby 2001. Chapter 15 of Agenda 21 refers directly to “conservation of biologicaldiversity” and the chapters on oceans, freshwater, agriculture and forests alsopoint to relevant indicators (Box 18). So far a working list of 134 indicators andrelated methodology sheets have been developed and are intended to be testedvoluntarily at national level as a complement to national reporting on the state of the environment.
8. Agenda 21 is a comprehensive plan of action to be taken globally, nationally and locally by organizationsof the United Nations System, Governments, and Major Groups in every area in which human impacts on theenvironment, It was adopted by more than 178 Governments at the United Nations Conference onEnvironment and Development (UNCED) held in Rio de Janeiro, Brazil, 3 to 14 June 1992.
Box 18. Suggested indicators for Chapter 15 of Agenda 21a. Threatened species (all endangered, vulnerable, rare and indeterminate species asregistered in the IUCN red books) as a percent of total native species. With four sub-indicators:i. % threatened vascular plant species, total all classes;ii. % threatened species within each vascular plant class;iii. % threatened vertebrate species, total all classes; and iv. % threatened species within each vertebrate class.
b. Protected land area as a percent of total land area; protected marine area as apercent of total marine area.

Integrating global and local values
52
These indicators potentially set up the kind of “league table” that signatories to theConvention on Biological Diversity have been trying to avoid. Therefore no targetshave been set internationally – rather it is up to individual countries to set their owntargets. Indicator (a) focuses entirely on the species level of biodiversity and onglobal rarity. The straightforwardness of the sub-indicators (simple percentages) is astrength, but masks the heavy investment of skills and time needed to inventory rarespecies. Indicator (b) has been chosen because “protected areas are an essential toolfor ecosystem conservation, with functions going well beyond the conservation ofbiological diversity. As such, they are one of the building blocks of sustainabledevelopment.” Clearly the usefulness of this indicator depends on classifyingprotected areas according to the levels and types of human uses that are allowed.
7.4 International Development Goals (DAC/OECD)The international development goals of the Development Assistance Committee(DAC) of the Organisation for Economic Cooperation and Development (OECD)emerged from a series of UN Conferences held in the 1990s. They are designed aremilestones against which progress towards poverty elimination can be measured.The “Environmental Sustainability and Regeneration” goal requires that “thereshould be a current national strategy for sustainable development, in the process ofimplementation, in every country by 2005, so as to ensure that current trends in theloss of environmental resources are effectively reversed at both global and nationallevels by 2005.”
Several indicators, against which countries should measure progress towards thisgoal, have been identified. For biodiversity the indicator is “% land area protected”.The DAC / OECD intends to improve this indicator by “scoring the importance ofthe areas protected and level of protection in force.” Criteria by which protectedareas will be selected for their “importance”, or what “level of protection” actuallymeans, has not been clarified. Some experts would for example argue thatprotection is more effective where local people are allowed to reside within theprotected area, others would argue the contrary. However, the wording seems toimply that “levels of protection” should be taken to mean levels of non-use.
At an international level, the percentage of land area protected in a country isperhaps the most popular biodiversity indicator. While protected areas are indeedimportant havens of biodiversity, alone they cannot achieve every necessary aspectof biodiversity conservation. Other measures that encourage conservation across the productive landscape need to put in place, such as the sorts of incentives andtechnologies that will facilitate the integration of biodiversity objectives intoagriculture, forestry or fishing. Associated with this is the need to develop indicatorsthat are able to measure progress towards integrating different biodiversity valuesacross the landscape.

An issues paper
53
Bilateral donors usually build consideration of biodiversity into both pre-implementation planning and post-implementation review of their programmesand projects in partner countries. A common feature is that the term“biodiversity” is used very broadly, but practitioners and assessors are givenlittle guidance as to how it might be evaluated in more detail. This leaves theterm open to wide interpretation, which can lead to confusion. Tackling some ofthe conflicts between biodiversity and development, by identifying ways oflinking these two objectives in a mutually supportive way, remains undevelopedwithin the assessment methodologies of agencies surveyed. However, donororganisations are fairly flexible for institutions of their size, and severalexamples exist of efforts to make biodiversity assessment more cost-effective,straightforward, representative and mainstreamed into policy and practice.
8.1 Swedish International Development CooperationAgency (Sida)Currently, biodiversity assessment within Sida occurs as part of theirEnvironmental Impact Analysis (EIA) process. Sida’s EIA guidelines contain aseries of checklists that include questions on biodiversity (Sida 1998). It is worthnoting that Sida has had the foresight to ask questions relating to impacts ongenetic diversity – a rare feature in other donors’ EIA guidelines or screeningchecklists. As part of Sida’s EIA, consideration is also given to how the proposedactivities relate to the partner country’s environmental legislation and itsresponsibilities under the biodiversity-related conventions and agreements.
Sida also has guidelines for “Strategic Environmental Analysis” at country levelto be used during the “Country Strategy” process (Sida 2000). These guidelinespresent a series of questions that aim, for example, to ask questions on theinteractions between poverty and the environment. Some of the questions havean indirect bearing on biodiversity, which non-specialists may easily overlook.The only guidance on assessing biodiversity is found in the appendices, where amenu of suggested environmental indicators is provided. Those relevant tobiodiversity are two environmental status indicators – threatened species (% of
Biodiversity assessment bybilateral donor organisations
8

Integrating global and local values
54
the total number of species) and protected areas (% of country’s total surfacearea) – and one response indicator – whether the country has signedinternational agreements on biological diversity.
Sida are eager to improve their practice with respect to biodiversity.“Mainstreaming of Biodiversity at Sida” is an ongoing process that aims forofficers to build their understanding and develop the tools they need to ensurethat biodiversity is mainstreamed in all projects and programmes. Acomprehensive review of internal experience and attitudes provided thefollowing better practice recommendations (Bystrom 2000):
EIA– especially its sectoral approach – is a suitable entry point for biodiversityassessment. However, it cannot go into too much detail without becomingoverly complicated. Analysis must therefore be kept fairly broad to beworkable.
Existing checklists could be improved by assessing how biodiversity changesover time, the impact of interventions on ecosystem function, acknowledgingdifferent stakeholder perspectives and values, and a measure of how differentstakeholders’ understanding has improved (Box 19).
Tools developed should reflect the different requirements of different levels ofadministration within Sida. This will help improved internal understanding.
Monitoring at project/programme level needs to be:simple hence cost/effective, manageable and replicable;based on local knowledge;an integral part of the programme monitoring system.
Indicators need to simple, locally based and closely linked to the objectives ofthe programme/project.

An issues paper
55
Source: Bystrom 2000
Box 19. Suggested improvements to the Sida EIA checklist Existing questions for the agriculture and forestry sector:Does the proposed project or programme:1. Exploit or substantially change important or sensitive ecosystems (for example areas
which are covered by natural vegetation), or restore such ecosystems?2. Reduce natural biodiversity through threatening plant or animal species, or increase
diversity by supporting and protecting ecosystems and species?3. Encourage or discourage local sustainable use of wild and cultivated biodiversity,
local animal and plant breeding and the development of knowledge of local biodi-versity?
4. Contribute to or counteract the introduction of new species in areas where they donot belong naturally?
5. Result in a greater or smaller risk that plant and animal diseases are spread to culti-vated or wild species?
6. Result in a greater or smaller risk of the spread of transgenic organisms or genesfrom such organisms?
Suggested changes:Adapt no. 3 to “encourage or discourage local sustainable use of natural and agro-biodiversity.”Delete nos. 1 and 2 as these are very static and one-sided views of the dynamics ofbiodiversity.Delete no.4 as it is impossible to say whether a species naturally belongs to an areaor not and what the impact of a new species on the environment might be.
Suggested add-ons:Directly relate to biodiversity and biosafety?Adhere to the relevant local, national and/or international policy and legislation forbiodiversity or biosafety?Substantially contribute to capacity building among stakeholders towards partici-patory management of biodiversity and biosafety?Enhance the local and national knowledge based on the different domains of bio-diversity and biosafety?Have, provide or improve the access to knowledge bases for all stakeholders?Elaborate agreed protocols on biodiversity issues for the respective stakeholders?Strengthen or weaken, over time, the functional relationships between and withinthe different domains of biodiversity?

Integrating global and local values
56
8.2 UK Department for International Development(DFID)DFID assesses potential impacts on biodiversity that might result from proposedprojects through its Environmental Assessment (EA) procedure. This procedureis supposed to help identify constraints and opportunities for projects at thescreening stage. Screening involves assessing the proposed project against thechecklists listed in the DFID Environmental Guide (DFID 1999), which includesome questions related to biodiversity (Box 20). These questions focus mainlyon assessing whether or not the project might have negative impacts onbiodiversity. There are no questions that could help identify any potentialdevelopment or livelihood opportunities that could arise from biodiversity as aresult of the proposed project, despite the fact that DFID has made significantrecent efforts to turn their EA procedure into more of an opportunity seekingexercise. The questions do not directly address the conflicts between biodiversityconservation and development objectives, and the assessor is left withcomplicated task of finding suitable trade offs him/herself.
Box 20. Specific references to biodiversity in the screeningchecklists of the DFID Environmental GuideA. Environmental features
Identify aspects of the environment that are particularly sensitive, important orvaluable e.g. semi-arid areas and desert margins; mountainous areas; moist or drytropical forest (especially primary forest); wetlands; small islands; coral reefs andseagrass beds; rivers and lakes etcHabitats providing important resources for vulnerable groupsNational parks, nature reserves and protected areasAreas containing rare or endangered species or high concentrations of biologicaldiversity
B. Development featuresDetermine whether the proposed project/programme is potentially damaging to theenvironment. There is no specific mention of biodiversity here but all these activitieshave the potential to have impacts on biodiversity – whether or not these are always“damaging” cannot always be immediately assumed.
C. Potential adverse and beneficial impactsDetermine whether the proposed project/programme is likely to result in specific envi-ronmental damage. Biodiversity is mentioned only under (i) Water quality “pollutioncontrol can improve water quality, protect biodiversity and improve human health….”

An issues paper
57
DFID also has a Project Information Marker System (PIMS), which is used toassess the policy objectives to which DFID projects contribute. Among the 33possible policy markers (each DFID project over a specified budget must have apolicy marker assigned to it), some are targeted to meet the Rio reportingrequirements, one in particular on biodiversity. The criteria used to decidewhether a project or programme qualifies for a PIMS “biodiversity policyobjective mark” are extremely broad, bringing in planning, capacity buildingand training in addition to conservation (Box 21). All projects that have beenassigned a PIMS policy marker are entered into a PIMS database that enablesDFID to keep systematic information on which projects incorporatebiodiversity objectives.
Box 21. Activities that qualify for a PIMS biodiversity policyobjective mark
Policy and management: preparation and implementation of national plans, strate-gies and studies covering the status, conservation and management, valuation andsustainable use of biodiversity.Capacity building: development of institutional capacity to manage and researchbiodiversity resources.Training (e.g. in plant and animal taxonomy).Conservation: conservation, sustainable management or restoration of habitats andecosystems (terrestrial or aquatic) which may be components of forestry, fisheries,agriculture or wildlife projects as well as projects specifically directed at protectedareas such as national parks or nature reserves or their buffer zones. Also in-situ andex-situ of genetic resources (wild or cultivated species, varieties or land races ofanimals or plants) including on-farm conservation, in-site forest genetic resourceconservation, gene banks, botanical and zoological gardens and through the appli-cation of biotechnology.
(ii) Global impacts “tackling global environmental issues often has localised benefits ...issues include biodiversity…” (iii) Conservation “The protection of wildlife habitats mayprovide benefits for local income and global biodiversity. Issues are loss of species orgenetic erosion and the impoverishment of flora and fauna.”
D. Impact characterisationHelps decide whether the nature or scale of impacts is likely to cause problems: e.g.“What is the scale of the impact, in terms of area affected (off and on site) numbers ofpeople or animals etc.? Are any laws, conventions or regulations likely to be infringed?

Integrating global and local values
58
DFID has also funded various projects where biodiversity assessment hasbeen conducted as a stand-alone activity as opposed to the “gross” screeninglevel approach described above, such as the Biodiversity Assessment inTropical Moist Forests project funded by Forest Research Programme. Thefindings of this research have yet to be adopted and integrated into DFID’sformal procedures.

An issues paper
59
Government departments around the world are rising to the challenge of how to carry out useful and cost-effective surveys of biodiversity in their countries.Assessment of biodiversity does not occur only in response to internationalconventions on biodiversity, but forms part of more general natural resourceassessment and land use planning. Here we look at two such examples frompractice – conservation planning in India and forestry management planning inMalawi – and follow these with a brief review of the World ConservationMonitoring Centre’s guidelines for national level biodiversity assessment.
9.1 National biodiversity assessment in India9
The Botanical Survey (BSI) and the Zoological Survey of India (ZSI) havecarried out exhaustive inventory and taxonomic classifications in India since thecolonial period. A vast amount of information has been collected on the rangeand distribution of certain species. Traditionally this was done with respect tospecific administrative state or district boundaries rather than only in areas ofperceived biodiversity value. BSI and ZSI inventories are now taking place inprotected areas as well, and the two organisations have assembled Red DataBooks for some plant and animal species. However, these types of exhaustiveinventories are on the decline in India.
Today biodiversity management in India is dominated by the concept ofecological equilibrium, meaning the minimisation of all disturbance. Non-useprotected areas are seen as the chief mechanism to put this concept intopractice. However, in most cases, protected areas have been sited ratherarbitrarily, without any formal biodiversity assessment or prioritisationexercises. This raises some serious questions over their ecological integrity andthe relevance of their boundaries. Unwritten criteria that are occasionallyemployed include: presence and (where known) range of threatened species,human settlement patterns and administrative feasibility (i.e. getting theboundaries to follow district or state borders rather than ecological ones).
Biodiversity assessment innational processes
9. This section is based largely on a case study of biodiversity assessment in India by Bansuri Taneja, AshishKothari and Manju Raju.
9

Integrating global and local values
60
The Wildlife Institute of India is campaigning for a better planned andintegrated approach to siting protected areas, but with little success so far.
In terms of ongoing assessments of the status of biodiversity held withinprotected areas, occasional population counts of some mammals and birds arecarried out. But, in general, such census operations in protected areas (which areincidentally the only areas where they are carried out) are not comprehensivenor are they regularly conducted. Usually they are part of some time-boundresearch initiative. That said, some non-governmental initiatives, such as thesurvey of the Bombay Natural History Society, have made a significant andcontinuing contribution to inventories of biodiversity. In recent years“biodiversity assessment” has also come to mean ecological studies of impactsof various factors on protected areas, conducted under the auspices of specificresearch assignments.
Recently a non-governmental organisation undertook an exhaustive biodiversityassessment in India over a period of over two years from 1996 to 1998. Thisexercise – the Biodiversity Conservation Prioritisation Project (BCPP) – resultedin a nationwide prioritisation of sites, species and strategies for biodiversityconservation. Priority taxa were selected at a national workshop, dependingvery much on the availability of expertise in the country. Subsequent analyseswere based on IUCN criteria, but were also revised, as appropriate, in four tofive day Conservation and Management Planning (CAMP) Workshops. TheCAMP workshops were essentially gatherings of experts on particular taxa,who pooled their knowledge according to factors such as locality records,distribution, habitat preferences, threats and perceptions of decline. Much ofthis collated information remains unpublished.
Information on priority taxa for conservation was then used to rank sites forconservation. There was broad consensus that ranking could not be based onbiological criteria alone, and socio-economic values would have to follow as asecond set of parameters. The biological criteria employed – representativeness,uniqueness, naturalness, endemism, richness, rare species, major population,size (and viability of conservation) and connectivity – were considered at alllevels: ecosystem, community, species and genetic. Socio-economic valuesrelating to non-consumptive use were seen as adding to the biodiversity value ofa site, while direct use values were seen as detracting from overall biodiversityvalue. Participants in the ranking exercise pointed out that the dataset used forpriority setting was inadequate and that there is no sense of urgency to design orimplement a standard inventory process.

An issues paper
61
9.2 Malawi National Forestry ProgrammeNational Forestry Programmes (NFPs or nfps) are the most recent incarnationof internationally driven national forestry planning processes, of which previousversions have been National Forestry Action Plans (NFAPs) and TropicalForestry Action Plans (TFAPs). Malawi is one of the first countries in the worldto have embarked on the nfp process (Malawi Ministry of Natural Resourcesand Environmental Affairs 2000). A series of multi-stakeholder working groupshave assessed present challenges and identified ten key strategies, each withprioritised actions, to improve the contribution of forestry to sustainablelivelihoods in Malawi.
The working groups identified clearance of woodland which “threatensMalawi’s considerable stock of biodiversity” as one of the reasons that Malawineeded an NFP. How then did the working groups incorporate assessment ofbiodiversity? The answer is that no appraisal of biodiversity was included. Oneof the ten strategies identified in the resultant NFP document was to manageforest reserves for a variety of services, including conservation of biodiversity –the only further mention of biodiversity in the document. The Malawian foreststakeholders recommended detailed assessment of particular biologicalresources that are central to local livelihoods, for example firewood andcharcoal, but deemed appraisal of biodiversity unnecessary. Essentially, they didnot regard biodiversity as a national priority, although they acknowledgedmaintenance of indigenous biodiversity as an added bonus of certain land usechoices (e.g. forest reserves). For these stakeholders, who represented nationaland local interests, direct use values of biological resources are presently moreimportant than the array of biodiversity values.
9.3 World Conservation Monitoring Centre guidelinesIn 1996 the World Conservation Monitoring Centre published a booklet to“outline approaches suitable for use by less wealthy countries to assess, withreference to socio-economic factors, the status and sustainability of nationalbiodiversity” (WCMC 1996). The WCMC work does not offer any originalmethodology, but rather presents a set of existing methodologies andrecommendations on how to use them. It has not been widely adopted bygovernment departments but is worth considering here, as it is a goodexample of how biodiversity assessment at the national level might balancescientific rigour and inclusion of multiple perspectives, while not beingunrealistically ambitious.

Integrating global and local values
62
The WCMC booklet advocates a dual approach to biodiversity planning, withseparate (but where possible complementary) efforts to maintain first theindirect and non-use values and second the direct use values of biodiversity. Thefocus of maintaining indirect use values is conservation of a desired range ofecosystems (and hence measurable via ecological diversity). For direct use thevalues the focus is specific resources, usually individual species. Suggestions asto how the status and potential sustainability of these two groups might beassessed are pragmatic. Existing information are the recommended basis of anyassessment. The most outstanding information gaps are best addressed via acombination of in-depth case studies and rapid assessments. The WCMCbooklet also suggests what types of assessment are less advisable. For example,although genetic diversity can be of crucial importance, particularly to local useof agricultural resources, scientific inventories are probably not worth the costs(in time, money and skills) that they entail.
Overall, the WCMC guidelines capture the following themes:Trade-offs in biodiversity values among different sectors of society and global,national and local valuesGenetic, species and ecological diversity and the links among themWild and domesticated, marine and terrestrial diversityAssessment of both state and pressure variables Difficulties of measuring ecosystem health and sustainability and hence theneed to apply the “precautionary principle” to maximise conservation effortsNeed for socio-economic data to understand trends in use and threats tobiodiversity

An issues paper
63
As biodiversity is increasingly recognised to have commercial value, so theprivate sector is becoming concerned with how to measure it. In addition, thereis ever more pressure from consumers and governments for companies to showevidence that their operations do not destroy or threaten biodiversity. Thusindividual companies seeking to maintain or create a competitive market sharenow have to concern themselves with assessment of biodiversity. In the timberindustry, for example, the ability to supply certified quality-assured wood allowsaccess to lucrative northern European markets. Both social and ecologicalcriteria are included in the certification process, but the challenge remains ofhow to integrate the two, to include assessment of biodiversity in terms of localvalues. Another initiative, the Race to the Top assessment of supermarketperformance in the UK, is beginning to face the associated challenge of how toincorporate a measure of who bears the cost of biodiversity conservation. Thefinal example given here is of one suggestion of how biodiversity might bemeasured for trading purposes, in terms of “biodiversity credits”.
10.1 Forest Stewardship Council certification Forest certification is an internationally recognised system of assurance toconsumers of wood and wood products that the products that they purchasehave come from well managed forests. The Forest Stewardship Council (FSC)has formulated ten general principles of equitable and sustainable forestmanagement, which forest producers must fulfil in broad terms to achieve FSC-accredited certification. Principle six reads, “Forest management shall conservebiological diversity and its associated values, water resources, soils, and uniqueand fragile ecosystems and landscapes, and, by so doing, maintain the ecologicalfunctions and integrity of the forest.” The text goes on to make specificreference to genetic, species and ecological diversity. Principle nine reinforces theneed to conserve “high conservation value forests”, defined either according tonational priorities or in IUCN-based terms (presence of globally rare, threatenedor endangered species). Local biodiversity values are enshrined in principlethree, which calls for protection of the rights of indigenous people to resources,
Private sector approaches tobiodiversity assessment
10

Integrating global and local values
64
to sites of cultural, ecological, economic and religious significance and tocontrol over indigenous knowledge.
Taken together, the FSC principles support a holistic approach to assessingbiodiversity in forests, incorporating local, national and global values. The FSCdoes not offer guidelines on how to assess whether principles are met – morespecific standards are meant to be set by individual country programmes andcertification bodies, a process still underway (Bass et al. 2001b). In practicethere has been huge variety in how actual certification audits have interpretedand used the principles to assess biodiversity in managed forests. Certificationaudits, perforce limited by time and funding, have taken mostly pragmaticapproaches to “quick-and-dirty” biodiversity assessment. In spite of this andother attempts to keep the costs of audits down, poorer producers andprocessors have largely been excluded from certification because of the highcosts involved, a challenge that the FSC is now tackling with initiatives such asgroup certification (FSC 2002).
To give a flavour of the various approaches, four detailed examples (Annex 1)illustrate how the assessment of biodiversity differs according to how welldeveloped certification and biodiversity assessment methodologies are indifferent countries. Only one of the four case studies was careful to draw inlocal values (Hoopa Tribal Forestry, USA), even though all except Stora-Ludvika(Sweden) clearly involved a high level of dependence of local livelihoods on theforest or agroforestry land. In spite of this, and the fact that little originalmeasurement of biodiversity was carried out, one common positive feature ofcertification audits is an emphasis on measuring biodiversity in terms of desiredoutputs, making the values of different stakeholders explicit.
10.2 Race to the TopThe Race to the Top (RTT) initiative, coordinated by the International Institutefor Environment and Development, aims to assess the performance of Britishsupermarkets on social, ethical and environmental issues (IIED 2002). Theinitiative has established a process whereby the various affected stakeholdersand relevant groups in the UK have identified the critical issues, grouped themand developed suitable indicators. These indicators will provide comparativedata necessary for the benchmarking process, and have been grouped thefollowing areas: animal welfare standards, biodiversity and landscapes,environmental and social performance, management and reporting, labourstandards, public health, regional sourcing and local regeneration, and terms of

An issues paper
65
trade with primary producers. A total of about 21 overarching indicators havebeen identified so far. The intention is to benchmark the major supermarketcompanies annually and to publish the results individually, not as a compositeindex, possibly in combination with case studies of supermarket and supplierbest practice.
The RTT initiative is interesting in the way it has attempted to tackle thecomplex array of issues that surround supermarket policy and practice. Itclearly recognises that raising standards in one area may inevitably causeproblems elsewhere in the system. For example, encouraging supermarkets toensure that their suppliers only acquire products that meet high biodiversityconservation standards may inadvertently harm the livelihoods of farmers, whooften bear the costs of such requirements. Adopting a multi-stakeholderapproach can help circumvent a focus on single objectives, withoutacknowledging how they link up and affect other areas. However, findingsuitable win-win indicators every time is by no means an easy task, given thewide range of issues at stake. Possibly one of the greatest benefits of themultistakeholder approach has been to raise different groups’ awareness of thelinks between different social and environmental issues.
The biodiversity and landscape issues and indicators selected are identified inTable 4. For reasons described above, it proved difficult to identify indicatorsthat could manage the delicate balance between achieving biodiversityconservation objectives without adversely affecting livelihoods along the supplychain, or transferring unacceptable costs to supermarkets or consumers. Thedifficulty in finding suitable “win-wins” is a superficial manifestation of a muchmore deeply rooted problem: that normal market incentives and productiontechnologies remain unsupportive of biodiversity conservation. So as to avoidan uneven distribution of the costs of improved performance on biodiversityacross the supply chain, the indicators selected assess what both supermarketsand producers are doing, e.g. by assessing whether or not supermarkets havehelped sponsor producers to adopt whole farm conservation plans.

Integrating global and local values
66
Tab
le 4
. Pro
po
sed
issu
es a
nd
ind
icat
ors
fo
r th
e b
iod
iver
sity
an
d la
nd
scap
es m
od
ule
of
the
Rac
e to
th
e To
p in
itia
tive
Issu
e: w
hat
are
we
are
tryi
ng
to
fin
d o
ut
wit
h t
his
ind
icat
or?
Co
mm
itm
ent
to
imp
rovi
ng
bio
div
ersi
ty
man
agem
ent
(wild
sp
ecie
s an
d h
abit
at)
thro
ug
h s
ou
rcin
g
po
licie
s an
d
cost
-sh
arin
g
Co
mm
itm
ent
to
pre
serv
atio
n o
f p
rist
ine/
nat
ura
l h
abit
ats
Sup
po
rt f
or
sust
ain
able
an
d
wild
life-
frie
nd
ly
fish
erie
s
Ind
icat
or(
s): h
ow
do
we
pro
po
se t
o m
easu
re r
etai
lco
mm
itm
ent
and
act
ion
on
this
issu
e?
Wh
ole
far
m c
on
serv
atio
nau
dit
s o
f su
pp
liers
; pla
ns
add
ress
ing
mai
nte
nan
ce/
enh
ance
men
t o
f b
iod
iver
sity
and
lan
dsc
apes
, pro
tect
ion
and
man
agem
ent
of
soil
and
wat
er, r
esp
on
sib
le u
se
of
agri
-ch
emic
als
(%)
Exis
ten
ce o
f p
ub
lish
edco
mp
any
po
licy
that
pre
-cl
ud
es c
lear
ing
of
pri
mar
yfo
rest
, des
tru
ctio
n o
f aq
uat
ican
d/o
r te
rres
tria
l hab
itat
s o
fsp
ecia
l sci
enti
fic/
cu
ltu
ral
inte
rest
, in
th
e p
rod
uct
ion
of
ow
n-b
ran
d f
oo
dst
uff
s (Y
/N)
Fish
pro
du
cts
sou
rced
fro
msu
stai
nab
le f
ish
erie
s u
sin
gw
ildlif
e-fr
ien
dly
fis
hin
gm
eth
od
s (%
)
Sou
rces
: wh
ere
mig
ht
dat
a co
me
fro
m?
Co
nse
rvat
ion
/ ad
viso
ry b
od
ies,
su
pp
liers
an
dfa
rmer
s
Ver
ific
atio
n: h
ow
do
we
veri
fy r
esp
on
ses
fro
mre
taile
rs o
n t
his
issu
e?
Rep
ort
s fr
om
co
nse
rvat
ion
bo
die
s an
d N
GO
s
Rep
ort
s fr
om
Mar
ine
Stew
ard
ship
Co
un
cil a
nd
oth
er a
ccre
dit
atio
nb
od
ies,
NG
Os
Exis
tin
g d
ata
Qu
esti
on
nai
re,
sup
erm
arke
t lit
erat
ure
,in
terv
iew
s w
ith
bu
yers
Qu
esti
on
nai
re t
o
sup
erm
arke
ts, a
nn
ual
and
en
viro
nm
enta
lre
po
rts
Sho
pp
ing
bas
ket
qu
esti
on
nai
re;
envi
ron
men
tal r
epo
rts

An issues paper
67
10.3 Biodiversity creditsThe concept of carbon credits is now beginning to be applied to biodiversity insome countries, though such initiatives are still at an early stage of planning. Aleader in this field is Australia, where progress has been made to proposemethods of calculating biodiversity credits for particular areas from biodiversityassessments. These are interesting to examine in the context of this study,because they are one of the first attempts to derive a compound index ofbiodiversity – one number that reflects several different attributes. Shields(2001) suggests a trading unit called a “Bio” which is calculated as follows:
B = [(EC*A) + (EC*U) + (EC*V)] + 1000 (1/D)(CO)
The first part of the equation, in square brackets, represents a summed valueEC, which “essentially comprises the food chain and has sub-terms for eachbiological entity that makes up the system… the producers, consumers,predators, detrivores”, multiplied in turn by an abundance term (A), auniqueness or relatedness term (U) and a vulnerability term (V) based onconservation status (perhaps the IUCN rankings). Thus the equation includes allof the basic measures of abundance: number of elements, abundance of eachelement (A) and relatedness (U). The second part of the equation concerns thehabitat. The 1000 is an arbitrary figure representing 1000 ha, D is distancefrom the closest equivalent habitat (a measure of how likely the focus area is tobe re-colonised in the event of local extinction) and CO is a measure of thecondition of the habitat.
This type of assessment is typical of the scientific approaches to biodiversityassessment described in Section 4. It is yet to be put to the test, but in alllikelihood will be met with heated debate over which taxa should or should notbe included, how habitat condition should be rated, and so on.

Integrating global and local values
68

An issues paper
69
A plethora of approaches to biodiversity assessment have been reviewed here,from broad natural resource management and land use planning exercises thatconsider biodiversity as one (often small) component, to detailed evaluations ofbiodiversity that are done for their own sake. Some are proposed techniqueswhile others are part of ongoing formal or informal planning cycles. The varietyof aims behind the reviewed assessment approaches means that comparisonsacross the full set are not very helpful, but here some general observations andcomparisons are made for each of three basic types of assessment methods:scientific methods, methods for local assessments, and methods used by higher-level policy-makers and practitioners. The purpose of the analysis here is todraw out some of the strengths, weaknesses and lessons from experience of thedifferent approaches. Learning from these examples is not only useful forcurrent practice, but to inform emerging attempts to bring multiple prioritiesinto biodiversity assessment and management.
11.1 Scientific assessment toolsSome of the scientific assessment tools reviewed in Section 4 were designed for aspecific purpose, such as for choosing prime conservation sites for birds, whileothers have a more general applicability (see summary in Table 5). If anything,they have not been applied widely enough, as they offer several reliable andcost-effective techniques that both local and higher-level decision-makers coulddraw on – in spite of their historical focus on global conservation priorities, theyhave considerable potential for integrating local values. To make some generalpoints, the reviewed scientific methods are:
Focused on global biodiversity values, with emphasis on indirect use and non-use values. Most scientific assessment techniques are concerned – implicitlymore often than explicitly and in practice more often than in potential – withthe global conservation value of biodiversity. The primary concerns embodiedin the methods used are the retention for global benefit of the non-use values(including option, bequest, aesthetic and scientific values; see Table 5) and toa lesser the indirect use (environmental service) values of biodiversity. These
Summaries and conclusions from different approaches
11
Integrating global and local values
70
methods are based within a western scientific framework, and furthermore the“global” values that they reflect are defined by the values held in the wealthycountries from which they by and large emerge. This may not be much of aproblem in setting global conservation priorities, but use of them as the soletool for measuring biodiversity, as is often done, neglects for example how theestablishment of a protected area will impact on local biodiversity and naturalresource values, and hence on people’s livelihoods. This is fundamentally aproblem in the value system on which the methods are based, rather than onshortcomings of the techniques themselves. As is discussed in Section 12,quantitative scientific methods could be a useful starting point for devisingreplicable methods for comparing among local sites or for assessments thatintegrate global and local biodiversity values.
Quantitative. Numerical measures and indices have considerable advantagesfor comparing and prioritising among sites. A potential problem withquantitative assessments, however, is that analysis and interpretation might bedifficult for people outside the scientific community. This challenge has in factbeen met well by the reviewed scientific assessment methods: the end productof most of them are easily understood point or ranking systems, such asHawthorne’s multi-coloured stars or the rare/vulnerable/endangeredcategories in the IUCN red data books. If anything, the danger with scientificbiodiversity assessments is that audiences may take the results as unequivocal,ignoring their degree of uncertainty or simplification.
Expensive in terms of time, money, equipment and expertise. Most of thesemethods rely on high level of western scientific knowledge and expertise.Some are mathematically complex (e.g. the Star System) while others requirehigh-tech equipment (e.g. GIS-based assessment). Transfer of such methods tonon-western countries is therefore likely to be prohibitively expensive,requiring a large investment in training, capacity building and technologicalinputs. Given prevailing resource constraints in these countries, the transfer ofsuch techniques is unlikely to be universal or sustainable, and thus scientificassessments are only likely to be carried out under the auspices of well-fundeddonor or government programmes. Since raw data emerging from manyscientific assessments requires considerable analysis before it is of use todecision-makers, data are often collected and then left in their raw form dueto lack of suitable resources to take analysis further.

An issues paper
71
Reliant on available rather than ideal data sets. Although the aim is to be asobjective as possible, scientific methods of biodiversity assessment often rely onpragmatism, for example using data on bird populations to identify hotspots,simply because data sets on birds are plentiful and reliable. These shortcutsclearly have advantages in terms of cost-effectiveness and in fulfilling nationaland international legal obligations, such as the monitoring required underCITES. They are usually also good representatives of the facets of biodiversityassociated with global option and bequest values. On the other hand, whilebirds or rare species have proved to be an extremely useful proxy forbiodiversity, there are many other aspects of biodiversity that they cannotrepresent, leading to possible errors in interpretation if the easy mistake ismade of thinking that they give a full picture of the biodiversity at a site.
Largely limited to species assessments. Most information is on species, less onother taxonomic levels (e.g. genera, families or kingdoms), let alone sub-speciesgenetic variation, ecological processes, or threats and pressures that bear onbiodiversity. Of even more concern is the fact that there is hardly any informationavailable on how changes in biodiversity might affect the wide range of servicesthat it provides, or even whether it provides some of these services at all.Although substantial experimental work is devoted to questions such as howbiodiversity contributes to stability in natural and agricultural systems, thepatterns and processes involved are complex, and it has been difficult for thescientific community to supply decision-makers with easy guidelines.
Widely varied in approach and potential applications. A great deal of effort,imagination and rigour has been put into the development of scientificassessment methods, only a few of which are reviewed here (Table 5). Each ofthe methods has strengths and drawbacks, so that no one approach can beadvocated over the others. For example, the SI/MAB protocol is expensive andlargely disconnected from the values and interests of non-biologists, but alsovery useful for informing our understanding of processes, which is the preciselythe type of information that will lead to better indicators in the long run. Whilemost of the methods have been designed to deal with global efforts to conservenon-use values of biodiversity, almost every approach has potential, andsometimes already existing, applicability to local contexts, or better still tointegrate global and local biodiversity values. The utility to decision-makers ofmany of these scientific approaches, with their appealing combination ofaccuracy and communicability, has yet to be fully exploited.

Facets of biodiversitymeasured *
1. taxa (species)2. wild3. structure, impact
1. taxa2. wild or agricultural3. structure
1. ecosystem, taxa2. wild3. structure, process,impact
1. taxa (bird species forEBAs)2. wild3. structure, impact
1. taxa (tree species)2. wild3. structure
1. ecosystem, taxa2. wild, agricultural3. structure
1. ecosystem, taxa, genes2. wild, agricultural3. structure, process,impact
Integrating global and local values
72
Scale ofmeasurement
National; morerecently local
Local or national
Local
Global
Local or national
Global, national orsub-national
Global, national orlocal
Goal of assessment
Evaluation ofextinction risk ofspecies
Multiple applications
Study and monitoringof biodiversity inprotected areas
Identification ofpriority conservationsites
Prioritisation of sitesfor tree conservation
Collation and analysisof spatial data
Multiple applications:based on using asmall number ofvariables to tracktotal biodiversity
Table 5. Summary and comparison of scientific biodiversity assessment methods
Assessment
IUCN’s red databooks
Checklists
SI/MAB Plots
Hotspots andICBP EBAs
GHI
GAP & GIS
Indicators,including CBD,UNEP-WCMC,CIFOR & WWF-IUCN
* 1.ecosystem/taxa/gene 2. wild/ agricultural 3.structure/ process/impact** 1. global / local 2. direct use / indirect use / non-use

An issues paper
73
Potential for integration oflocal and global values
High: local or nationalvalues could also beexpressed in simplecategories
High: possibility forincorporation of localnames and uses
Medium: holistic approachand potential for indicatorverification
Low: scale too large, thoughconcept could be adaptedat more local scales
High: already successfullyadapted to include localeconomic values GAP & GIS
High: socio-economic andbiological layers could becompared
Medium to high: potentialto include locally relevantindicators, but integration isa challenge
Implicit orexplicit values**
1. global2. non-use
1. global, local2. direct,indirect, non-use
1. global2. indirect, non-use
1. global2. non-use
1. global, local2. direct use,non-use
1. global, local2. direct use,indirect use, non-use
1. global, local2. direct use,indirect use, non-use
Cost-effectiveness
High: usually basedon secondary data
Medium to high:cheap samplingmethod butidentification maybe expensive
Low: large scale andlong-term, requiringhigh expertise
High: usually basedon secondary data
Medium to high:minimal field costsbut sometimes highcost of identification
Low: high hardwareand technical costsplus variable needfor primary data
Variable: dependenton scale, dataavailability and needfor verification
Communicability andpotential usefulness aspolicy tool
High: simple, emotivecategories; worldwideapplication
Low: difficult to expresshigher scale patterns
Low: complex scientificanalysis needs carefulspin to become a policy tool
High: readilycomprehensible andvisually communicableindices
High: readilycomprehensible andvisually communicableindices
Low: has already metwith considerableresistance from naturalresource managers
Medium to high: simpleand powerful indices,but can bemisconstrued ordifficult to integrate

Integrating global and local values
74
11.2 Local-level assessmentsThe approaches to assessing biodiversity in local terms differ from most of theother approaches described here in that they have not been driven by internationalconservation agendas. Therefore methodologies are far more ad hoc. Section 5described some of the tools used by social scientists and development practitionersto elicit local viewpoints, methods that can be, and occasionally have been,applied to biodiversity assessment: ethnobotany, ecological anthropology,participatory rural appraisal (PRA) and economic valuation techniques. The finalmethod described in this section, multidisciplinary landscape assessment, is amuch more specific set of biodiversity-oriented methods to measure some of themore intractable facets of biodiversity, such as substitutability. Section 6 examinedhow actual biodiversity assessments have been performed at local levels, carriedout by local people either working on their own or in collaboration withoutsiders. Overall, this motley selection of potential and utilised methods(summarised in Table 6) offer means to capture local biodiversity values, but areless useful as working models for broader-scale biodiversity assessment or policyinputs, mainly because of their context specificity. Some general observations canbe made that these local approaches are:
Revealing of the values and facets of biodiversity important to local people.Local users of biodiversity often place value on facets of biodiversity that tendnot to be addressed by scientific assessments – facets such as seasonalavailability and use, or importance during drought years. Although concernedwith more than direct use values, local biodiversity assessments usuallyemphasise resources that are harvested and used, and which may be invisible tooutsiders. Understanding principles, criteria and indicators applied in localresource users’ assessments of biodiversity can only be achieved after longperiods of association and intensive interaction with the community. Thus,incorporating such local resource users’ perceptions in formal assessments mightincrease the cost and time required for assessment. On the other hand, semi-structured interviewing and group exercises with local groups can draw outlocal perspectives and serve to make formal assessments more relevant andefficient. Certainly, ethnobotany, ecological anthropology and PRA havedeveloped a variety of techniques that can be used as a first step to identify whatshould be measured to capture biodiversity in terms of local values.
Non-quantitative and often not documented. Biodiversity assessments by localgroups have, on the whole, clear objectives relative to scientific assessments, forexample noting the prevalence of foods for subsistence, or pests on crops.

An issues paper
75
Indigenous appraisals, such as that described for the Irula people (Section 6.1)also tend to take a continual monitoring approach, and therefore offer a morecomplete picture, than for instance one-off scientific assessments even if theseoccur periodically, of how different organisms and ecosystems change over time.However, much of the information collected in indigenous appraisals remainsinaccessible to outsiders, because most measurements are non- or semi-quantitative, and are maintained orally rather than being recorded.
Focused on utility of individual species rather than addressing variety andvariability. Techniques to elicit local biodiversity values have proved effective atanalysing the usefulness and value of individual species or the range of speciesthat may be of use to rural people. Local knowledge of particular species tends to be more complete than taxonomic classifications as it usually encompasses life-cycle, productivity and use characteristics. Furthermore, the information collectedis continually being applied and adapted to specific uses. However, there has beenmuch less progress on the more challenging task of understanding how much andwhy the diversity of these species is important and valued by people. Economicvaluation methods have come closest to addressing this issue – and moregenerally to unpacking the term “biodiversity” with some degree of rigour – but have failed to gain wider credibility as a policy tool.
Difficult to extrapolate above the level of the site. Any measure of biodiversity isintrinsically relative rather than absolute (see Section 2.3). Without anything tocompare against, it is impossible for local groups to express how muchbiodiversity there is in their locale. Meaningful comparisons can be madebetween areas (e.g. comparing a local woodland and wetland in terms of theirarray of biological resources), or in one area over time, but it is much harder forlocal groups to say anything about the overall quantity and quality of biodiversityavailable to support their livelihoods. Historically this hardly mattered, becauselocal people could assess biodiversity in ways useful to themselves. Nowindigenous groups need more and more to defend their values and resourcesagainst outside claims, such as protected areas or commercial activities likelogging or mining. Meanwhile regional, national and international policy-makers,however sympathetic they might be, find it difficult to extrapolate from detailedcase studies to the macro level. The format of local biodiversity assessments, oftenqualitative and open-ended, adds to the difficulty of communicating with outsideaudiences. Both local groups and higher-level policy-makers have a clear need fora “go-between” approach to expressing biodiversity in mutually understandableterms, of the sort that the People’s Biodiversity Registers are attempting.

Integrating global and local values
76
* 1.ecosystem/taxa/gene 2. wild/ agricultural 3.structure/ process/impact** 1. global / local 2. direct use / indirect use / non-use
Facets of biodiversitymeasured *
1. taxa, gene2. wild, agricultural3. structure, impact
1. ecosystem, taxa, gene2. wild, agricultural3. structure, process,impact
1. ecosystem, taxa, gene2. wild, agricultural3. structure, process,impact
1. taxa2. wild, agricultural3. structure
1. taxa2. wild3. structure, impact
1. ecosystem, taxa, gene2. wild, agricultural3. structure, process,impact
1. ecosystem, taxa, gene2. wild, agricultural3. structure, process,impact
Scale ofmeasurement
Local
Local
Local
Local, national,global
Local
Local
Local
Goal of assessment
Documentation ofnames and uses of localbiological resources
Open-ended evaluationof biodiversity values
Multiple applications
Deriving monetaryvalues for non-marketedresources
Development of tools toexpress local biodiversityvalues in termsmeaningful to higher-level policy-makers
Tracking availability ofbiological resources
Transfer of local / expertknowledge and wisdominto public realm
Process
Ethnobotany
Ecologicalanthropology
PRA
Economicvaluation
Multi-disciplinarylandscapeassessments
Irulas
People’sbiodiversityregisters
Table 6. Summary and comparison of local biodiversity assessment and methods

An issues paper
77
Potential for integrationof local and global values
Low: remain focussed onlocal issues with fewtechniques to scale-up orweigh up against con-siderations of public good
High: explicit means formeasuring and combiningdifferent values
Low: so far focussed onlocal direct use values
Low: locally specific ratherthan transferabletechniques
Low: so far no means forcombining or trading offlocal values, let aloneexternal values
Implicit orexplicitvalues**
1. local2. direct use,indirect use
1. local2. direct use,indirect use, non-use
1. local
1. global, local2. non-use
1. local2. direct use
1. local2. direct use,indirect use,non-use
1. local2. direct use,indirect use,non-use
Cost-effectiveness
Medium: depends onknowledge andreliability of keyinformants
Low: high investmentof expertise,communicated mainlyto academic audience
Medium to high:mainly simpletechniques butsometimes highinvestment of timedemanded from localpeople
Low: reliable estimatesrequire intensiveprimary data collection
Medium: current highrequirements forexpertise will decreasewhen methods havebeen developed
High: well incorporatedinto daily resource use
High: standardisedmethods under clearcategories; mix ofgroup and local expertinterviews
Communicability andpotential usefulness aspolicy tool
Low: extrapolation abovelocal levels difficult
Medium: clear, financiallyoriented messages, butbasis considered dubious
High: specificallydesigned to facilitatecommunication andweigh up alternativeland use options
Low: narrative, song-based style unsuitable forbroad-scale policy inputs
High: standardisedmethods detract fromrecording localuniqueness but allowbroad view for policy-makers at state andnational levels, drawingattention to wide rangeof values

Integrating global and local values
78
11.3 Assessments by higher-level decision-makersPolicy-makers at sub-national, national and international levels, and in bothpublic and private spheres, often need to consider, design or carry outbiodiversity assessments, typically as one aspect of broader land use planning ornatural resource management. Table 7 provides a summary. Internationalprocesses towards sustainable development and poverty alleviation, forexample, include criteria for maintenance of biodiversity, while other processes,notably the Convention on Biological Diversity (CBD), focus specifically onbiodiversity management (Section 7). Bilateral donors are presently attemptingto mainstream biodiversity considerations into all of their operations (Section8). At the national level, some processes have considered and rejectedbiodiversity as a priority for assessment and management (e.g. the MalawiNational Forestry Programme), while elsewhere, as in India, nationalbiodiversity assessment has become an end in itself (Section 9). The privatesector has begun to develop more local-level methods for biodiversityassessment, for example to meet goals of sustainable production and supplychains, or with the expectation of biodiversity trading (Section 10). Methodsused by policy-makers and practitioners to assess biodiversity, at national andinternational levels and in the public and private spheres, are, on the whole:
Vague about the purpose of the assessment. Governmental institutionstypically undertake biodiversity assessments as part of environmental impactprocedures, in keeping with international guidelines about biodiversitymonitoring and conservation. The innate problem with this approach is thatthe facets of biodiversity measured reflect global conservation values only. Forexample, national institutions and donor organisations tend to use threatenedor endangered species as a key impact assessment indicator, but do not look atimpacts on local food resources, or other direct use values. As with thescientific methods, these assessments implicitly or explicitly dwell on the non-use (option, bequest and intrinsic values, see Table 1) of biodiversity.Furthermore, biodiversity is judged as being valuable in itself, rather than interms of the services it delivers – a traditional emphasis that implicitly placesglobal non-use values over local and direct use values of biodiversity. Anemerging counterpoint to this is the growing interest in biodiversityassessment within certain activities of the private sector, where althoughglobal non-use values remain the focus, market incentives tend to encourage amore goal-driven approach to biodiversity assessment.
An issues paper
79
Reliant on simple, indicator-based techniques. Most efforts to assessbiodiversity by international and national institutions focus on the specieslevel and take an indicator-based approach. One of the primary reasons forthis is limited finance. Sida, for example, has tried to expand the horizon ofanalysis to include genetic diversity, but this makes assessment much morecomplex and costly. Indicators can of course provide powerful shortcuts inbiodiversity assessment. What indicators are chosen reflects the objectives andultimately the values of the biodiversity assessors. National institutions anddonor organisations commonly choose indicators based on global non-usevalues, such as changes in the percentage of land designated as protected areasor the numbers of endangered species, even when conservation for the globalgood is not the stated primary goal of biodiversity management. Manyinstitutions appear to have adopted these indicators as default options ratherthan because they actively seek to emphasise global over local values, or non-use over use values. That there are few other appropriate, understandable ormeasurable indicators available reflects in part the hard lobbying byconservation groups for the adoption of conservation-oriented indicators. Wecannot ignore that selection of indicators, like all aspects of biodiversityassessment, is a highly politicised process.
Often committed to inclusion of local values, but unable to operationalise.National governments and international donor organisations often havestrong commitment to local values, in terms of their central aims of povertyalleviation and sustainable development, and well-intentioned approaches ofsupporting good governance and participation. Biodiversity assessment byinstitutions such as these are hampered not by a direct commitment to globalover local values, but by missing the next step of “how to”. For example,DFID recognises potential links between global biodiversity values and localbenefits, but does not have a mechanism for identifying this link in specificcases. In the private sector, a range of biodiversity assessment methods aimedspecifically at local-level evaluation, such as forest certification audits andbiodiversity credits, have been developed, but which nonetheless characterisebiodiversity exclusively in terms of non-use, global values.
Beginning to mainstream and take a broad view of biodiversity. The CBD takesa commendably broad view of biodiversity, including all scales from broadecosystem variation to genetic variability within crops, and an explicit state-pressure-response approach, which includes consideration of a country’scapacity to implement agreements under the CBD. This broad perspective

Integrating global and local values
80
Table 7. Summary and comparison of biodiversity assessments withininternational and private sector processes
Facets of biodiversitymeasured *
1. ecosystem, taxa, gene2. wild, agricultural3. structure, process,impact
1. ecosystem, taxa2. wild3. structure, process
1. taxa2. wild, agricultural3. structure
1. ecosystem, taxa, gene2. wild, agricultural3. structure, process,impact
1. ecosystem, taxa, gene2. wild, agricultural3. structure, process,impact
1. variable2. wild3. variable
1. ecosystem, taxa, gene2. wild, agricultural3. structure, process,impact
1. taxa2. wild3. structure
Implicit or explicitvalues**
1. global, local2. direct use, non-use
1. globall2. indirect use, non-use
1. global2. non-use
1. global, local2. direct use,indirect use, non-use
1. global, local2. direct use,indirect use, non-use
1. global2. non-use
1. global, local2. direct use,indirect use, non-use
1. global2. non-use
Scale ofmeasurement
National
Local
National
Local,national
Local,national
Local
Local
Local
Goal ofassessment
Tracking progressagainst aims ofCBD
Selection of sitesof outstandingglobal value
Measuringprogress towardssustainabledevelopment andpoverty alleviation
Environmentalimpact assessment
Award of PIMSbiodiversity policyobjective mark
Audits of forestsagainst principlesof sustainableforestmanagement
Benchmarking ofsupermarkets
Derivation ofeconomic value ofland in terms ofbiodiversity
Process
CBD
NaturalHeritage
CSD andinternationaldevelopmentgoals (DAC/OECD)
Sida
DFID
FSCcertification
RTTT
Biodiversitycredits

An issues paper
81
* 1.ecosystem/taxa/gene 2. wild/ agricultural 3.structure/ process/impact ** 1. global / local 2. direct use / indirect use / non-use
Potential for integration oflocal and global values
Medium: the CBD process isslow and vague, but remainsflexible enough to allowconsiderable local adaptation
Low: Natural Heritage sites arechosen to reflect global value,and trade-offs with local valuesare not made explicit
Medium: proposed indicatorsets have focused on globalnon-use values, but are opento local selection andadaptation
High: emphasis on stakeholderrelationships, protection ofknowledge, and localbiodiversity values
Medium: includes localcapacity building, but retainsemphais on biodiversity ofglobal value
Medium: good links betweenbiodiversity and desiredoutcomes for all stakeholders,but low investment so far ineliciting local values
Medium: inevitable trade-offswith values held by consumersin wealthy countries
Low: local values are unlikelyto be tradeable in a broadermarket
Cost-effectiveness
Under debate: core setof indicators will needcareful trade-offsbetween cost andcomprehensiveness
Not clear
Not clear
High: comprehensivechecklist of factors toconsider, but lowrequirements for primarydata
High: efficient scoringsystem and computer-based records
Medium: usually basedon scanty secondary data
Not yet clear, but explicitefforts to transfer coststo supermarkets as wellas suppliers
Not clear
Communicability and potentialusefulness as policy tool
Medium: a commonly agreedset of indicators could aidinternational debate, but isprone to disagreement andglossing over local differences
High: due to the high supportfrom national governmentsand international bodies,giving Natural Heritage siteshigh prestige
Low: indicators are optionaland poorly developed, addingbureaucratic load more thanutility
High: dynamic, utilitarian viewof biodiversity thatincorporates multipleperspectives
Medium: an internal auditsystem, but broad opportunity-oriented approach includestraining and capacity buildingas well as conservation
Medium: certification is anincreasingly recognised marketand policy tool, but thetreatment of biodiversity inaudits is imprecise
High: potential for highconsumer buy-in
Medium: simple compositeindices will be needed forbiodiversity trading, but thepotential of a biodiversitymarket is still to be seen

82
extends beyond the technical aspects of biodiversity to governance, asencapsulated in the Ecosystem Approach, which recommends locally-based,adaptive decision-making. Bilateral donor organisations such as Sida and DFIDare putting into operation similarly broad approaches, with an additionalemphasis on the opportunities that biodiversity supplies as well as the traditionalattention given to threats to biodiversity. In the private sector the view remainsmore old-fashioned: biodiversity is regarded as purely an environmental feature,in parallel with separate social and economic sets of criteria, as seen for instancein most forest certification audits (Section 10.1; Annex 1).
Limited by the fear of league tables. An important lesson from the processtowards an international CBD core set of indicators is that nationalgovernments resist systems that permit ranking of countries according to theireffectiveness in managing biodiversity. This will always be a challenge togeneralising biodiversity assessment techniques, and to using shared sets ofindicators in negotiation and policy formulation. More generally, the extent ofgovernments’ and private companies’ support of different internationalprocesses is probably a good gauge of how biodiversity assessment might fareas a broader policy tool: widely accredited processes such as the CBD, FSCforest certification and Natural Heritage sites are perhaps the most promisingloci of change for biodiversity management policy (Table 7).
11.4 Lack of exchange among approachesThe approaches to biodiversity assessment reviewed here all have strengths andweaknesses. Scientific methods have mainly been applied to conservationpriority setting, even though they have plenty of potential for broaderapplications. Local assessments capture what matters locally but are difficult tolink – for the good of local or national policy – to higher-level processes. Partlyfor this reason, assessments driven by national and international agendas, aswell as those emerging in the private sector, almost invariably emphasise globalbiodiversity values over national or local values. The outstanding problem, then,is exchange among the independent tracks of biodiversity assessment. Policy-makers and practitioners have been influenced by the inputs of conservationcampaign groups, but have not been able to make the most of the wealth ofassessment techniques developed, often collaboratively with local groups, bynatural and social scientists. Even among policy-makers themselves, exchangehas been poor, for example between the international and national IUCN reddata book processes (Rodriguez et al 2000).
Integrating global and local values

An issues paper
83
12.1 New frameworks for biodiversity managementand assessmentBiodiversity assessments need to provide information that is useful to biodiversitymanagers. The most direct management decisions are made at local levels, and inthis sense the most useful biodiversity assessments are those based locally.However, there are also a number of other levels at which decision-makingaffects biodiversity and livelihoods connected with it. National and localgovernments, land-owners and development or conservation organisations aresome examples of others whose policies and activities are influential, and manyof these agencies implement biodiversity assessments of their own. At both localand non-local levels, evaluation of biodiversity is part of broader cycles of land-use and natural resource management, either purposively or not (Figure 3).
Currently, most biodiversity assessments are poorly coordinated among differentgroups of decision-makers. This is only one component of a broader uncouplingamong their respective management cycles – in short, a natural resourcegovernance challenge that needs to be tackled on all fronts. Biodiversityassessment might be a usefully tractable part of this challenge, and indeed a toolfor broader progress towards pluralist decision-making, for example byproviding empirical information that serves as a basis for dialogue, negotiationor cooperation among different groups.
By adopting the principles of the Ecosystem Approach as the primaryframework for operationalising the Convention on Biological Diversity, a largenumber of governments have committed to locally driven biodiversitymanagement. Although international statements do not of course guaranteenational or local change, the Ecosystem Approach nonetheless provides aframework for natural resource management in which, while other interestgroups have their say, local roles, values, priorities, knowledge and decision-making are put in the lead. The CBD is an example of a broader trend ofdecision-makers in government, NGOs and the private sector recognising theutility of decentralised and democratic natural resource management, for
Ways forward12

Figure 3. How biodiversity assessment fits as a sub-component ofland use and natural resource management planning cycles
LANDUSE/NR MGMT
PLANNING CYCLE
BIODIVERSITYASSESSMENT
ACTPLAN
IDENTIFYNEED FOR
BIODIVERSITYASSESSMENT
APPRAISE+ MODIFY
PLANS
ANALYSIS
DESIGN ANDIMPLEMENT
GOAL
AREAS
FACETS/INDICATORS
INVENTORY
EVALUATE
Integrating global and local values
84
reasons of efficiency if not equity. Trade-offs and synergies between global andlocal biodiversity values are increasingly on policy agendas at local, nationaland international levels. Conservation discourse is also putting more emphasison conservation of biodiversity outside reserves, with integration rather thansegregation of global biodiversity and local livelihoods (Vane-Wright 1996;Prendergast et al. 1999).

An issues paper
85
Devolved, pluralist and adaptive management of biodiversity has obviousimplications for assessment. Fundamentally, all the details of choosing,planning, conducting and learning from biodiversity assessments (Figure 3) needto be decided locally, shared and flexible. In response to this, one of the mostpromising directions internationally is the growing interest in, and practice of,participatory biodiversity assessment (Lawrence and Ambrose-Oji 2001;Rodriguez and van der Hammen 2002). These kinds of approaches (e.g.multidisciplinary landscape assessments, reviewed in Section 5.5) take up thechallenge of finding a broad middle ground between local and widerbiodiversity values, not only through communication of local values to globalaudiences and vice versa, but by sharing ownership of both the responsibilities(e.g. planning, fieldwork) and the benfits (e.g. access to information, financialrewards) of biodiversity assessment.
Not all biodiversity assessments need to be joint activities. Often stakeholderssee no benefit in mutual evaluations or understandings of biodiversity. Localusers all over the world rely on independent appraisals. Sometimes biodiversitymay not be an issue at all, even among a broad range of interest groups. Forexample, the multi-stakeholder Malawi National Forestry Programme placesmuch emphasis on biological resource values, but none on biodiversity, indefining the country’s ten key areas for immediate action in the forestry sector.Biodiversity assessments can be expensive, or even risky. There can be seriousdisadvantages to local people, especially disempowered or indigenous groups, togetting involved in biodiversity assessment: not only the obvious transaction andopportunity costs, but also the potentially negative impacts of sharinginformation with outsiders, such as biopiracy (Shiva 1997). Much is made ininternational circles of the need to mainstream biodiversity issues into the fullspectrum of national and regional planning processes. Perhaps instead theemphasis should be on mainstreaming – at a decentralised level – the option ofcollaborative biodiversity assessment and management.
Better governance and better information go hand-in-hand. The remainder ofSection 12 identifies some strategies and tactics for getting the outputs ofbiodiversity assessments to serve broader goals of integrated evaluation anddecision-making among different stakeholders. Section 12.2 draws some generallessons from the reviewed examples of tools and practice to guide designers ofbiodiversity assessments in planning approaches that will be relevant to differentgroups of decision-makers. Section 12.3 examines whether and how differentbiodiversity values can be brought together into composite indices. Section 12.4considers a broader principles-based framework for biodiversity assessment.

Integrating global and local values
86
12.2 Lessons learned: some guidelines for biodiversityassessmentOne of the most important messages for decision-makers at all levels is toapproach biodiversity assessment with pragmatism and scepticism. Formalbiodiversity assessment is expensive, sometimes so much so that it takes awayfrom management (Sheil 2001). The jargon of scientific assessments can hide agreat deal of uncertainty, resulting in land management decisions based onspurious conclusions about local biodiversity (e.g. Homewood and Brockington1999). Decision-makers want evaluations of biodiversity that answer specificquestions as effectively as possible within the time and other resources available.Of course, good assessment results are contingent on good processes, and decision-makers need to be aware, and take advantage, of the political and other contextssurrounding and implicit in biodiversity measurement (Box 22). Researchers havean associated role to play in developing assessment approaches that are relevant todecision-makers who use the information generated.
Box 22. Putting biodiversity assessment into contextWhat decision-makers can do
Rationalise biodiversity assessment – only assess biodiversity when there is goodreason to do so, be explicit about the goals of assessment and base the methods usedon these goalsBe aware of the limitations of existing methods, and put more resources into devel-oping integrated methods Identify relevant indicators rather than relying on internationally sanctioned con-ventional indicators (e.g. numbers of endangered species)Invest in the CBD process – ensure at an international level that a broad range ofinterests are reflected, especially those of local resource users and less wealthy coun-tries, and nationally take advantage of the loose guidelines to set up a pragmatic andnationally specific programme of assessmentSimplify requirements for biodiversity assessment in audits (e.g. forest certificationand environmental impact assessments)
What researchers can do Provide more user-friendly evidence of the causal links between biodiversity and itsascribed indirect use values – e.g. Does biodiversity really offer environmental servicessuch as watershed protection? Under what circumstances?Work together (natural scientists, economists and social scientists) to design methodsfor measuring biodiversity in terms of the value that people derive from it – includingmeasures of accessibility, substitutability, and the added value of variety and variabil-ity (capacity to change) over the sum of biological resource valuesLook into how the knowledge and equipment needed for specific scientific assessmentmethods can be transferred and used without significant cost to less wealthy contextsAct as ‘go-betweens’ to link local managers of biodiversity to higher-level policy-makers

An issues paper
87
Working together, examples from both researchers and decision-makers – thetools and procedures reviewed here – suggest some general guidelines fordesigning biodiversity assessments:
Start planning any biodiversity assessment by disaggregating values. Forpractical purposes, biodiversity is not a feature of living organisms, but rathera catch-all term for all the types of variety that might be useful to us (e.g. therange of decomposers in the soil) or might not (e.g. the range of deadly viraldiseases). Treating biodiversity as one composite property, then, is not helpful.An especially useful way of disaggregating biodiversity is in terms of thevalues we attach to it: the relevant direct, indirect and non-use values. Thesecan be further broken down according to the relative values to differentbeneficiaries – the differences between local and global values have beenstressed here, but other distinctions among stakeholders may be more relevantin other contexts. Considering biodiversity in terms of what people derivefrom it, rather than as an end in itself, helps us phrase much clearer questionsand objectives for assessment.
Acknowledge trade-offs between biodiversity and other benefits, amongdifferent aspects of biodiversity, and among the values attached to biodiversity.Biodiversity assessment could and should be a powerful tool for makingdifficult decisions about what aspects of conservation and management ofbiological resources to prioritise. As a start, separating biodiversity values fromgeneral biological resource values would overcome a lot of confusions (e.g.“biodiversity” is said to provide watershed protection, but it may be foundthat a monoculture does just as well). Other key trade-offs are among directuse, indirect use and non-use values of biodiversity (e.g. maximising geneticvariety in economic species versus maximising existence of unused species forfuture option values), between local and global values (e.g. conservation of alllocal bird species or concentrating on the one species that is rare globally), andamong ecosystem, taxonomic and genetic levels of biodiversity (e.g. whether tomaintain many different families of flowering plants versus many examples ofa family deemed especially important).
In deciding what to measure, begin with a wide view of biodiversity andnarrow down from there. Measuring the array of facets of biodiversity is adaunting proposition, and in practical terms an inefficient use of valuableexpertise, time and finances. On the other hand, it is difficult to have astandard means of prioritising what should be measured for all circumstances.Noss (1990) recommends starting with a coarse-scale, wide-reaching

Integrating global and local values
88
characterisation of a site, under the themes of composition, structure andfunction (alternatively other typologies such as structure/process/impact,state/pressure/response or ecosystem/taxa could be used), from which the keyfacets to measure are identified by comparing against data on “stress levels”(once again alternative criteria such as utility to local livelihoods, access, orrate of environmental change could be substituted). The underlying idea is tostart by considering biodiversity in its broadest sense and then to use criteriato discard possible aspects to measure until a manageable set, based on theobjectives and questions at hand, is reached. Even if the originalcharacterisation of the site and the criteria are based on patchy evidence, acomprehensive checklist of possible factors is a very low-cost means ofhelping decision-makers to consider biodiversity more widely.
Measure the desired good or service rather than the associated biodiversity.Links between levels of biodiversity and levels of delivered goods and servicesare poorly understood. Therefore it makes sense to assess the desired good orservice rather than measuring biodiversity – evaluate seasonal availability offood, reduction in crop diseases, or landscape beauty, rather than thebiodiversity that is considered to be providing it. Direct assessments ofbiodiversity are valid mainly for answering questions about non-use (option)values or questions of scientific interest, such as to provide baselines of geneticvariation and variability in crop species, or to find out how many species thereare in the world. Vanclay (1998) provides several other examples of wherebiodiversity is used as a surrogate and where biodiversity surveys are justified.
Design indices and indicators for specific land-use decisions and managementprocesses. There will never be a universal index of biodiversity. The growingplethora of approaches and formats to express biodiversity is an encouragingrather than dismaying sign. Assessment techniques, indicators and indices needto be tailored to particular land-use or management decisions. For example,the certification audit for Stora-Ludvika (Annex 1) recommended a “Rioindex” of conservation value, based on a set of parameters that are availableand relevant at the intended site, but would need to be adapted at other sites.What is transferable is the basic tool, in this case a composite index.
Accept imperfection – and be open to change. Biodiversity assessments simplycannot be comprehensive. To carry out even a rough charaterisation of thebiodiversity in a particular place is an expensive exercise if primary data
An issues paper
89
collection is involved. Each stage of a biodiversity assessment – choosingvalues, choosing which facets of biodiversity reflect these values, designingand implementing field inventories, weighting data, combining data into oneindex for a site, assessing among sites or against a baseline – involvescompromises. No one approach is perfect, and the usefulness and relevance oftechniques changes over time. Well established approaches to trackingbiodiversity, such as the IUCN red books, accept (and, where possible,estimate) uncertainty, as well as updating the ranking system to reflectchanges in, or refinements of, knowledge and values.
Be aware of multiple perspectives and the political context of biodiversityassessment. Practitioners have become so accustomed to indices anddescriptions of biodiversity as a valuable end in itself that it is easy to forgetthat these portrayals of biodiversity are based on a view that the worth ofbiodiversity is in its non-use values (conservation for option, bequest andintrinsic benefits) to the whole of humanity. Criteria such as those used inselecting Natural Heritage sites (Section 7.2) appear to be based on some sortof global consensus over what is and what is not of “universal natural value”.In reality, the global consensus is that of wealthy countries, and the mostenergetically promoted means of assessing biodiversity are those of wealthyconservation lobbies. This is not to say that poorer people would decline,given the opportunity, to support biodiversity conservation based on non-usevalues – simply that practitioners should be aware that the views and valuesof less powerful groups are shamefully absent from prevailing national andinternational approaches to biodiversity assessment and management.
12.3 Combining multiple values into single indicatorsReal life trade-offs in the management and assessment of biodiversity will besolved via political processes rather than through derivation of “objective”indicators that combine different sets of biodiversity values. Nonetheless, policy-makers at national and international levels need biodiversity assessments thatassist planning and priority setting. If policy decisions are to depend on local aswell as national or global biodiversity values, reliable and generalisable methodsto contrast or combine different measures are required. Scientists have alreadydesigned several methods for integrating multiple measures. The scientificmethods of biodiversity assessment described in Section 4 provide a choice ofthree of the simplest methods for combining different measures:

Integrating global and local values
90
Category method. Different sites are put into different categories according toclear criteria. Multiple biodiversity values can be included by a hierarchicalsystem of classification or by categories having more than one criterion each.For example, the categorisation of hotspots (Section 4.4) combines parallelcriteria for endemism and threat. A local value, for instance contribution tofood security, could be substituted or added. The category method isapplicable to both qualitative and quantitative data. It is perhaps the mostcommonly used system for combining multiple global conservation values, buthas not been widely applied as a means of co-assessing local and globalbiodiversity values.
Equation method. Multiple values are combined into a single index using analgebraic equation. Each term can be used to represent one facet or value ofbiodiversity. The different terms can be weighted according to theirimportance by using different factors of multiplication. For example, theformula for calculating biodiversity credits (Section 10.3) has weighting termsfor abundance, uniqueness and vulnerability, the relative importance of whichcan be adjusted by increasing or decreasing their relative weightings. Any oneof these terms could be substituted by a term expressing local value, whichcould be weighted according to perceived (or negotiated) relative importance.For example, an obvious substitute for “uniqueness” would be“substitutability”, a measure of how many replacements people have for aspecies used for a specified purpose.
Graph method. Rather than lumping very different biodiversity valuestogether, the graph method plots out different indices on opposite axes, togive a visual representation of difference. For example, the prioritisation ofCanada’s bird species (Section 4.9) plotted a measure of threat of extinctionon one axis and the degree to which a species is concentrated in Canada (andtherefore the responsibility of the Canadian government) on the other.Graphical means of combining more than one factor do not conflate factorsthat vary in different ways, without correlation, and therefore are moretransparent than the category or equation methods.
Each of these three methods has associated strengths and weaknesses (Table 8).In the examples presented in Section 4, these methods have been applied mainlyto integrating multiple conservation aims (e.g. endemism and threat ofextinction). They could be just as easily used to combine multiple biodiversityvalues, such as direct, indirect and non-use values, or global and local values.

An issues paper
91
Indeed, some planning processes have already integrated multiple values in thisway. For example, the Star System and Genetic Heat Index not only combine allthree methods but have also gone further to incorporate a term for localeconomic value on top of the conservation values. This technique has recentlybeen successfully applied to incorporate local use values in biodiversitymanagement planning in Cameroon (Wong et al. 2002).
Table 8. Key strengths and weaknesses and examples of each ofthe category, graph and equation methods of combining multiplebiodiversity values
Key strength
Key weakness
Examples
Category method
Clear message(ranking) andapplicable toqualitative data
Hides method ofcalculation (andtherefore biases)
IUCN red databooksHotspotsEndemic BirdAreasStar System
Equation method
Gives continuousindex (e.g. useful toconvert tomonetary value)
Obscures individualvariables
Genetic Heat IndexBiodiversity credits
Graph method
Trade-off betweenaxes explicit
Limited to amaximum of threevariables
Genetic HeatIndex Prioritisation ofCanada’s avifauna
More complex methods for integrating multiple values are also possible.Presentation of results of participatory biodiversity assessments, for example,often entail what might be called “scientification” of local knowledge, such asthe application of formal statistical techniques, especially nonparametric rank-based tests, to information about local practice and perceptions (Hoft et al.1999; Sheil et al. 2002). More broadly than biodiversity management, modernapproaches to integrated natural resource management have begun to tacklehow best to combine multiple values attached to natural resources, values basedon different and sometimes conflicting stakeholder perspectives. Techniquesinclude multivariate statistical methods such as principle components analysis,radar diagrams and canonical correlations (Campbell et al. 2001).
Integrated measures calculated in the above ways could be described as indicesof “bioquality” (sensu Hawthorne 1996) rather than “biodiversity”, in that sites

Integrating global and local values
92
that have the highest diversity of beneficial taxa, biological processes orpotential impacts might be different from the sites that have the highest overalldiversity of taxa, biological processes or potential impacts (in Hawthorne’susage, the forest with the highest bioquality did not necessarily have the highestdiversity of tree species, but it did have the highest abundance of rare speciesand therefore the highest quality in conservation terms). The usefulness of aterm such as bioquality is that it places emphasis on the values that peoplederive from biodiversity.
Real consensus over measurement of biodiversity, with common vision andminimum compromise, cannot really be hoped for. Without consensus amongstakeholders over how measures of biodiversity are derived (from which facetsare chosen through to how they are recorded, weighted, calculated andcombined), any uni-dimensional index of biodiversity will always be questioned.The fact remains that stakeholders with different values will always need spacefor dialogue. Measures of biodiversity, and more importantly the managementdecisions that are made on their basis, will continue to be determined,ultimately, by negotiation rather than through rational exercises based on state-of-the-art techniques.
12.4 Principles-based approaches to biodiversityassessmentBiodiversity is just one of many examples of a natural resource that is valuedwidely but managed locally, and therefore requires approaches that are locallyadapted yet broadly approved. A popular, and potentially very powerful,solution to achieving both ends is an evaluation system based on sets ofprinciples that are agreed among a wide group of stakeholders, but allowsubstantial flexibility in decisions and actions taken locally. This is analogous to“loose-tight” models of business management that expect employees to workwithin core principles but to take most responsibility for local decision-making.
There are many working examples of principles applied to environmental andnatural resource management. Some, such as the certification scheme overseenby the Forest Stewardship Council (Section 10.1), rely on compliance fromapplicants in order to participate, but sets of principles that provide non-compulsory best-practice models for participants (e.g. the Global Compact) maybe just as useful – the primary utility of principles is in their role as learningtools for organisations and alliances. Principles are usually succinct, and general

An issues paper
93
enough to apply to many different types of stakeholders, which means that theyare excellent tools for negotiation and collaborative management if they arebacked up by sufficient mechanisms for accountability.
A principles-based approach may be well suited to biodiversity assessment thatneeds to incorporate both global and local values. One of the big challenges ofbiodiversity assessment is the sheer amount of information that couldpotentially be gathered and evaluated. Principles provide the fundamentalquestions that need to be answered by assessment – a good starting point forchoosing what to measure. Well-developed principles often include menus ofpotential indicators or targets within wider guidelines for implementation,which can be selected from or adapted to suit very different needs in differentlocalities (e.g. in forest certification; Appendix 1).
More importantly, principles-based approaches have a broader applicability tothe process as well as the content of assessment and management procedures.The twelve principles of the CBD’s Ecosystem Approach (Box 2 in Section 2) area good example of a set that includes both principles for how the resource oughtto be managed (e.g. Principle 6: Ecosystems must be managed within the limitsof their functioning) and principles for how management decisions ought to bemade (e.g. Principle 2: Management should be decentralised to the lowestappropriate level). A biodiversity assessment based on this model would includequestions on how close an ecosystem is to its limits (e.g. its state, rates ofchange, resilience, adaptability) and on how far management was decentralised(e.g. institutional rights and responsibilities, legal frameworks, budget control).
The principles of the Ecosystem Approach may or may not be an appropriatebasis for collaborative approaches to biodiversity assessment, depending in parton whether the CBD can develop and sustain credibility and impetus at locallevels. A global set of principles is only one of many potential ways forward –principles rooted in national or local realities could be just as good at bringingmultiple biodiversity values into more open debate.

Integrating global and local values
94
ReferencesAbbot, J. and Guijt, I. 1998. Changing views on change: participatory approaches to mon-
itoring the environment. International Institute for Environment and Development,London, UK.
Achar, K.P. 1997. Documentation of people’s knowledge and perceptions about biodi-versity and conservation through people’s biodiversity register at Mala VillagePanchayat, Karkala Taluk, Karnataka State. Biodiversity Conservation PrioritisationProject, WWF-India, New Delhi, India.
Akiwowo, A. 1986. Contributions to the sociology of knowledge from an African oralpoetry. International Sociology 1: 343-358.
Aylward, B. 1991. The economic value of ecosystems: 3 – biological diversity. GatekeeperSeries GK91-03. International Institute for Environment and Development, London,UK.
Aylward, B. 1995. Commercialisation of biological resources in Indonesia: an economicoverview of the issues and case study of biochemical prospecting. A paper preparedfor Technical Assistance Project 1782-INO: Institutional Strengthening for BiodiversityConservation. British Council, Jakarta, Indonesia.
Bass, S., Hughes, C. and Hawthorne, W. 2001a. Forests, biodiversity and livelihoods:linking policy and practice. Pp 23-74 in I. Koziell and J. Saunders (eds) Living OffBiodiversity. International Institute for Environment and Development, London, UK.
Bass, S., Thornber, K., Markopoulos, M., Roberts, S. and Grieg-Gran, M. 2001b.Certification’s impacts on forests, stakeholders and supply chains. A report of the IIEDproject Instruments for Sustainable Private Sector Forestry. International Institute forEnvironment and Development, London, UK.
Berlin, B. 1992. Ethnobiological classification: principles of categorisation of plants andanimals. Princeton University Press, Princeton, USA.
Bhatta, G. and Bhat, P. 1997. Conserving biodiversity – what people say: a case study ofMerkal Village, Sringeri Taluk, Karnataka State. Biodiversity ConservationPrioritisation Project, WWF-India, New Delhi, India.
Blench, R. 1997. Neglected species, livelihoods and biodiversity in difficult areas: howshould the public sector respond? ODI Natural Resources Paper 23. OverseasDevelopment Institute, London, UK.
Boyle, T. J. B., Lawes, M., Manokaran, R., Prabhu, R., Ghazoul, J., Sastrapradja, S., Thang,H.-C., Dale, V., Eeley, H., Finegan, B., Soberon, J. and Stork, N. E. 1998. Criteria andindicators for assessing the sustainability of forest management: a practical approachto assessment of biodiversity. CIFOR Special Publication. Centre for InternationalForestry Research, Bogor, Indonesia.
Bystrom, M. 2000. Integration of biological diversity in Sweden’s international develop-ment cooperation – the beginning of a learning process. Phase I final report.Department for Natural Resources and the Environment, Sida, Stockholm, Sweden.

An issues paper
95
Campbell, B., Sayer, J., Frost, P., Vermeulen, S., Ruiz Pérez, M., Cunningham, A. andPrabhu, R. 2001. Assessing the performance of natural resource systems. ConservationEcology 5(2): 22. http://www.consecol.org/vol5/iss2/art22
CBD 1992. Text of the Convention on Biological Diversity. http://www.biodiv.org/conven-tion/articles.asp
CBD 1997. Recommendations for a core set of indicators of biological diversity.Background paper prepared by the liaison group on indicators of biological diversity.http://www.biodiv.org/sbstta3/sbstta3-il3.html
CBD 1999. Proposed core set of biodiversity indicators. Proceedings of Convention onBiological Diversity liaison group on indicators of biological diversity, Montreal,Canada, 24-25 September 1999.
CBD 2002. Ecosystem Approach principles. http://www.biodiv.org/programmes/cross-cutting/ecosystem/principles.asp
Chatterjee, S., Dey, S., Rana, R.S. and Sastry, A.R.K. 2000. Conservation and sustainableuse of natural bioresources: a case study on Apatanis in Arunachal Pradesh. WWF-India, New Delhi, India.
Collar, N. J. and Andrew, P. 1988. Birds to watch: the ICBP world checklist of threatenedbirds. ICBP Technical Publication 8. International Council for Bird Preservation.Cambridge, UK.
Dallmeier, F. 1992 (ed.) Long-term monitoring of biological diversity in tropical forestareas: methods for establishment and inventory of permanent plots. MAB Digest 1.UNESCO, Paris, France.
Dallmeier, F. 1996. From the forest to the user: a methodology update. Pp 43-51 inWilson, D. E and Sandoval, A. (eds) Manu: the biodiversity of Southeastern Peru/LaBiodiversidad del Sureste del Perú. Smithsonian Institute, Washington DC, USA.
Dallmeier, F. 1998. Measuring and monitoring forest biodiversity: the SI/MAB model. InBachmann, P., Köhl, M. and Päivinen, R. (eds.) Assessment of Biodiversity for ImprovedForest Management. Proceedings of the Conference on Assessment of Biodiversity forImproved Planning. Kluwer Acadmic Publishers, The Netherlands.
Dallmeier, F. and Comiskey, J. A. 1998. Forest biodiversity research monitoring and mod-eling: Conceptual background and Old World case studies. Man and the BiosphereSeries Volume 20. UNESCO and Parthenon Publishing Group Paris, France.
Davies, J., Richards, M. and Cavendish, W. 1999. Beyond the limits of PRA? A comparisonof participatory and conventional economic research methods in the analysis of ilalapalm use in south-eastern Zimbabwe. Overseas Development Institute, London, UK.
DFID 1999. DFID Environmental Guide. Department for International Development,London, UK.

Integrating global and local values
96
Dounias, E., Rodrigues, W. and Petit, C. 2000. Review of ethnobotanical literature forcentral and west Africa. B 3.ulletin of the African Ethnobotany Network 2: 5-117.
Droege, S., Cyr, A. and Larivee, J. 1998. Checklists: an under-used tool for the inventoryand monitoring of plants and animals. Conservation Biology 12: 1134-1138.
Dunn, E. H., Hussell, D. J. T. and Welsh, D. A. 1999. Priority-setting tool applied toCanada’s landbirds based on concern and responsibility for species. ConservationBiology 13(6): 1404-1415.
Ehrlich, P.R. and Ehrlich, A.H. 1992. The value of biodiversity. Ambio 21: 219-226.
Fairhead, J. and Leach, M. 1996. Misreading the African landscape: society and ecologyin the forest-savanna mosaic. Cambridge University Press, Cambridge, UK.
Gadgil, M., Seshagiri Rao, P.R., Utkarsh, G., Pramod, P., Chhatre, A. and members of thePeople’s Biodiversity Initiative 2000. New meanings for old knowledge: the people’sbiodiversity registers programme. Ecological Applications 10: 1307-1317.
Gari, J-A. 1999. Biodiversity conservation and use: local and global considerations.Science, Technology and Development Discussion Paper 7. Centre for InternationalDevelopment and Belfer Centre for Science and International Affairs, HarvardUniversity, USA.
Gaston, K. J. and Spicer, J.I. 1998. Biodiversity: an introduction. Blackwell Science,Oxford, UK.
Gentry, A.H. 1995. Diversity and floristic composition of neotropical dry forests. InBullock, S.H., Mooney, H.A. and Medina, E. (eds), Seasonally dry tropical forests.Cambridge University Press, Cambridge, U.K. Pp. 146-194.
Gordon, J. 2001. A critical review of scientific methods for assessing (measuring andvaluing) biodiversity. Unpublished report, International Institute for Environment andDevelopment, London, UK.
Grieg-Gran, M., Guijt, I. and Peutalo, B. 2002. Local perspectives on forest values in PapuaNew Guinea: the scope for participatory methods. International Institute forEnvironment and Development, London, UK.
Groombridge, B. and Jenkins, M.D. (eds) 1996. Assessing biodiversity status and sus-tainability. Biodiversity Series No. 5. World Conservation Monitoring Centre,Cambridge, UK.
Guijt, I., Hinchcliffe, F. and Melnyk, M. 1995. The Hidden Harvest: The value of wildresources in agricultural systems. A project summary. International Institute forEnvironment and Development, London, UK.
Guijt, I. and Hinchcliffe, F. 1998. Participatory valuation of wild resources: an overview ofthe Hidden Harvest methodology. International Institute for Environment andDevelopment, London, UK.

An issues paper
97
Guyer, J. and Richards, P. 1996. The invention of biodiversity: social perspectives on themanagement of biological variety in Africa. Africa 66: 1-13.
Guyer, J.I. 1996. Diversity at different levels: farm and community in western Nigeria.Africa 66: 71-89.
Harper, J.L. and Hawksworth, D.L. 1994. Biodiversity: measurement and estimation.Philosophical Transactions of the Royal Society of London Series B 345: 5-12.
Hawksworth, D.L. and Ritchie, J.M. 1993. Biodiveristy and biosystematic priorities: micro-organisms and invertebrates. CAB International, Wallingford, UK.
Hawthorne, W. D. and Abu-Juam, M. 1995. Forest Protection in Ghana. IUCN, Gland,Switzerland and Cambridge, UK.
Hawthorne, W. D. 1996. Holes and the sums of parts in Ghanaian forest: regenerationscale and sustainable use. Proceedings of the Royal Society of Edinburgh 10B: 75-176.
Hilton-Taylor, C., Mace, G. M., Capper, D. R., Collar, N. J., Stewart, C. N., Bibby, C. J.,Pollock, C. and Thomsen, J. B. 2000. Assessment mismatches must be sorted out: theyleave species at risk. Nature 404: 541.
Hoft, M., Barik, S.K. and Lykke, A.M. 1999. Quantitative ethnobotany: applications ofmultivariate and statistical analyses in ethnobotany. People and Plants Working Paper,UNESCO. http://www.rbgkew.org.uk/peopleplants/wp/wp6/index.html
Homewood, K. and Brockington, D. 1999. Biodiversity, conservation and development inMkomazi Game Reserve, Tanzania. Global Ecology and Biogeography 8: 301-313.
ICBP 1992. Putting biodiversity on the map: priority areas for global conservation.International Council for Bird Preservation, Cambridge, U.K.
IIED 2001. Valuing forests: a Review of Methods and Applications in DevelopingCountries. Environmental Economics Programme Discussion Paper 00-02. InternationalInstitute for Environment and Development, London, UK.
IIED 2002. Race to the Top. http://www.racetothetop.or
ILEIA 1996. Tracking change. LEISA (ILEIA Newsletter for Ecologically Sound Agriculture)12. ILEIA (Centre for Information on Low External Input Sustainable Agriculture).http://www.ileia.org/2/nl12-3.html
IUCN 2001. The IUCN red list of threatened species: 2001 categories and criteria (version3.1). http://www.redlist.org/info/categories_criteria2001.html#categories
Keith, D. A. 1998. An evaluation and modification of World Conservation Union Red ListCriteria for classification of extinction risk in vascular plants. Conservation Biology12(5): 1076-1089.
Koziell, I. 2001. Diversity not adversity: sustaining livelihoods with biodiversity.International Institute for Environment and Development, London, UK.

Integrating global and local values
98
Lawrence, A. and Ambrose-Oji, B. 2001. Participatory monitoring and evaluation of bio-diversity: the art and the science, Background paper prepared for the EuropeanTropical Froest Research Network Internet workshop and policy seminar, convened bythe Environmental Change Institute, University of Oxford, 7 – 25 January 2002.http://www.etfrn.org/etfrn/workshop/biodiversity/index.html
Lee-Smith, D. 1996. Community-based indicators for sustainable development.http://www.iucn.org/themes/eval/english/comm.htm
Lindenmayer, D. B. 1999. Future directions for biodiversity conservation in managedforests: indicator species, impact studies and monitoring programs. Forest Ecology andManagement 115: 277-287.
Lott, E.J. 1993. Annotated checklist of the vascular flora of the Chamela Bay region,Jalisco, Mexico. Occasional Paper of the Californian Academy of Science 148. 60 pp.
Lynam, T.J.P., Campbell, B.M. and Vermeulen, S.J. 1994. Contingent valuation of multi-purpose tree resources in the smallholder farming sector, Zimbabwe. Studies inEnvironmental Economics and Development Paper 8. Unit for EnvironmentalEconomics, University of Gothenburg, Sweden.
Malawi Ministry of Natural Resources and Environmental Affairs 2000. Malawi’s NationalForestry Programme: priorities for improving forests and livelihoods. National ForestryProgramme Coordination Unit, Lilongwe, Malawi.
McLaughlin, S. P. 1992. Are floristic areas hierarchically arranged? Journal ofBiogeography 19: 21-32.
Mittermeier, R. A., Myers, N., Thomsen, J. B., da Fonseca, G. A. B. and Olivieri, S. 1998.Biodiversity hotspots and major tropical wilderness areas: Approaches to setting con-servation priorities. Conservation Biology 12(3): 516-520.
Myers, N. 1989. Threatened biotas: “hotspots” in tropical forests. Environmentalist8:1-20.
Myers, N. 1993. Biodiversity and the precautionary principle. Ambio 22: 74-79.
Myers, N., Mittermeier, R. A., Mittermeier, C. G., da Fonseca, G. A. B. and Kent, J. 2000.Biodiversity hotspots for conservation priorities. Nature 403: 853-858.
Natural History Museum 2002. Biodiversity and worldmap. http:/www.nhm.ac.uk/science/projects/worldmap/diversity/index.html
Noss, R. F. 1990. Indicators for monitoring biodiversity: a hierarchical approach.Conservation Biology 4: 355-364.
Pandey, D.N. and Kumar, N. 2000. Introduction to ethnoforestry. http://www.forestgu-ru.com/chap1.htm
Peterken, G. F. 1974. A method for assessing woodland flora for conservation using indi-cator species. Biogical Conservation 6(4): 239-245.

An issues paper
99
Prendergast, J.R., Quinn, R.M. and Lawton, J.H. 1999. The gaps between theory and prac-tice in selecting nature reserves. Conservation Biology 13: 484-492.
Ramesh, B. R., Menon S., and Bawa, K. J. 1997. A vegetation based approach to biodi-versity gap analysis in the Agastyamalai region, Western Ghats. Ambio 26 (8) 529-536.
Reid, W. V. 1998. Biodiversity hotspots. Trends in Ecology and Evolution 13: 275-280
Robbins, R.K. and Opler, P.A. 1997. Butterfly diversity and a preliminary comparison withbird and mammal diversity. Pp 69-82 in Reaka-Kudla, M. L., Wilson, D. E. and Wilson,E. O. (eds) Biodiversity II Understanding and protecting our biological resources.Joseph Henry Press, Washington DC, USA.
Rodriguez, C. and van der Hammen, M.C. 2002. Participation: stakeholders and the infor-mation they need. Background paper prepared for the European Tropical FroestResearch Network Internet workshop and policy seminar, convened by theEnvironmental Change Institute, University of Oxford, 7 – 25 January 2002.http://www.etfrn.org/etfrn/workshop/biodiversity/index.html
Rodríguez, J. P., Ashenfelter, G., Rojas-Suárez, F., Garcia Fernandez, J. J., Suárez, L. andDobson A. P. 2000. Local data are vital to worldwide conservation. Nature 403: 241.
Scott, J. M., Davis, F., Csuti, B., Noss, R., Butterfield, B., Groves, C., Anderson, H., Caicco, S.,D’Erchia, F., Edwards , T. C. Jnr., Ulliman, J. and Wright, G. R. 1993. Gap analysis: a geo-graphic approach to protection of biological diversity. Wildlife Monographs 123: 1-41.
Sheil, D. 2000. Biodiversity surveys, local people’s preferences and information forimproved land use decisions. Multidisciplinary landscape assessments Phase I and PhaseII interim technical report. Centre for International Forestry Research, Bogor, Indonesia.
Sheil, D. 2001. Conservation and biodiversity monitoring in the tropics: realities, priori-ties, and distractions. Conservation Biology 15: 1179-1181.
Sheil, D., Puri, R.K., Basuki, I., van Heist, M., Syaefuddin, Rukmiyati, Sardjono, M.A.,Samsoedin, I., Sidiyasa, K., Chrisandini, Permana, E., Angi, E.M., Gatzweiler, F.,Johnson, B. and Wijaya, A. 2002. Exploring biological diversity, environment and localpeople’s perspectives in forest landscapes. Centre for International Forestry Research,Bogor, Indonesia.
Shields, J. 2001. Biodiversity credits: a system of economic rewards for ecologically sus-tainable management. Submitted to Pacific Conservation Biology.
Shiva, V. 1997 Biopiracy: the plunder of nature and knowledge. South End Press,Cambridge, Massachusetts, USA.
Sida 1998. Guidelines for environmental impact assessments in international develop-ment cooperation. Department for Natural Resources and the Environment, Sida,Stockholm, Sweden.
Sida 2000. The Country Strategies – Guidelines for the Strategic Environmental Analysis.Department for Natural Resources and the Environment, Sida, Stockholm, Sweden.

Integrating global and local values
100
Stork, N. E., Boyle, T. J. B., Dale, V., Eeley, H., Finegan, B., Lawes, M., Manokaran, N.,Prabhu, R and Soberon, R. 1997. Criteria and indicators for assessing the sustainabili-ty of forest management: conservation of biodiversity. CIFOR Working Paper, Centerfor International Forestry Research, Bogor, Indonesia.
Sullivan, S. 1999. Folk and formal, local and national – Damara knowledge and commu-nity conservation in southern Kunene, Namibia. Cimbebasia 15: 1-28.
Sullivan, S. 2000. Perfume and pastoralism: gender, ethnographic myths and community-based conservation in a former Namibian “homeland”. In Hodgson, D. (ed.)Rethinking pastoralism in Africa: gender, culture and the myth of the patriarchal pas-toralist. James Currey and Ohio University Press, Athens, Ohio, USA.
Takacs, D. 1996. Philosophies of paradise. John Hopkins University Press, Baltimore, USA.Taneja, B., Kothari, A. and Raju, M. 2001. Integrating global and local biodiversity values:
a review of biodiversity assessment. India case study. Unpublished report,International Institute for Environment and Development, London, UK.
UNESCO undated. Statutory framework of the world network of biosphere reserves.http://www.unesco.org/mab/frameuk.htm
Van Jaarsveld, A.S., Freitag, S., Chown, S.L., Muller, C., Koch, S., Hull, H., Bellamy, C.,Kruger, M., Endrody-Young, S., Mansell, M.W. and Scholtz, C.H. 1998. Biodiversityassessment and conservation strategies. Science 279: 2106-2108.
Vanclay, J.K.1998. Towards more rigorous assessment of biodiversity. Pp 211-232 in P.Bachmann, M. Kohl and R. Paivinen (eds) Assessment of biodiversity for improvedforest planning. Kluwer Academic Publishers, Dordrecht, Germany.
Vane-Wright, R.I. 1996. Identifying priorities for conservation of biodiversity: systematicbiological criteria within a socio-political framework. Pp 309-344 in Gaston, K.J. (ed.)Biodiversity: a biology of numbers and difference. Blackwell, Oxford, UK.
WCMC undated. Final report: Natural capital indicators for OECD countries.http://www.unep-wcmc.org/assessments/index.htm~main
Wong, J., Ambrose-Oji, B., Hall, J., Healey, J., Kenfack, D., Lawrence, A., Lysinge, R. andNdam, N. 2002. Generating an index of local biodiversity value. Paper prepared forthe ETFRN workshop on Participatory monitoring and evaluation of biodiversity, 7 –25 January 2002. http://www.etfrn.org/etfrn/workshop/biodiversity/index.html
WWF/IUCN 1999. Forest quality: an introductory booklet. IUCN, WWF International,Gland, Switzerland.

An issues paper
101
Annex 1. Case studies of certification
Muzama Crafts, ZambiaMuzama produces wood and leather crafts. The company emerged from a donor-fundeddevelopment project in 1989 and has remained heavily funded by international donors(a Dutch agency SNV paid for the certification process). Muzama’s shareholders includerepresentatives of the 400 pitsawyers and 150 carpenters who work through thecompany. Wood is cut from state-owned, communally managed natural forests aroundthe villages in which the pitsawyers live.
The unsystematic assessment of biodiversity in this audit is perhaps typical of approach-es to certification in countries where standards and methodologies have not beenformalised. There were no local nor indeed Zambian representatives on the audit team,nor anyone trained in biology. No original measurements of biodiversity were done. Theaudit report used the section heading “Safeguards for maintaining biodiversity” to referto two aspects of biodiversity: anecdotal reports of reductions in densities of largemammals and secondly existence of patches of Cryptosepalum forest and Baikiaea forest.These were deemed to be of conservation interest, the former because they are a rareexample of evergreen forest outside Africa’s equatorial rain forest zone and the latterbecause they represent the most northern extent of Baikiaea, a common type of wood-land further south. The only biodiversity-related condition for certification was toprepare and implement a fire management programme within five years.
This audit presented the conventional professional view of biodiversity as important perse. The auditors addressed global biodiversity values only, emphasising protection of veg-etation types of particular interest to scientists. They did not investigate local values ordraw attention to the links between local socio-economic issues and either the mainte-nance or use of biodiversity. However, since the pitsawyers were found to have a lowimpact on the forest (a slow rate of cutting spread over a wide area, with little use ofmechanised transport or roads), perhaps the low degree of attention given to biodiver-sity in this audit was perhaps entirely appropriate.
Stora-Ludvika, SwedenStora-Enso is one of the world’s largest forest products companies, based in Sweden.Under pressure from environmental NGOs in the 1980s, the company began to modify itsmanagement of forest lands in Ludvika district, adopting a system of “Ecological
Certificate profile
Date of certificate: 11 May 1998Type of certificate: FSC natural forest management and chain of custodyArea certified: Initially 1.3 million ha, subsequently reduced to 0.8 million haCertifier: Woodmark Motivation for certification: To gain access to export markets
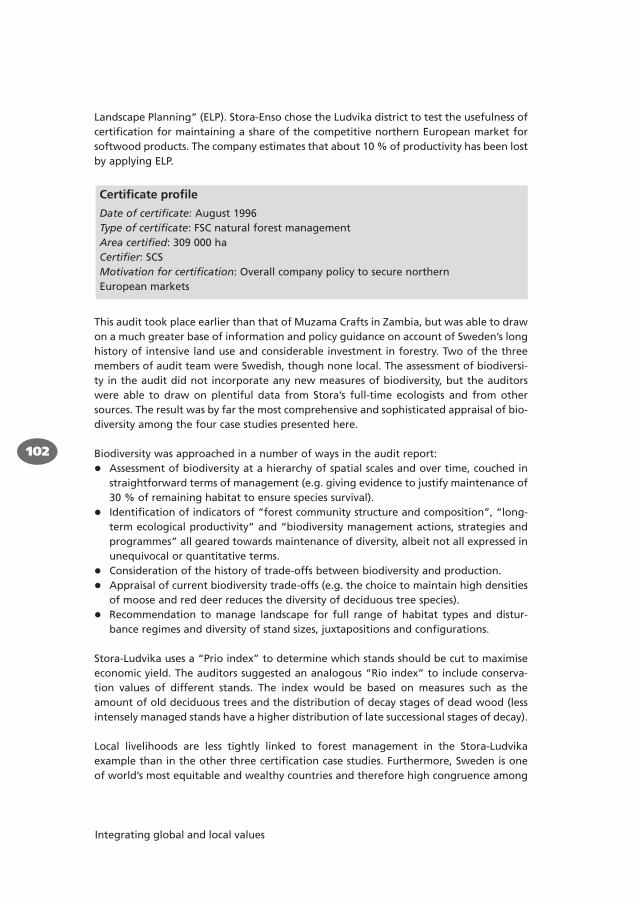
Integrating global and local values
102
Landscape Planning” (ELP). Stora-Enso chose the Ludvika district to test the usefulness ofcertification for maintaining a share of the competitive northern European market forsoftwood products. The company estimates that about 10 % of productivity has been lostby applying ELP.
This audit took place earlier than that of Muzama Crafts in Zambia, but was able to drawon a much greater base of information and policy guidance on account of Sweden’s longhistory of intensive land use and considerable investment in forestry. Two of the threemembers of audit team were Swedish, though none local. The assessment of biodiversi-ty in the audit did not incorporate any new measures of biodiversity, but the auditorswere able to draw on plentiful data from Stora’s full-time ecologists and from othersources. The result was by far the most comprehensive and sophisticated appraisal of bio-diversity among the four case studies presented here.
Biodiversity was approached in a number of ways in the audit report:Assessment of biodiversity at a hierarchy of spatial scales and over time, couched instraightforward terms of management (e.g. giving evidence to justify maintenance of30 % of remaining habitat to ensure species survival).Identification of indicators of “forest community structure and composition”, “long-term ecological productivity” and “biodiversity management actions, strategies andprogrammes” all geared towards maintenance of diversity, albeit not all expressed inunequivocal or quantitative terms.Consideration of the history of trade-offs between biodiversity and production.Appraisal of current biodiversity trade-offs (e.g. the choice to maintain high densitiesof moose and red deer reduces the diversity of deciduous tree species).Recommendation to manage landscape for full range of habitat types and distur-bance regimes and diversity of stand sizes, juxtapositions and configurations.
Stora-Ludvika uses a “Prio index” to determine which stands should be cut to maximiseeconomic yield. The auditors suggested an analogous “Rio index” to include conserva-tion values of different stands. The index would be based on measures such as theamount of old deciduous trees and the distribution of decay stages of dead wood (lessintensely managed stands have a higher distribution of late successional stages of decay).
Local livelihoods are less tightly linked to forest management in the Stora-Ludvikaexample than in the other three certification case studies. Furthermore, Sweden is oneof world’s most equitable and wealthy countries and therefore high congruence among
Certificate profile
Date of certificate: August 1996Type of certificate: FSC natural forest managementArea certified: 309 000 haCertifier: SCSMotivation for certification: Overall company policy to secure northern European markets
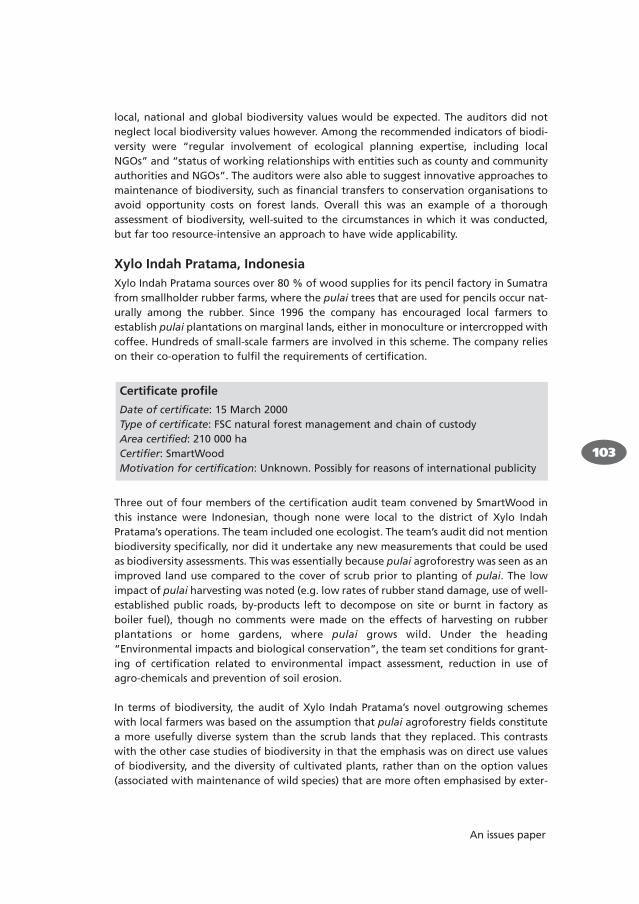
An issues paper
103
local, national and global biodiversity values would be expected. The auditors did notneglect local biodiversity values however. Among the recommended indicators of biodi-versity were “regular involvement of ecological planning expertise, including localNGOs” and “status of working relationships with entities such as county and communityauthorities and NGOs”. The auditors were also able to suggest innovative approaches tomaintenance of biodiversity, such as financial transfers to conservation organisations toavoid opportunity costs on forest lands. Overall this was an example of a thoroughassessment of biodiversity, well-suited to the circumstances in which it was conducted,but far too resource-intensive an approach to have wide applicability.
Xylo Indah Pratama, IndonesiaXylo Indah Pratama sources over 80 % of wood supplies for its pencil factory in Sumatrafrom smallholder rubber farms, where the pulai trees that are used for pencils occur nat-urally among the rubber. Since 1996 the company has encouraged local farmers toestablish pulai plantations on marginal lands, either in monoculture or intercropped withcoffee. Hundreds of small-scale farmers are involved in this scheme. The company relieson their co-operation to fulfil the requirements of certification.
Three out of four members of the certification audit team convened by SmartWood inthis instance were Indonesian, though none were local to the district of Xylo IndahPratama’s operations. The team included one ecologist. The team’s audit did not mentionbiodiversity specifically, nor did it undertake any new measurements that could be usedas biodiversity assessments. This was essentially because pulai agroforestry was seen as animproved land use compared to the cover of scrub prior to planting of pulai. The lowimpact of pulai harvesting was noted (e.g. low rates of rubber stand damage, use of well-established public roads, by-products left to decompose on site or burnt in factory asboiler fuel), though no comments were made on the effects of harvesting on rubberplantations or home gardens, where pulai grows wild. Under the heading“Environmental impacts and biological conservation”, the team set conditions for grant-ing of certification related to environmental impact assessment, reduction in use ofagro-chemicals and prevention of soil erosion.
In terms of biodiversity, the audit of Xylo Indah Pratama’s novel outgrowing schemeswith local farmers was based on the assumption that pulai agroforestry fields constitutea more usefully diverse system than the scrub lands that they replaced. This contrastswith the other case studies of biodiversity in that the emphasis was on direct use valuesof biodiversity, and the diversity of cultivated plants, rather than on the option values(associated with maintenance of wild species) that are more often emphasised by exter-
Certificate profile
Date of certificate: 15 March 2000Type of certificate: FSC natural forest management and chain of custodyArea certified: 210 000 haCertifier: SmartWoodMotivation for certification: Unknown. Possibly for reasons of international publicity

Integrating global and local values
104
nal assessors. However, the extent to which this assumption tallied with local biodiversi-ty values is unknown as the opinions of the small-scale farmers involved in the pulaischeme were not elicited.
Hoopa Tribal Forestry, USAThe Hoopa tribe of California gained self-governance of local commercial forests in 1991.These conifer forests provide a major proportion of income to the Hoopa tribe. Forestryoperations have received financial support from the government, but this is slowly beingphased out. The Tribal Council seeks to balance maximisation of income and employmentfor tribal people with maintenance of conservation and cultural sites, which are demand-ed by local interest groups. Standards of management of the forest exceeded the strictCalifornia State Forest Rules even before certification.
This audit provided a comprehensive assessment of biodiversity without using the wordat all. The audit team were all USA nationals, two with ecological training, and includeda Native American forester. Original inventories of biodiversity were not carried out forthe audit, but extensive records of past forest management were available, allowing athorough appraisal, albeit not as detailed as that of Stora-Ludvika in Sweden. An assess-ment headed “Ecological issues” was derived from past and present landscape structure(ages and species composition of different stands), status of threatened and endangeredspecies as defined in state legislation (in this case three species of bird) and a recentsurvey of “category 2” (rare or vulnerable) species. This survey linked state and local bio-diversity values by giving special attention to fish, which are traditionally important tothe Hoopa people.
Of the four certification case studies, this was the most explicit in connecting the statusof biodiversity with desired outcomes. This was due in part to the comprehensive envi-ronmental laws in California, which provide a framework of legal justifications forbiodiversity assessment and management. More than this, the auditors chose to take asystems viewpoint, assessing the ecosystem at multiple scales in terms of inputs (e.g. pes-ticides) and of desired functions of the ecosystem, essentially biodiversity functions (e.g.presence of desired landscape mosaic, presence of rare indigenous bird species). In all,this audit provides a good example of how to side-step biodiversity per se and instead toconcentrate on the outputs of ecosystems that are of interest to key stakeholder groups.
Certificate profile
Date of certificate: 15 April 1999Type of certificate: FSC natural forest managementArea certified: 35 600 haCertifier: SmartWoodMotivation for certification: Independent validation of silvicultural and environmentalpractices