Embed Size (px)
Citation preview
The key to successful development planning is the build-ing of earth models integrating all relevant subsurface dataand predicting reservoir performance in the presence ofuncertainties.
The development of Bonga Field is presented as an exam-ple of integrated subsurface modeling of complex, deep-water channel reservoirs in which geophysical techniquesare highlighted. Three main static reservoir parameters weremodeled in detail: net sand distribution, subseismic chan-nel architecture, and reservoir connectivity.
Proprietary probabilistic, model-based seismic inver-sion has provided excellent predictions of net sand thick-ness in development wells in the main reservoir, addingconfidence to the in-place oil volume assessment. However,because of limits to seismic resolution, all potentially rele-vant sand and mud beds cannot be visualized from(inverted) seismic data alone. Consequently, subseismicchannel architectures have been deterministically placed inthe static models based on analog and well data and guidedby seismic attributes. Connectivity is especially importantbecause pressure support and sweep from water injectionwells is crucial to productivity from these near-hydropres-sured reservoirs. Reservoir connectivity is defined as a func-tion of horizontal and vertical permeability, andtransmissibility barriers. Analysis of seismic equal-ampli-tude surfaces is a way seismic can potentially help indicateareas of relatively better or worse connectivity. Each reser-voir is simulated multiple times using scenarios based onall combinations of the above parameters. Highly amalga-mated channels are less impacted by connectivity variationthan less well amalgamated channels. Reservoir simulationmodels have been transferred to synthetic seismic modelsand demonstrate the potential value of time-lapse (4D) seis-mic. Other “in-field opportunity” reservoirs have been iden-tified in addition to the main reservoirs, and might add toproduction in the future.
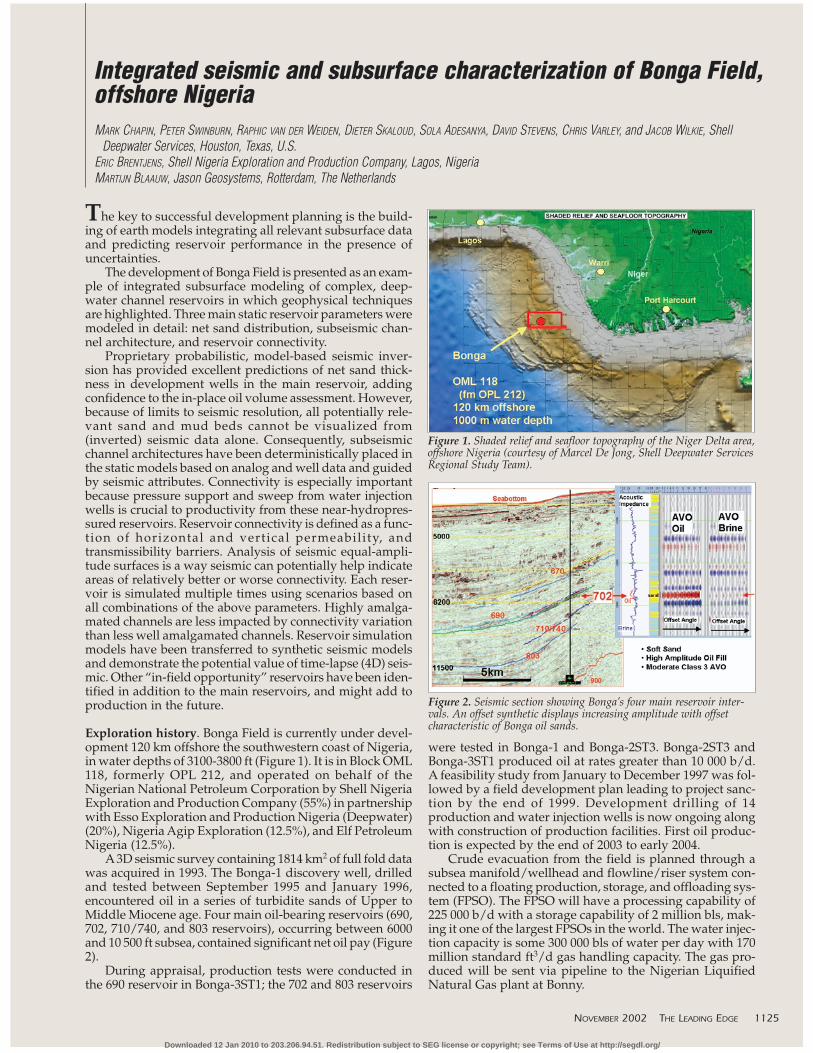
Exploration history. Bonga Field is currently under devel-opment 120 km offshore the southwestern coast of Nigeria,in water depths of 3100-3800 ft (Figure 1). It is in Block OML118, formerly OPL 212, and operated on behalf of theNigerian National Petroleum Corporation by Shell NigeriaExploration and Production Company (55%) in partnershipwith Esso Exploration and Production Nigeria (Deepwater)(20%), Nigeria Agip Exploration (12.5%), and Elf PetroleumNigeria (12.5%).
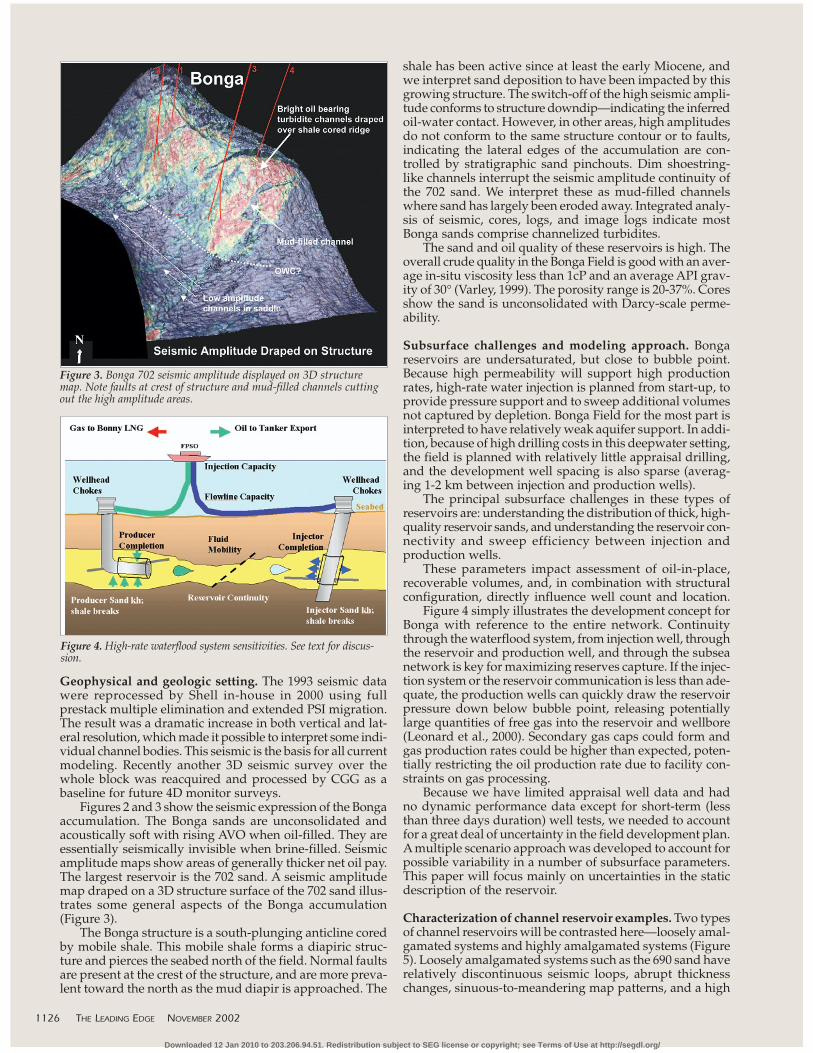
A3D seismic survey containing 1814 km2 of full fold datawas acquired in 1993. The Bonga-1 discovery well, drilledand tested between September 1995 and January 1996,encountered oil in a series of turbidite sands of Upper toMiddle Miocene age. Four main oil-bearing reservoirs (690,702, 710/740, and 803 reservoirs), occurring between 6000and 10 500 ft subsea, contained significant net oil pay (Figure2).
During appraisal, production tests were conducted inthe 690 reservoir in Bonga-3ST1; the 702 and 803 reservoirs
were tested in Bonga-1 and Bonga-2ST3. Bonga-2ST3 andBonga-3ST1 produced oil at rates greater than 10 000 b/d.A feasibility study from January to December 1997 was fol-lowed by a field development plan leading to project sanc-tion by the end of 1999. Development drilling of 14production and water injection wells is now ongoing alongwith construction of production facilities. First oil produc-tion is expected by the end of 2003 to early 2004.
Crude evacuation from the field is planned through asubsea manifold/wellhead and flowline/riser system con-nected to a floating production, storage, and offloading sys-tem (FPSO). The FPSO will have a processing capability of225 000 b/d with a storage capability of 2 million bls, mak-ing it one of the largest FPSOs in the world. The water injec-tion capacity is some 300 000 bls of water per day with 170million standard ft3/d gas handling capacity. The gas pro-duced will be sent via pipeline to the Nigerian LiquifiedNatural Gas plant at Bonny.
NOVEMBER 2002 THE LEADING EDGE 1125
Integrated seismic and subsurface characterization of Bonga Field,offshore NigeriaMARK CHAPIN, PETER SWINBURN, RAPHIC VAN DER WEIDEN, DIETER SKALOUD, SOLA ADESANYA, DAVID STEVENS, CHRIS VARLEY, and JACOB WILKIE, Shell
Deepwater Services, Houston, Texas, U.S.ERIC BRENTJENS, Shell Nigeria Exploration and Production Company, Lagos, NigeriaMARTIJN BLAAUW, Jason Geosystems, Rotterdam, The Netherlands
Figure 1. Shaded relief and seafloor topography of the Niger Delta area,offshore Nigeria (courtesy of Marcel De Jong, Shell Deepwater ServicesRegional Study Team).
Figure 2. Seismic section showing Bonga’s four main reservoir inter-vals. An offset synthetic displays increasing amplitude with offsetcharacteristic of Bonga oil sands.
Downloaded 12 Jan 2010 to 203.206.94.51. Redistribution subject to SEG license or copyright; see Terms of Use at http://segdl.org/
Geophysical and geologic setting. The 1993 seismic datawere reprocessed by Shell in-house in 2000 using fullprestack multiple elimination and extended PSI migration.The result was a dramatic increase in both vertical and lat-eral resolution, which made it possible to interpret some indi-vidual channel bodies. This seismic is the basis for all currentmodeling. Recently another 3D seismic survey over thewhole block was reacquired and processed by CGG as abaseline for future 4D monitor surveys.
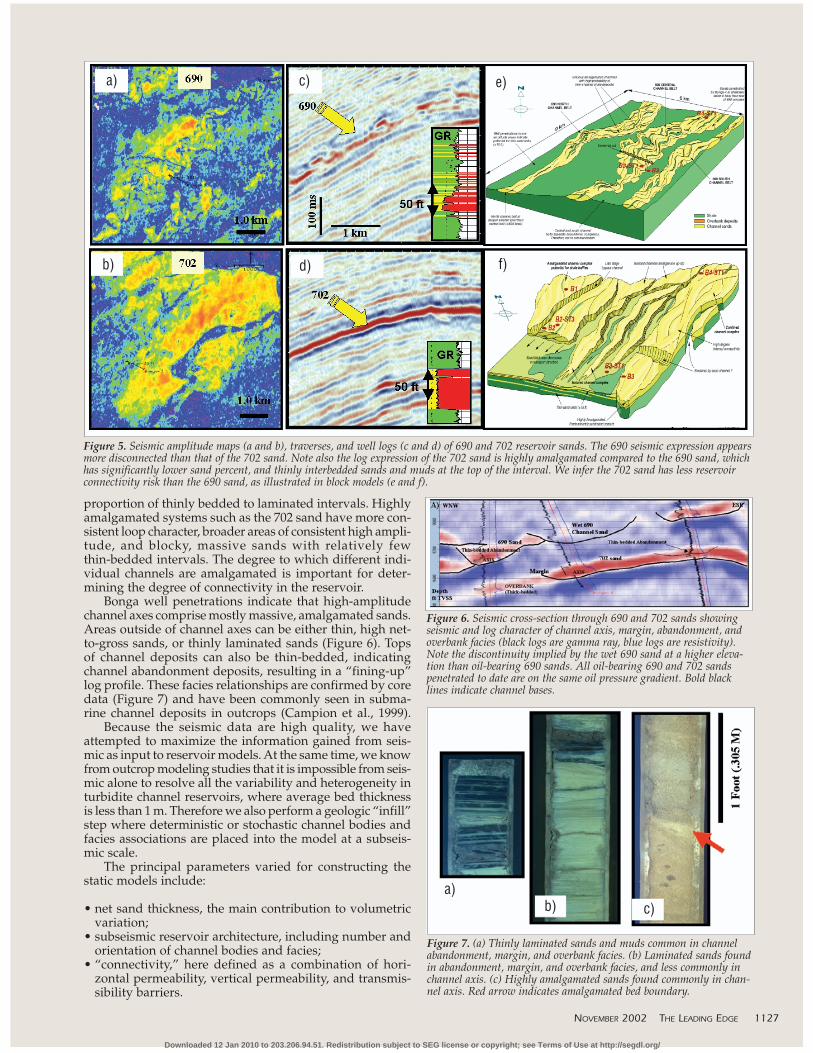
Figures 2 and 3 show the seismic expression of the Bongaaccumulation. The Bonga sands are unconsolidated andacoustically soft with rising AVO when oil-filled. They areessentially seismically invisible when brine-filled. Seismicamplitude maps show areas of generally thicker net oil pay.The largest reservoir is the 702 sand. A seismic amplitudemap draped on a 3D structure surface of the 702 sand illus-trates some general aspects of the Bonga accumulation(Figure 3).
The Bonga structure is a south-plunging anticline coredby mobile shale. This mobile shale forms a diapiric struc-ture and pierces the seabed north of the field. Normal faultsare present at the crest of the structure, and are more preva-lent toward the north as the mud diapir is approached. The
shale has been active since at least the early Miocene, andwe interpret sand deposition to have been impacted by thisgrowing structure. The switch-off of the high seismic ampli-tude conforms to structure downdip—indicating the inferredoil-water contact. However, in other areas, high amplitudesdo not conform to the same structure contour or to faults,indicating the lateral edges of the accumulation are con-trolled by stratigraphic sand pinchouts. Dim shoestring-like channels interrupt the seismic amplitude continuity ofthe 702 sand. We interpret these as mud-filled channelswhere sand has largely been eroded away. Integrated analy-sis of seismic, cores, logs, and image logs indicate mostBonga sands comprise channelized turbidites.
The sand and oil quality of these reservoirs is high. Theoverall crude quality in the Bonga Field is good with an aver-age in-situ viscosity less than 1cP and an average API grav-ity of 30° (Varley, 1999). The porosity range is 20-37%. Coresshow the sand is unconsolidated with Darcy-scale perme-ability.
Subsurface challenges and modeling approach. Bongareservoirs are undersaturated, but close to bubble point.Because high permeability will support high productionrates, high-rate water injection is planned from start-up, toprovide pressure support and to sweep additional volumesnot captured by depletion. Bonga Field for the most part isinterpreted to have relatively weak aquifer support. In addi-tion, because of high drilling costs in this deepwater setting,the field is planned with relatively little appraisal drilling,and the development well spacing is also sparse (averag-ing 1-2 km between injection and production wells).
The principal subsurface challenges in these types ofreservoirs are: understanding the distribution of thick, high-quality reservoir sands, and understanding the reservoir con-nectivity and sweep efficiency between injection andproduction wells.
These parameters impact assessment of oil-in-place,recoverable volumes, and, in combination with structuralconfiguration, directly influence well count and location.
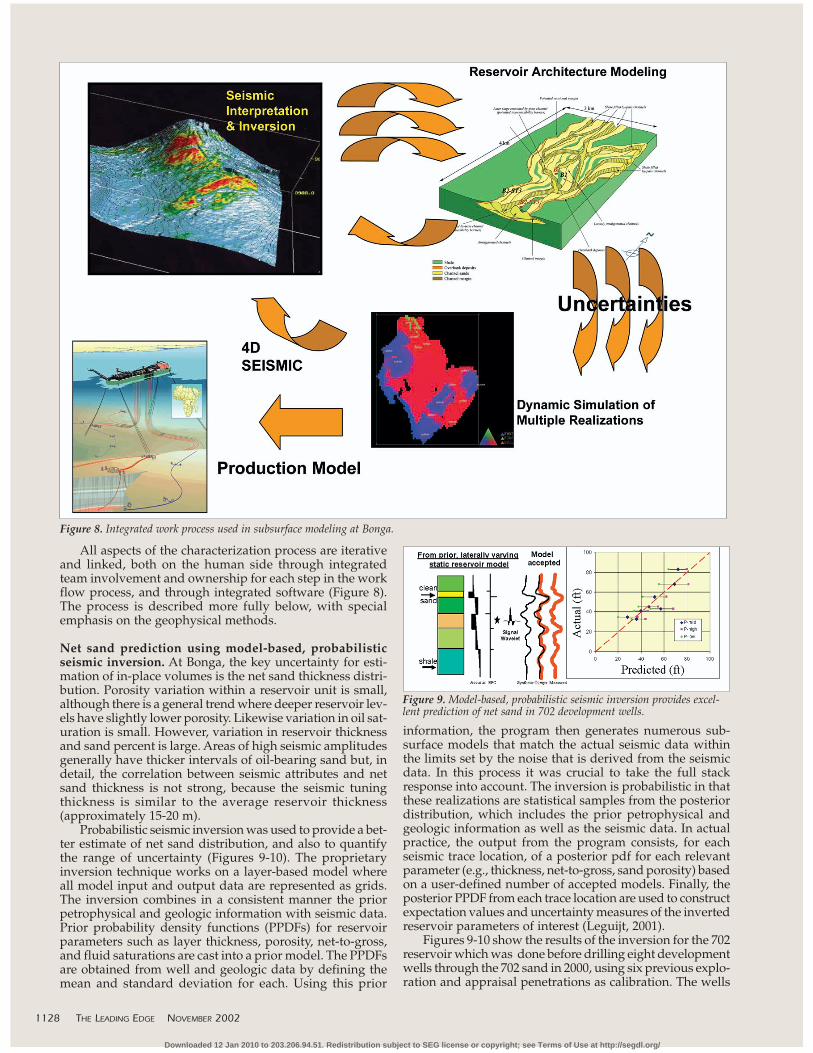
Figure 4 simply illustrates the development concept forBonga with reference to the entire network. Continuitythrough the waterflood system, from injection well, throughthe reservoir and production well, and through the subseanetwork is key for maximizing reserves capture. If the injec-tion system or the reservoir communication is less than ade-quate, the production wells can quickly draw the reservoirpressure down below bubble point, releasing potentiallylarge quantities of free gas into the reservoir and wellbore(Leonard et al., 2000). Secondary gas caps could form andgas production rates could be higher than expected, poten-tially restricting the oil production rate due to facility con-straints on gas processing.
Because we have limited appraisal well data and hadno dynamic performance data except for short-term (lessthan three days duration) well tests, we needed to accountfor a great deal of uncertainty in the field development plan.A multiple scenario approach was developed to account forpossible variability in a number of subsurface parameters.This paper will focus mainly on uncertainties in the staticdescription of the reservoir.
Characterization of channel reservoir examples. Two typesof channel reservoirs will be contrasted here—loosely amal-gamated systems and highly amalgamated systems (Figure5). Loosely amalgamated systems such as the 690 sand haverelatively discontinuous seismic loops, abrupt thicknesschanges, sinuous-to-meandering map patterns, and a high
1126 THE LEADING EDGE NOVEMBER 2002
Figure 3. Bonga 702 seismic amplitude displayed on 3D structuremap. Note faults at crest of structure and mud-filled channels cuttingout the high amplitude areas.
Figure 4. High-rate waterflood system sensitivities. See text for discus-sion.
Downloaded 12 Jan 2010 to 203.206.94.51. Redistribution subject to SEG license or copyright; see Terms of Use at http://segdl.org/
proportion of thinly bedded to laminated intervals. Highlyamalgamated systems such as the 702 sand have more con-sistent loop character, broader areas of consistent high ampli-tude, and blocky, massive sands with relatively fewthin-bedded intervals. The degree to which different indi-vidual channels are amalgamated is important for deter-mining the degree of connectivity in the reservoir.
Bonga well penetrations indicate that high-amplitudechannel axes comprise mostly massive, amalgamated sands.Areas outside of channel axes can be either thin, high net-to-gross sands, or thinly laminated sands (Figure 6). Topsof channel deposits can also be thin-bedded, indicatingchannel abandonment deposits, resulting in a “fining-up”log profile. These facies relationships are confirmed by coredata (Figure 7) and have been commonly seen in subma-rine channel deposits in outcrops (Campion et al., 1999).
Because the seismic data are high quality, we haveattempted to maximize the information gained from seis-mic as input to reservoir models. At the same time, we knowfrom outcrop modeling studies that it is impossible from seis-mic alone to resolve all the variability and heterogeneity inturbidite channel reservoirs, where average bed thicknessis less than 1 m. Therefore we also perform a geologic “infill”step where deterministic or stochastic channel bodies andfacies associations are placed into the model at a subseis-mic scale.
The principal parameters varied for constructing thestatic models include:
• net sand thickness, the main contribution to volumetricvariation;
• subseismic reservoir architecture, including number andorientation of channel bodies and facies;
• “connectivity,” here defined as a combination of hori-zontal permeability, vertical permeability, and transmis-sibility barriers.
NOVEMBER 2002 THE LEADING EDGE 1127
Figure 5. Seismic amplitude maps (a and b), traverses, and well logs (c and d) of 690 and 702 reservoir sands. The 690 seismic expression appearsmore disconnected than that of the 702 sand. Note also the log expression of the 702 sand is highly amalgamated compared to the 690 sand, whichhas significantly lower sand percent, and thinly interbedded sands and muds at the top of the interval. We infer the 702 sand has less reservoirconnectivity risk than the 690 sand, as illustrated in block models (e and f).
b)
a) c)
d)
e)
f)
Figure 6. Seismic cross-section through 690 and 702 sands showingseismic and log character of channel axis, margin, abandonment, andoverbank facies (black logs are gamma ray, blue logs are resistivity).Note the discontinuity implied by the wet 690 sand at a higher eleva-tion than oil-bearing 690 sands. All oil-bearing 690 and 702 sandspenetrated to date are on the same oil pressure gradient. Bold blacklines indicate channel bases.
Figure 7. (a) Thinly laminated sands and muds common in channelabandonment, margin, and overbank facies. (b) Laminated sands foundin abandonment, margin, and overbank facies, and less commonly inchannel axis. (c) Highly amalgamated sands found commonly in chan-nel axis. Red arrow indicates amalgamated bed boundary.
b)a)
c)
Downloaded 12 Jan 2010 to 203.206.94.51. Redistribution subject to SEG license or copyright; see Terms of Use at http://segdl.org/
All aspects of the characterization process are iterativeand linked, both on the human side through integratedteam involvement and ownership for each step in the workflow process, and through integrated software (Figure 8).The process is described more fully below, with specialemphasis on the geophysical methods.
Net sand prediction using model-based, probabilisticseismic inversion. At Bonga, the key uncertainty for esti-mation of in-place volumes is the net sand thickness distri-bution. Porosity variation within a reservoir unit is small,although there is a general trend where deeper reservoir lev-els have slightly lower porosity. Likewise variation in oil sat-uration is small. However, variation in reservoir thicknessand sand percent is large. Areas of high seismic amplitudesgenerally have thicker intervals of oil-bearing sand but, indetail, the correlation between seismic attributes and netsand thickness is not strong, because the seismic tuningthickness is similar to the average reservoir thickness(approximately 15-20 m).
Probabilistic seismic inversion was used to provide a bet-ter estimate of net sand distribution, and also to quantifythe range of uncertainty (Figures 9-10). The proprietaryinversion technique works on a layer-based model whereall model input and output data are represented as grids.The inversion combines in a consistent manner the priorpetrophysical and geologic information with seismic data.Prior probability density functions (PPDFs) for reservoirparameters such as layer thickness, porosity, net-to-gross,and fluid saturations are cast into a prior model. The PPDFsare obtained from well and geologic data by defining themean and standard deviation for each. Using this prior
information, the program then generates numerous sub-surface models that match the actual seismic data withinthe limits set by the noise that is derived from the seismicdata. In this process it was crucial to take the full stackresponse into account. The inversion is probabilistic in thatthese realizations are statistical samples from the posteriordistribution, which includes the prior petrophysical andgeologic information as well as the seismic data. In actualpractice, the output from the program consists, for eachseismic trace location, of a posterior pdf for each relevantparameter (e.g., thickness, net-to-gross, sand porosity) basedon a user-defined number of accepted models. Finally, theposterior PPDF from each trace location are used to constructexpectation values and uncertainty measures of the invertedreservoir parameters of interest (Leguijt, 2001).
Figures 9-10 show the results of the inversion for the 702reservoir which was done before drilling eight developmentwells through the 702 sand in 2000, using six previous explo-ration and appraisal penetrations as calibration. The wells
1128 THE LEADING EDGE NOVEMBER 2002
Figure 9. Model-based, probabilistic seismic inversion provides excel-lent prediction of net sand in 702 development wells.
Figure 8. Integrated work process used in subsurface modeling at Bonga.
Downloaded 12 Jan 2010 to 203.206.94.51. Redistribution subject to SEG license or copyright; see Terms of Use at http://segdl.org/

in the predicted versus actual plot in Figure 9 representblind tests and display good correlation, with five of the eightwells coming very close to the mid-case (P50) prediction.The net sand maps in Figure 10 illustrate the probabilisticoutput from the inversion package for low, mid, and highcases. Each map fits the well data used to constrain themodel. The net sand map for the prior input model is shownfor comparison. The prior net sand map was estimated usingtraditional amplitude calibration techniques and fit to wellcontrol. The three net sand maps were used to constrain threedifferent “oil-in-place” scenarios in static models carriedthrough to reservoir simulation.
Geologic infill scenarios. Although we have developed con-fidence in the net sand estimation for the 702 sand interval,we know from well logs, cores, and outcrop analog studiesthat smaller-scale geologic elements and heterogeneities arepresent that cannot be directly imaged by seismic data alone.Several “infill” realizations were constructed by placing chan-nel bodies into the static model, then constraining the modelback to the original net sand map derived from inversion(Figure 11). The channel bodies are placed primarily deter-ministically using several techniques.
We estimated the typical channel width from seismicamplitude maps at reservoir level, and the channel depths bythe thickness of interpreted channel storeys seen in core andlogs. We also compared the widths and depths to outcrop datasets and well-imaged channels shallower in the section. Theaspect ratio of channel width to thickness is approximately 20in our reservoir levels. These are similar to those in our shal-low analogs and previous outcrop studies (Clark andPickering, 1997), giving confidence to our dimensional esti-mates. Clues from seismic attribute maps such as crescent-shaped map patterns helped place channels. Higherconcentrations of channels were placed in areas of thick netsand. 3D body checking using seismic amplitude cut-offs, anddetailed loop shape mapping were used where possible to con-strain the channels. Several realizations of channel density, ori-entation, and amalgamation for each reservoir were tested insimulation models, with the two scenarios having the mostdifference in performance being selected to take through theentire modeling process.
Connectivity modeling. To limit the number of simulationruns, we combined variability in horizontal permeability, ver-tical permeability, and transmissibility barriers into low, mid,and high scenarios of “reservoir connectivity.” A discussionof the details of permeability assignment is outside the scopeof this paper. However, the biggest single influence on con-nectivity was the transmissibility barriers placed into themodel. These represent both the faults and the stratigraphicbarriers, for example mud-filled channels or channel marginshale drapes, that may interrupt lateral reservoir continuity.
Seismic equal-amplitude surfaces (isosurfaces) were usedin conjunction with amplitude and semblance (similar tocoherence) maps to identify faults and potential stratigraphicdiscontinuities. The isosurfaces could be extracted at differ-ent amplitude cutoffs to give a graduated indication of whichportions of the reservoir were more consistently connected(Figure 12). Transmissibility barriers for all scenarios wereplaced between areas that were disconnected even underrelaxed amplitude threshholds. Baffles with variable trans-missibility were placed between areas that became discon-nected at tighter threshholds. These baffles might havetransmissibility factors that are very low to zero in low con-nectivity scenarios, and higher in medium to high connectiv-ity scenarios.
Multiple realization modeling to quantify uncertainty. Foreach of the four main reservoirs, two final reservoir architec-tures, three oil-in-place scenarios, and three connectivity sce-narios were evaluated through final reservoir simulation. Allpotential combinations were simulated, resulting in 18 simu-lation runs per reservoir and 72 for the field. The scenarioswere simulated using the same well placement, which wasoptimized on the mid case. The output profiles for the multi-ple scenarios for the four reservoirs were analyzed usingMonte-Carlo simulation to determine combined field P85-P50-P15 cases. These three cases were input to an inte-grated flowline and surface facility network model to under-stand possible operational constraints.
Table 1 shows relative impacts of the geologic parame-ters for the 690 and 702 reservoirs.
The most dramatic impact is that of connectivity on the690 reservoir. The wide range in potential recovery for the690 sand reflects our uncertainty in the connectivity and pro-ductivity of that reservoir, as noted earlier. Perhaps sur-prising is the relatively low impact of different reservoir infillarchitectures. We interpret that this is because the flow prop-erty variation assigned to those architectures is incorpo-
NOVEMBER 2002 THE LEADING EDGE 1129
Figure 11. Two architectural scenarios of a channel fill model: (a)shows a more disconnected scenario, where sand-filled channels aremostly separated from each other by preserved mudstone drapes, andwhere interchannel areas have discontinuous thin beds and shales; (b)shows a more amalgamated case, where sand-filled channels are wellconnected and where interchannel areas comprise more continuousthin-bedded sands that can connect different channels.
Figure 10. Model-based, probabilistic seismic inversion provides low,mid, and high scenarios for net sand distribution, which is the maindriver for variation in oil in place estimates.
b)
a)
Downloaded 12 Jan 2010 to 203.206.94.51. Redistribution subject to SEG license or copyright; see Terms of Use at http://segdl.org/

rated into the “connectivity” parameter, leaving geometryas the only variable in the architecture scenarios.
The results in Table 1 incompletely capture the additionaleffect of dependencies. For example, our assignment of hori-zontal and vertical permeability is partly dependent on faciesand sand percent. Therefore low volume cases having loweraverage sand percent can also have lower connectivity.Likewise, high volume cases, in addition to having higher sandpercent and potential connectivity, also have access in somereservoirs to wider drainage areas. A comprehensive discus-sion of these factors is beyond the scope of this paper, but thesevariable dependencies are the reason why we carry out sim-ulations on the full range of combinations, and do not, forexample, only investigate vari-ations from the mid case.Numerous additional reservoir engineering sensitivities werein fact investigated parametrically by their deviation from themid case. These included relative permeability, aquiferstrength, horizontal versus vertical wells, and others.
Managing uncertainty in the future—4D seismic. Giventhe wide range of potential outcomes prior to start-up, sig-nificant consideration has been given to understandingpotential intervention strategies. All production wells havedownhole pressure sensors, and the development drillingis phased over nine years, with 14 of 37 wells available atfield start-up. Ten of the first oil wells are in the 702 reser-voir, which we interpret to have the least uncertainty. Eachof the other three main reservoirs has at least one well atfirst oil, to get some early production information.
In addition we plan to use repeat seismic surveys (4Dseismic) to understand reservoir sweep through time. Thevalue of 4D seismic in heterogeneous turbidite channel reser-voirs has been shown by Altan (2001) and Leonard (2000)for the Schiehallion and Forties fields, UKCS.
Preliminary time-lapse seismic feasibility studies atBonga show a strong seismic amplitude changes resultingfrom changing water saturation during production (Figure13). Saturation and pressure changes predicted from thesimulation models were converted to an elastic earth modelvia rock property trends using proprietary software. Theresult showed that oil-filled reservoirs, which appear asbright low impedance reflectors on seismic, become almostinvisible when swept by the aquifer. High, mid, and lowscenarios were simulated to quantify the uncertainty. Fromthis evidence, judgments as to the most appropriate time toacquire repeat surveys can be made in conjunction with theschedule for planned development drilling.
It is recognized that the likely outcome will be differentfrom existing models; however, a multiscenario approachto 4D seismic simulation facilitates a better understandingof both reservoir issues in time and the planning of moni-tor surveys. The plan currently consists of a reshoot of theexisting 3D seismic to establish a base line and three repeatsurveys at intervals of 18 months to 2 years after the startof production in late 2003-early 2004.
Other in-field opportunities. In addition to the four main
1130 THE LEADING EDGE NOVEMBER 2002
Figure 13. 4D seismic predicted response from simulation models. (a)and (b) are net oil thickness maps from reservoir simulation at begin-ning of production and after 2 years. (c) and (d) are predicted seismicamplitude maps (synthetic) corresponding to those simulation models.
Figure 12. Illustration of seismic isosurfaces at different amplitudecutoffs to show different potential drainage areas. The underlying mapshows the 702 amplitude. The four patches colored from north to south(pink, green, purple, and dark blue) show major drainage areas of the702 sand, separated by faults and mud-filled channels. The light blueoverlay shows isosurfaces at a tighter cutoff indicating smaller con-nected amplitude areas. The red wells are production wells, blue arewater injection wells, and black are exploration and appraisal wells.
b)a)
c) d)
Table 1. The relative impacts of the geologic parameters for the 690 and 702 reservoirsReservoirParameterPlus from mid
(percent higher)Minus from mid
(percent lower)
702Oil in place+23
-20
690Oil in place+22
-19
702Architecture+8
-8
690Architecture+8
-8
702Connectivity+17
-17
690Connectivity+33
-58
Downloaded 12 Jan 2010 to 203.206.94.51. Redistribution subject to SEG license or copyright; see Terms of Use at http://segdl.org/
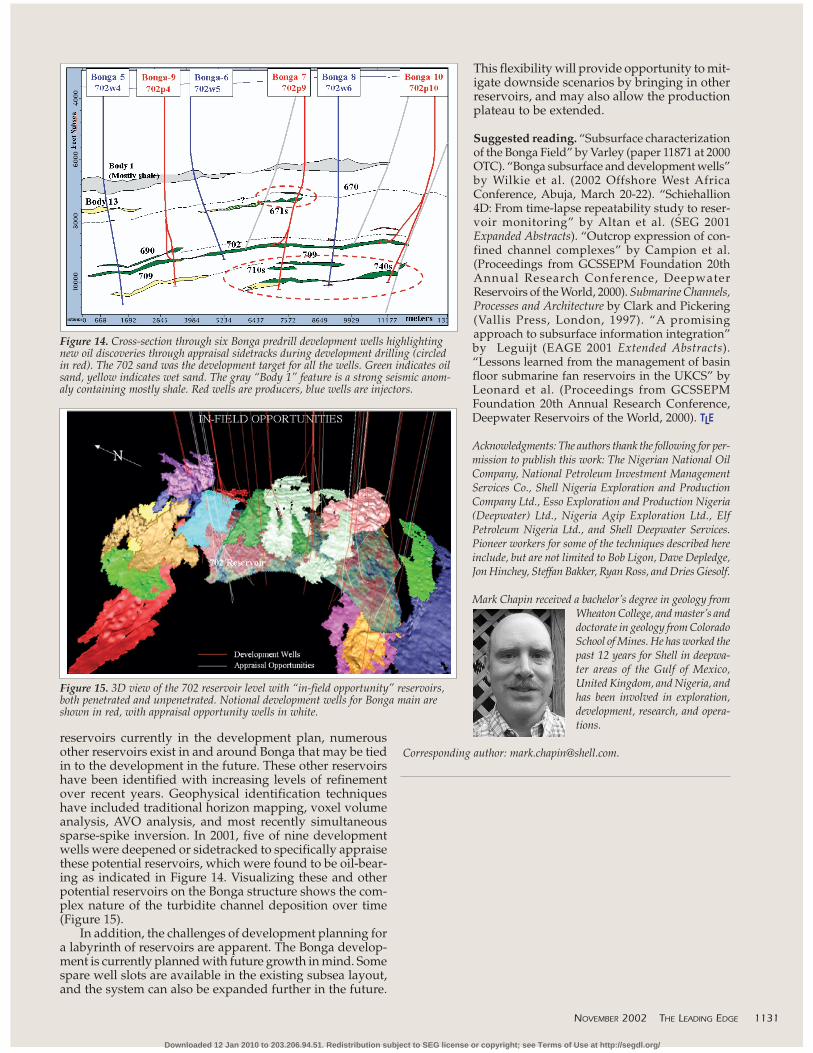
reservoirs currently in the development plan, numerousother reservoirs exist in and around Bonga that may be tiedin to the development in the future. These other reservoirshave been identified with increasing levels of refinementover recent years. Geophysical identification techniqueshave included traditional horizon mapping, voxel volumeanalysis, AVO analysis, and most recently simultaneoussparse-spike inversion. In 2001, five of nine developmentwells were deepened or sidetracked to specifically appraisethese potential reservoirs, which were found to be oil-bear-ing as indicated in Figure 14. Visualizing these and otherpotential reservoirs on the Bonga structure shows the com-plex nature of the turbidite channel deposition over time(Figure 15).
In addition, the challenges of development planning fora labyrinth of reservoirs are apparent. The Bonga develop-ment is currently planned with future growth in mind. Somespare well slots are available in the existing subsea layout,and the system can also be expanded further in the future.
This flexibility will provide opportunity to mit-igate downside scenarios by bringing in otherreservoirs, and may also allow the productionplateau to be extended.
Suggested reading. “Subsurface characterizationof the Bonga Field” by Varley (paper 11871 at 2000OTC). “Bonga subsurface and development wells”by Wilkie et al. (2002 Offshore West AfricaConference, Abuja, March 20-22). “Schiehallion4D: From time-lapse repeatability study to reser-voir monitoring” by Altan et al. (SEG 2001Expanded Abstracts). “Outcrop expression of con-fined channel complexes” by Campion et al.(Proceedings from GCSSEPM Foundation 20thAnnual Research Conference, DeepwaterReservoirs of the World, 2000). Submarine Channels,Processes and Architecture by Clark and Pickering(Vallis Press, London, 1997). “A promisingapproach to subsurface information integration”by Leguijt (EAGE 2001 Extended Abstracts).“Lessons learned from the management of basinfloor submarine fan reservoirs in the UKCS” byLeonard et al. (Proceedings from GCSSEPMFoundation 20th Annual Research Conference,Deepwater Reservoirs of the World, 2000). TLE
Acknowledgments: The authors thank the following for per-mission to publish this work: The Nigerian National OilCompany, National Petroleum Investment ManagementServices Co., Shell Nigeria Exploration and ProductionCompany Ltd., Esso Exploration and Production Nigeria(Deepwater) Ltd., Nigeria Agip Exploration Ltd., ElfPetroleum Nigeria Ltd., and Shell Deepwater Services.Pioneer workers for some of the techniques described hereinclude, but are not limited to Bob Ligon, Dave Depledge,Jon Hinchey, Steffan Bakker, Ryan Ross, and Dries Giesolf.
Mark Chapin received a bachelor’s degree in geology fromWheaton College, and master’s anddoctorate in geology from ColoradoSchool of Mines. He has worked thepast 12 years for Shell in deepwa-ter areas of the Gulf of Mexico,United Kingdom, and Nigeria, andhas been involved in exploration,development, research, and opera-tions.
Corresponding author: [email protected].
NOVEMBER 2002 THE LEADING EDGE 1131
Figure 15. 3D view of the 702 reservoir level with “in-field opportunity” reservoirs,both penetrated and unpenetrated. Notional development wells for Bonga main areshown in red, with appraisal opportunity wells in white.
Figure 14. Cross-section through six Bonga predrill development wells highlightingnew oil discoveries through appraisal sidetracks during development drilling (circledin red). The 702 sand was the development target for all the wells. Green indicates oilsand, yellow indicates wet sand. The gray “Body 1” feature is a strong seismic anom-aly containing mostly shale. Red wells are producers, blue wells are injectors.
Downloaded 12 Jan 2010 to 203.206.94.51. Redistribution subject to SEG license or copyright; see Terms of Use at http://segdl.org/