Embed Size (px)
Citation preview
INTEGRATED EARTHQUAKE SIMULATIONINTEGRATED EARTHQUAKE SIMULATIONM. HORI
Earthquake Research Institute, University of Tokyo
CONTENTSFull computation of earthquake hazards and disastersExamples of integrated earthquake simulation
Department of Mechanical Engineering, Tsinghua
UniversityBeijing, RPC, July 7, 2006
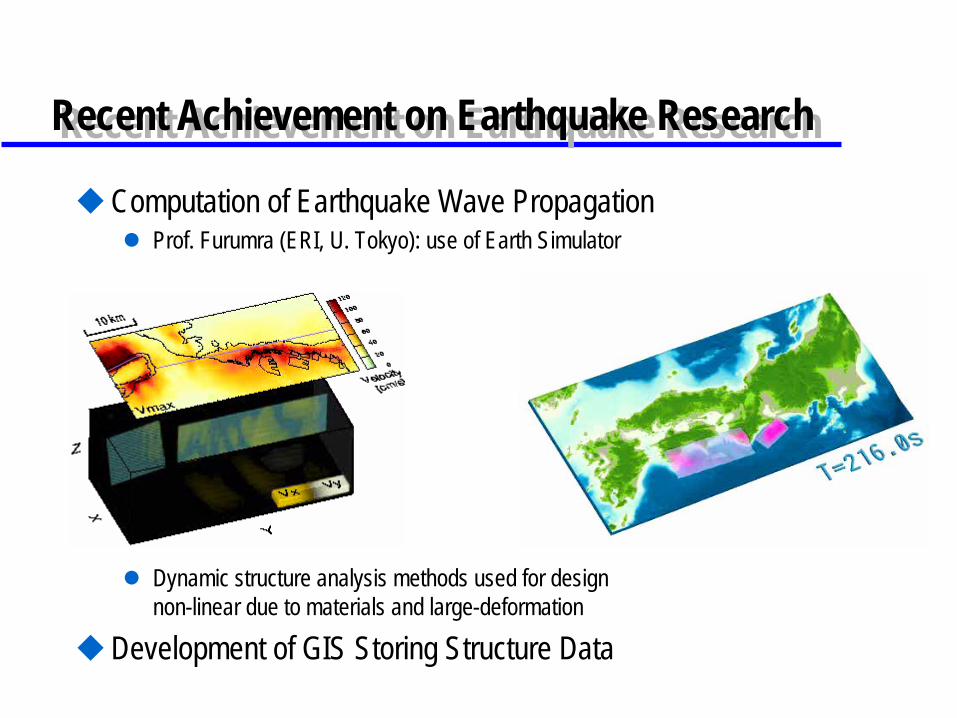
Recent Achievement on Earthquake ResearchRecent Achievement on Earthquake Research
Computation of Earthquake Wave PropagationProf. Furumra (ERI, U. Tokyo): use of Earth Simulator
Dynamic structure analysis methods used for designnon-linear due to materials and large-deformation
Development of GIS Storing Structure Data
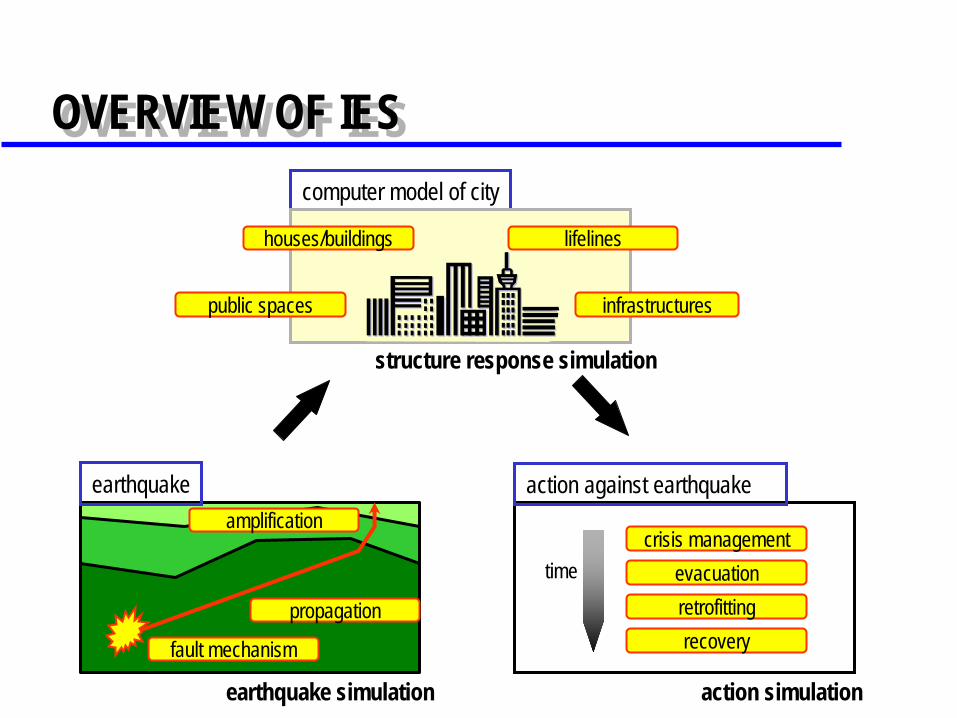
fault mechanism
propagation
amplificationearthquake
computer model of city
structure response simulation
earthquake simulation
action against earthquake
infrastructurespublic spaces
lifelineshouses/buildings
crisis managementevacuation
recoveryretrofitting
action simulation
time
OVERVIEW OF IESOVERVIEW OF IES
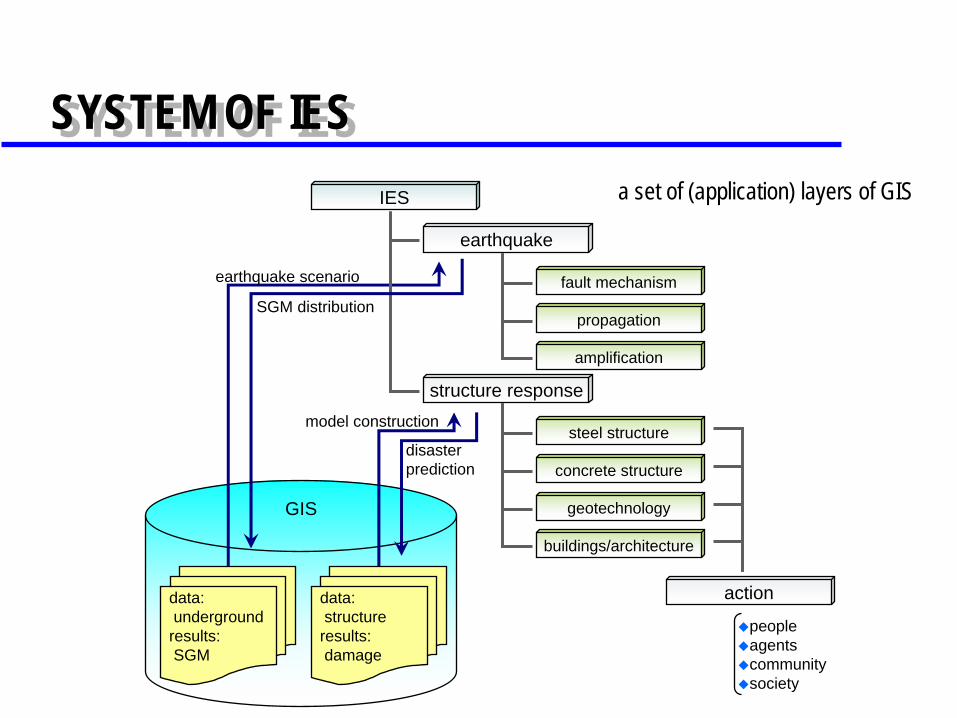
IES
earthquake
structure response
steel structure
concrete structure
geotechnology
buildings/architecture
fault mechanism
propagation
amplification
data:structure
results:damage
data:underground
results:SGM
GIS
action
peopleagentscommunitysociety
earthquake scenario
SGM distribution
model construction
disasterprediction
SYSTEM OF IESSYSTEM OF IESa set of (application) layers of GIS
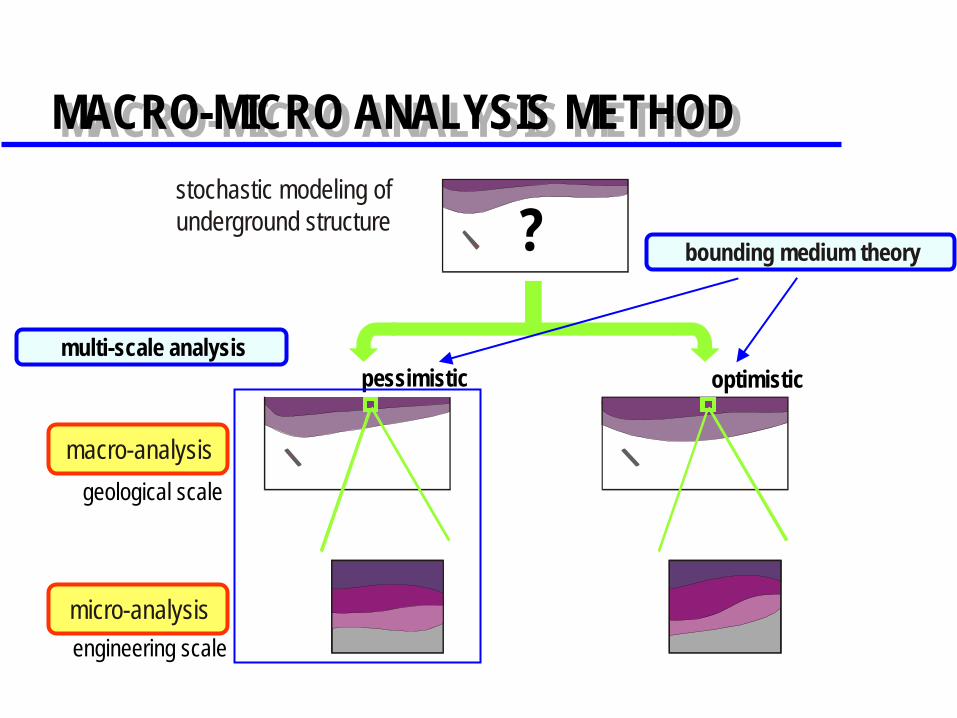
MACRO-MICRO ANALYSIS METHODMACRO-MICRO ANALYSIS METHOD
micro-analysis
macro-analysis
bounding medium theory
multi-scale analysispessimistic optimistic
?stochastic modeling of underground structure
geological scale
engineering scale
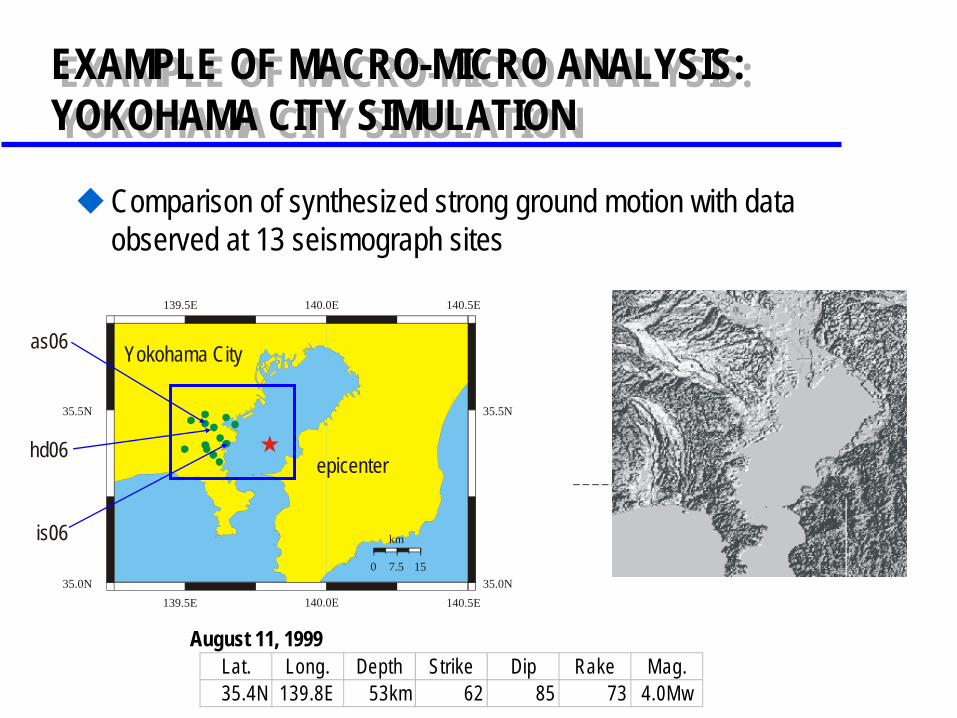
EXAMPLE OF MACRO-MICRO ANALYSIS: YOKOHAMA CITY SIMULATION EXAMPLE OF MACRO-MICRO ANALYSIS: YOKOHAMA CITY SIMULATION
Comparison of synthesized strong ground motion with data observed at 13 seismograph sites
August 11, 1999
139.5E
139.5E
140.0E
140.0E
140.5E
140.5E
35.0N 35.0N
35.5N 35.5N
0 7.5 15
km
epicenter
as06
is06
hd06
Yokohama City
Lat. Long. Depth Strike Dip Rake Mag.35.4N 139.8E 53km 62 85 73 4.0Mw
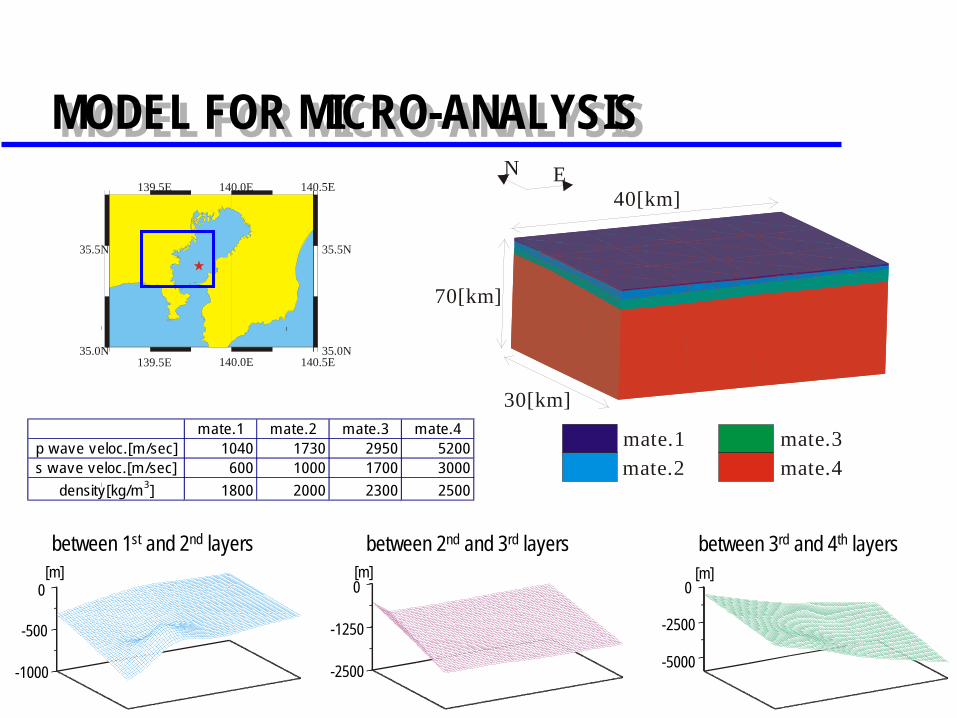
MODEL FOR MICRO-ANALYSISMODEL FOR MICRO-ANALYSIS
30[km]
40[km]
70[km]
EN
mate.2mate.1
mate.4mate.3m ate.1 m ate.2 m ate.3 m ate.4
p wave veloc.[m /sec] 1040 1730 2950 5200s wave veloc.[m /sec] 600 1000 1700 3000
density[kg/m 3] 1800 2000 2300 2500
139.5E
139.5E
140.0E
140.0E
140.5E
140.5E
35.0N 35.0N
35.5N 35.5N
0
-500
-1000
[m]0
-2500
-5000
[m]0
-1250
-2500
[m]between 1st and 2nd layers between 2nd and 3rd layers between 3rd and 4th layers
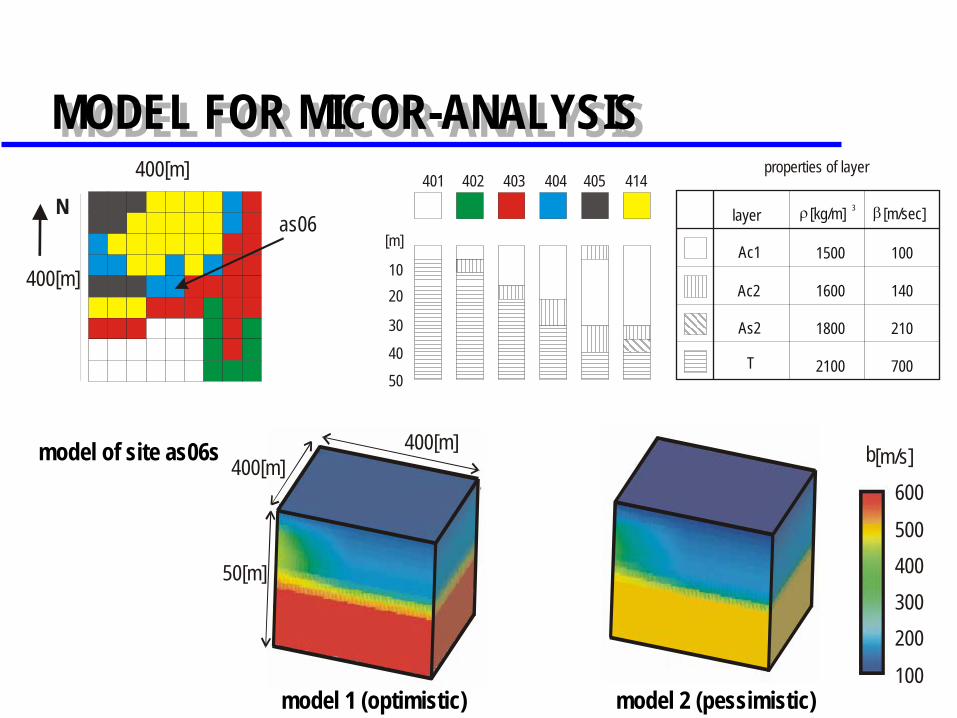
MODEL FOR MICOR-ANALYSISMODEL FOR MICOR-ANALYSIS
model 1 (optimistic) model 2 (pessimistic)
model of site as06s
400[m]
as06N
400[m]
[m]
1020
50
30
40
401 402 403 405 414404
700
210
140
100
2100
1800
1600
1500
Ac2
Ac1
T
As2
ρ[kg/m] 3 β[m/sec]layer
properties of layer
400[m]
100
400
200
500
300
b[m/s]600
400[m]
50[m]
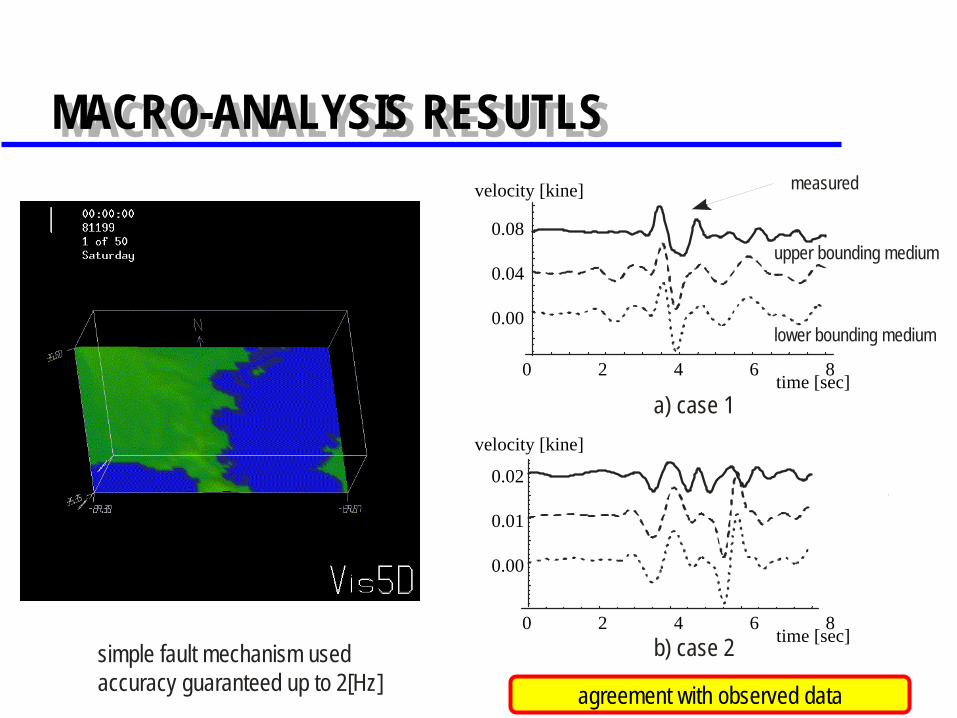
MACRO-ANALYSIS RESUTLSMACRO-ANALYSIS RESUTLS
a) case 1
b) case 2
lower bounding medium
upper bounding medium
measuredvelocity [kine]
0.08
0.04
0.00
20 4 6 8time [sec]
velocity [kine]
0.02
0.01
0.00
20 4 6 8time [sec]
agreement with observed data
simple fault mechanism usedaccuracy guaranteed up to 2[Hz]
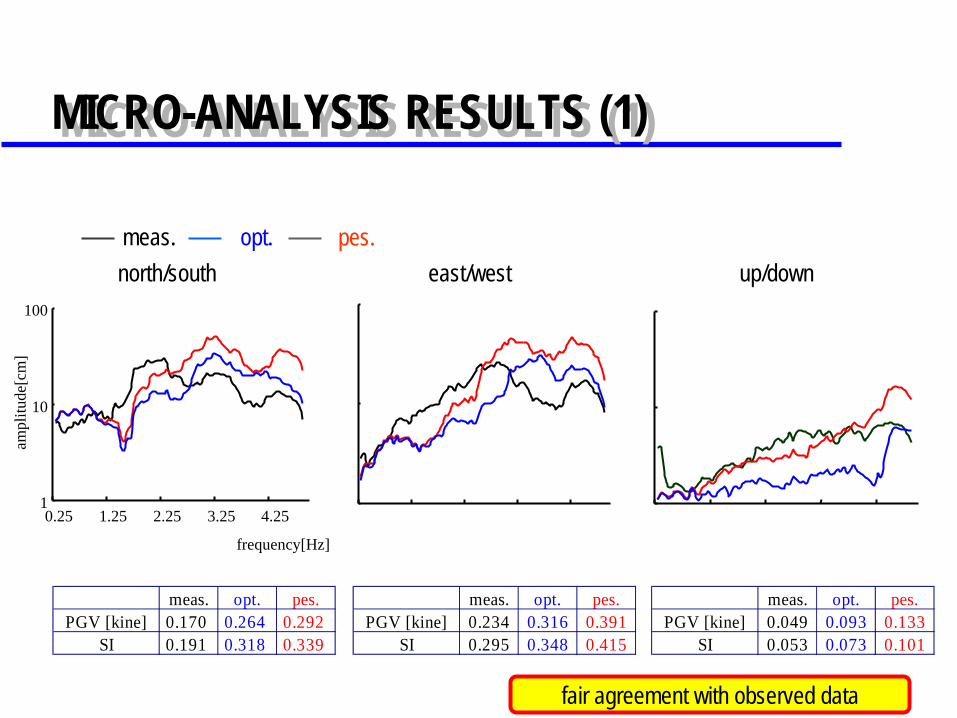
MICRO-ANALYSIS RESULTS (1)MICRO-ANALYSIS RESULTS (1)
east/west up/down
frequency[Hz]
1
10
100
0.25 1.25 2.25 3.25 4.25
ampl
itude
[cm
]
north/southmeas. opt. pes.
meas. opt. pes.PGV [kine] 0.234 0.316 0.391
SI 0.295 0.348 0.415
meas. opt. pes.PGV [kine] 0.170 0.264 0.292
SI 0.191 0.318 0.339
meas. opt. pes.PGV [kine] 0.049 0.093 0.133
SI 0.053 0.073 0.101
fair agreement with observed data
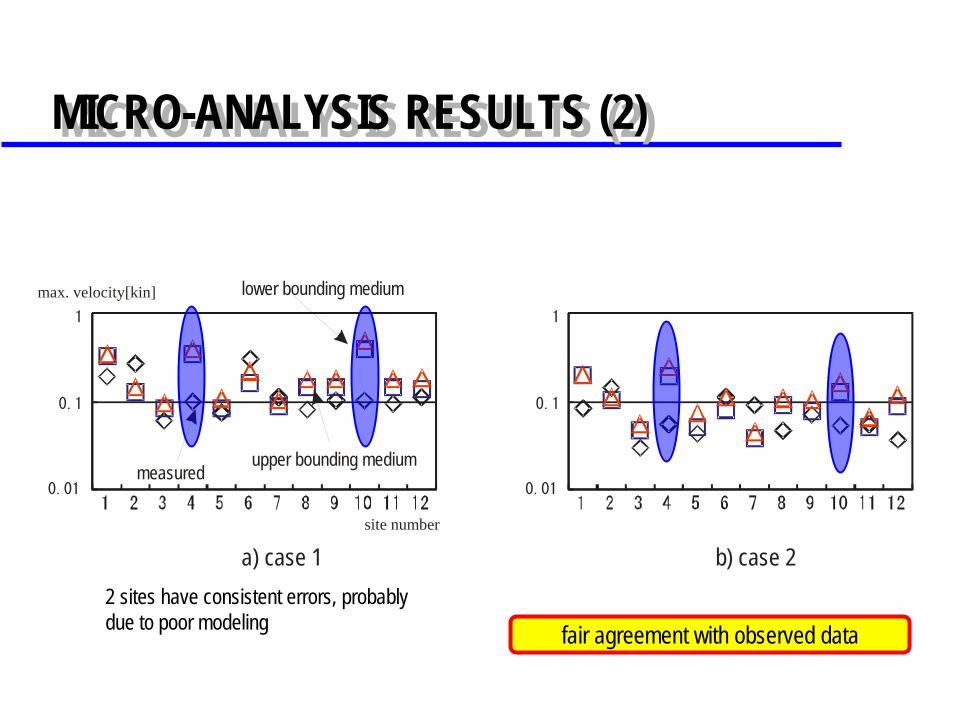
MICRO-ANALYSIS RESULTS (2)MICRO-ANALYSIS RESULTS (2)
1
0.1
0.01
a) case 1 b) case 2
max. velocity[kin]1
0.1
0.01
site number
lower bounding medium
upper bounding mediummeasured
2 sites have consistent errors, probably due to poor modeling fair agreement with observed data
SIMULATION USING GIS DATASIMULATION USING GIS DATA
Structure Data Stored in GISbasic properties (location, owner)configurationstructure type
Construction of Modelspresumption of standard material and structure properties
standard structure model
Automatic Constructionautomatic construction of GIS data to standard structure modelhighest redundancy needed
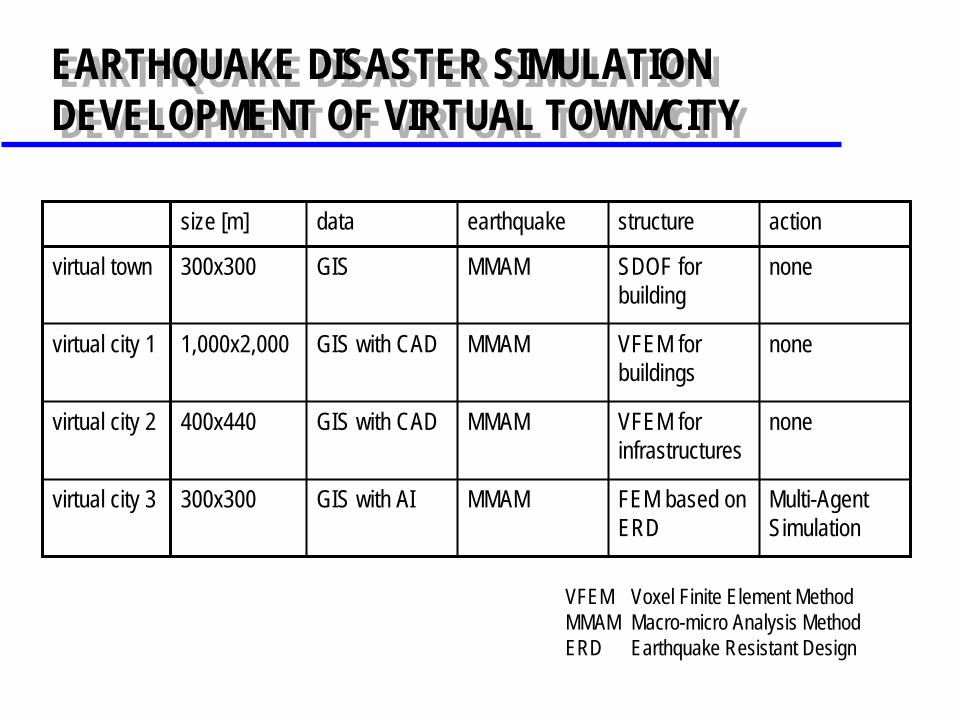
EARTHQUAKE DISASTER SIMULATION DEVELOPMENT OF VIRTUAL TOWN/CITY EARTHQUAKE DISASTER SIMULATION DEVELOPMENT OF VIRTUAL TOWN/CITY
size [m] data earthquake structure action
virtual town 300x300 GIS MMAM SDOF for building
none
virtual city 1 1,000x2,000 GIS with CAD MMAM VFEM for buildings
none
virtual city 2 400x440 GIS with CAD MMAM VFEM for infrastructures
none
virtual city 3 300x300 GIS with AI MMAM FEM based on ERD
Multi-Agent Simulation
VFEM Voxel Finite Element MethodMMAM Macro-micro Analysis MethodERD Earthquake Resistant Design
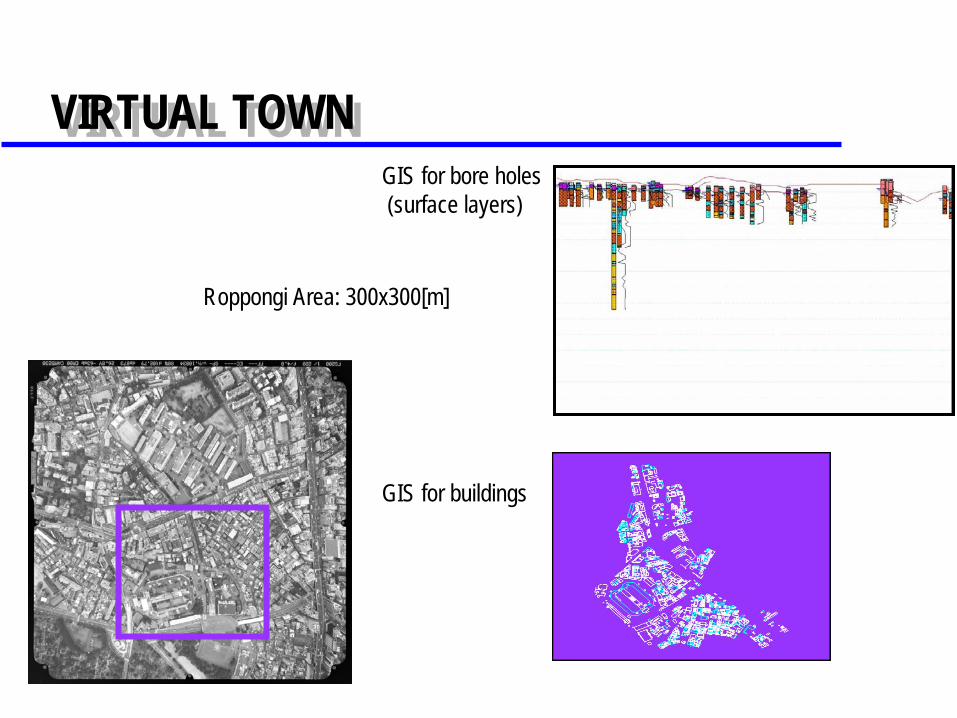
VIRTUAL TOWNVIRTUAL TOWN
Roppongi Area: 300x300[m]
GIS for bore holes(surface layers)
GIS for buildings
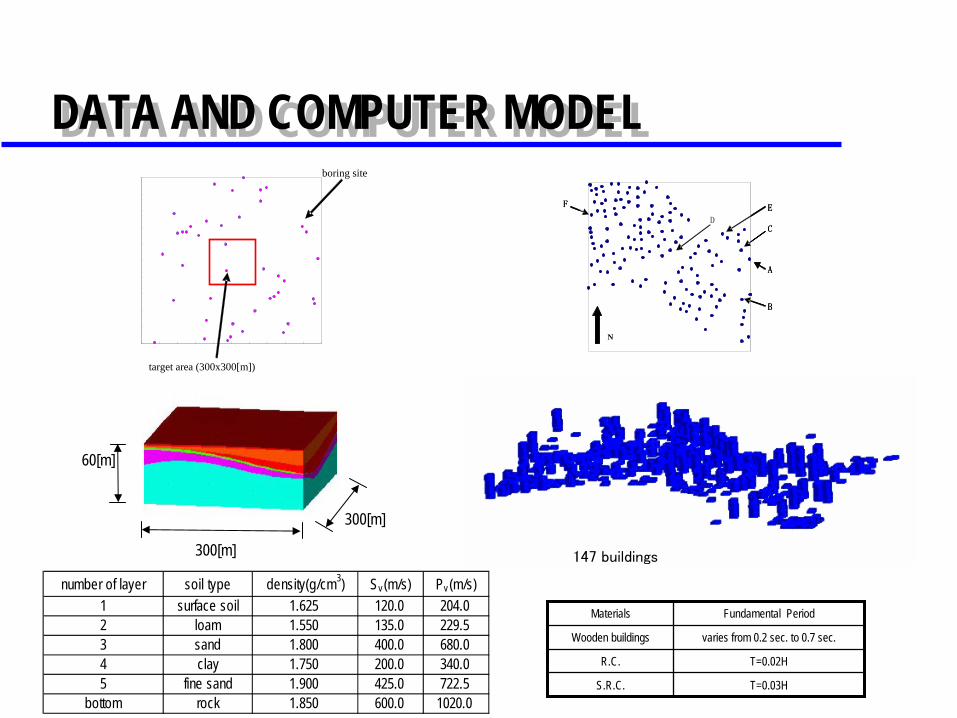
DATA AND COMPUTER MODELDATA AND COMPUTER MODEL
number of layer soil type density(g/cm3) Sv(m/s) Pv (m/s)1 surface soil 1.625 120.0 204.02 loam 1.550 135.0 229.53 sand 1.800 400.0 680.04 clay 1.750 200.0 340.05 fine sand 1.900 425.0 722.5
bottom rock 1.850 600.0 1020.0
60[m]
300[m]
300[m]
target area (300x300[m])
boring site
C
B
D
EF
N
A
C
B
D
EF
N
A
C
B
D
EF
N
A
147 buildings
Materials Fundamental Period
Wooden buildings varies from 0.2 sec. to 0.7 sec.
R.C. T=0.02H
S.R.C. T=0.03H
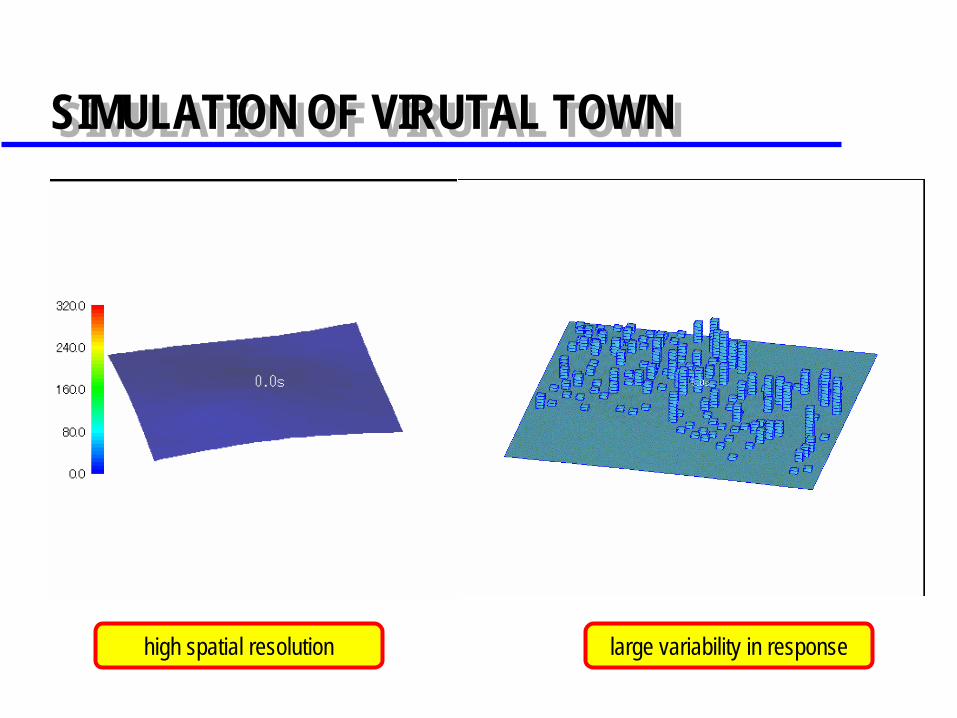
SIMULATION OF VIRUTAL TOWNSIMULATION OF VIRUTAL TOWN
high spatial resolution large variability in response
borehole data
CAD data
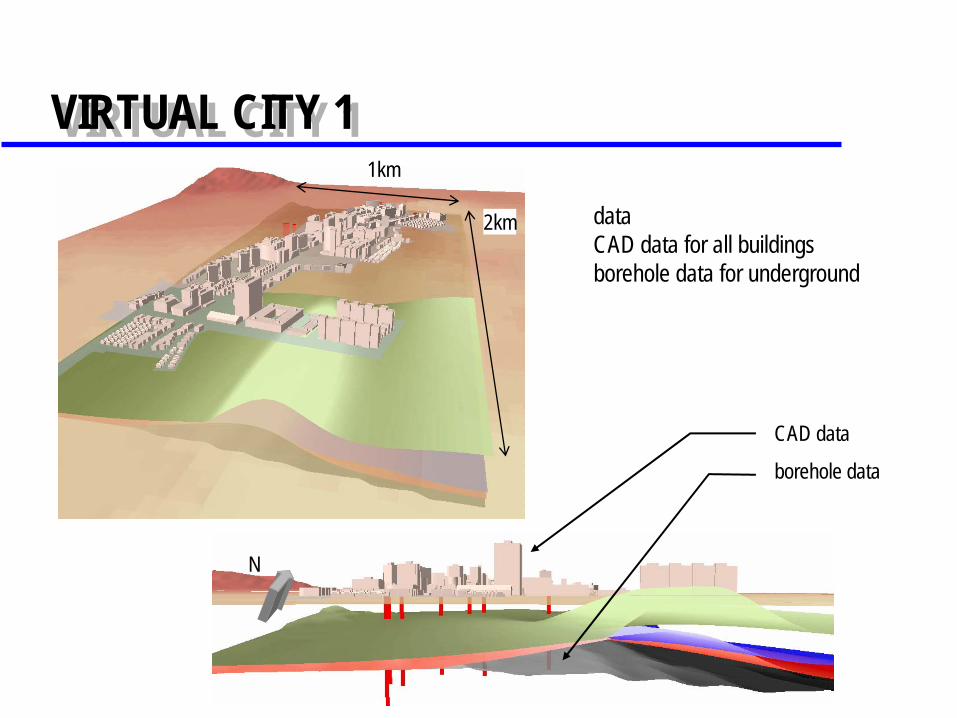
VIRTUAL CITY 1VIRTUAL CITY 11km
2km dataCAD data for all buildingsborehole data for underground
N
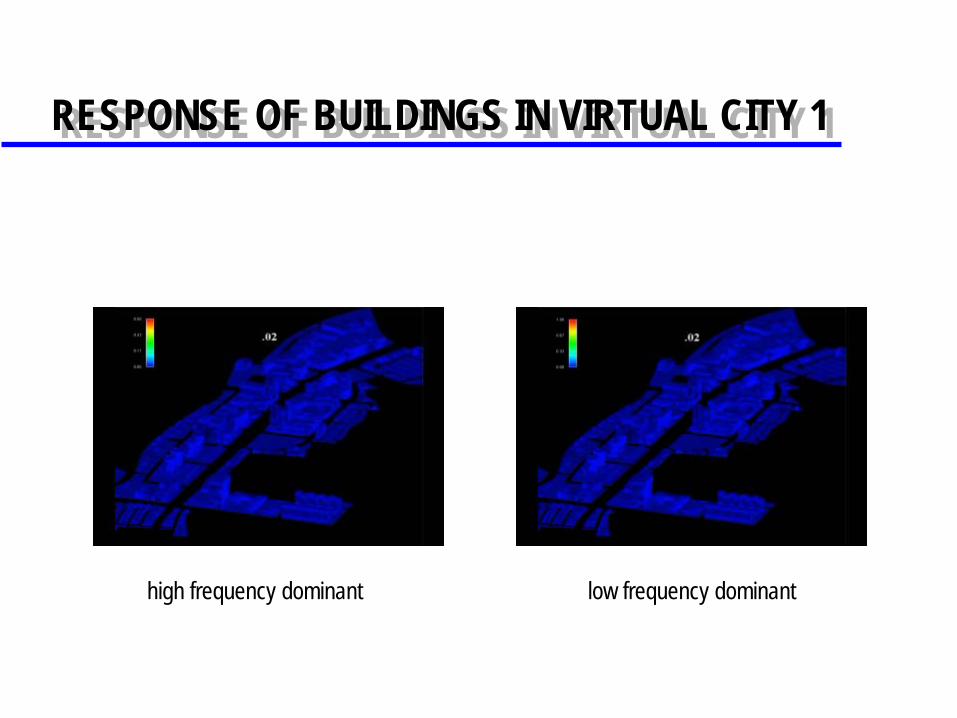
high frequency dominant low frequency dominant
RESPONSE OF BUILDINGS IN VIRTUAL CITY 1RESPONSE OF BUILDINGS IN VIRTUAL CITY 1
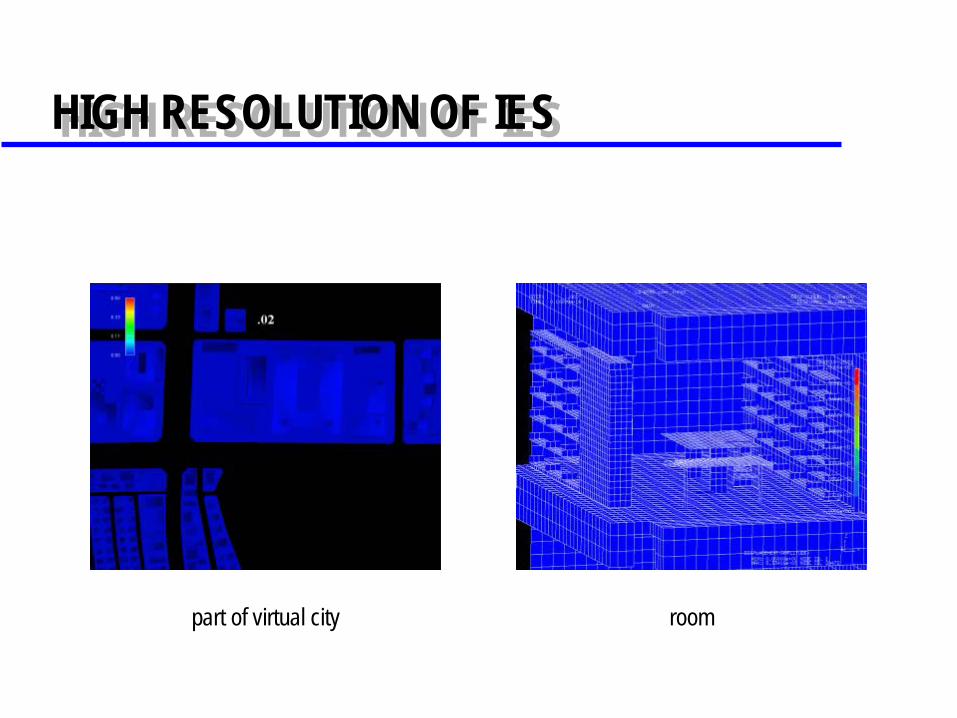
HIGH RESOLUTION OF IESHIGH RESOLUTION OF IES
part of virtual city room
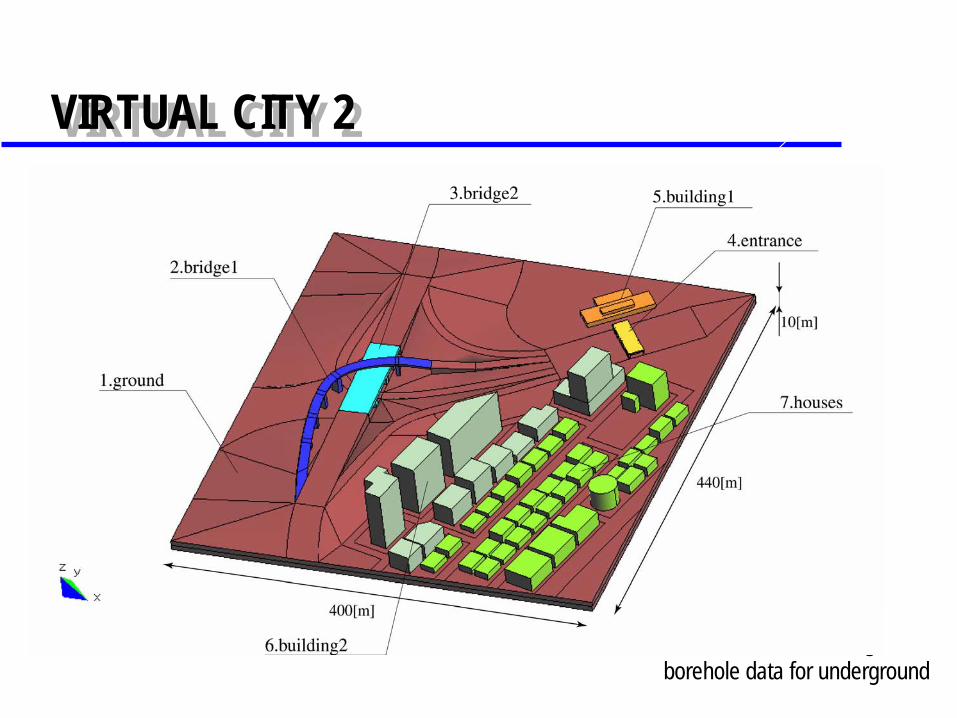
VIRTUAL CITY 2VIRTUAL CITY 2
dataCAD data for all buildingsborehole data for underground
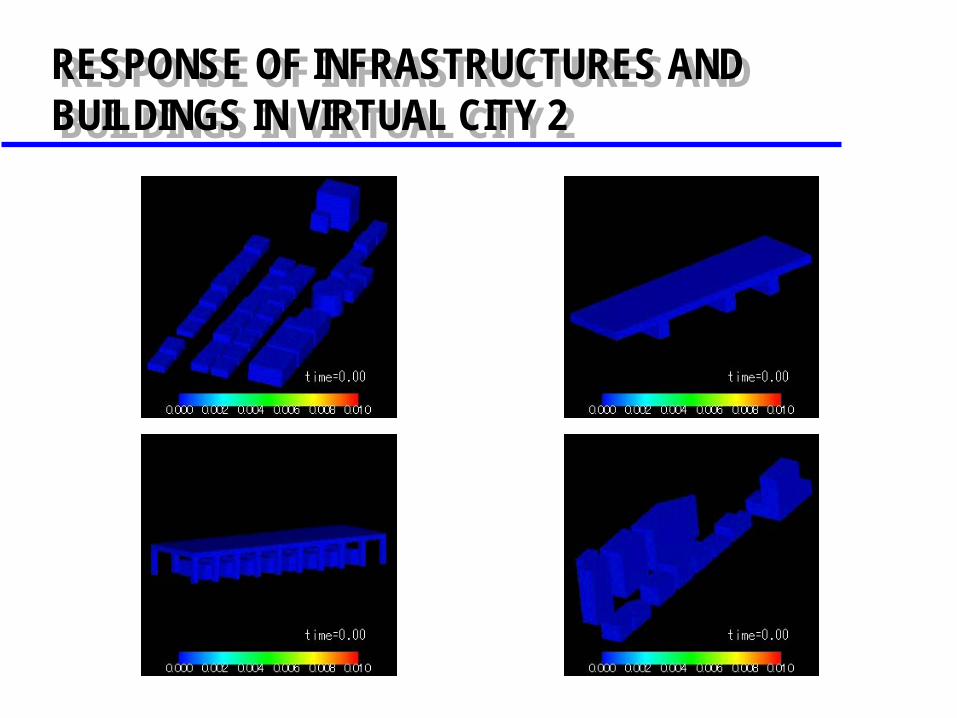
RESPONSE OF INFRASTRUCTURES AND BUILDINGS IN VIRTUAL CITY 2 RESPONSE OF INFRASTRUCTURES AND BUILDINGS IN VIRTUAL CITY 2
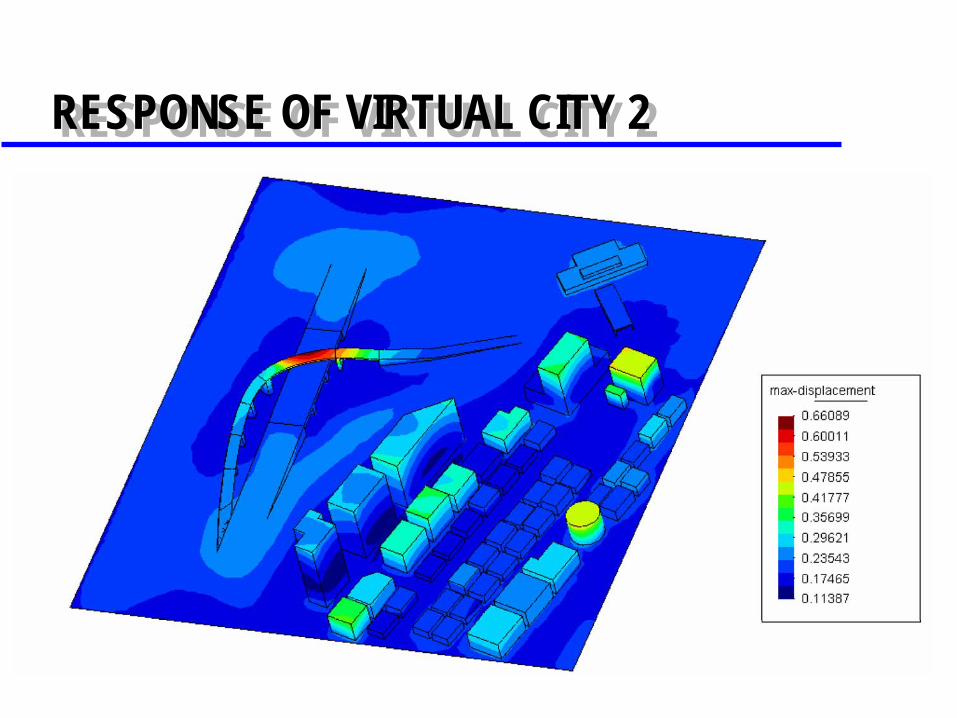
RESPONSE OF VIRTUAL CITY 2RESPONSE OF VIRTUAL CITY 2
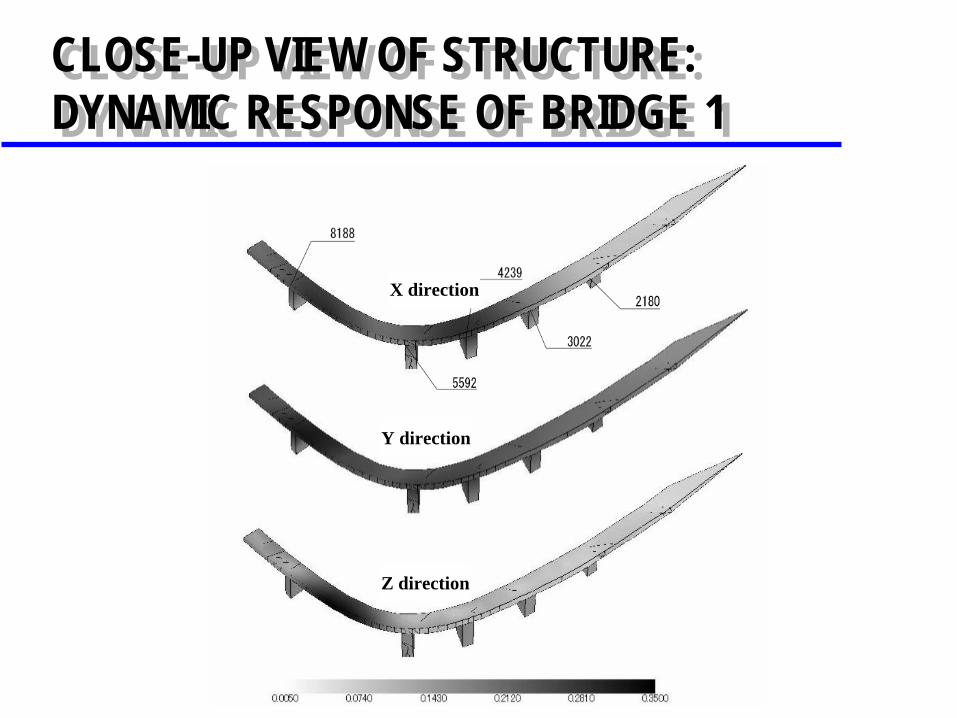
CLOSE-UP VIEW OF STRUCTURE: DYNAMIC RESPONSE OF BRIDGE 1 CLOSE-UP VIEW OF STRUCTURE: DYNAMIC RESPONSE OF BRIDGE 1
X direction
Y direction
Z direction
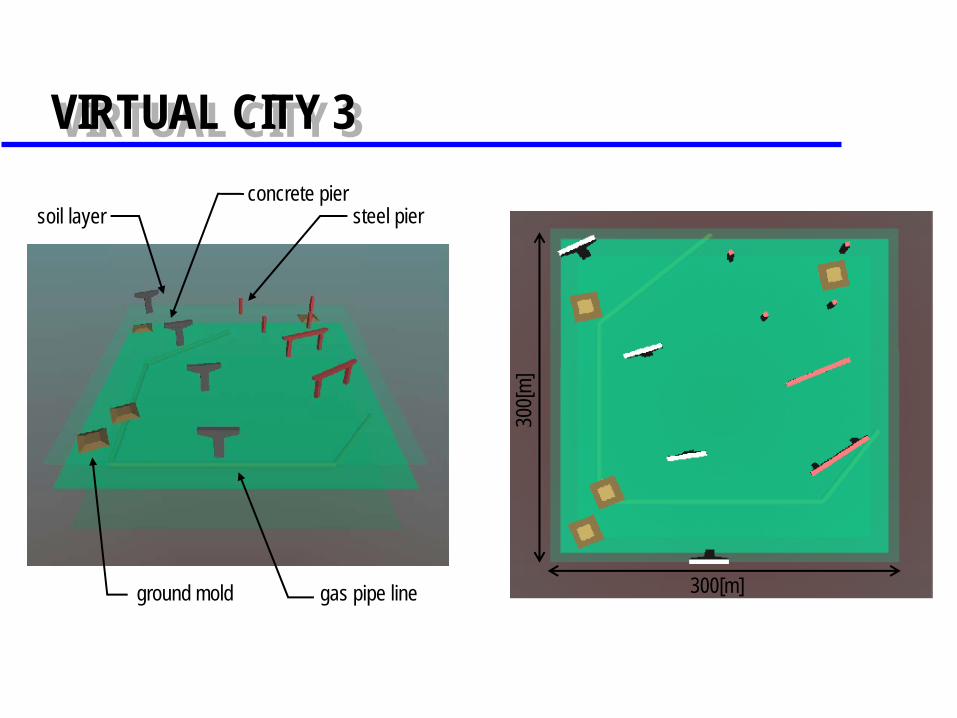
VIRTUAL CITY 3VIRTUAL CITY 3
soil layerconcrete pier
steel pier
ground mold gas pipe line 300[m]
300[m
]
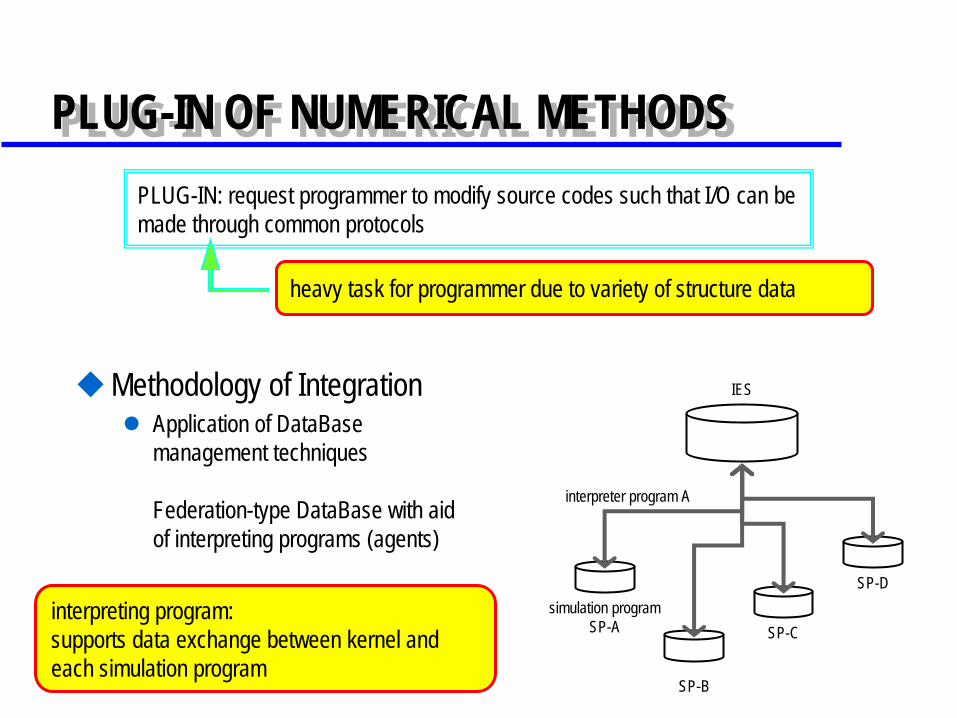
PLUG-IN OF NUMERICAL METHODSPLUG-IN OF NUMERICAL METHODS
Methodology of IntegrationApplication of DataBase management techniques
Federation-type DataBase with aid of interpreting programs (agents)
PLUG-IN: request programmer to modify source codes such that I/O can be made through common protocols
heavy task for programmer due to variety of structure data
interpreting program: supports data exchange between kernel and each simulation program
SP-Csimulation program
SP-A
SP-D
SP-B
interpreter program A
IES
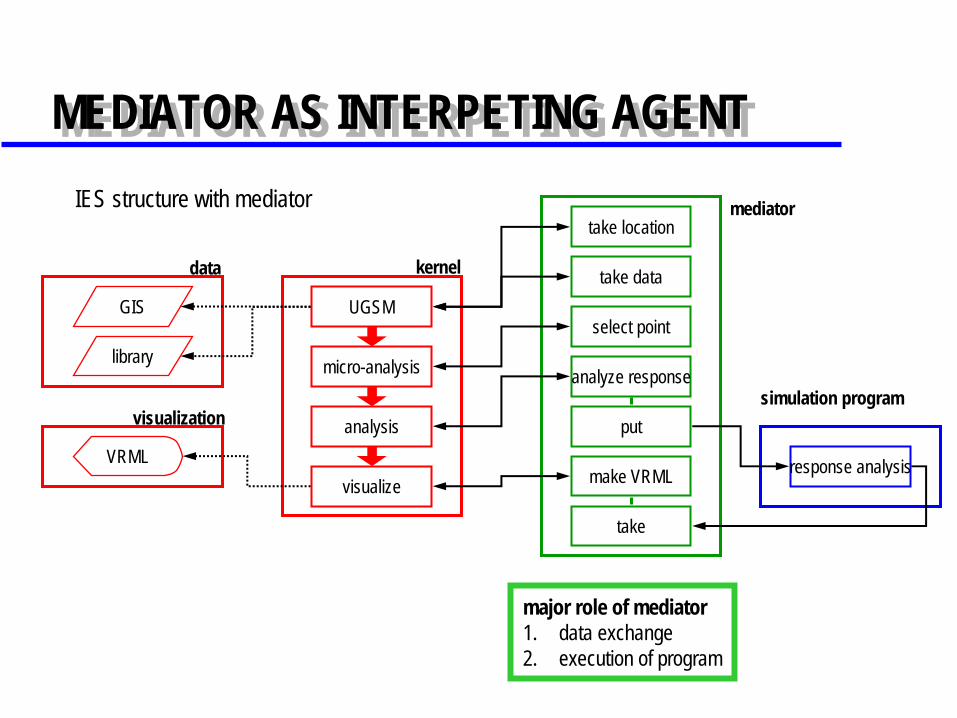
MEDIATOR AS INTERPETING AGENTMEDIATOR AS INTERPETING AGENT
major role of mediator1. data exchange2. execution of program
kernel
simulation program
mediator
data
visualization
UGSM
micro-analysis
analysis
visualize
take data
select point
analyze response
put
make VRML
take
take location
response analysisVRML
library
GIS
IES structure with mediator
structure
FEM
location, displacement data
node
nodes, type, element
propertymaterial
location, propertyGauss point
A VRML
VMRL_A
VRML
POV
AVS
successi on
for structure A
successi on
find structure
A
take data
select point
analyze response
put
take
make VRML
take data from library
find structure from GIS
select point to which strong motion is input
run simulation program
take results of simulation program
put data to simulation program
visualize results of simulation program
object of mediator for structure A
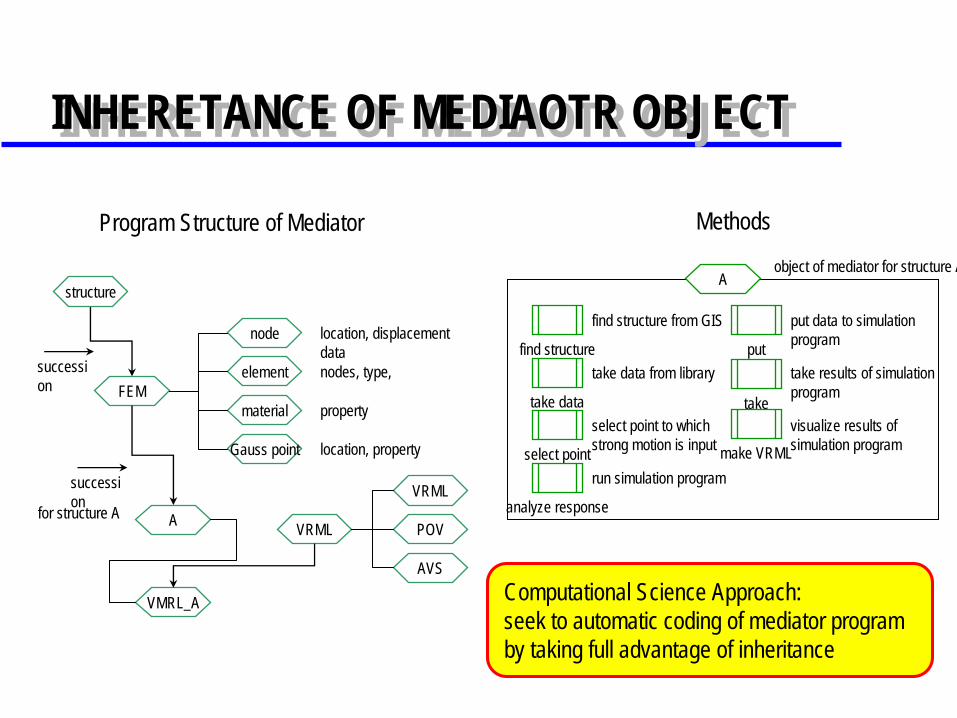
INHERETANCE OF MEDIAOTR OBJECTINHERETANCE OF MEDIAOTR OBJECT
MethodsProgram Structure of Mediator
Computational Science Approach:seek to automatic coding of mediator program by taking full advantage of inheritance
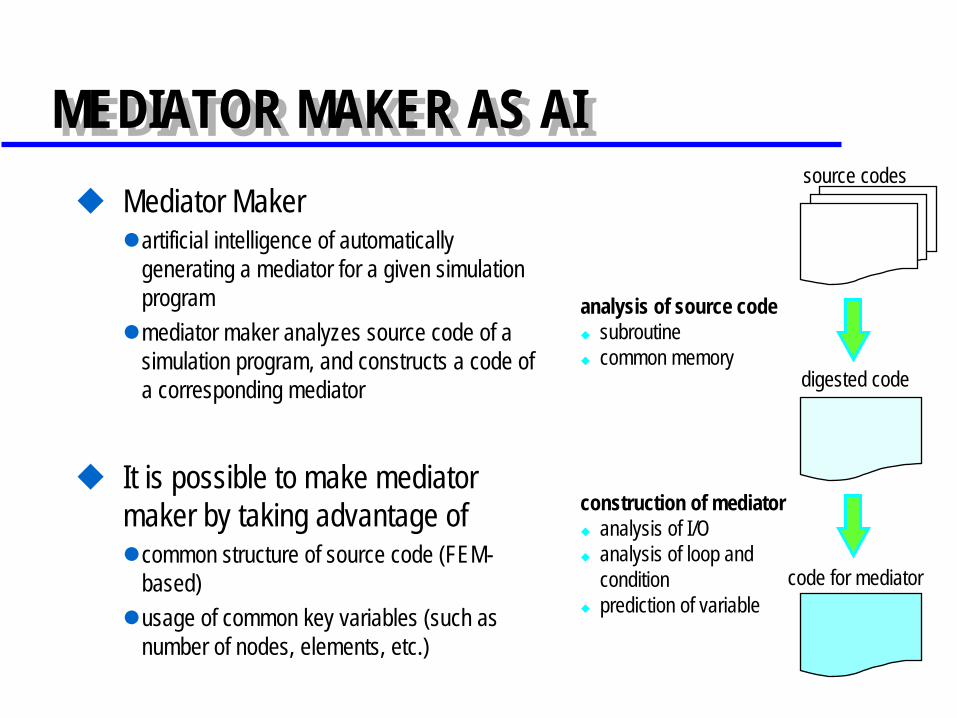
MEDIATOR MAKER AS AIMEDIATOR MAKER AS AIMediator Maker
artificial intelligence of automatically generating a mediator for a given simulation programmediator maker analyzes source code of a simulation program, and constructs a code of a corresponding mediator
It is possible to make mediator maker by taking advantage of
common structure of source code (FEM-based)usage of common key variables (such as number of nodes, elements, etc.)
source codes
digested code
code for mediator
analysis of source codesubroutinecommon memory
construction of mediatoranalysis of I/Oanalysis of loop andconditionprediction of variable
0.5
3 2 31
8
1
5
5
10 15
11.7x1.7
5x2.5
10
1x1
10 8 14
20
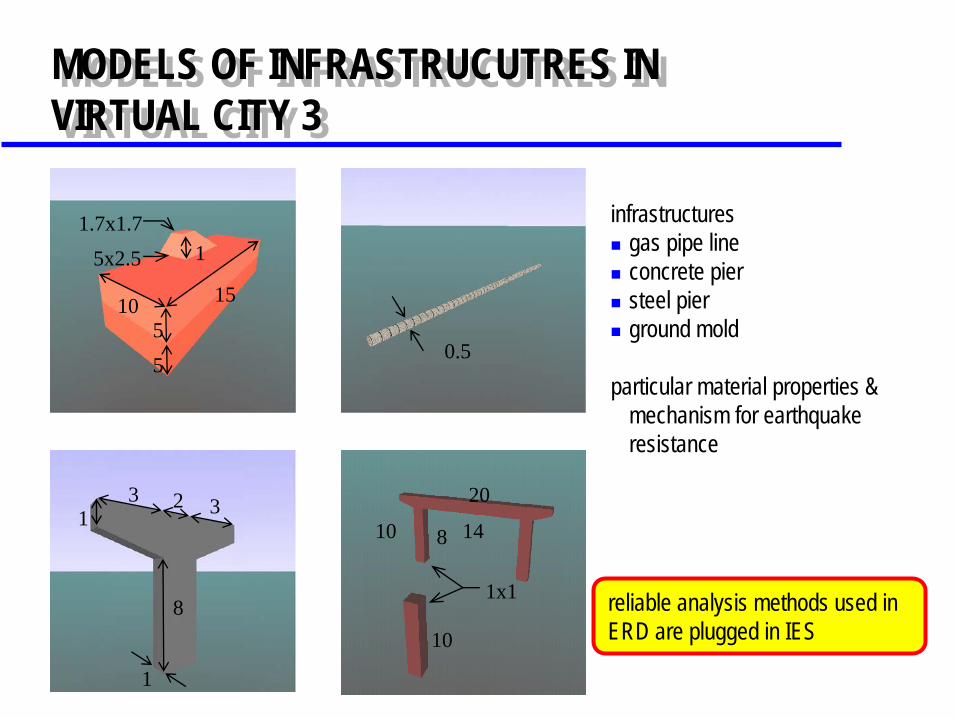
MODELS OF INFRASTRUCUTRES IN VIRTUAL CITY 3 MODELS OF INFRASTRUCUTRES IN VIRTUAL CITY 3
infrastructuresgas pipe lineconcrete piersteel pierground mold
particular material properties & mechanism for earthquake resistance
reliable analysis methods used in ERD are plugged in IES
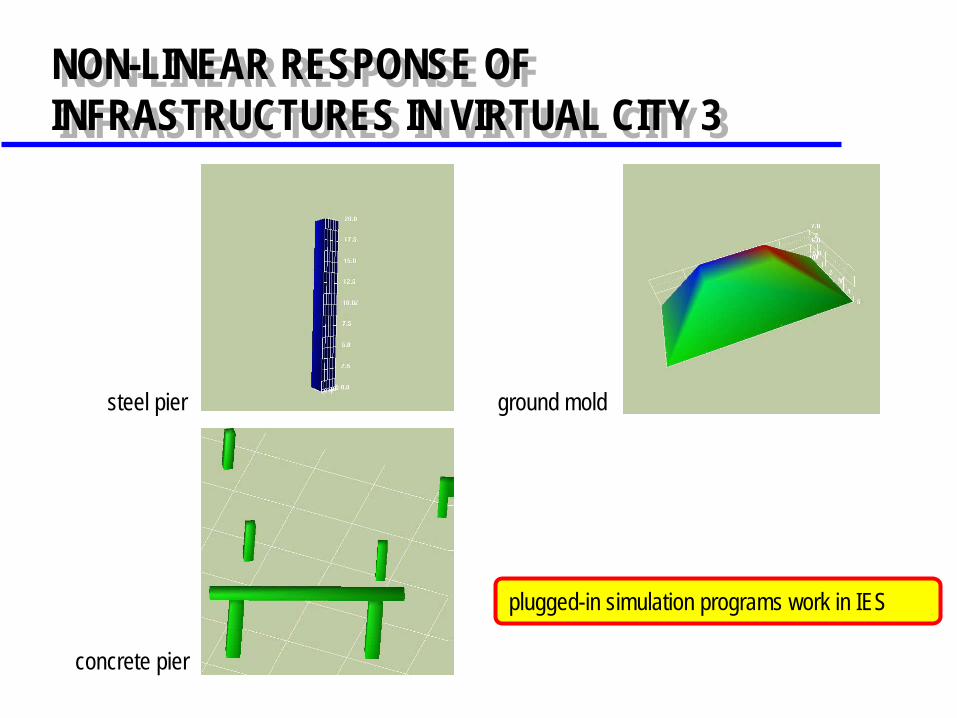
NON-LINEAR RESPONSE OF INFRASTRUCTURES IN VIRTUAL CITY 3 NON-LINEAR RESPONSE OF INFRASTRUCTURES IN VIRTUAL CITY 3
steel pier ground mold
concrete pier
plugged-in simulation programs work in IES
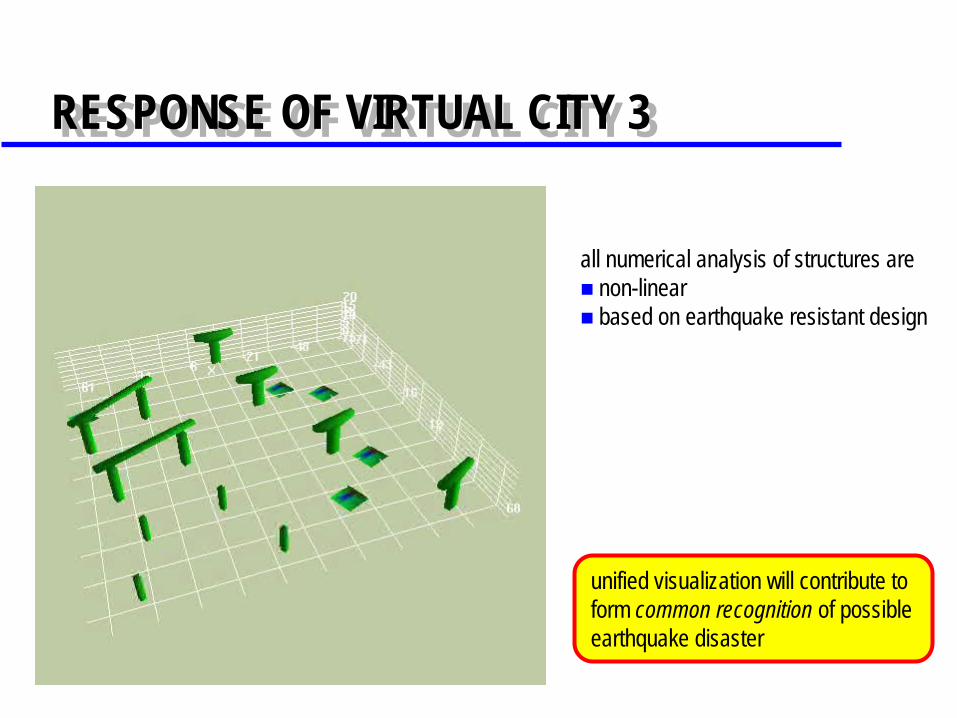
RESPONSE OF VIRTUAL CITY 3RESPONSE OF VIRTUAL CITY 3
unified visualization will contribute to form common recognition of possible earthquake disaster
all numerical analysis of structures arenon-linearbased on earthquake resistant design
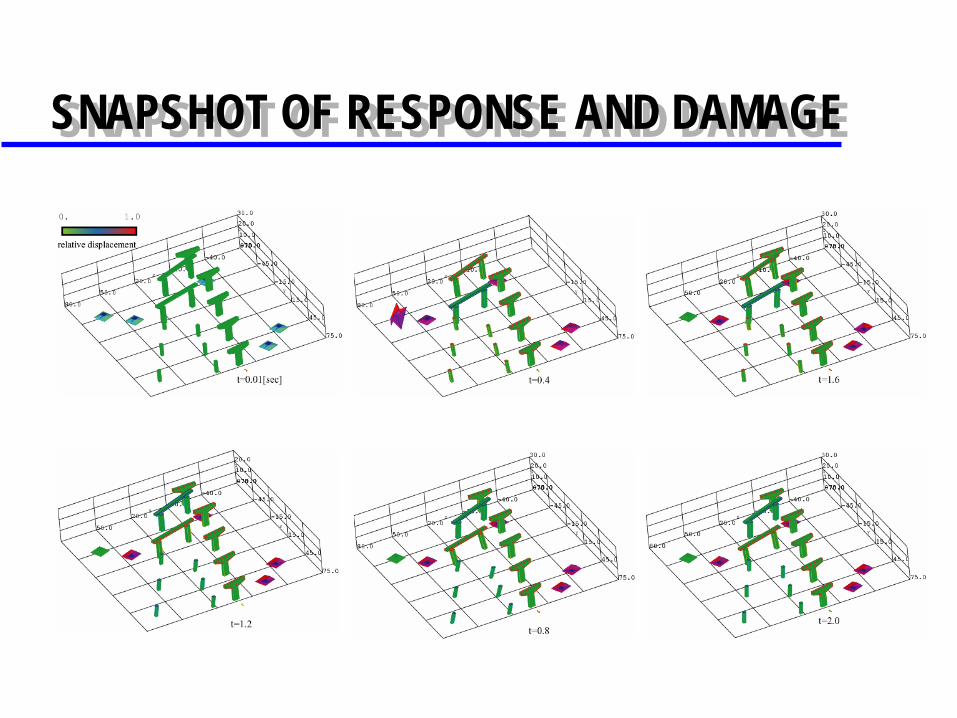
SNAPSHOT OF RESPONSE AND DAMAGESNAPSHOT OF RESPONSE AND DAMAGE
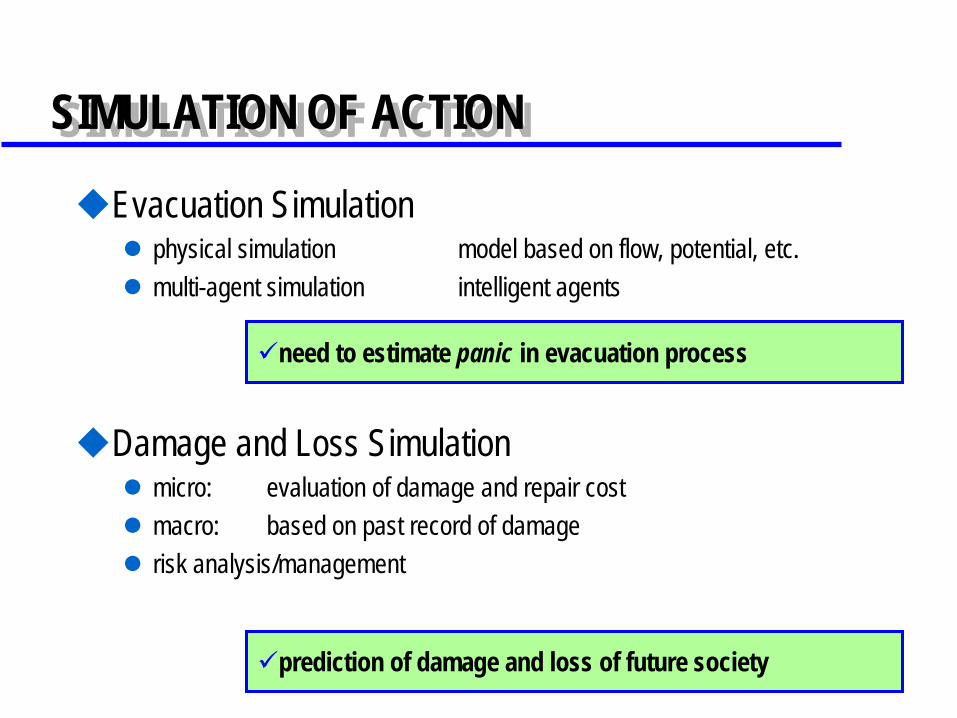
SIMULATION OF ACTIONSIMULATION OF ACTION
Evacuation Simulationphysical simulation model based on flow, potential, etc.multi-agent simulation intelligent agents
Damage and Loss Simulationmicro: evaluation of damage and repair costmacro: based on past record of damagerisk analysis/management
need to estimate panic in evacuation process
prediction of damage and loss of future society
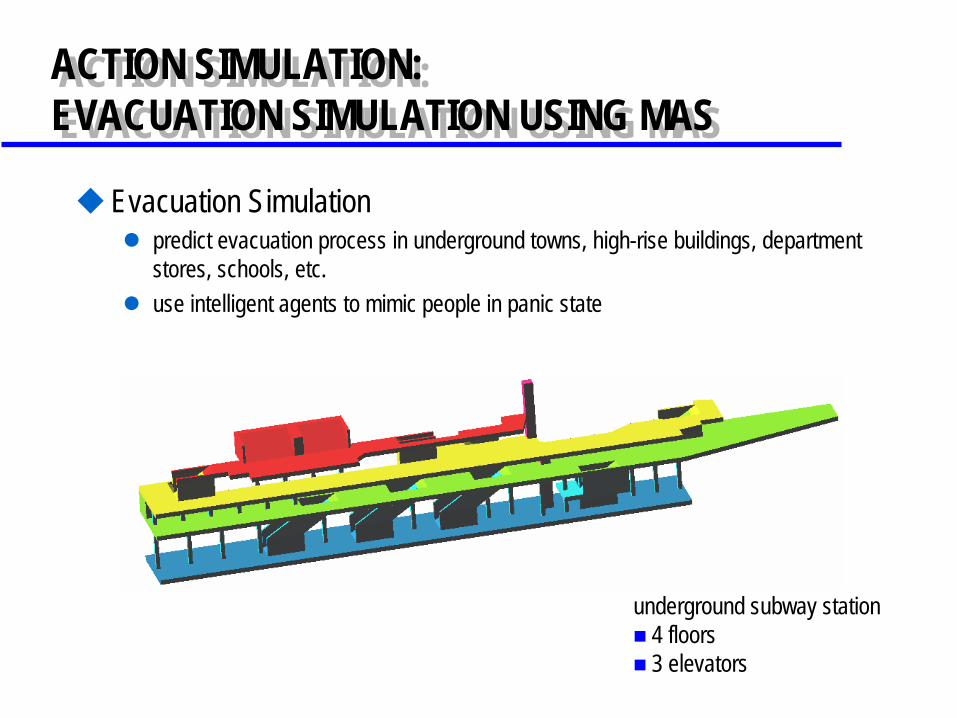
ACTION SIMULATION: EVACUATION SIMULATION USING MAS ACTION SIMULATION: EVACUATION SIMULATION USING MAS
Evacuation Simulationpredict evacuation process in underground towns, high-rise buildings, department stores, schools, etc.use intelligent agents to mimic people in panic state
underground subway station4 floors3 elevators
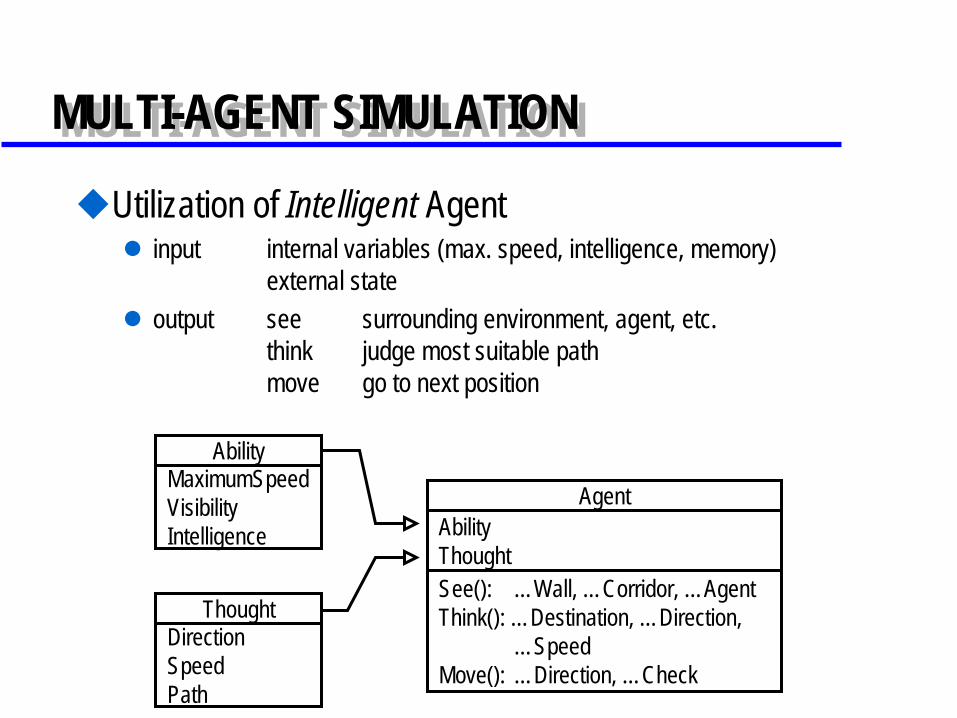
MULTI-AGENT SIMULATIONMULTI-AGENT SIMULATION
Utilization of Intelligent Agentinput internal variables (max. speed, intelligence, memory)
external stateoutput see surrounding environment, agent, etc.
think judge most suitable pathmove go to next position
AgentAbilityThoughtSee(): …Wall, …Corridor, …Agent Think(): …Destination, …Direction,
…SpeedMove(): …Direction, …Check
AbilityMaximumSpeedVisibilityIntelligence
DirectionSpeedPath
Thought
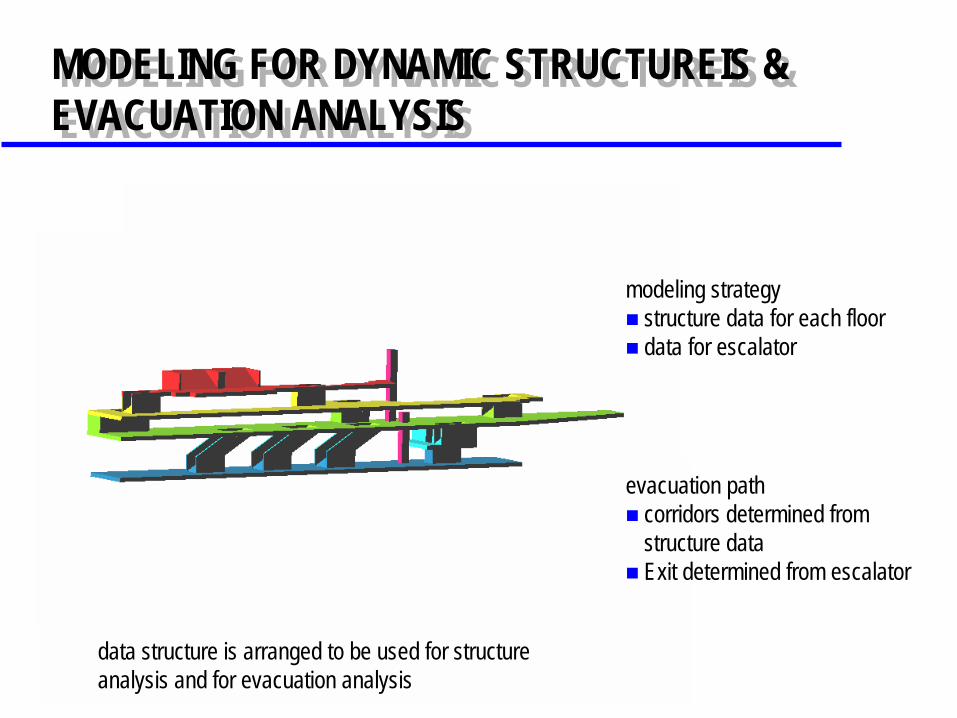
MODELING FOR DYNAMIC STRUCTUREIS & EVACUATION ANALYSIS MODELING FOR DYNAMIC STRUCTUREIS & EVACUATION ANALYSIS
modeling strategystructure data for each floordata for escalator
evacuation pathcorridors determined from structure dataExit determined from escalator
data structure is arranged to be used for structure analysis and for evacuation analysis
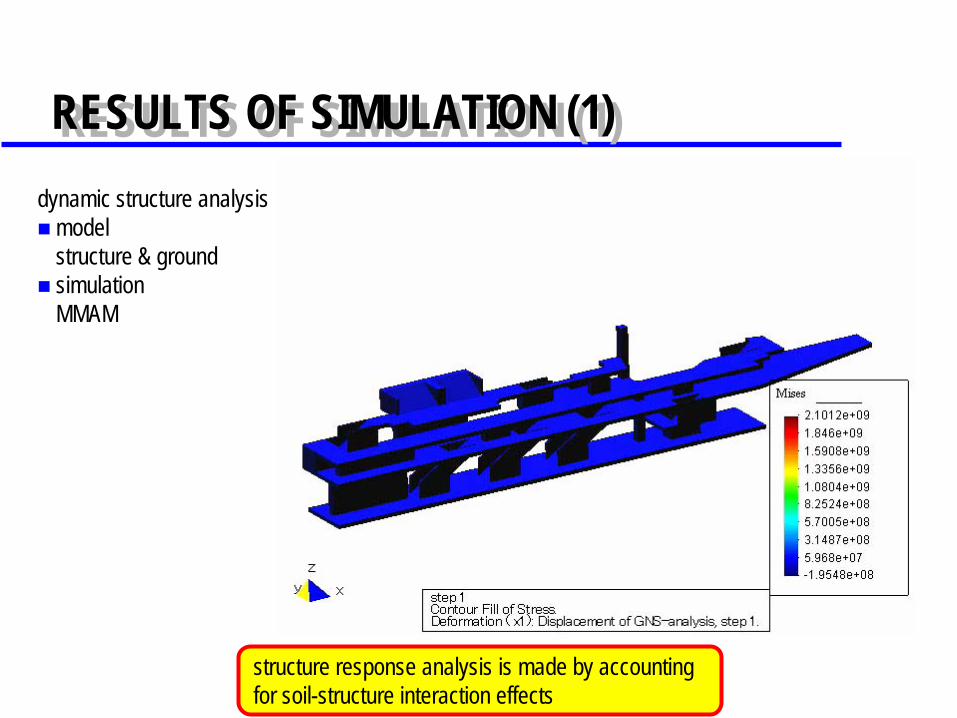
RESULTS OF SIMULATION (1)RESULTS OF SIMULATION (1)dynamic structure analysis
modelstructure & groundsimulationMMAM
structure response analysis is made by accounting for soil-structure interaction effects
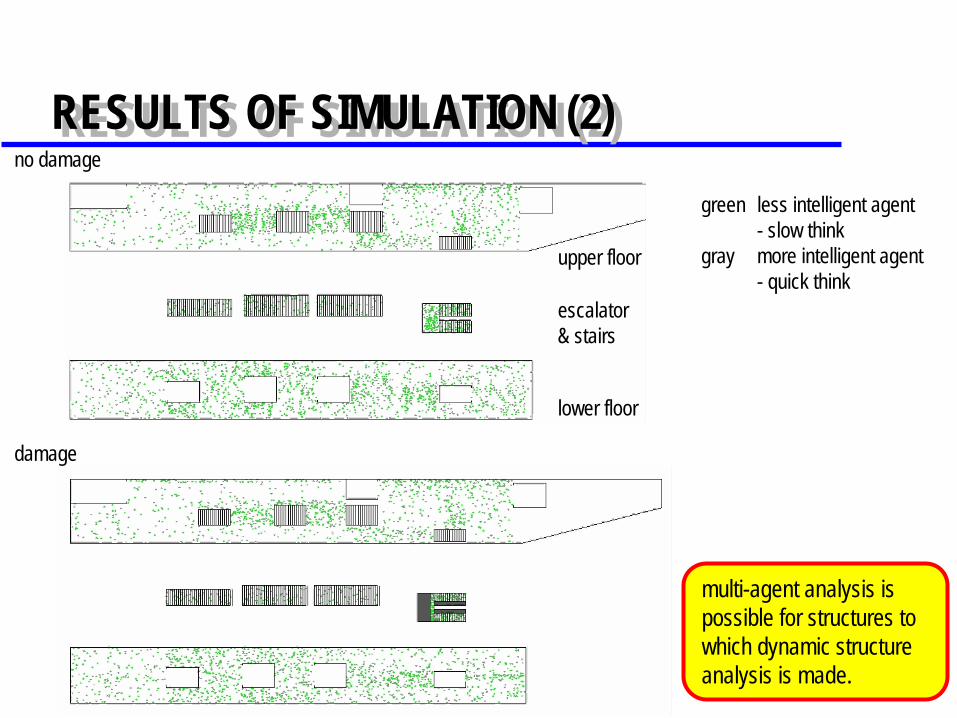
RESULTS OF SIMULATION (2)RESULTS OF SIMULATION (2)green less intelligent agent
- slow thinkgray more intelligent agent
- quick think
multi-agent analysis is possible for structures to which dynamic structure analysis is made.
lower floor
escalator& stairs
upper floor
no damage
damage
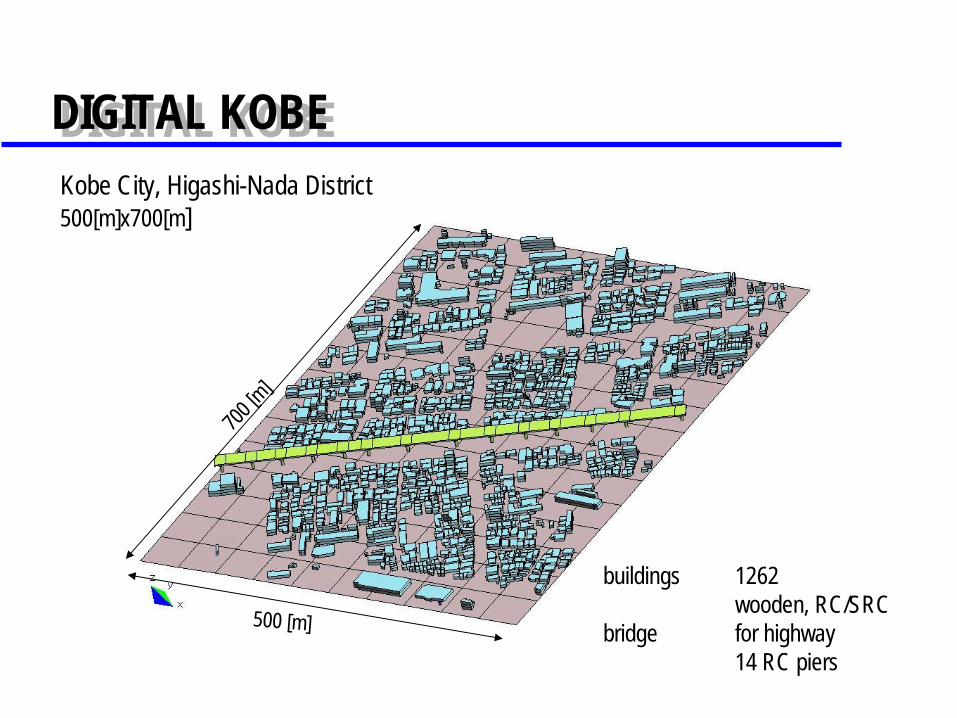
DIGITAL KOBEDIGITAL KOBE
700 [m
]
500 [m]
buildings 1262wooden, RC/SRC
bridge for highway14 RC piers
Kobe City, Higashi-Nada District500[m]x700[m]
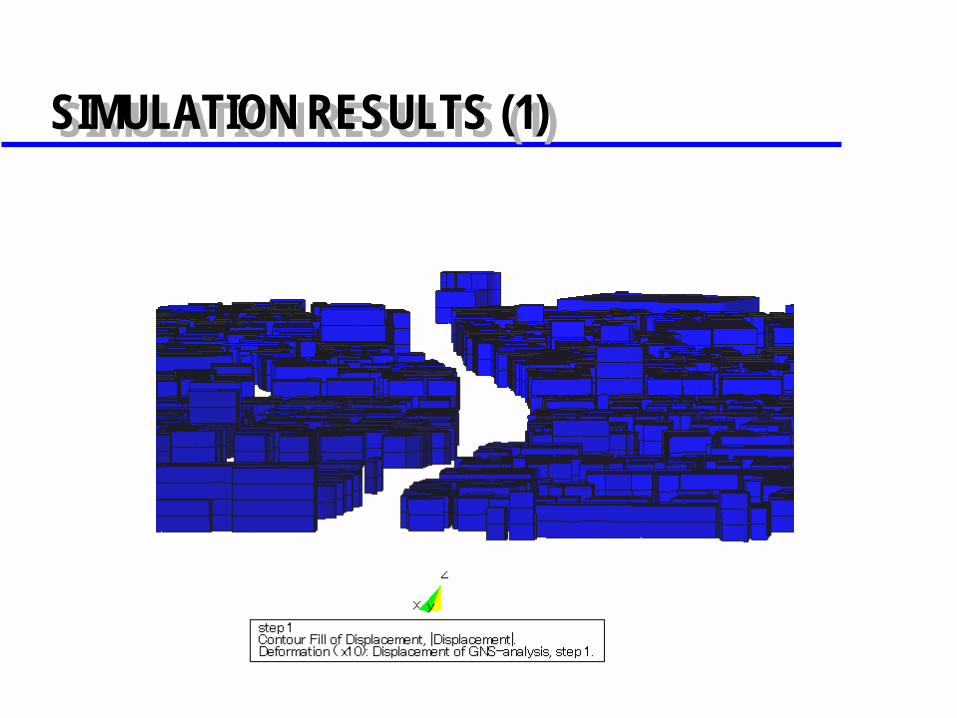
SIMULATION RESULTS (1)SIMULATION RESULTS (1)
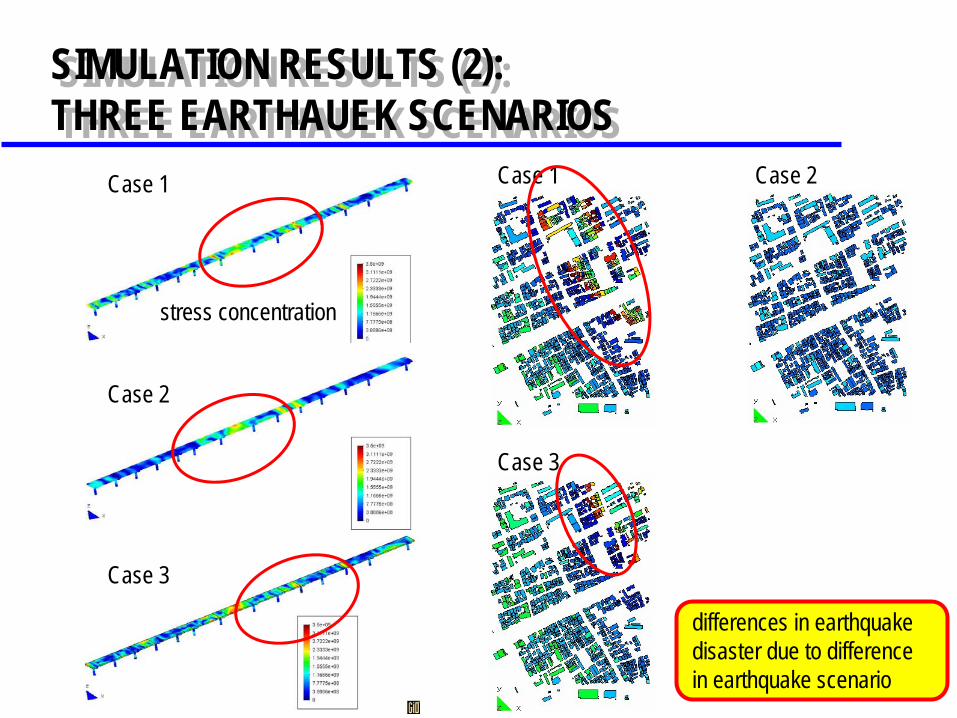
SIMULATION RESULTS (2): THREE EARTHAUEK SCENARIOS SIMULATION RESULTS (2): THREE EARTHAUEK SCENARIOS
Case 1
Case 2
Case 3
stress concentration
Case 1 Case 2
Case 3
differences in earthquake disaster due to difference in earthquake scenario
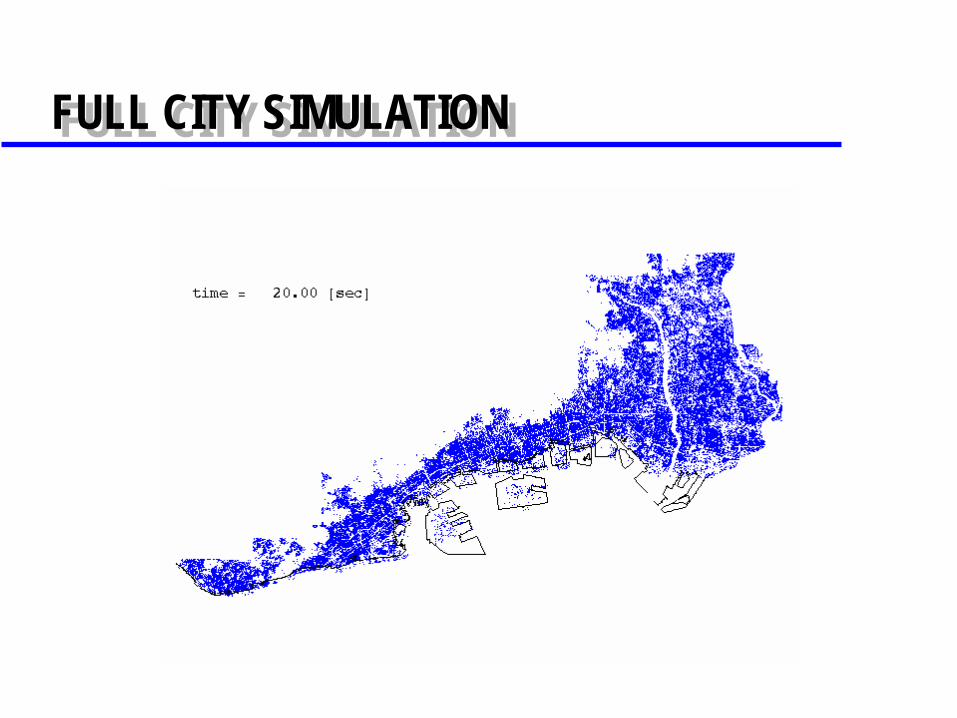
FULL CITY SIMULATIONFULL CITY SIMULATION
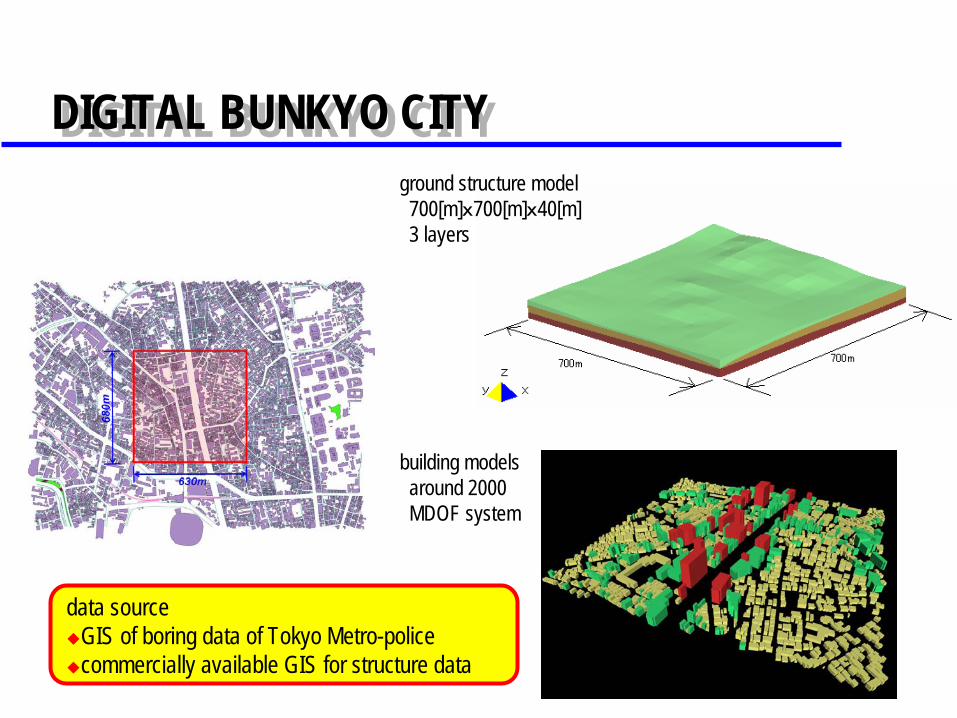
DIGITAL BUNKYO CITYDIGITAL BUNKYO CITYground structure model 700[m]x700[m]x40[m]3 layers
building modelsaround 2000 MDOF system
data sourceGIS of boring data of Tokyo Metro-policecommercially available GIS for structure data
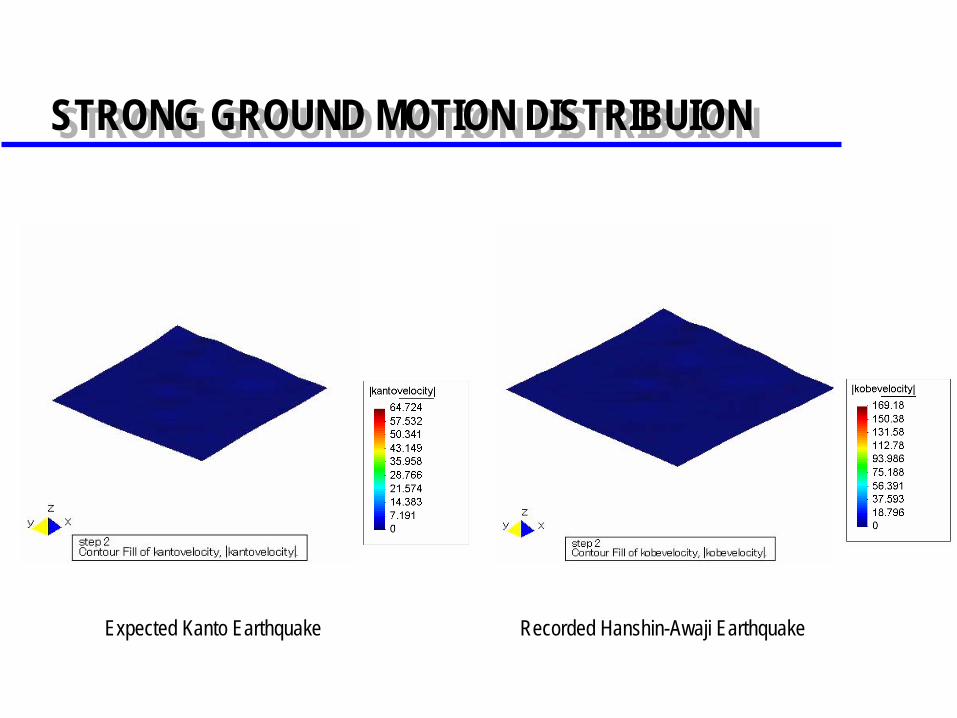
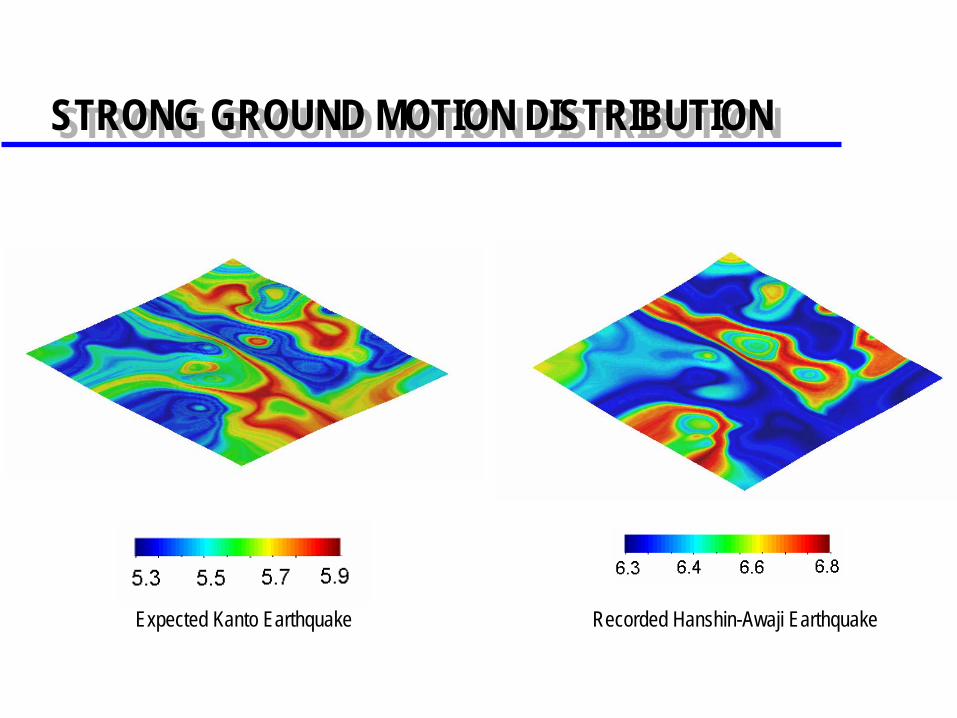
STRONG GROUND MOTION DISTRIBUIONSTRONG GROUND MOTION DISTRIBUION
Expected Kanto Earthquake Recorded Hanshin-Awaji Earthquake
STRONG GROUND MOTION DISTRIBUTIONSTRONG GROUND MOTION DISTRIBUTION
Expected Kanto Earthquake Recorded Hanshin-Awaji Earthquake
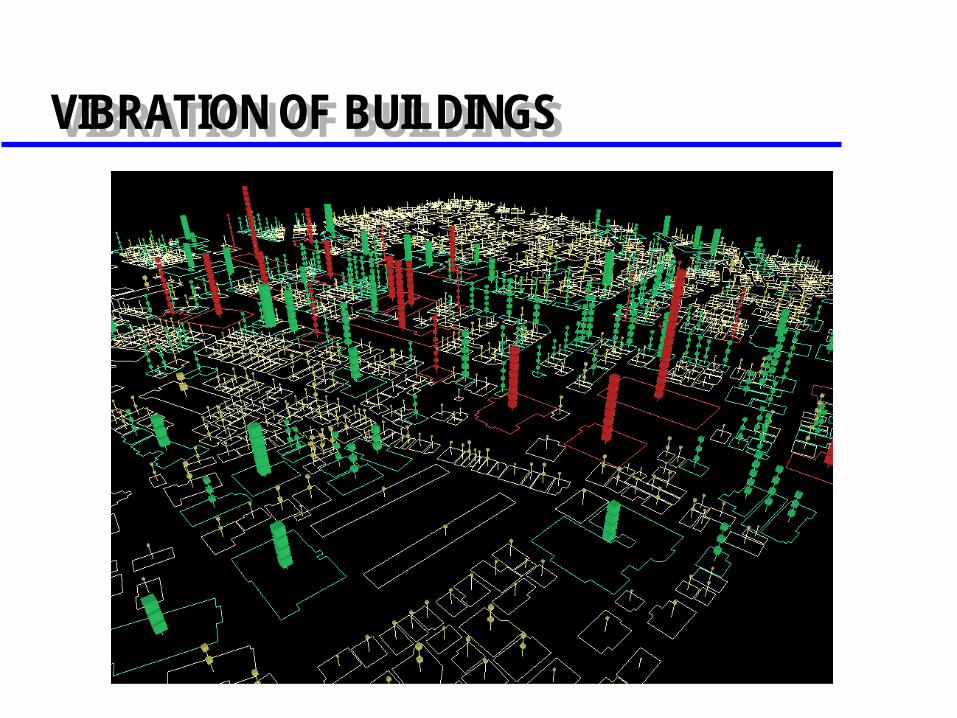
VIBRATION OF BUILDINGSVIBRATION OF BUILDINGS
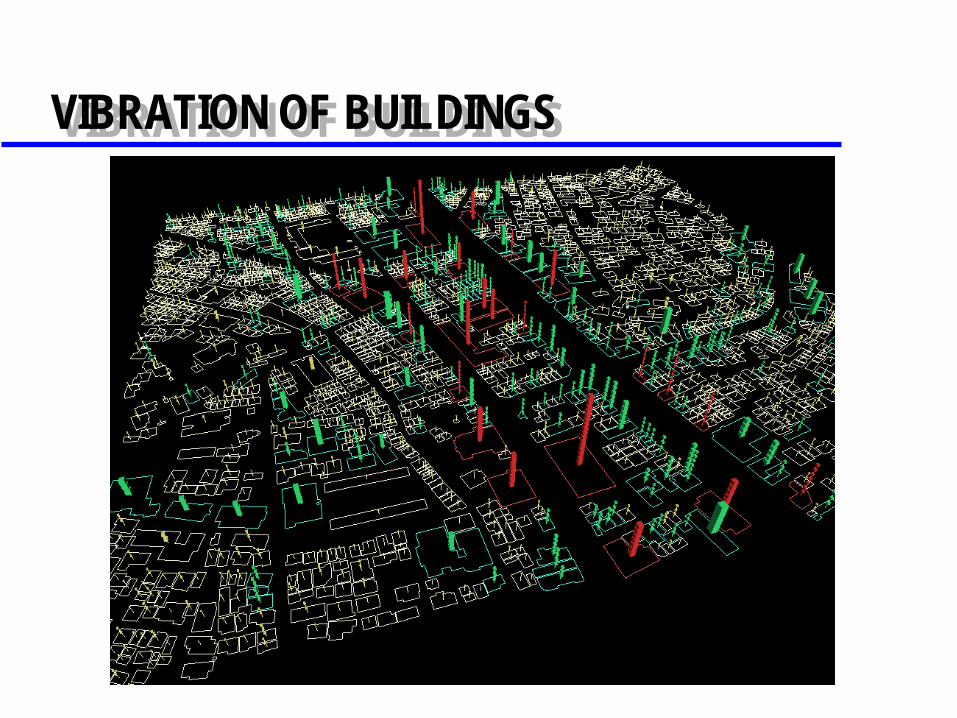
VIBRATION OF BUILDINGSVIBRATION OF BUILDINGS
-8000 -7500 -7000-33000
-32800
-32600
-32400
-32200
-32000
-31800
-31600
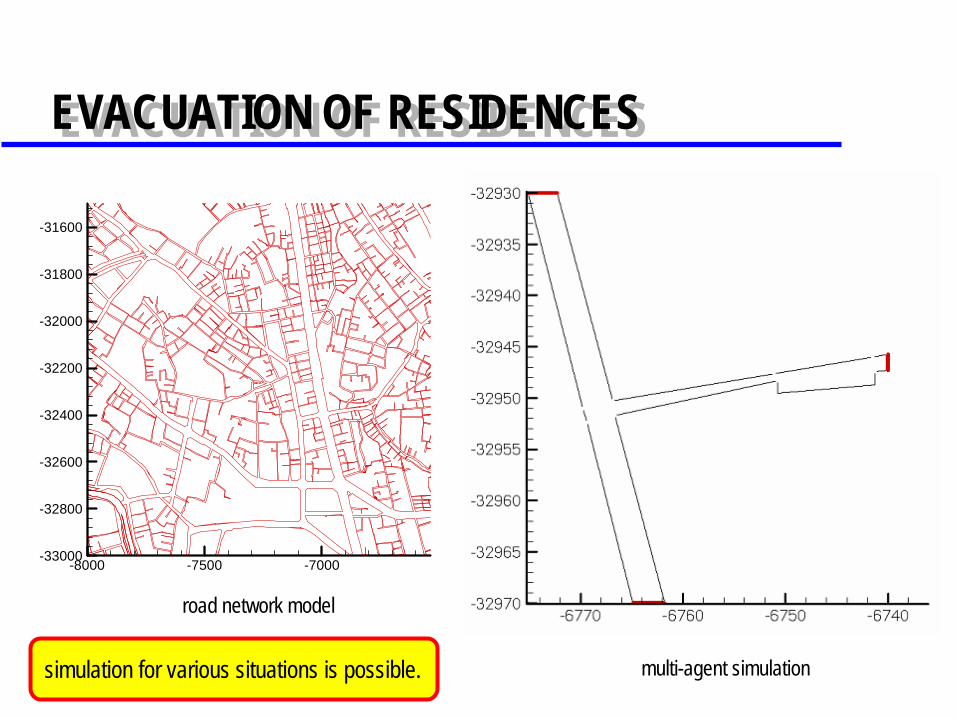
EVACUATION OF RESIDENCESEVACUATION OF RESIDENCES
road network model
multi-agent simulationsimulation for various situations is possible.
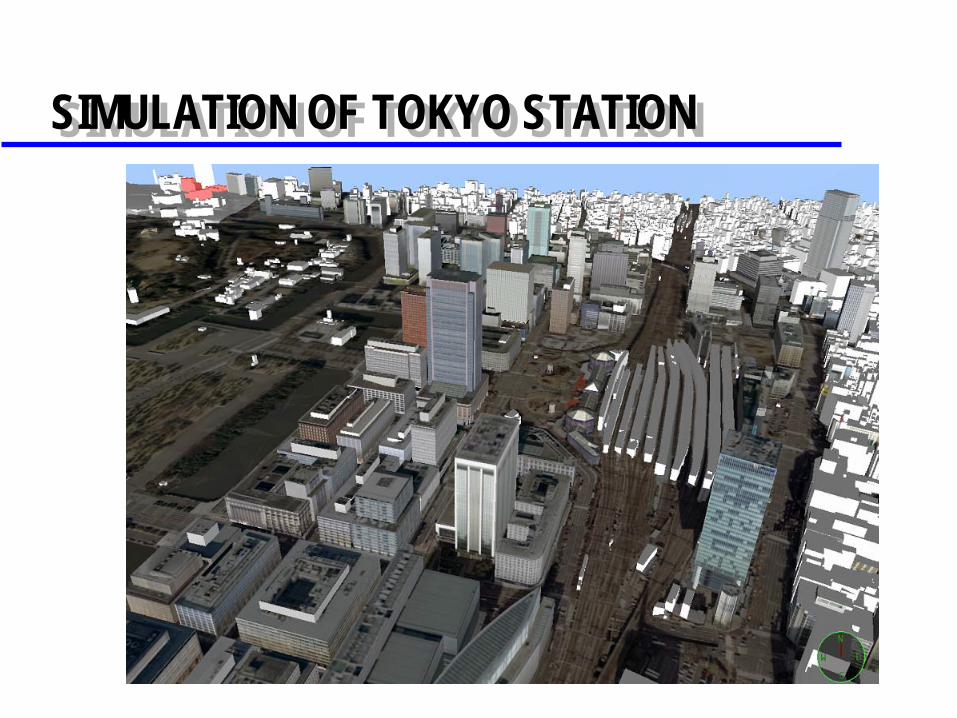
SIMULATION OF TOKYO STATIONSIMULATION OF TOKYO STATION
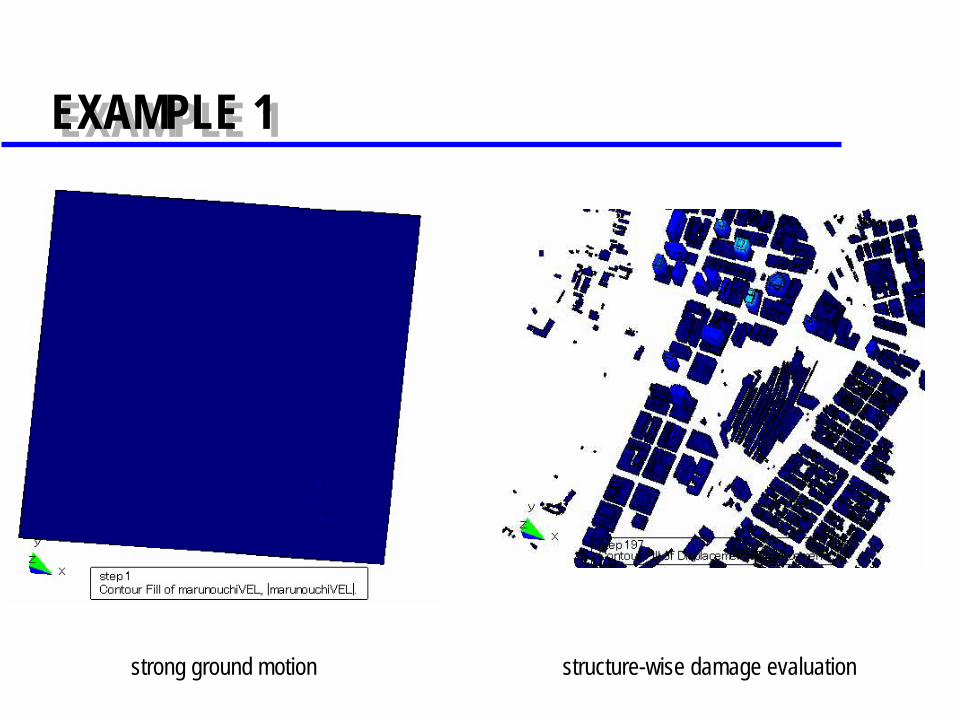
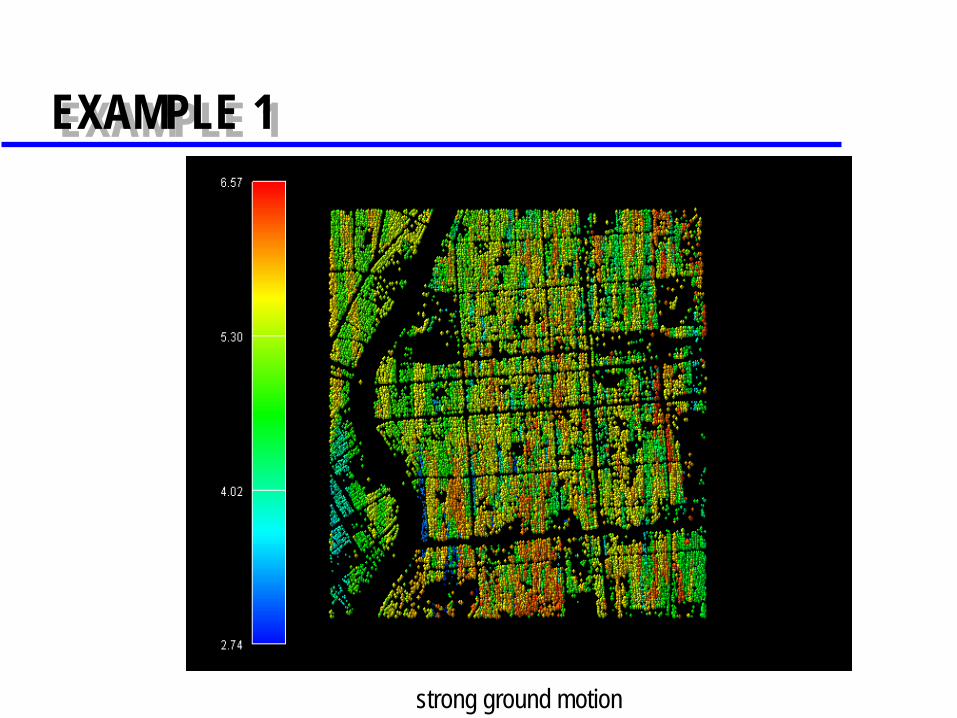
strong ground motion
EXAMPLE 1EXAMPLE 1
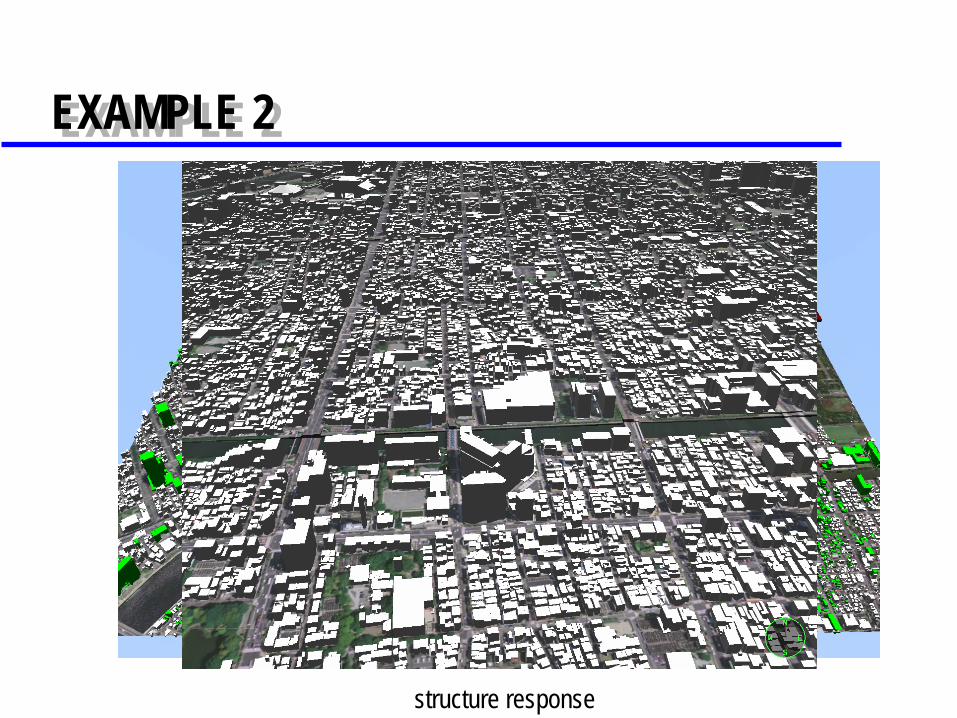
structure-wise damage evaluation
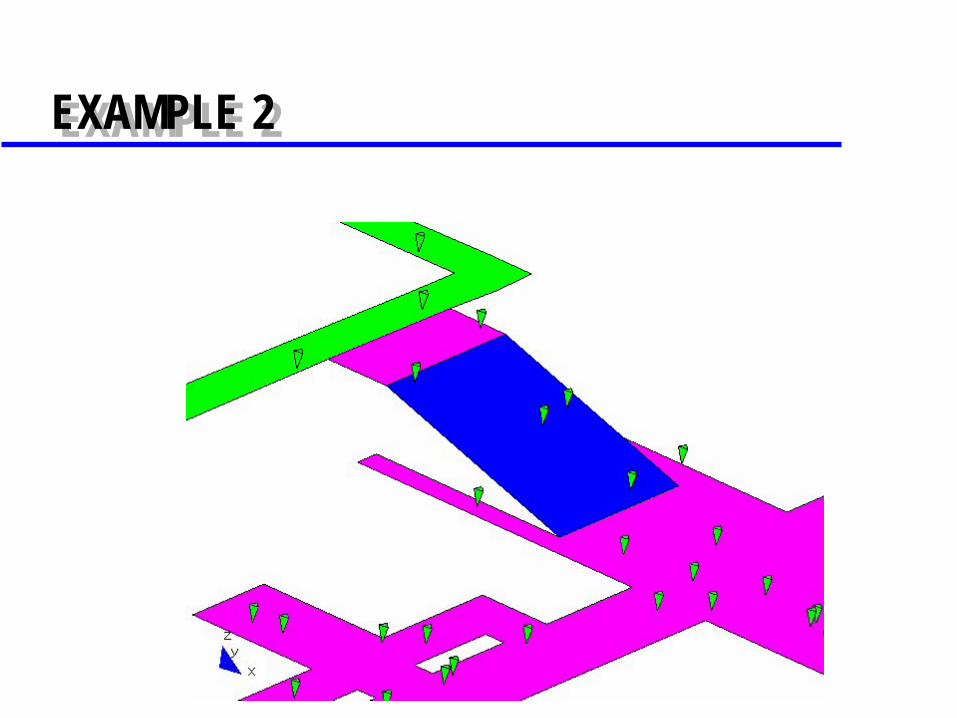
EXAMPLE 2EXAMPLE 2
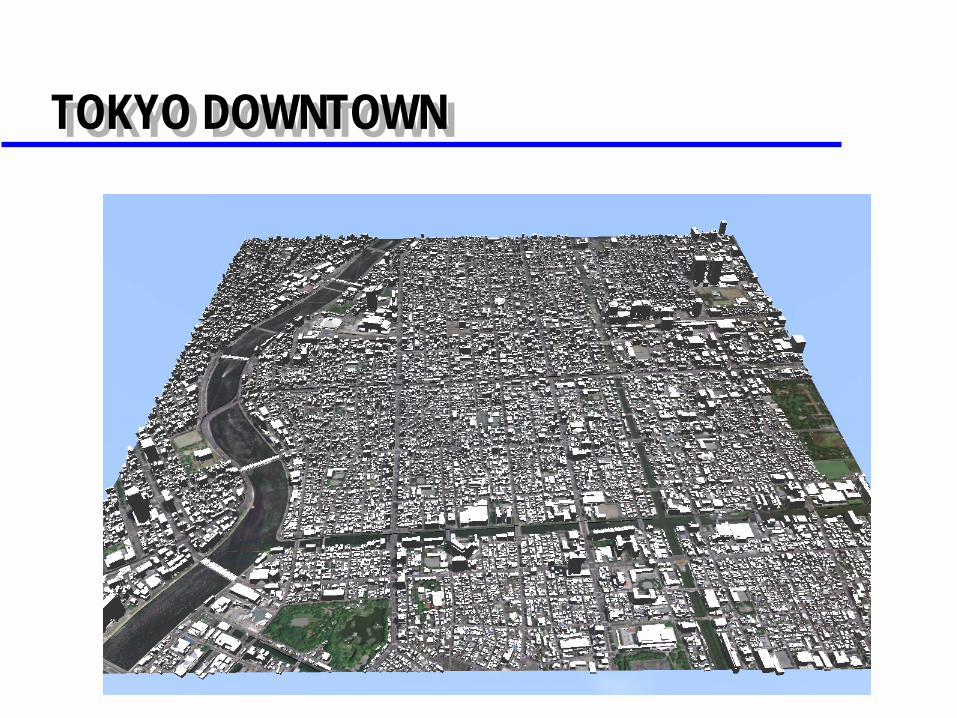
TOKYO DOWNTOWNTOKYO DOWNTOWN
scenario 1
EXAMPLE 1EXAMPLE 1
strong ground motion
シナリオ1
EXAMPLE 2EXAMPLE 2
structure response
CONCLUDING REMARKSCONCLUDING REMARKS
Potentials of IESGeneration of new information on natural disaster risk and hazard by applying numerical simulation to data stored in GISImprove residents awareness on natural disaster risk and hazards and form common recognition of them among community
Future TasksAdvancement of structure data stored in GISnew exclusive sensing of buildings and structuresAdvancement of natural disaster preparedness, mitigation and recoverysignificant need for integration of technologies for natural disasters