Embed Size (px)
Citation preview

FOR NFORMATIOIN ~A.~ OVN0LY' Page 1 of CALC. NO. IP3-CALC-RPC-00291 _____1REV'.' 0' IP3 JAF
MOD/TASK NO. __...........________.,_, _ ...
QA CATEGORY: I PRELIMINARY: FINAL: X
PROJECT/TASK: Twenty-Four (24) Month Operating Cycle Pro ect SYSTEM NO./NAME:Reactor Protection and Control (RPC) I _B________z _
TITLE: Instrument Loop Accuracy/Setpoint Calculation/6.90 VUndervoltage and Underfrequency
NAME SIGNATURE DATE
DESIGN ENG.: PREPARER: G. Durniak CHECKER: R. Valvano VERIFIER: NO W W. Wittich APPROVED: A. Petrenko _ ,gZ2 /, -
PROBLEM/OBJECTIVE/METHOD
Verify that channel trip will occur within the Analytical Limit (AL) considering additional instrument drift or uncertainties due to extension of the operating cycle from 18 months ±. 25% to 24 months ± 25%
This calculation has been prepared in accordance with IES-3, DCM-2 and ISA RP67.04.
DESIGN BASIS/ASSUMPTIONS
The 6.9kV bus undervoltage and underfrequency trip circuits provide protection against a loss of coolant flow incident. (Section 14.1.6 of Ref. 3.2.3)
Seismic event is not considered coincident with any other accident.
SUMMARY/CONCLUSIONS
Undervoltage Relays:
This calculation demonstrates that the performance of the Westinghouse SV relay, based primarily on actual As-Found, As-Left plant data, is not suitable for a 24 month ± 25% calibration interval. The calibration interval for the SV relays should not be extended.
Undervoltage Time Delay and Underfrequency Relays:
The existing Trip Setpoints provide sufficient margin to insure that channel trip will occur within the Analytical Limit (AL), for an extended twenty-four (24) month ± 25% operating cycle. No setpoint changes are required.
REFERENCES . ..,
See Section 3.0 C., 7
AFFECTED SYSTEMS/COMPONENTS/DOCUMENTS
RPS/Undervoltage, Undervoltage Time Delay, and Underfrequency Relays Undervoltage Undervoltage Time Delay Underfreiuency. 27-lA 27-1-62A 81-1 27-2A 27-2-62A 81-2 27-3A 27-3-62A 81-3
27-4A 27-4-62A 81-4
-- VOIDED OR W-VOIDS OR SUPERSEDED BY: (CAL_._N__)__ _ _SUPERSEDES: N/A
(CALC. No.) (CALC. NO.)
9302260283 901 FORM DCM 2, 4.1 (JAN. 1991) PDR ADOCK 05000286
PDR

New York Power Authority
CALCULATION NO. IP3-CALC-RPC-00291
Project IP3 Title Instr. Loop Accur/Setpoint Calc. Preliminary Final X
REVISION 0
Page 2 of 24 Date 1992 / l Prepared by G. Durniak Da 'te/ A ' Checked by R. Valvano Date j'9----Zj
TABLE OF CONTENTS
PAGE
1.0
2.0
3.0
4.0
5.0
6.0
7.0
8.0
9.0
10.0
11.0
12.0
PURPOSE . . . . . . . . . . . . .
ASSUMPTIONS ...........
REFERENCES ..... .............
LOOP FUNCTION ..........
LOOP (BLOCK) DIAGRAM ..........
LOOP UNCERTAINTY EQUATIONS ....
6.1 LOOP COMPONENTS .. ........
DETERMINE CHANNEL UNCERTAINTY (CU)
OBTAIN ANALYTICAL LIMIT (AL) . . .
DETERMINE SETPOINT (TS) .....
DETERMINE ALLOWABLE VALUE (AV) . .
SUMMARY
ATTACHMENTS ...........
FORM DCM 2, 4.2 (JAN. 1991)
New York Power Authority
CALCULATION NO. IP3-CALC-RPC-00291 REVISION 0
Project IP3 Page 3 of 24 Title Instr. Loop Accur/Setpoint Cal. Date 1992
Preliminary _ _Prepared by G. Durniak Date// Final X Checked by R. Valvano Date
1.0 PURPOSE
Verify that channel trip will occur within the Analytical Limit (AL),
considering additional Instrument drift or uncertainties due to extension of the operating cycle from 18 months ± 25% to 24 months ± 25%.
2.0 ASSUMPTIONS
2.1 Seismic event is not considered coincident with any other accident.
2.2 Additional "margin" is not used in the calculation , since the methodology used is inherently conservative.
2.3 Deleted
2.4 The minimum ambient temperature for instrument calibration will be 68°F.
2.5 The Safety Analysis assumes a time delay from the time of loss of voltage
to the initiation of control rod motion. For the purpose of this calculation, one-half (1/2) of this total time delay will be assumed as the Analytical Limit for the Undervoltage time delay relay trip setpoint. (See Section 8.2)
2.6 The maximum trip time for the Reactor Coolant Pump breakers is assumed to be 9 cycles (150 ms). This time is from the moment the trip coil is
energized, to opening of the auxiliary contacts. This value is conservative, given that Westinghouse has verified that 75DH500 Breakers typically trip within 8 cycles. (ref. 3.1.9)
3.0 REFERENCES
3.1 General
3.1.1 U.S. NRC, Regulatory Guide 1.105, Rev. 2, February, 1986 "Instrument Setpoints For Safety-Related Systems".
3.1.2 ANSI/ISA-S67.04-1988 Standard "Setpoints for Nuclear SafetyRelated Instrumentation", dated 2/4/88.
3.1.3 ISA-RP67.04, Part II, Draft 9, "Methodologies for the
Determination of Setpoints for Nuclear Safety-Related Instrumentation", dated 3/22/91.
3.1.4 IES-3, Rev. 0, 1/3/91, Instrument Loop Accuracy and Setpoint
Calculations.
3.1.5 DCM-2, Rev. 1, 1/18/91, Preparation and Control of Calculations
and Analyses.
* 3.1.6 Master Equipment List, LVOLT System, dated 4/2/90.
FORM DCM 2, 4.2 (JAN. 1991) * Used as Design Input
New York Power Authority
CALCULATION NO. IP3-CALC-RPC-00291 REVISION 0
Project IP3 Page 4 of 24 Title Instr. Loop Accur/Setpoint Calc. Date 1992 Preliminary Prepared by G. Durniak Date
Final X Checked by R. Valvano Date z
3.1.7 System Description No. 27.1, Electrical Systems, Rev. 0.
* 3.1.8 System Description No.-11.0, Ventilation System, Rev. 0.
3.1.9 Notes of telephone conversation, between G. Durniak/NYPA and W. Adamsky/Westinghouse, dated 10/20/92, concerning trip response time of 75DH500 breakers, Shop Order 25-Y-6757.
3.1.10 Memo from A.J. Wettlaufer/W. I. Sayed to M.W. Hultgren dated February 26, 1976, System Underfrequency/DNB, DSR-110877.
3.1.11 JB-D&A84-i01, Letter from J. Bashian to G. Laszlo/L. Burnett, dated Oct. 29, 1984, Degraded Grid Voltage Studies Report, Phase III, Report No. RPT-EDA-84-08. (DSR No. 169370)
3.1.12 Memo from G.D. Rockefeller to J. Tamburri, dated Jan. 7, 1974, Settings for L&P Underfrequency and Undervoltage Relays.
3.1.13 Memo from G. D. Rockefeller to J. Tamburri, dated July 25, 1975, Temporary Settings for L&P Undervoltage Relays.
3.1.14 Memo from G.D. Rockefeller to J. Tamburri, dated October 29, 1976, Relay Settings for Reactor Undervoltage Trip.
3.1.15 Memo from H. Calhoun/ABB to G. Durniak/NYPA, dated 1/10/92, CV-7, SV, KF Relay Data.
* 3.1.16 NYPA Response Letter to NRC, from W. Cahill to R. Reid, dated
August 29, 1977. (DSR No. 37486)
* 3.1.17 IPN-80-53, NYPA Response Letter to NRC, from P. Early to S.
Varga, dated May 30, 1980 (DSR No. 35843).
3.1.18 IEEE Transactions on Power Apparatus and Systems, Volume PAS-95, No. 1, Jan/Feb 1976, Determination of Frequency Decay Rates.
* 3.1.19 Notes of telephone conversation, between G. Durniak/NYPA and
W. Elmore/ABB, dated 5/21/92, Westinghouse KF Relay Power Supply Uncertainty.
3.2 Final Safety Analysis Report (FSAR) Rev. 7, July 1991.
3.2.1 Chapter 16, Design Criteria for Structures and equipment.
3.2.2 Chapter 8, Section 8.2.2, Station Distribution System.
3.2.3 Chapter 14, Safety Analysis.
* 3.2.4 Chapter 15, Technical Specification and Bases, through Amendment
No. 111, dated 3/9/92.
FORM DCM 2, 4.2 (JAN. 1991) * Used as Design Input

New York Power Authority
CALCULATION NO. IP3-CALC-RPC-00291
Project IP3 Title Instr. Loop Accur/Setpoint Calc. Preliminary Final X
3.3 Drawings
3.3.1
3.3.2
3.3.3
3.3.4
3.3.5
3.3.6
3.3.7
REVISION 0
Page 5 of 24 Date 1992
Checked by R. Valvano Date
Main Three Line Diagrams
9321-F-30113, Sht. 1, Rev.
9321-F-30113, Sht. 2, Rev.
9321-F-30113, Sht. 3, Rev.
Elementary Wiring Diagrams:
500B971, Sht. 15, Rev. 5
500B971, Sht. 16, Rev. 4
500B971, Sht. 17, Rev. 3 500B971, Sht. 18, Rev. 4
500B971, Sht. 19, Rev. 5
500B971, Sht. 20, Rev. 3
Equipment Arrangement Drawings:
9321-F-70053, Rev. 10, Equipment Arrangement, Turbine Building
617F643, Rev. 7, 6900V One Line Diagram.
617F645, Rev. 11, Main One Line Diagram.
Reactor Protection System Schematics:
113E301, Sht. 2, Rev. 8 113E301, Sht. 9, Rev. 8 113E301, Sht. 11, Rev. 12
Schematic Diagrams
9321-LL-31133, Shts. 7, 8, 9, 10, Rev. 8
3.4 Calibration Procedures
3.4.1 IC-AD-2, Rev. 7, Calibration and Control of Measuring and Test Equipment.
k 3.4.2 AP-19, Rev. 10, Surveillance Test Program.
k 3.4.3 AP-17, Rev. 5, Calibration of M&TE.
* 3.4.4 3PC-R5A, Rev. 8, 6.9kV Undervoltage Relay Calibration and Agastat
Time Response.
3.4.5 3PC-R5B, Rev. 7, 6.9kV Underfreguency Relays Calibration.
FORM DCM 2, 4.2 (JAN. 1991)
J
* Used as Design Input
New York Power Authority
CALCULATION NO. IP3-CALC-RPC-00291 REVISION 0
Project IP3 Page 6 of 24 Title Instr. Loop Accur/Setpoint Calc. Date 1992 Preliminary Prepared by G. Durniak Date Final X Checked by R. Valvano DateA/& 2 A/
* 3.4.6 PT-M6, Rev. 0, 6.9kV Undervoltage/Underfrequency Analog Channel
Functional.
* 3.4.7 3PT-R91, Rev. 5, Reactor Trip and Bypass Breaker Response Time
and Trip Verification.
* 3.5 IP3-RPT-RPC-00357, Preliminary Rev. 0, Instrument Drift Analysis for RPS.
3.6 Product Literature
* 3.6.1 I. L. 41-766.1E, Westinghouse SV Voltage Relay Instructions,
November 1986, Tech Manual WE-036.
* 3.6.2 I. L. 41-503L, Westinghouse KF Underfrequency Relay Instructions,
Tech Manual WE-49.
3.6.3 Agastat 2100 Series Timing Relay, dated December 1989 Amerace Corp. Industrial Catalog.
3.6.4 ABB/Westinghouse Instrument Transformer Reference, Voltage
Transformers, Type VOY and VOZ. (ABB File No. 42-000 H90)
* 3.6.5 I. L. 41-766.1J, Westinghouse Instruction, dated December 1984,
Type SV Relay.
* 3.6.6 I.L.41-753.1J, Westinghouse MG-6 Relay Instruction Manual,
Effective September 1975.
4.0 LOOP FUNCTION
A loss of coolant flow incident can result from a fault in the Reactor Coolant Pumps Power Supply.
The 6.9kV low voltage and low frequency trip circuits provide a part of the necessary protection against a loss of coolant flow incident.
(Section 14.1.6 of Ref. 3.2.3)
FORM DCM 2, 4.2 (JAN. 1991) * Used as Design Input
New York Power IAuthorityCALCULATION NO. IP3-CALC-RPC-00291
Project IP3 Title Instr. Loon Accur/SetDoint Calc.Preliminary Final X
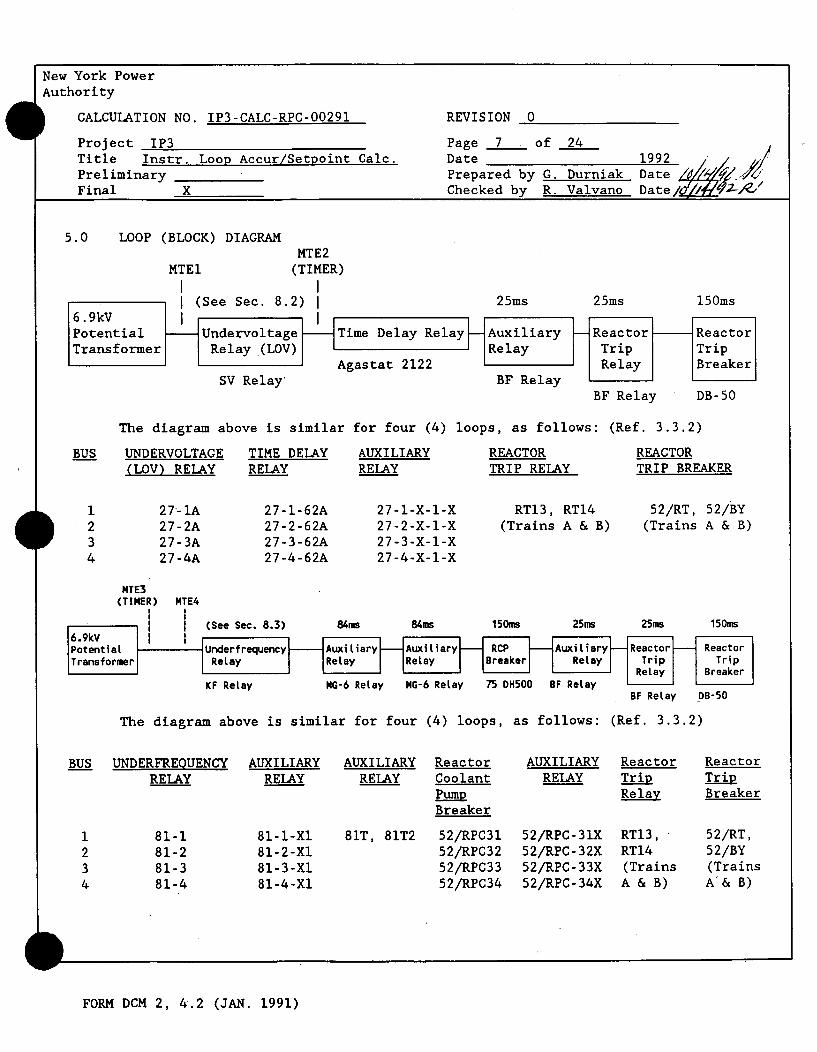
5.0 LOOP (BLOCK) DIAGRAM
MTEI
I (See Sec. 8.2)
SV Relay
REVISION 0
D... 7 ,- 1,4.
Date 1992 Prepared by G. Durniak Date, Checked by R. Valvano Date/_O ,d
MTE2 (TIMER)
25ms 25ms 150ms
BF Relay
BF Relay DB-50
The diagram above is similar for four (4) loops, as follows: (Ref. 3.3.2)
BUS UNDERVOLTAGE
(LOV) RELAY
27-lA 27-2A 27-3A 27-4A
TIME DELAY RELAY
27-1-62A 27-2-62A 27-3-62A 27-4-62A
AUXILIARY RELAY
27-1-X-1-X 27-2-X-1-X 27-3-X-I-X 27-4-X-I-X
REACTOR
TRIP RELAY
RTI3, RT14
(Trains A & B)
REACTOR TRIP BREAKER
52/RT, 52/BY
(Trains A & B)
MTE3 (TIMER) MTE4
MG-6 Relay MG-6 ReLay 75 DH500 BF ReLayBF ReLay 9B-50
The diagram above is similar for four (4) loops, as follows: (Ref. 3.3.2)
BUS UNDERFREQUENCY RELAY
81-1 81-2 81-3 81-4
AUXILIARY RELAY
81-l-X1 81-2-Xl 81-3-Xl 81-4-Xl
AUXILIARY RELAY
81T, 81T2
Reactor Coolant PUMP Breaker
52/RPC31 52/RPC32 52/RPC33 52/RPC34
AUXILIARY RELAY
52/RPC-31X 52/RPC-32X 52/RPC-33X 52/RPC-34X
FORM DCM 2, 4.2 (JAN. 1991)
KF Relay
Reactor Trip) Relay
RTI3, RT14 (Trains A & B)
Reactor Trip Breaker
52/RT,
52/BY
(Trains
A'& B)
New
York
Power
Authority

New York Power Authority
CALCULATION NO. IP3-CALC-RPC-00291
Project IP3 Title Instr. Loop Acct Preliminary Final X
Ir/SetDoint Calc.
REVISION 0
Page 8 of 24 Date 1992 4/ Prepared by G. Durniak Date Checked by R. Valvano Date 20__ 4/z2_/
6.0 LOOP UNCERTAINTY EQUATIONS(SEE ATTACHMENT I)
6.1 LOOP COMPONENTS (Ref. 3.1.6)
TAG SYSTEM BLDG BUS MODEL
27-1A ED TB ELEV. 15 1 WESTINGHOUSE SV
27-2A 2 27-3A 3 27-4A 4
27-1-62A ED TB ELEV. 15 1 AGASTAT 2122DH39Y 27-2-62A 2 (Sht. 20 of Ref. 3.3.2) 27-3-62A 3 27-4-62A 4
81-1 ED TB ELEV. 15 1 WESTINGHOUSE KF
81-2 2 81-3 3 81-4 4
7.0 DETERMINE CHANNEL UNCERTAINTY (CU)
Total Channel Uncertainty (CU)
The total Channel Uncertainty is calculated for the Undervoltage Relays, the Undervoltage Time Delay Relays, the Underfrequency Relays and the Underfrequency Relay Time Delay as follows. The methodology is described in Attachment I:
a) CU = V /PM2 + PE2 + IRE 2 + e, * B* (Undervoltage (LOV) Relays)
=* V02 + .362 + 02 + 392, -3
" *39, -3 VAC
" +39 VAC
" -42VAC
b) CU= ± VPM2 + PE2+ IRE2 + e2 * B* (Undervoltage (LOV) Time Delay Relays)
= ± 102 + 02 + 02 + 112, +5%
- *11%, +5% of Setting
CU= +16%
= -11% of Setting
FORM DCM 2, 4.2 (JAN. 1991)
---- ~ in Ca- - -c...

New York Power Authority
CALCULATION NO. IP3-CALC-RPC-00291 REVISION 0
Project IP3 Page 9 of 24 Title Instr. Loop Accur/Setpoint Calc. Date 1992 // k Preliminary Prepared by G. Durniak Date
Final X Checked by R. Valvano Date 7-yZ,/
c) CU = ± VPM2 + pE2 + IRE2 + e, * B* (Underfrequency Relays/Time Delay)
± 102 + 02 + 02 + 252, +16%,
- ±25, +16% of Setting,
CU= -25%
- +41% of Setting
d) CU= ± VPM 2 + PE2 + IRE2 + e4 * B* (Underfrequency Relays)
= ± /02 + 02 + 02 + .562, -.18%, +.18%, +3.64%
= +4.38%
= -. 74% of Setting,
Given the following Loop Uncertainties:
7.1 Process Measurement Uncertainty (PM)
Process Measurement Uncertainty is considered negligible for a voltage or
frequency measurement, and not applicable for a time delay.
Therefore, PM - 0
7.2 Primary Element Uncertainties (PE)
Westinghouse 6.9kV potential transformers are typically ANSI 0.3 Accuracy
Class. (Ref. 3.6.4)
This corresponds to ±.3% x 120 VAC (Secondary) - ±.36 VAC.
7.3 Insulation Resistance Effect (IRE)
Both the Undervoltage (LOV) and Underfrequency Relays in 6.9kV Switchgear
31 and 32 are located in the Turbine Bldg., Elev. 15, which is a mild
environment. (Ref. 3.3.3)
Furthermore, IRE is only a concern for sensitive, low signal level
circuits.
Therefore, IRE - 0
7.4 Undervoltage (LOV) Relay Voltage Uncertainty (el)
2 2 + p2 2
e.= i /RA12 + DR1 + TE1 + RE SE, E P + MTB1 PSI * B1
el = * V02 + 392 + 02 + 02 + 02 + 02 + 02 + 32 + 02, -3
el = ±39, -3 VAC Given the following Undervoltage (LOV) Relay uncertainties:
FORM DCM 2, 4.2 (JAN. 1991)
ew York Power Authority
CALCULATION NO. IP3-CALC-RPC-00291 REVISION 0
Project IP3 Page 10 of 24 Title Instr. Loop Accur/Setpoint Calc. Date 1992 Preliminary Prepared by G. Durniak Date Final X Checked by R. Valvano Date
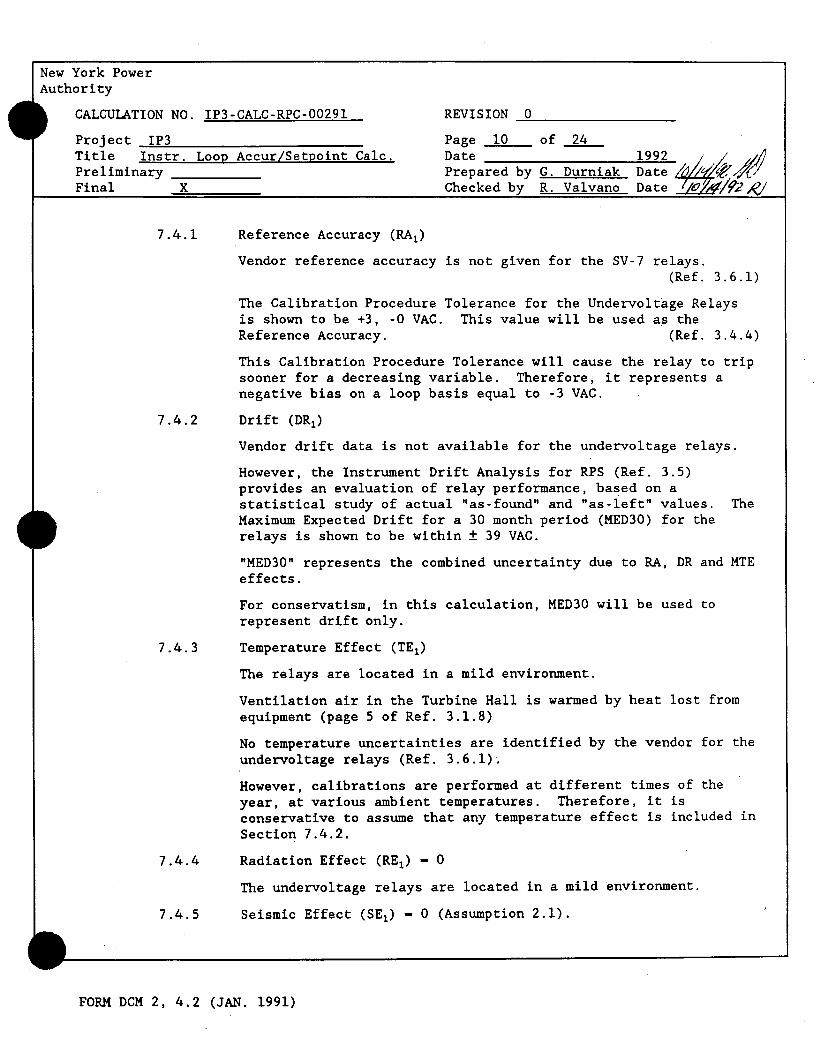
7.4.1 Reference Accuracy (RA1)
Vendor reference accuracy is not given for the SV-7 relays. (Ref. 3.6.1)
The Calibration Procedure Tolerance for the Undervoltage Relays is shown to be +3, -0 VAC. This value will be used as the Reference Accuracy. (Ref. 3.4.4)
This Calibration Procedure Tolerance will cause the relay to trip sooner for a decreasing variable. Therefore, it represents a negative bias on a loop basis equal to -3 VAC.
7.4.2 Drift (DR,)
Vendor drift data is not available for the undervoltage relays.
However, the Instrument Drift Analysis for RPS (Ref. 3.5) provides an evaluation of relay performance, based on a statistical study of actual "as-found" and "as-left" values. The Maximum Expected Drift for a 30 month period (MED30) for the relays is shown to be within ± 39 VAC.
"MED30" represents the combined uncertainty due to RA, DR and MTE effects.
For conservatism, in this calculation, MED30 will be used to represent drift only.
7.4.3 Temperature Effect (TE1)
The relays are located in a mild environment.
Ventilation air in the Turbine Hall is warmed by heat lost from equipment (page 5 of Ref. 3.1.8)
No temperature uncertainties are identified by the vendor for the undervoltage relays (Ref. 3.6.1).
However, calibrations are performed at different times of the
year, at various ambient temperatures. Therefore, it is conservative to assume that any temperature effect is included in
Section 7.4.2.
7.4.4 Radiation Effect (RE1) - 0
The undervoltage relays are located in a mild environment.
7.4.5 Seismic Effect (SE1) - 0 (Assumption 2.1).
FORM DCM 2, 4.2 (JAN. 1991)

New York Power Authority
CALCULATION NO. IP3-CALC-RPC-00291 REVISION 0
Project IP3 Page 11 of 24 Title Instr. Loop Accur/Setpoint Calc. Date 1992 Preliminary Prepared by G. Durniak Date e, z Ye
Final X Checked by R. Valvano Date/ i .l /
7.4.6 Humidity Effect (HE,) - 0.
The relays are located in a mild environment.
7.4.7 Static Pressure Effect (SP) - 0
Pressure effects are not applicable for undervoltage relays.
7.4.8 Measurement and Test Equipment uncertainty (MTE1)
The following instrument is used to test the Undervoltage relays, as shown in the block diagram (Section 5.0) and Ref. 3.4.4:
MTE1 : Digital Volt Meter (DVM)
The reference standards used for calibrating M&TE have an uncertainty (error) requirement of not more than 1/4 of the tolerance of the equipment being calibrated (Ref. 3.4.3).
Measuring and Test Equipment shall have an accuracy greater than or equal to that of the equipment being calibrated (Ref. 3.4.2).
Given the relative high accuracy of the M&TE, and the procedural
guidelines stated above, it is conservative to assume that:
MTE - The value used as the relay Reference Accuracy (RA), including any M&TE reading error, and reference standard uncertainty.
Therefore,
MTE, - ± 3 VAC
7.4.9 Power Supply Effect (PS1) - 0%
The undervoltage relays are powered from the potential transformers on the 6.9kV bus. Therefore, any PS effects are included in Sec. 7.2.
7.5 Undervoltage (LOV) Time Delay Relay Uncertainty, (e2 )
2 /A + 4 +EJ IZRE + SE.q + 114 + Sp2 + MTE4 DR psi
: 53 + 6.32 + 5.72 + 02 + 02 + 02 + 5 + O, +5%
e= =t11, +5% of setting, given the following Undervoltage (LOV) Relay
time delay uncertainties:
FORM DCM 2, 4.2 (JAN. 1991)

New York Power Authority
CALCULATION NO. IP3-CALC-RPC-00291 REVISION 0
Project IP3 Page 12 of 24 Title Instr. Loop Accur/Setpoint Calc. Date 1992 Preliminary Prepared by G. Durniak Date / Final X Checked by R. Valvano Date/ ;2Fi /
7.5.1 Reference Accuracy (RA2)
The Vendors Repeat Accuracy is given as ± 5% at 25°C. (page 11 of Ref. 3.6.3)
The Calibration Procedure Tolerance for the Undervoltage time delay relays is shown to be -25 milliseconds for a setting of 500 milliseconds. (Ref. 3.4.4).
This calibration tolerance will cause the relays to trip sooner for an increasing variable. Therefore, this represents a positive bias on a loop basis. This bias is equivalent to: 25 ms _+ 5% of Setting. 500 ms
For conservatism, both the Reference Accuracy and the Calibration Tolerance bias will be used to calculate the undervoltage time delay relay uncertainty.
7.5.2 Drift (DR2)
Vendor drift data is not available for the undervoltage Time Delay relays (Ref. 3.6.1).
However, the Instrument Drift Analysis for RPS (Ref. 3.5) provides an evaluation of relay performance, based on a statistical study of actual "as-found" and "as-left" values. The Maximum Expected Drift for a 30 month period (MED30) for the
relays is shown to be within ± 6.3% of setting.
"MED30" represents the combined uncertainty due to RA, DR and MTE effects.
For conservatism, in this calculation, MED30 will be used to represent drift only.
7.5.3 Temperature Effect (TE2)
The relays are located in a mild environment.
Ventilation air in the Turbine Hall is warmed by heat lost from
equipment. (page 5 of Ref. 3.1.8)
The vendor specified average time between -55°C and 85°C will be
within ± 20% of the average at 25°C, with a proportionally
reduced effect at lesser extremes. (page 11 of Ref. 3.6.3)
This represents a temperature change of 140°C.
FORM DCM 2, 4.2 (JAN. 1991)
' New York Power Authority
CALCULATION NO. 1P3-CALC-RPC-00291 REVISION 0
Project IP3 Page 13 of 24 Title Instr. Loop Accur/Setpoint Calc. Date 1992 Preliminary Prepared by G. Durniak Date Final X Checked by R. Valvano Date
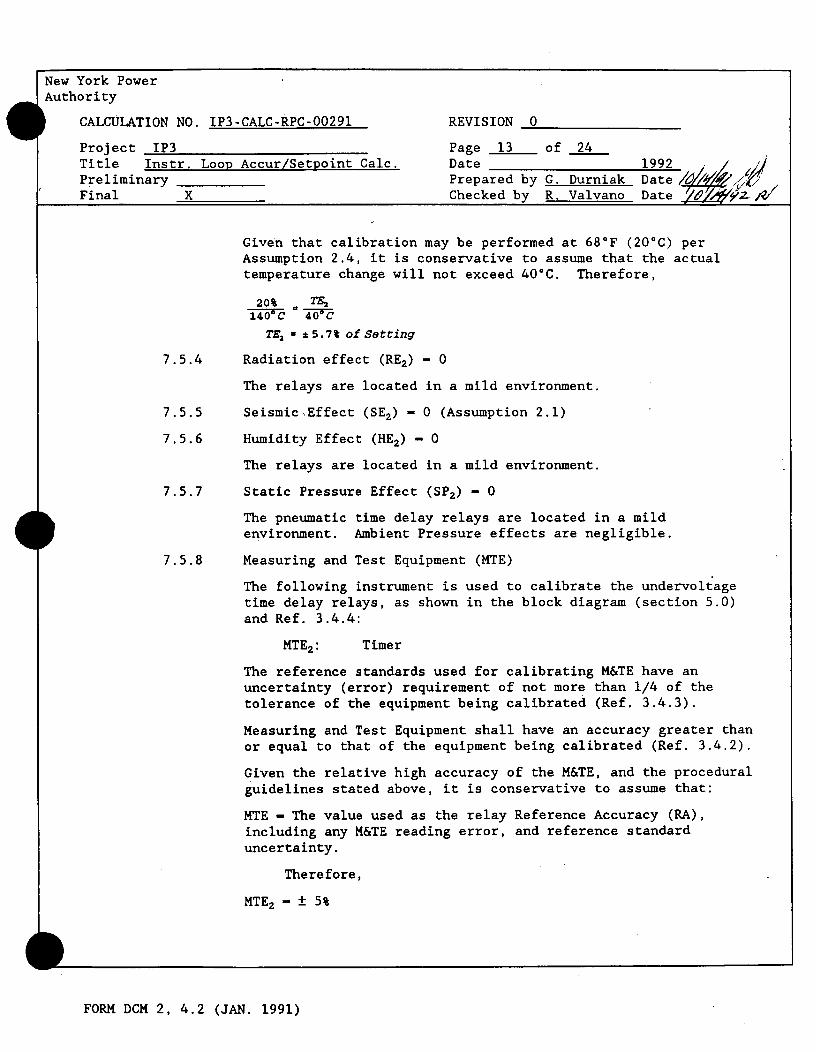
Given that calibration may be performed at 68°F (20°C) per Assumption 2.4, it is conservative to assume that the actual temperature change will not exceed 40°C. Therefore,
20% TE2
TE2 = ±5.7% of Setting
7.5.4 Radiation effect (RE2) - 0
The relays are located in a mild environment.
7.5.5 SeismicEffect (SE2) - 0 (Assumption 2.1)
7.5.6 Humidity Effect (HE2) - 0
The relays are located in a mild environment.
7.5.7 Static Pressure Effect (SP2) - 0
The pneumatic time delay relays are located in a mild environment. Ambient Pressure effects are negligible.
7.5.8 Measuring and Test Equipment (MTE)
The following instrument is used to calibrate the undervoltage time delay relays, as shown in the block diagram (section 5.0) and Ref. 3.4.4:
MTE2 : Timer
The reference standards used for calibrating M&TE have an uncertainty (error) requirement of not more than 1/4 of the
tolerance of the equipment being calibrated (Ref. 3.4.3).
Measuring and Test Equipment shall have an accuracy greater than or equal to that of the equipment being calibrated (Ref. 3.4.2).
Given the relative high accuracy of the M&TE, and the procedural guidelines stated above, it is conservative to assume that:
MTE - The value used as the relay Reference Accuracy (RA), including any M&TE reading error, and reference standard uncertainty.
Therefore,
MTE2 - ± 5%
FORM DCM 2, 4.2 (JAN. 1991)

New York Power Authority
CALCULATION NO. IP3-CALC-RPC-00291 REVISION 0
Project IP3 Page 14 of 24 Title Instr. Loop Accur/Setpoint Calc. Date 1992 jh Preliminary Prepared by G. Durniak Final X Checked by' R. Valvano Date/e 2/ /
7.5.9 Power Supply Effect (PS2 ) - 0%
The preset time delay period for an Agastat Series 2122 (offdelay) pneumatic relay begins as soon as the coil is deenergized. No power is required during the timing period.
(page 11 of Ref. 3.6.3)
7.6 Underfrequency Relay Uncertainty, Time Delay (e3)
e, * ± + DR32 + TE? + RE3 E E + SP3 + MTE3 + PS32
= ± /02 + 19.42 + 02 + 02 + 02 + 02 + 162 + 02, +16%
e3 = ±25%, +16% of setting, given the following Underfrequency Relay time delay uncertainties:
7.6.1 Reference Accuracy (RA3)
The Vendor Reference Accuracy is not given for the Underfrequency Relay time delay. (Ref. 3.6.2)
The Calibration Procedure Tolerance for the Underfrequency relays time delay is shown to be -.016 seconds (Ref. 3.4.5). This value will be used as the Reference Accuracy.
This calibration tolerance will cause the relay to trip sooner for an increasing variable (time). Therefore, this tolerance represents a positive bias on a loop basis, and is equivalent to: .016 = +16% of Setting. .1
7.6.2 Drift (DR3)
Vendor drift data is not available for the underfrequency relays time delay (Ref. 3.6.2).
However, the Instrument Drift Analysis for RPS (Ref. 3.5) provides an evaluation of relay performance, based on a statistical study of actual "as-found" and "as-left" values. The Maximum Expected Drift for a 30 month period (MED30) for the relays is shown to be within ± 19.4% of setting.
"MED30" represents the combined uncertainty due to RA, DR and MTE effects.
For conservatism, in this calculation, MED30 will be used to represent drift only.
FORM DCM 2, 4.2 (JAN. 1991)
New York Power Authority
CALCULATION NO. IP3-CALC-RPC-00291 REVISION 0
Project IP3 Page 15 of 24 Title Instr. Loop Accur/Setpoint Calc. Date 1992 / Preliminary Prepared by G. Durniak Date/4
Final X Checked by R. Valvano Date
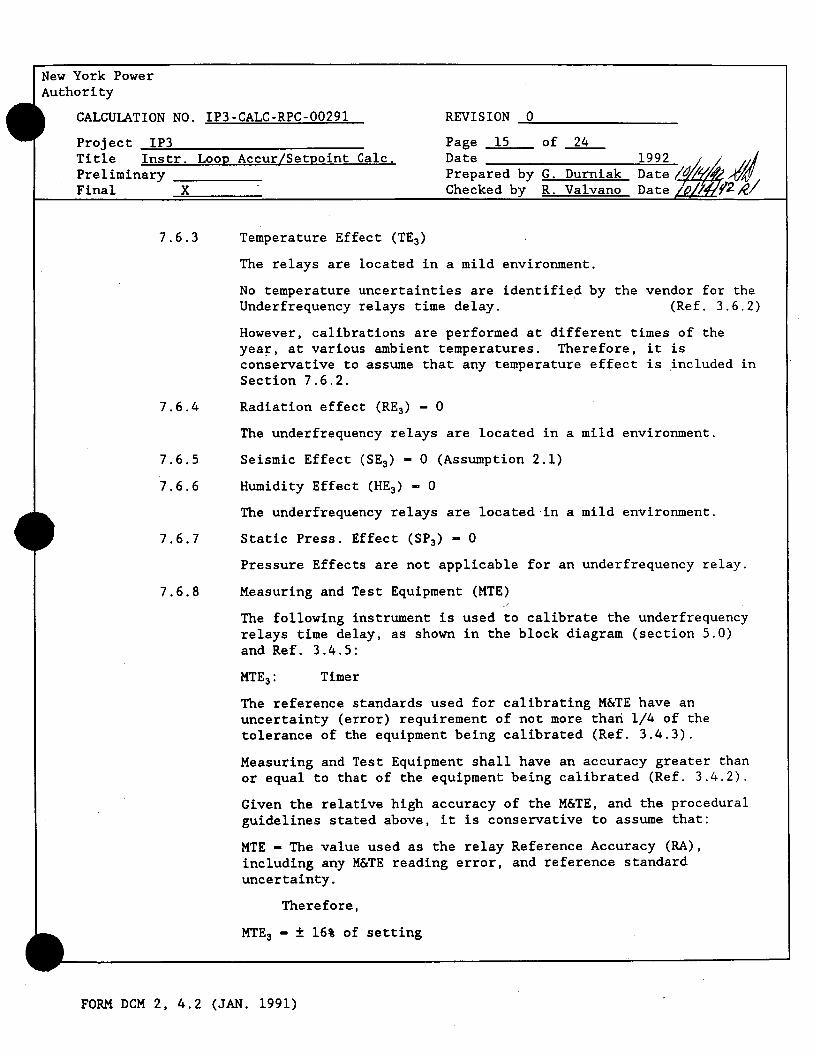
7.6.3 Temperature Effect (TE3)
The relays are located in a mild environment.
No temperature uncertainties are identified by the vendor for the
Underfrequency relays time delay. (Ref. 3.6.2)
However, calibrations are performed at different times of the year, at various ambient temperatures. Therefore, it is conservative to assume that any temperature effect is included in Section 7.6.2.
7.6.4 Radiation effect (RE3) - 0
The underfrequency relays are located in a mild environment.
7.6.5 Seismic Effect (SE3) - 0 (Assumption 2.1)
7.6.6 Humidity Effect (HE3) - 0
The underfrequency relays are located in a mild environment.
7.6.7 Static Press. Effect (SP3) - 0
Pressure Effects are not applicable for an underfrequency relay.
7.6.8 Measuring and Test Equipment (MTE)
The following instrument is used to calibrate the underfrequency relays time delay, as shown in the block diagram (section 5.0) and Ref. 3.4.5:
MTE3: Timer
The reference standards used for calibrating M&TE have an uncertainty (error) requirement of not more than 1/4 of the tolerance of the equipment being calibrated (Ref. 3.4.3).
Measuring and Test Equipment shall have an accuracy greater than
or equal to that of the equipment being calibrated (Ref. 3.4.2).
Given the relative high accuracy of the M&TE, and the procedural guidelines stated above, it is conservative to assume that:
MTE - The value used as the relay Reference Accuracy (RA), including any M&TE reading error, and reference standard uncertainty.
Therefore,
MTE3 - ± 16% of setting
FORM DCM 2, 4.2 (JAN. 1991)
New York Power Authority
CALCULATION NO. IP3-CALC-RPC-00291 REVISION 0
Project IP3 Page 16 of 24 Title Instr. Loop Accur/Setpoint Calc. Date 1992 ;/ Preliminary Prepared by G. Durniak Datez ,,Z, Final X Checked by R. Valvano Date/._ /<2A/
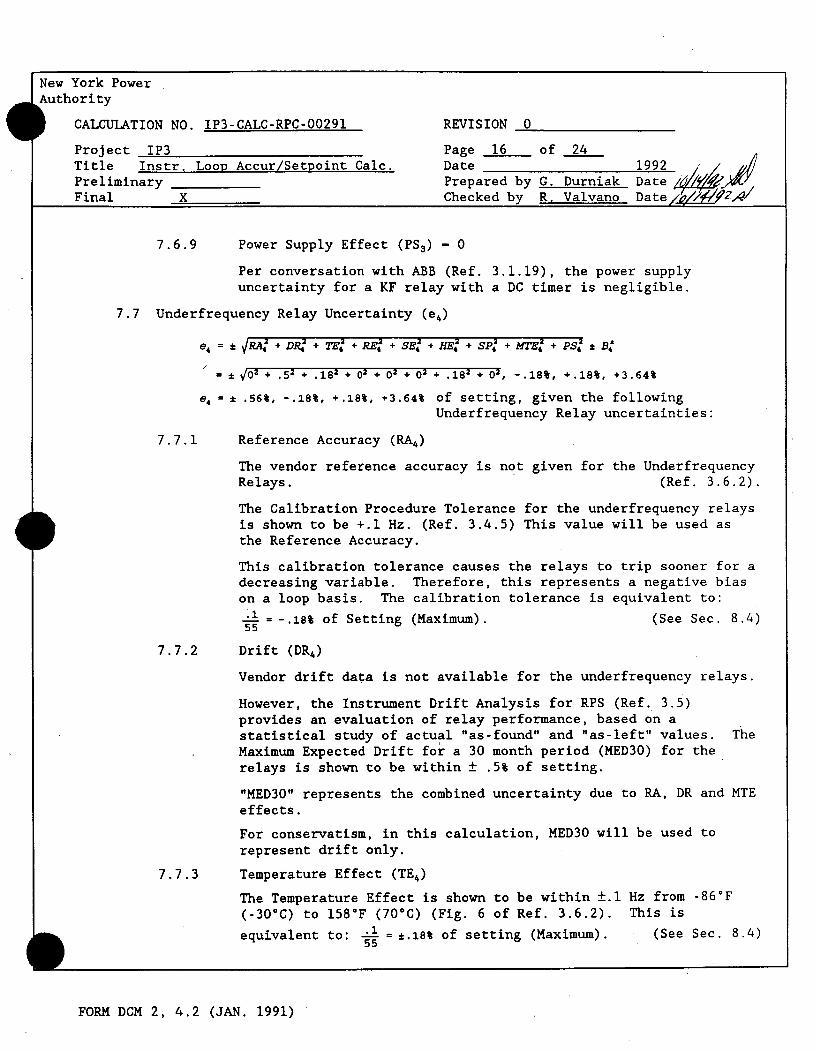
7.6.9 Power Supply Effect (PS3) - 0
Per conversation with ABB (Ref. 3.1.19), the power supply uncertainty for a KF relay with a DC timer is negligible.
7.7 Underfrequency Relay Uncertainty (e4)
e, = RA - D4 D.~ TE. - RE. SE. + KS2 Sp.2 . MTE.2 + PS * i
/ ± 02 + .52 + .182 + 02 + 02 + 02 + .182 + 02, - .18%, +.18%, +3.64%
e4 = .56%, -. 18%, +.18%, +3.64% of setting, given the following Underfrequency Relay uncertainties:
7.7.1 Reference Accuracy (RA4)
The vendor reference accuracy is not given for the Underfrequency Relays. (Ref. 3.6.2).
The Calibration Procedure Tolerance for the underfrequency relays is shown to be +.I Hz. (Ref. 3.4.5) This value will be used as the Reference Accuracy.
This calibration tolerance causes the relays to trip sooner for a decreasing variable. Therefore, this represents a negative bias on a loop basis. The calibration tolerance is equivalent to:
-- = -.18% of Setting (Maximum). (See Sec. 8.4)
7.7.2 Drift (DR)
Vendor drift data is not available for the underfrequency relays.
However, the Instrument Drift Analysis for RPS (Ref. 3.5) provides an evaluation of relay performance, based on a statistical study of actual "as-found" and "as-left" values. The Maximum Expected Drift for a 30 month period (MED30) for the relays is shown to be within ± .5% of setting.
"MED30" represents the combined uncertainty due to RA, DR and MTE effects.
For conservatism, in this calculation, MED30 will be used to represent drift only.
7.7.3 Temperature Effect (TE4)
The Temperature Effect is shown to be within ±.1 Hz from -86'F (-30°C) to 158°F (70°C) (Fig. 6 of Ref. 3.6.2). This is
equivalent to: .i = ±.18% of setting (Maximum). (See Sec. 8.4) 55
FORM DCM 2, 4.2 (JAN. 1991)
New York Power Authority
CALCULATION NO. IP3-CALC-RPC-00291 REVISION 0
Project IP3 Page 17 of 24 Title Instr. Loop Accur/Setpoint Calc. Date 1992 Preliminary Prepared by G. Durniak Date/6/
Final X Checked by R. Valvano Date_/
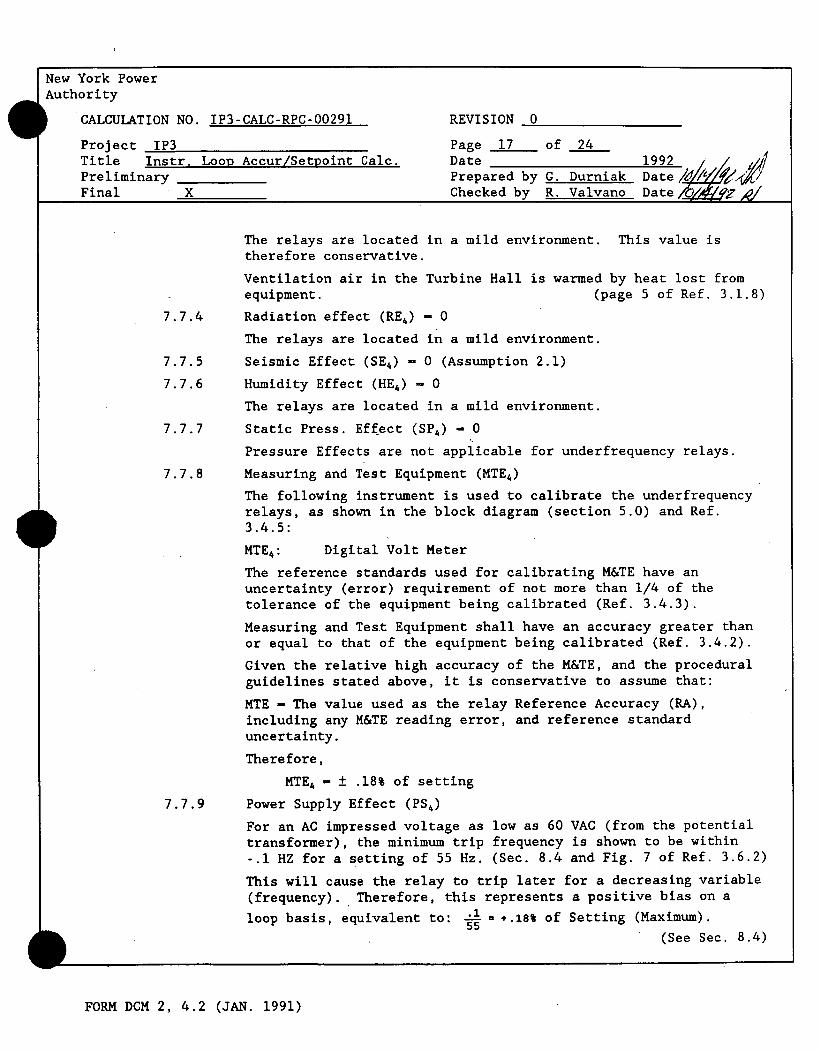
The relays are located in a mild environment. This value is therefore conservative.
Ventilation air in the Turbine Hall is warmed by heat lost from equipment. (page 5 of Ref. 3.1.8)
7.7.4 Radiation effect (RE4) - 0
The relays are located in a mild environment.
7.7.5 Seismic Effect (SE4) - 0 (Assumption 2.1)
7.7.6 Humidity Effect (HE4) - 0
The relays are located in a mild environment.
7.7.7 Static Press. Effect (SP4) - 0
Pressure Effects are not applicable for underfrequency relays.
7.7.8 Measuring and Test Equipment (MTE4)
The following instrument is used to calibrate the underfrequency relays, as shown in the block diagram (section 5.0) and Ref. 3.4.5:
MTE4: Digital Volt Meter
The reference standards used for calibrating M&TE have an uncertainty (error) requirement of not more than 1/4 of the tolerance of the equipment being calibrated (Ref. 3.4.3).
Measuring and Test Equipment shall have an accuracy greater than or equal to that of the equipment being calibrated (Ref. 3.4.2).
Given the relative high accuracy of the M&TE, and the procedural guidelines stated above, it is conservative to assume that:
MTE - The value used as the relay Reference Accuracy (RA), including any M&TE reading error, and reference standard uncertainty.
Therefore,
MTE4 - .18% of setting
7.7.9 Power Supply Effect (PS4)
For an AC impressed voltage as low as 60 VAC (from the potential transformer), the minimum trip frequency is shown to be within
-.1 HZ for a setting of 55 Hz. (Sec. 8.4 and Fig. 7 of Ref. 3.6.2)
This will cause the relay to trip later for a decreasing variable (frequency). Therefore, this represents a positive bias on a
loop basis, equivalent to: = +.18% of Setting (Maximum). 55
(See Sec. 8.4)
FORM DCM 2, 4.2 (JAN. 1991)
New York Power Authority
CALCULATION NO. IP3-CALC-RPC-00291 REVISION 0
Project IP3 Page 18 of 24 Title Instr. Loop Accur/Setpoint Calc. Date 1992 Preliminary Prepared by G. Durniak Date
Final X Checked by R. Valvano Date/1
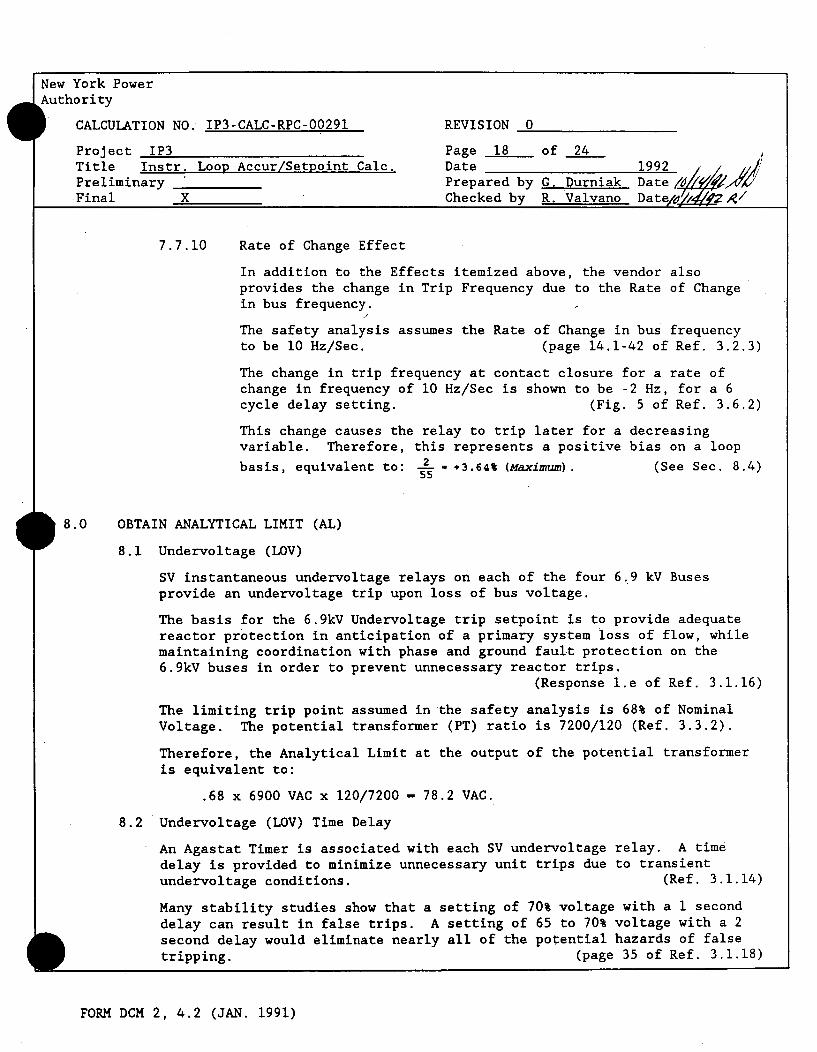
7.7.10 Rate of Change Effect
In addition to the Effects itemized above, the vendor also provides the change in Trip Frequency due to the Rate of Change in bus frequency.
The safety analysis assumes the Rate of Change in bus frequency to be 10 Hz/Sec. (page 14.1-42 of Ref. 3.2.3)
The change in trip frequency at contact closure for a rate of change in frequency of 10 Hz/Sec is shown to be -2 Hz, for a 6 cycle delay setting. (Fig. 5 of Ref. 3.6.2)
This change causes the relay to trip later for a decreasing variable. Therefore, this represents a positive bias on a loop
basis, equivalent to: -2 = +3.64% (Maximum). (See Sec. 8.4) 55
8.0 OBTAIN ANALYTICAL LIMIT (AL)
8.1 Undervoltage (LOV)
SV instantaneous undervoltage relays on each of the four 6.9 kV Buses provide an undervoltage trip upon loss of bus voltage.
The basis for the 6.9kV Undervoltage trip setpoint is to provide adequate reactor protection in anticipation of a primary system loss of flow, while maintaining coordination with phase and ground fault protection on the 6.9kV buses in order to prevent unnecessary reactor trips.
(Response l.e of Ref. 3.1.16)
The limiting trip point assumed in the safety analysis is 68% of Nominal Voltage. The potential transformer (PT) ratio is 7200/120 (Ref. 3.3.2).
Therefore, the Analytical Limit at the output of the potential transformer is equivalent to:
.68 x 6900 VAC x 120/7200 - 78.2 VAC.
8.2 Undervoltage (LOV) Time Delay
An Agastat Timer is associated with each SV undervoltage relay. A time delay is provided to minimize unnecessary unit trips due to transient undervoltage conditions. (Ref. 3.1.14)
Many stability studies show that a setting of 70% voltage with a 1 second delay can result in false trips. A setting of 65 to 70% voltage with a 2 second delay would eliminate nearly all of the potential hazards of false tripping. (page 35 of Ref. 3.1.18)
FORM DCM 2, 4.2 (JAN. 1991)
New York Power
Authority
CALCULATION NO. IP3-CALC-RPC-00291 REVISION 0
Project IP3 Page 19 of 24 Title Instr. Loop Accur/Setpoint Calc. Date 1992 Preliminary Prepared by G. Durniak Date Final X Checked by R. Valvano Date
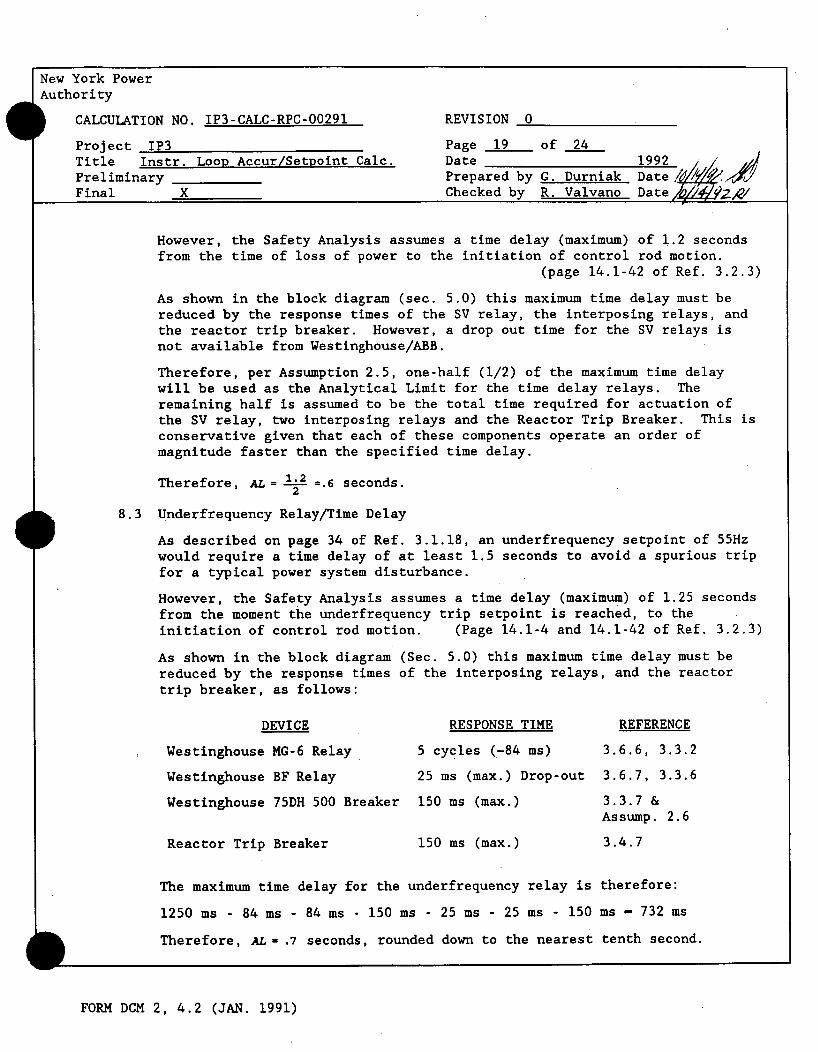
However, the Safety Analysis assumes a time delay (maximum) of 1.2 seconds from the time of loss of power to the initiation of control rod motion.
(page 14.1-42 of Ref. 3.2.3)
As shown in the block diagram (sec. 5.0) this maximum time delay must be reduced by the response times of the SV relay, the interposing relays, and the reactor trip breaker. However, a drop out time for the SV relays is not available from Westinghouse/ABB.
Therefore, per Assumption 2.5, one-half (1/2) of the maximum time delay will be used as the Analytical Limit for the time delay relays. The
remaining half is assumed to be the total time required for actuation of the SV relay, two interposing relays and the Reactor Trip Breaker. This is conservative given that each of these components operate an order of magnitude faster than the specified time delay.
Therefore, AL- 1.2 =.6 seconds.
2
8.3 Underfrequency Relay/Time Delay
As described on page 34 of Ref. 3.1.18, an underfrequency setpoint of 55Hz
would require a time delay of at least 1.5 seconds to avoid a spurious trip
for a typical power system disturbance.
However, the Safety Analysis assumes a time delay (maximum) of 1.25 seconds
from the moment the underfrequency trip setpoint is reached, to the
initiation of control rod motion. (Page 14.1-4 and 14.1-42 of Ref. 3.2.3)
As shown in the block diagram (Sec. 5.0) this maximum time delay must be
reduced by the response times of the interposing relays, and the reactor
trip breaker, as follows:
DEVICE RESPONSE TIME REFERENCE
Westinghouse MG-6 Relay 5 cycles (-84 ms) 3.6.6, 3.3.2
Westinghouse BF Relay 25 ms (max.) Drop-out 3.6.7, 3.3.6
Westinghouse 75DH 500 Breaker 150 ms (max.) 3.3.7 & Assump. 2.6
Reactor Trip Breaker 150 ms (max.) 3.4.7
The maximum time delay for the underfrequency relay is therefore:
1250 ms - 84 ms - 84 ms - 150 ms - 25 ms - 25 ms - 150 ms - 732 ms
Therefore, AL- .7 seconds, rounded down to the nearest tenth second.
FORM DCM 2, 4.2 (JAN. 1991)

New York Power Authority
CALCULATION NO. IP3-CALC-RPC-00291
Project IP3 Title Instr. Loop Accur/Setpoint Calc. Preliminary Final X
REVISION 0
Page 20 of 24 Date 1992 Prepared by G. Durniak Date d Checked by R. Valvano Date Vg/'924/
8.4 Underfrequency Relay
A 55 Hz Trip Setpoint was assumed in the Safety Analysis. (page 14.1-42 of Ref. 3.2.3)
Therefore, AL = 55Hz
9.0 DETERMINE SETPOINT (TS)
CU is combined with the Analytical Limit in an appropriate direction, in order to determine the Trip Setpoint, as shown below.
9.1 Undervoltage (LOV) Setpoint
The positive value of CU is used for a decreasing variable, to insure that the relay will trip above the Analytical limit.
TS-AL*CU (Paragraph 7.0.6.2 of Ref. 3.1.4)
= 78.2 +39 (+39 VAC, Sec. 7.0a)
118 VAC (rounded up to the nearest volt)
Given that the nominal potential transformer secondary voltage is only 6900 VAC x 120/7200 - 115 VAC, this trip setpoint is not practical.
9.2 Undervoltage (LOV) Time Delay Relay Setpoint
The Undervoltage (LOV) Time Delay Analytical Limit (AL) is .6 Seconds (Sec. 8.2). The negative value of CU is used for an increasing variable to insure that channel trip occurs below the Analytical Limit.
TS -AL * CU (Ref. 3.1.4)
- .6 - (.11)TS (- 11% of setting, Sec. 7.0b)
.6 (U + .11)
- .54 Second (rounded down to the nearest hundredth)
9.3 Underfrequency Relay/Time Delay Setpoint
The Underfrequency Relay/Time Delay Analytical Limit (AL) is .7 sec. (Sec. 8.3). The negative value of CU is used for an increasing process variable (time). (para. 7.2 of ref. 3.1.3)
TS AL CU (Ref. 3.1.4)
= .7 - (.25) TS (- 25% of setting, Sec. 7.0c)
FORM DCM 2, 4.2 (JAN. 1991)
New York Power Authority
CALCULATION NO. 1P3-CALC-RPC-00291 REVISION 0
Project IP3 Page 21 of 24 Title Instr. Loop Accur/Setpoint Calc. Date 1992 // Preliminary Prepared by G. Durniak Date Final X Checked by R. Valvano Date
.7 (1 + .25)
= .5Sec (rounded down to the nearest tenth second)
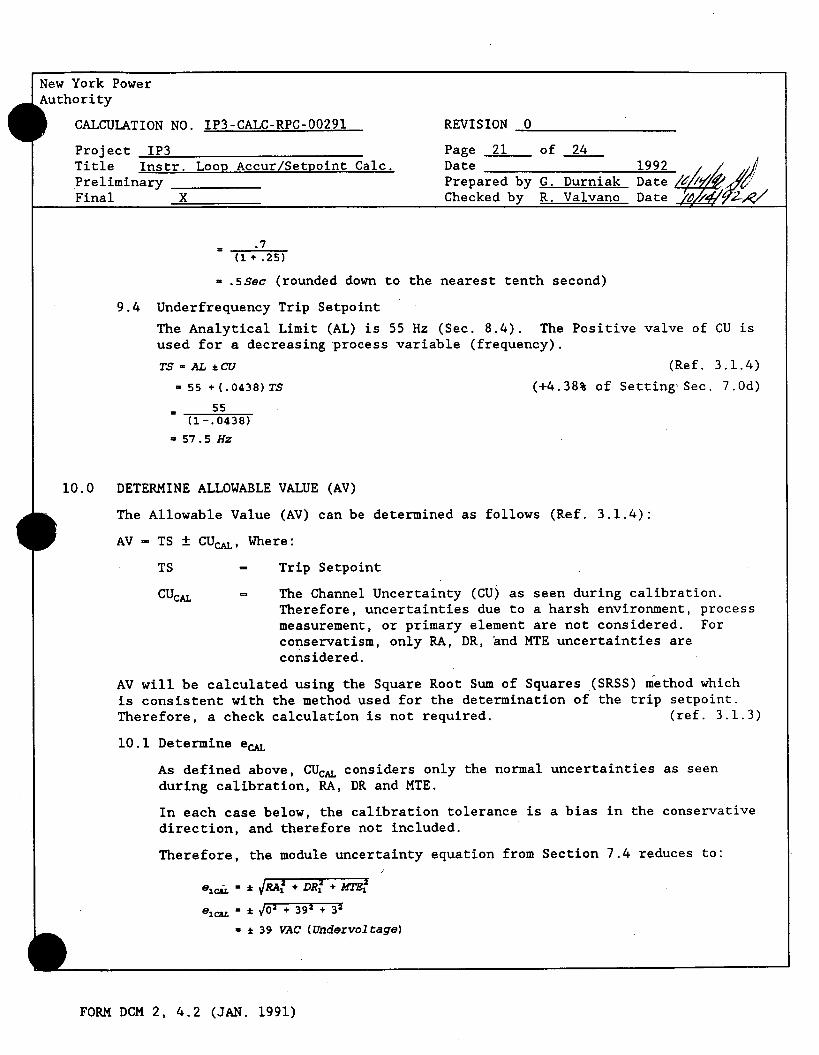
9.4 Underfrequency Trip Setpoint
The Analytical Limit (AL) is 55 Hz (Sec. 8.4). The Positive valve of CU is used for a decreasing process variable (frequency).
TS = AL *CU (Ref. 3.1.4)
= 55 +(.0438) TS (+4.38% of Setting Sec. 7.0d)
55 (1-. 0438)
a 57.5 Hz
10.0 DETERMINE ALLOWABLE VALUE (AV)
The Allowable Value (AV) can be determined as follows (Ref. 3.1.4):
AV - TS + CUcAL, Where:
TS - Trip Setpoint
CUcAL The Channel Uncertainty (CU) as seen during calibration. Therefore, uncertainties due to a harsh environment, process measurement, or primary element are not considered. For conservatism, only RA, DR, 'and MTE uncertainties are considered.
AV will be calculated using the Square Root Sum of Squares (SRSS) method which is consistent with the method used for the determination of the trip setpoint. Therefore, a check calculation is not required. (ref. 3.1.3)
10.1 Determine eCAL
As defined above, CUCAL considers only the normal uncertainties as seen during calibration, RA, DR and MTE.
In each case below, the calibration tolerance is a bias in the conservative direction, and therefore not included.
Therefore, the module uncertainty equation from Section 7.4 reduces to:
e' VPA,' + DR.' - MT7W
ec. = z 02 0 392 + 32
* 39 VAC (Undervoltage)
FORM DCM 2, 4.2 (JAN. 1991)

New York Power Authority
CALCULATION NO. IP3-CALC-RPC-00291 REVISION 0
Project IP3 Page 22 of 24 Title Instr. Loop Accur/Setpoint Calc. Date 1992 /
Preliminary Prepared by G. Durniak Date
Final x Checked by R. Valvano Date le;/
Similarly,
e2 CAL= ± V52 + 6.32 + 52
± + 9.5% of Setting (Undervoltage Time Delay)
e z CAL ± V02 + 19.42 + 162
- + 25% of Setting (Underfrequency Time Delay)
e4ca = ± 02 + .52 + .182 + .53% of Setting (Underfrequency)
10.2 AV for the Undervoltage (LOV) Setpoint
As shown in Sec. 9.1, the calculated Trip Setpoint is not practical. Therefore, the Allowable Value can not be evaluated.
CUcAL = N/A
AV, = N/A
10.3 AV for the Undervoltage (LOV) Time Delay Setpoint
Given the definition of CUcAL above, the Channel Uncertainty equation from Section 7.0 becomes:
UT=
- + 9.5% of Setting
AV2 - TS ± CU2CAL
- .54 + (.095 X .54) - .59 sec, rounded down to nearest hundredth
10.4 AV for the Underfrequency Time Delay Setpoint
Similarly,
cu3A= L
- + 25% of Setting
AV 3 - TS ± CU3CAL
- .5 + (.25 x .5) - .6 sec, rounded down to nearest tenth
10.5 AV for the Underfrequency Trip Setpoint
Similarly,
- ± .53% of Setting
AV4 - TS ± CU4CAL
- 57.5 - (.0053 x 57.5) - 57.2 Hz, rounded up to nearest tenth
FORM DCM 2, 4.2 (JAN. 1991)
New York Power Authority
CALCULATION NO. IP3-CALC-RPC-00291
Project IP3 Title Inst Preliminary Final
:r. Loop Accur/Setpoint Calc.
X
REVISION 0
Page 23 of 24 Date 1992 Prepared by G. Durniak Date Checked by R. Valvano Date
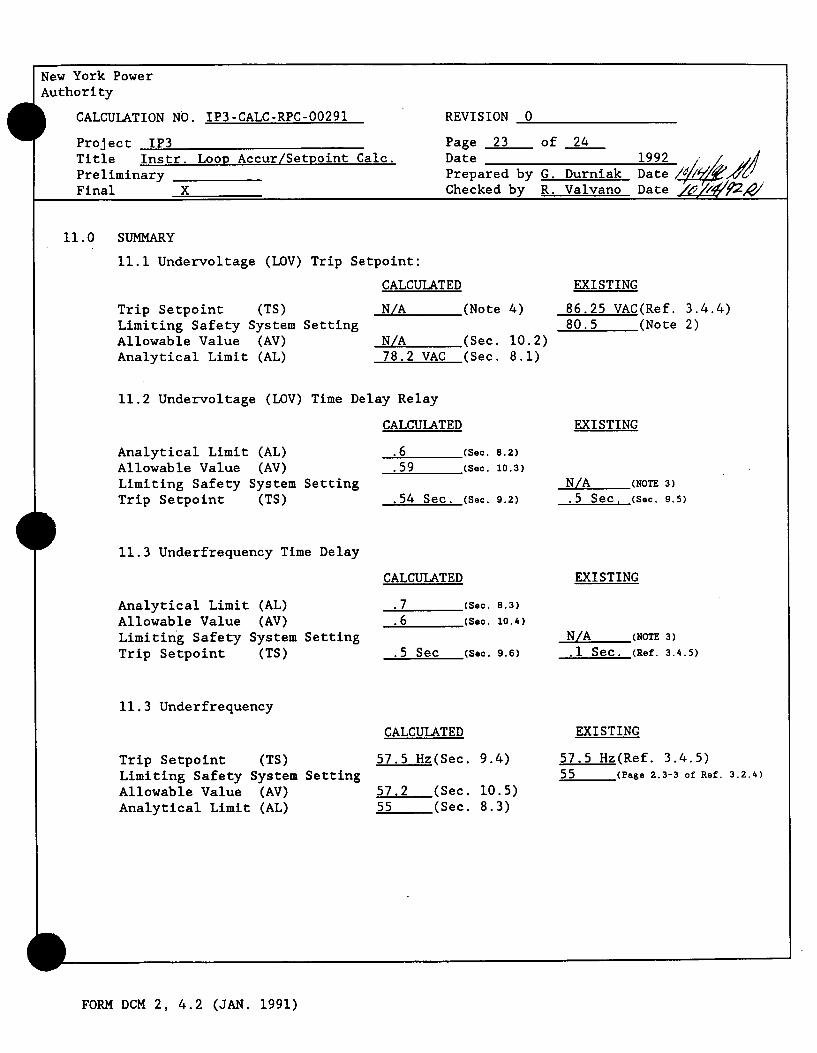
11.0 SUMMARY
11.1 Undervoltage (LOV) Trip Setpoint:
CALCULATED
Trip Setpoint (TS) Limiting Safety System Setting Allowable Value (AV) Analytical Limit (AL)
N/A (Note 4)
N/A (Sec. 10.2) 78.2 VAC (Sec. 8.1)
EXISTING
86.25 VAC(Ref. 3.4.4) 80.5 (Note 2)
11.2 Undervoltage (LOV) Time Delay Relay
CALCULATED
Analytical Limit (AL) Allowable Value (AV) Limiting Safety System Setting Trip Setpoint (TS)
11.3 Underfrequency Time Delay
Analytical Limit (AL) Allowable Value (AV) Limiting Safety System Setting Trip Setpoint (TS)
.6 (Sec. 8.2)
.59 (Sec. 10.3)
.54 Sec. (Sec. 9.2)
CALCULATED
.7 (Sec. 8.3)
.6 (Sec. 10.4)
.5 Sec (Sec. 9.6)
N/A (NOTE 3) .5 Sec. (Sec. 9.5)
EXISTING
N/A (NOTE 3)
.I Sec. (Ref. 3.4.5)
11. 3 Underfrequency
CALCULATED
Trip Setpoint (TS) Limiting Safety System Setting Allowable Value (AV) Analytical Limit (AL)
57.5 Hz(Sec. 9.4)
57.2 (Sec. 10.5) 55 (Sec. 8.3)
57.5 Hz(Ref. 3.4.5) 55 (Page 2.3-3 of Ref. 3.2.4)
FORM DCM 2, 4.2 (JAN. 1991)
EXISTING
EXISTING

New York Power Authority
CALCULATION NO. IP3-CALC-RPC-00291 REVISION 0
Project IP3 Page 24 of 24 Title Instr. Loop Accur/Setpoint Calc. Date 1992 Preliminary Prepared by G. Durniak Date
Final X Checked by R. Valvano Date /_4e(/02,1
NOTES: 1. The calculated Allowable Valve (AV) represents the limiting "As-Found" condition for the instrument loop.
2. 70% x 6900 VAC x 120/7200 - 80.5 VAC (page 2.3-3 of Ref. 3.2.4)
3. A Limiting Safety System Setting for Time Delay is not specified in the existing Technical Specification (page 2.3-3 of Ref. 3.2.4).
4. As shown in Section 9.1, the Westinghouse SV relay performance is not suitable for a 30 month calibration interval.
11.4 Undervoltage Relays:
This calculation demonstrates that the performance of the Westinghouse SV relay, based primarily on actual As-Found, As-Left plant data, is not suitable for a 24 month ± 25% calibration interval. The calibration interval for the SV relays should not be extended.
11.5 Undervoltage Time Delay and Underfrequency Relays:
The existing Setpoints provide sufficient margin to insure that channel trip will occur within the Analytical Limit (AL), for an extended twentyfour (24) month ± 25% operating cycle. No setpoint changes are required.
12.0 ATTACHMENTS
1. Channel Uncertainty Equations (2 Shts.)
FORM DCM 2, 4.2 (JAN. 1991)
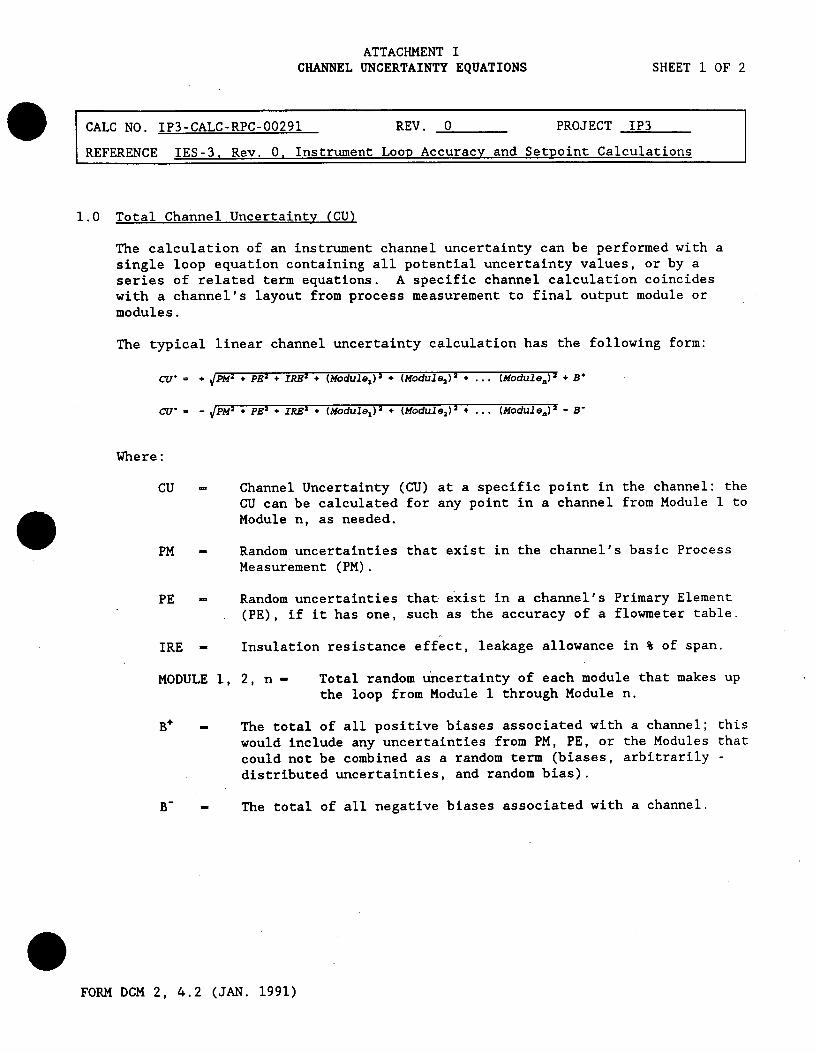
ATTACHMENT I CHANNEL UNCERTAINTY EQUATIONS SHEET 1 OF 2
CALC NO. IP3-CALC-RPC-00291 REV. 0 PROJECT IP3
REFERENCE IES-3, Rev. 0. Instrument Loop Accuracy and Setpoint Calculations
1.0 Total Channel Uncertainty (CU)
The calculation of an instrument channel uncertainty can be performed with a single loop equation containing all potential uncertainty values, or by a
series of related term equations. A specific channel calculation coincides
with a channel's layout from process measurement to final output module or
modules.
The typical linear channel uncertainty calculation has the following form:
CU* - + 1PM2 + PE2 + IRE3 + (Module,)2 + (Modul&2 ) ... (Module.) +
CU- - -1pM 2 + pE
2 + IRE
2 + (Module,)2 + (Module2)
2 + ... (Module.)z
Where:
Channel Uncertainty (CU) at a specific point in the channel: the CU can be calculated for any point in a channel from Module 1 to Module n, as needed.
Random uncertainties that exist in the channel's basic Process Measurement (PM).
PE - Random uncertainties that exist in a channel's Primary Element (PE), if it has one, such as the accuracy of a flowmeter table.
IRE - Insulation resistance effect, leakage allowance in % of span.
MODULE 1, 2, n - Total random uncertainty of each module that makes up the loop from Module 1 through Module n.
- The total of all positive biases associated with a channel; this
would include any uncertainties from PM, PE, or the Modules that
could not be combined as a random term (biases, arbitrarily distributed uncertainties, and random bias).
- The total of all negative biases associated with a channel.
FORM DCM 2, 4.2 (JAN. 1991)
=m

ATTACHMENT I CHANNEL UNCERTAINTY EQUATIONS SHEET 2 OF 2
CALC NO. IP3-CALC-RPC-00291 REV. 0 PROJECT IP3
REFERENCE IES-3. Rev. 0. Instrument Loop Accuracy and Setpoint Calculations
2.0 Module (en) Uncertainties
The individual module random uncertainties are in themselves a statistical combination of uncertainties. Depending on the type of module, its location, and the specific factors that can affect its accuracy, the determination of the module uncertainty will vary. For example, the module uncertainty for a module may be calculated as:
e =. + -IRA2 + DR 2 + TE 2 + RE 2 + SE 2 + HE 2 + Sp 2 + pS 2 + MTE2 + B
e- - VRA2 + DR 2 + TE 2
+ RE 2 + SE2 + HE 2 + SP2 + PS
2 + MTE - B
Where:
e - Uncertainty of module,
RA - Module Reference Accuracy specified by the manufacturer,
DR - Drift of the module over a specific period,
TE - Temperature Effect for the module; the effect of ambient temperature variations on module accuracy; the TE may be a normal operating TE, or an accident TE, as required,
RE - Radiation Effect for the module; the effect of radiation exposure on module accuracy; the RE may be a normal operating RE, an accident RE, or time of trip RE as required,
SE = Seismic Effect or vibration effect for the module; the effect of seismic or operational vibration on the module accuracy,
HE - Humidity Effect for the module; the effect of changes in ambient
humidity on module accuracy, if any,
SP
MTE
- Static Pressure effects for the module; the effect of changes in process static pressure on module accuracy,
Measuring and Test Equipment effect for the module; this accounts for the uncertainties in the equipment utilized for calibration of the module,
Power Supply effect,
B - Biases associated with the module, if any.
FORM DCM 2, 4.2 (JAN. 1991)
m

IP3
JAF INDEPENDENT DESIGN VERIFICATION
CONTROL SHEET
VERIFICATION OF: IP3-CALC-RPC-00291/Setpoint Calculation/6.9kV Undervoltage and Underfrequency Document Title/Number
SUBJECT: 24 Month Operating Cycle
MOD/TASK NUMBER (If Applicable):
QA CATEGORY: Cat I
OTHER
DISCIPLINE REVIEW: ELEC MECH C/S I&C (SPECIFY) o & M
Check as required
METHOD USED DR
VERIFIER'S NAME: W. Wittich
VERIFIER'S
INITIALS/DATE: _ _
APPROVED BY: _ _, __Pe_ ___ _'-- _--Date: _________
REMARKS/SCOPE OF VERIFICATION:
Verification completed in accordance with Attachment 4.3 of DCM 4. Rev. 7.
Calculation is clear and technically understandable. The assumptions, approach,
and technique are in accordance with industry practice. The results are valid
and reasonable.
The calculated trip setting and calibration uncertainties are consistent with the
settings on similar plants (see Trojan and DC Cook Tech Specs).
* Methods of verification: Design Review (DR), Alternate Calculations (AC),
Qualification Test (QT)
Form DCM 4, 4.1 (MAR. 1989) P3-CALC-RC-00291

DESIGN VERIFICATION CHECKLIST DESIGN REVIEW METHOD
VERIFICATION OF: 6.9kV Undervoltage and Underfrequency/IP3-CALC-RPC-00291 Document/Title/Number
SUBJECT: Setpoint Calculations for 24 Month Cycle
MOD/TASK NO.: (If Applicable)
DISCIPLINE REVIEW
ELEC MECHOTHER
(SPECIFY) O&M
I&C
Check as Required LI-I
1. Were the inputs correctly selected and incorporated into the design?
2. Are assumptions necessary to perform the design activity adequately described and reasonable: Where necessary, are the assumptions identified for subsequent reverifications when the detailed design activities are completed?
3. Are the appropriate quality and quality assurance requirements specified? e.g., safety classification.
4. Are the applicable codes, standards and regulatory requirements including issue and addenda properly identified and are their requirements for design met?
5. Have applicable construction and operating experience been considered?
6. Have the design interface requirements been satisfied?
7. Was an appropriate design method used?
8. Is the output reasonable compared to inputs?
9. Are the specified parts, equipment and processes suitable for the required application?
Yes/No/Not Applicable
jjNo/NA
Yes/No4D
(9/No/NA
ONo/NA
G/No/NA
&'No/NA
So/NA
Yes/NoE
Form DCM 4, 4.2 (Page I of 3), (MAR. 1989)
IV/4
IP3-CALC-RPC-00291

DESIGN VERIFICATION CHECKLIST
DESIGN REVIEW METHOD
Yes/No/Not Applicable
10. Are the specified materials compatible with each other and the design environmental conditions to which the materials will be exposed?
11. Have adequate maintenance features and requirements been satisfied?
12. Are accessibility and other design provisions adequate for performance of needed maintenance and repair?
13. Has adequate accessibility been provided to perform the in-service inspection expected to be required during the plant life?
14. Has the design properly considered radiation exposure to the public and plant personnel? (ALARA/cobalt reduction)
15. Are the acceptance criteria incorporated in the design documents sufficient to allow verification that design requirements have been satisfactorily accomplished?
16. Have adequate pre-operational and subsequent periodic test requirements been appropriately specified?
17. Are adequate handling, storage, cleaning and shipping
requirements specified?
18. Are adequate identification requirements specified?
19. Are the conclusions drawn in the Safety Evaluation fully supported by adequate discussion in the test or Safety Evaluation itself?
20. Are necessary procedural changes specified and are responsibilities for such changes clearly delineated?
21. Are requirements for record preparation, review, approval, retention, etc., adequately specified?
22. Have supplemental reviews by other engineering disciplines (seismic, electrical, etc.) been performed on the integrated design package?
Yes/NoA
Yes/Noi
Yes/No6)
Yes/NoeA
Yes/Noe
O/No/NA
No/NA
Yes/No(S
Oe o/NA
Yes/Noe
Yes/No)
Yes/NofC)
s/No/NA
Form DCM 4, 4.2 (Page 2 of 3), (MAR. 1989) IP3-CALC-RPC-O0291

DESIGN VERIFICATION CHECKLIST DESIGN REVIEW METHOD
Yes/No/Not Applicable
23. Have the drawings, sketches, calculations etc., included in the integrated design package been reviewed?
24. References used as part of the design review which are not listed as part of the design calculation/analysis.
AO AE
o/NA
DESIGN VERIFIER:S ignaturif/Date
Title 1
4 s-cco
Form DCM 4, 4.2 (Page 3 of 3), (MAR. 1989)
_;", >2,? 'Z
5 r L/,, ce- s C- .
IP3-CALC-RPC-00291