Embed Size (px)
Citation preview

Institutionen för fysik, kemi och biologi
Examensarbete
Synthesis and characterization of bimetallic platinum-thallium compounds
Freddy ScherlinExamensarbetet utfört vid Linköpings universitet
2008-05-29
LITH-IFM-A-EX--08/1978—SE
Linköpings universitet Institutionen för fysik, kemi och biologi581 83 Linköping

Datum Date 2008-05-29
Avdelning, institutionDivision, Department
ChemistryDepartment of Physics, Chemistry and BiologyLinköping University
URL för elektronisk version
ISBN
ISRN: LITH-IFM-A-EX--08/1978--SE_________________________________________________________________Serietitel och serienummer ISSNTitle of series, numbering ______________________________
SpråkLanguage
Svenska/SwedishEngelska/English
________________
RapporttypReport category
Licentiatavhandling ExamensarbeteC-uppsatsD-uppsats Övrig rapport
_____________
TitelTitle Synthesis and characterization of bimetallic platinum-thallium compounds
FörfattareAuthor Freddy Scherlin
NyckelordKeyword
SammanfattningAbstract
The solid bimetallic compounds TtPt(CN)4(ClO4) and TtPt(CN)4(NO3) have been prepared by reactions
between tetracyanoplatinate complex [Pt(CN)4]2- and aqueous solutions of Tl(ClO4)3 and Tl(NO3)3,
respectively. The elemental analysis (N, C, H, Tl) of the compound has been carried out. The results of the
analysis are reasonably consistent with the above compositions of the compounds. The bimetallic
compounds have been characterized by IR and Raman spectroscopy as well as X-ray diffraction. IR and
Raman spectra of the Tl-Pt compounds confirm presence of the perchlorate and nitrate counter ions in the
solid. The presence of a direct Tl-Pt metal-metal bond in the compounds is confirmed by appearance of a
strong vibrational band the low frequency region of the vibrational spectra.

Institutionen för fysik, kemi och biologi
Synthesis and characterization of bimetallic platinum-thalliumcompounds
Freddy Scherlin
Examensarbetet utfört vid Linköpings universitet
2008-05-29
HandledareMikhail Maliarik
ExaminatorMikhail Maliarik


Abstract
The solid bimetallic compounds TtPt(CN)4(ClO4) and TtPt(CN)4(NO3) have been
prepared by reactions between tetracyanoplatinate complex [Pt(CN)4]2- and
aqueous solutions of Tl(ClO4)3 and Tl(NO3)3, respectively. The elemental analysis
(N, C, H, Tl) of the compound has been carried out. The results of the analysis are
reasonably consistent with the above compositions of the compounds. The
bimetallic compounds have been characterized by IR and Raman spectroscopy
as well as X-ray diffraction. IR and Raman spectra of the Tl-Pt compounds
confirm presence of the perchlorate and nitrate counter ions in the solid. The
presence of a direct Tl-Pt metal-metal bond in the compounds is confirmed by
appearance of a strong vibrational band the low frequency region of the
vibrational spectra.


Table of Contents Page
Objectives …………………………......................................................................................1
Preface …………………………………………………………………………………………....1
Introduction ………………………………………………………………………………............3
General introduction of the methods used …………………………………………………….6
IR and Raman spectroscopy ……………………………………………………………………6
Origin of the molecular spectra …………………………………………………………6IR spectroscopy …………………………………………………………………………..7Raman spectroscopy …………………………………………………………………....9
Complementary nature of IR and Raman spectroscopy ……………………...........10Vibrational spectroscopy of the cyanide ion and cyano complexs ………………..............11
Molecular orbital diagram of the cyanide ion …………………………………………11Optical atomic spectrometry ………………………………………………………………. ….14
Atomic absorption ……………………………………………………………………….14Flame atomization ………………………………………………………………………15Measurements of absorbance …………………………………………………………15
X-ray diffraction ………………………………………………………………………………....16
Powder diffraction pattern ……………………………………………………………...17Experimental section …………………………………………………………………………...18
Synthesis of TlPt(CN)4ClO4 ……………………………………………………………18Synthesis of TlPt(CN)4NO3 …………………………………………………………….19Analysis ………………………………………………………………………………….20Elemental analysis of TlPt(CN)4NO3 ………………………………………………....21Experimental equipment used ………………………………………………….……..23
Result and discussion ……………………………………………………………………….…24
Vibrational spectra of the bimetallic compounds TlPt(CN)4X ………………………24Determination of counter ions in the bimetallic compounds TlPt(CN)4X ………….24The vibrational spectra of the Pt-Tl compound incorporating perchlorate ion …...24The vibrational spectra of the Pt-Tl compound incorporating a nitrate ion ……….25The high frequency vibration of the coordinated cyanide ……………………….…27The low frequency vibration of the TlPt(CN)4X compounds …………………….....28X-ray powder diffraction of the compound TlPt(CN)4ClO4 and TlPt(CN)4NO3 …...32
Conclusions ……………………………………………………………………………………..35
Acknowledgments ……………………………………………………………………………...36
References ……………………………………………………………………………………...37


Objectives
This project is aimed at the synthesis and study of bimetallic thallium-platinum
compounds formed by the reaction between aqueous solutions of [Tl(H2O)6]3+ and
[Pt(CN)4]2- complexes. In this work we will attempt to:
1. synthesize the bimetallic compound by means of the reaction between
tetracyanoplatinate ion and aqueous solutions of Tl(ClO4)3 and Tl(NO3)3.
2. determine the composition of the compounds by means of elemental analysis.
3. identify the counter ions compensating the positive charge of the [TlPt(CN)4]+ unit.
4. study the C-N, C-M and M-M vibration in the compounds by means of IR and
Raman spectroscopy.
5. characterize compounds by means of X–ray powder diffraction.
Preface
One of the most important concepts in inorganic chemistry is the coordination
theory which was developed by Alfred Wearner. The essential idea in Wearner’s
theory was that the metal ion in the coordination complex is surrounded by ligands. It
is the nature of the ligands, the character of bonds, and the geometrical arrangement
of the ligands around the metal atom, which determine the properties of the
compound.
Werner also recognized the existence of polynuclear coordination complexes,
which were viewed simply as a conjunction of two or more mononuclear complexes
having some shared ligand atoms. The properties of these compounds were still
attributed to the metal-ligand interactions, while direct metal-metal interactions were
not considered. A few compounds containing metal-metal bonds had been isolated
already in the middle of nineteenth century. It was, however, only with application of
X-ray crystallographic techniques the existence of metal-metal bonds in metal halide
clusters (Figure 1) was recognized. The discovery of the [Re3 Cl12]3- ion led to the first
general discussion of the entire class of metal atom cluster compounds. A metal
cluster may be defined as a group of two or more metal atoms in which there are
direct bonds between metal atoms.
1

Figure 1. Molecular structure of the octahedral [Mo6Cl8]4+ cluster.
Mo2+
Cl-
Another important class of cluster compounds is the metal carbonyls. They exhibit
short distance betweens metal atoms, indicative of metal-metal bonds. A notable
example is the crystal structure of Fe2(CO)9 with the separation between two metal
atoms of ∼ 2,5 Å. Perhaps the most crucial observation in establishing the importance
of metal-metal bonds was the determination of the Mn2(CO)10 structure, where for the
first time in the chemistry of carbonyl cluster a direct metal-metal bond unsupported
by any bridges was observed [1].
2

Introduction
The ability of [Pt(CN)4]2- to form columnar structures with varying Pt-Pt
interactions in both simple and in partially oxidized salts is well known. For the
tetracyanoplatinates of metal cations the observed Pt-Pt separations in more than 20
crystallographically studied metal salts cover a wide range of distances, 3.09-3.75 Å,
while in the partially oxidized [Pt(CN)4]n- compounds the corresponding separations
are shorter and fall into a narrower range, 2.8-3.0 Å. Only with large organic cations,
the radical cation of N,N,N′,N′- tetramethyl- benzenediamine and 1,1′- dimethyl 4,4′-
bipyridinium, do [Pt(CN)4]2- units exist as well-separated square-planar ions [2].
The compound K2Pt(CN)4 • 3H2O itself does not have interesting properties,
with a Pt-Pt distance of 3.48 Å. It is white and a nonconductor. The oxidation state of
platinum in the compound is 2 and the Pt-Pt distances are so long that no significant
metal-metal bonding would be expected. However, under oxidizing by Cl2 or Br2, the
compound changes its color and turns into an electrical conductor. It has been shown
that these conducting materials contain about 0.3 chloride or bromide ions per
platinum ion, respectively, and that the oxidation state of platinum is therefore about
2.3. This partial oxidation is accompanied by an enormous decrease in the stacking
distance, so that Pt-Pt separations approach 2.88 Å for K2Pt(CN)4Br0,3 • 3H2O and
2.87 Å for K2Pt(CN)4Cl0,3 • 3H2O. For comparison the Pt-Pt distance in metallic
platinum is 2.775 Å.
Figure 2. Example of the stacking of [Pt(CN)4]n- ions in partially oxidized compoundK2Pt(CN)4 Br0,3 • 3H2O.
3

Planar complexes of platinum are arranged in infinite stacks in the crystals of several
important compounds, as illustrated in (Figure 2) for partially oxidized [Pt(CN)4]n- ions.
In this way linear chains of platinum ions are created with direct bonding between the
metal ions [1].
The interest in direct metal-metal linkages between thallium and platinum
atoms was initiated by Nagle and Balch, who reported six-coordinated platinum in the
crystal structure of trans-Tl2Pt(CN)4. The compound does not possess the usual for
the salts of tetracyanoplatinate(II) Pt-Pt linked columnar structure, but involves two
Pt-Tl bonds with a notable covalent character [3]. Pt-Tl distances in the compound
are 3.140 Å (Figure 3). The compound was prepared by the reaction between
thallium(I) ion and tetracyano-palatinate(II) in aqueous solution [2].
Figure 3. Perspective view of Tl2Pt(CN)4.
Bonding between thallium(I) and transition metal is rare. The solid compound
Tl[Co(CO)4] has an ionic structure with no direct Tl-Co bonding. Tl[Au(CN)2] shows
evidence of weak, secondary Tl-Au interactions with long (3.45 Å) metal-metal
separations [2]. Tl-Pt bonds have been also found in the binuclear compound
[Tl(crown-P2)Pt(CN)2](NO3) and in a trinuclear Pt-Tl-Pt compound cis-[Tl{(1-
MeT)2Pt(NH3)2}2](NO3)7H2O [3].
A reaction between Pt(II) and Tl(III) entities can also result in formation of a
direct metal-metal bond between these two ions. A new class of Pt-Tl cyanide
species containing a strong unsupported metal-metal bond, formed by the reaction
between Pt(II) and Tl(III) cyano complexes, has recently been reported [3, 4].
4

The bimetallic Tl-Pt cyano complexes represented by the general formula [(NC)5Pt-
Tl(CN)n-1](n-1)- have been prepared by mixing aqueous solutions of [Pt(CN)4]2- and
[Tl(CN)n]3-n (n=2-4) species at different metal to metal and cyanide to metal ratios.
In addition, a trinuclear complex with the formula [(NC)5Pt-Tl-Pt(CN)5]3- is formed
when the Pt/Tl ratio is larger than 1. All these complexes are present in equilibrium
in aqueous solution, which also involves the parent platinum and thallium cyano
complex [3].
The oligonuclear species that are formed in aqueous solution by reaction
between the [Pt(CN)4]2- and [Tl(CN)n]3-n cyano complexes described above can under
certain conditions precipitate as a white powder of the composition Tl-Pt(CN)5. The
Tl-Pt(CN)5 entities are linked together in linear -NC-Pt-Tl-NC-Pt-Tl- chains through
axial cyano ligand (Figure 4). A three dimensional network is formed by the four
equatorial cyano ligands of the platinum atom that form bridges to the thallium atoms
of neighboring antiparallel chains. These linear “wires” are the essential structural
features and influence the properties of the compound [4].
The reaction between colorless aqueous solution of [Pt(CN)4]2- and thallium(III)
perchlorate or nitrate with Pt/Tl molar ratio 1:1 results in an immediate precipitation
of a yellow powder. The only species which could be detected by 195Pt and 205Tl NMR
spectra of the mother liquors after filtration of the precipitates were either [Pt(CN)4]2-
or Tlaq3+, indicating a small excess of either platinum or thallium in the starting
solutions. This yellow powder was not further analyzed [3].
Figure 4. Structure of the compound TlPt(CN)5. Two unit cells showing the linear antiparallel –N2-C2-Pt-Tl-N2-C2-Pt-Tl- chains. The Pt-Tl bond length in the compound is 2.627 Å.
5

General introduction of the methods used
In this work we have used IR and Raman spectroscopy to characterize the solid
bimetallic Tl-Pt compounds. X-ray powder diffraction has also been used for the
analysis of the solid compound. Element analysis of the compounds with regard to
hydrogen, carbon and nitrogen has been carried out by Micro Kemi AB Uppsala. For
the analysis of the thallium content in the solid compound atomic absorption
spectrometry has been used.
IR and Raman spectroscopy
Origin of the molecular spectra
Spectroscopic experiments demonstrate that energy can be absorbed or
emitted by molecules, ions and atoms in discrete amounts, corresponding to precise
changes in energy of the species concerned. We can precisely measure the amounts
of energy involved because, when a certain amount of energy is emitted, the energy
appears as electromagnetic radiation of a precise frequency [5].
As a first approximation, the energy of the molecule can be separated into
three additive components associated with (1) the motion of the electrons in the
molecule, (2) the vibrations of the constituent atoms, and (3) the rotation of the
molecule as a hole.
Etot = Eelectron + Evibration + Erotation
The basis of this separation lies in the fact that electronic transitions occur on a much
shorter time scale, and rotational transition occur on a much longer time scale than
vibrational transitions. The translational energy of the molecule may be ignored in
this discussion because it is not quantized. If a molecule is placed in an
electromagnetic field, a transfer of energy from the field to the molecule will occur
when Bohr′s frequency condition (ΔE = hν) is satisfied.
The molecule “absorbs” ΔE when it is exited from E0 to E1 and “emits” ΔE
when it reverts from E1 to E0. In this work, we are mainly concerned with vibrational
transitions which are observed in infrared (IR) and Raman (R) spectra. These
transitions appear in the 102 ~ 104 cm-1 region (Figure 5) and originate from vibrations
of atoms constituting the molecule [7].
6

Figure 5. Regions of the electromagnetic spectrum and energy units.
IR spectroscopy
Infrared radiation is the term used to describe electromagnetic radiation with
frequencies and energies lower than those associated with electronic transition
(Figure 5). IR radiation is emitted as a range of frequencies from a heated object. IR-
spectroscopy depends upon absorption of electromagnetic energy with same
frequencies as the vibrating modes of the molecule. Infrared spectra originate in the
photons that are absorbed by a transition between two vibrational energy levels of
the molecule in the electronic ground state. Absorption of IR radiation is only possible
if the molecule has a dipole moment. This occurs when the atoms are chemically
different, such that an unequal sharing of electrons leads to an asymmetrical
distribution of electron density.
Two main applications of IR-spectroscopy provide important structural
information about molecules. The first is the study of simple molecules in gas phase,
the exact amounts of energy absorbed from the IR-radiation are related to increases
in the rotational and vibrational energy of the molecules. It gives the possibility to
determine bond lengths and force constants. The second application of IR involves
the recognition of the structures of more complicated molecules from their
characteristic absorption. IR can be used to indicate the nature of the functional
groups in a molecule, and by comparison with spectra from known compounds, to aid
identification of an unknown material [5].
7

Infrared experiments
The basis of the IR experiments is to pass infrared radiation through a thin
sample of a compound and measure which energies of the applied infrared radiation
are transmitted by the sample. These measurements are carried out by using
spectrometer of a Fourier transform type. Fourier transformation results in a
spectrum of absorbance against energy, although it is more usual for the energy
scale to be expressed in terms of wave numbers (cm-1). Infrared spectra can be
recorded of solids, liquids, solutions and gases using a variety of different sampling
arrangements, but are probably most commonly recorded as suspension of a solid
which has been ground up with a mulling agent and pressed between two alkali
halide plates, or by grounding a solid with KBr and pressing the mixture into a disc.
One of the more common mulling agents is Nujol, a paraffin, the infrared spectrum of
which is shown in Figure 6. The choice of plates (Table 1) and mulling agent
depends on which part of the spectrum we are particularly interested in obtaining
data for.
.
Figure 6. Fourier transform infrared spectrum obtained for a sample of liquid Nujol.
Table 1. Lower limit for some common IR plate materials.
Material Spectroscopic window lower limit (cm -1 ) NaCl 625
KBr 400
CsI 200
The IR spectrum shown above for Nujol contains relatively few bands with
those are present occurring in a number of well-separated regions. If spectra were to
be recorded of other hydrocarbons we would find that absorptions are observed in
similar regions of the spectrum. In most cases the same ligand or the same common
8
group of atoms vibrates at very similar frequencies in a wide range of different
complexes and molecules. These characteristic absorptions are known as group
frequencies and provide one of the most straightforward methods of obtaining
structural information from vibrational studies. The concept is based on the notation
that most absorptions occurring at different energies or between sets of heavy and
light atoms are not coupled with other vibrations of the molecule. Simplistically,
therefore, a vibration can be viewed as reflecting the atoms involved and the strength
of the bond holding them together.
Raman spectroscopy
The second common form of vibrational spectroscopy is based on a different
physical process. When electromagnetic radiation of energy less than required to
promote a molecule into an excited electronic state is absorbed by the molecule, a
virtual excited state is created. This virtual state is of very short lifetime and the
majority of the light is re-emitted at the same energy. However, the energy of a small
proportion of the re-emitted light differs from the incident radiation by energy gaps
that correspond to some of the vibrational modes.
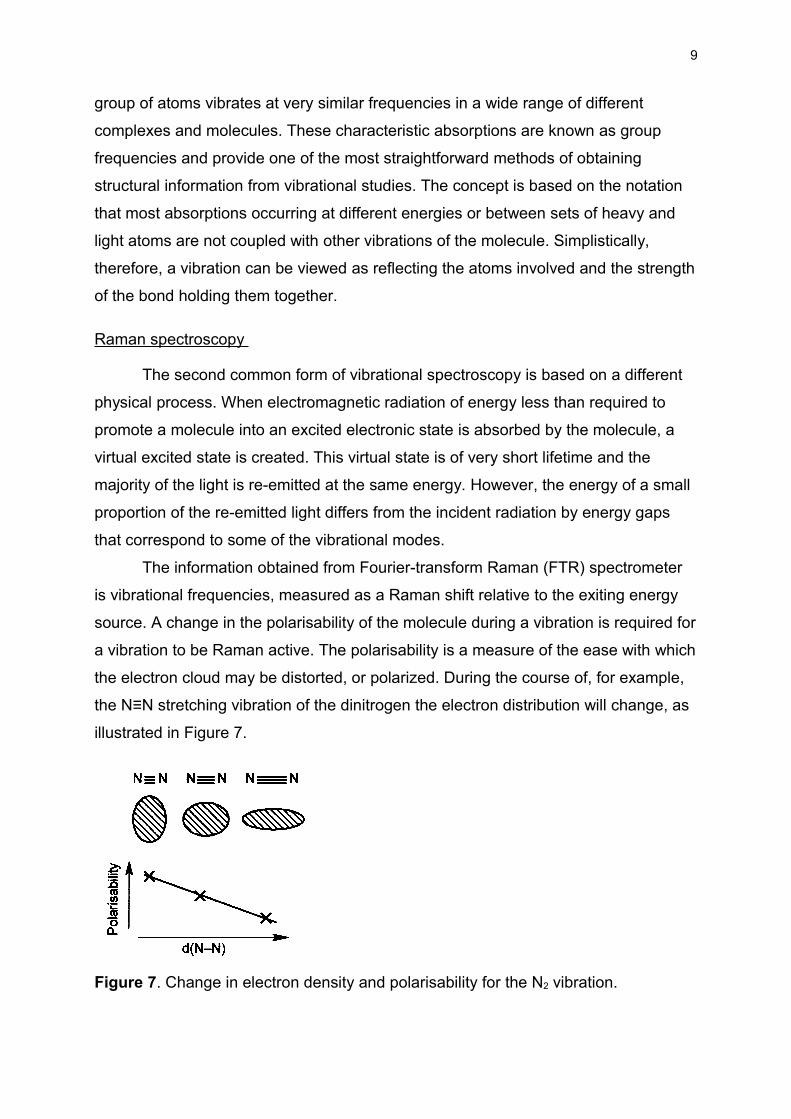
The information obtained from Fourier-transform Raman (FTR) spectrometer
is vibrational frequencies, measured as a Raman shift relative to the exiting energy
source. A change in the polarisability of the molecule during a vibration is required for
a vibration to be Raman active. The polarisability is a measure of the ease with which
the electron cloud may be distorted, or polarized. During the course of, for example,
the N≡N stretching vibration of the dinitrogen the electron distribution will change, as
illustrated in Figure 7.
Figure 7. Change in electron density and polarisability for the N2 vibration.
9
When the N≡N bond is at its most stretched the electron density will be spread more
thinly over a larger volume and can be distorted more easily than if it is concentrated
in a very small area. Because the electron density is altered in such a way that
further distortion, polarization, varies between the extremes of the vibration, the band
will be Raman active.
Raman applications
One area of study where the Raman effect is frequently more useful than
infrared spectroscopy is for determination low frequency vibrations (below ca. 400
cm-1), for example the stretching frequency of compounds containing heavy
elements, and of weakly bound atoms. This is because IR studies are usually carried
out as thin samples between alkali-metal halide plates which start to absorb strongly
at low energies, and so mask any sample absorptions in these regions. Because the
Raman spectrum may be recorded using monochromatic light, any material which is
clear to visible light can be used as a sample holder, for example thin-walled glass
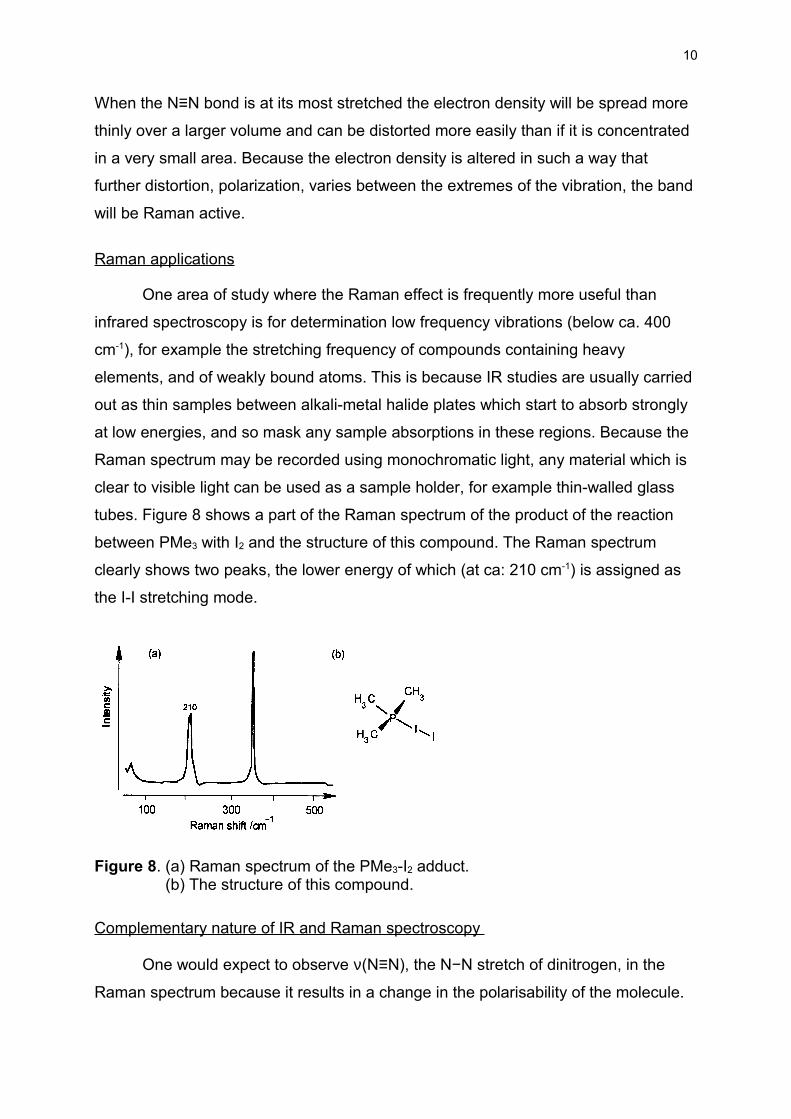
tubes. Figure 8 shows a part of the Raman spectrum of the product of the reaction
between PMe3 with I2 and the structure of this compound. The Raman spectrum
clearly shows two peaks, the lower energy of which (at ca: 210 cm-1) is assigned as
the I-I stretching mode.
Figure 8. (a) Raman spectrum of the PMe3-I2 adduct. (b) The structure of this compound.
Complementary nature of IR and Raman spectroscopy
One would expect to observe ν(N≡N), the N−N stretch of dinitrogen, in the
Raman spectrum because it results in a change in the polarisability of the molecule.
10

Conversely, this vibration is infrared inactive because there is no associated change
in electric dipole. Indeed, for all molecules such as these, possessing a centre of
symmetry, vibrational modes which result in a change in electric dipole and hence
are infrared active do not give rise to a change in polarisability and so are Raman
inactive and vice versa. In this respect Raman and infrared spectroscopies are
complementary and can be used as a method to infer the presence, or otherwise, of
a centre symmetry in a molecule. Compounds which possess a centre of symmetry
will not display any common peaks in their Raman and IR spectra.
There are other characteristics that make Raman and IR spectroscopic
techniques complimentary. Generally, polar bonds which result in a large dipole
absorb strongly in the infrared, while covalent bonds, which are more easily
polarized, absorb strongly in Raman. This has important implications when choosing
solvents for vibrational spectroscopic work. For example, water is a poor Raman
scatter and therefore aqueous solutions are more amenable to study by Raman than
IR- spectroscopy.
The Raman technique is often superior to infrared for spectroscopic
investigation of inorganic systems because aqueous solutions can be employed. The
vibrational energies of metal-ligand bonds are generally in the range of 100-700 cm-1,
a region of infrared spectra that is experimentally difficult to study [6].
Vibrational spectroscopy of the cyanide ion and cyano complexes
Molecular orbital diagram of the cyanide ion
By considering the Lewis structure of the cyanide ion and calculating
formal charge of the constituting atoms, we should locate the negative charge
on the carbon atom. This hints that the carbon will be the nucleophilic atom
using its lone pair forms the coordinate covalent bond.
Examining the molecular orbital diagram of cyanide ion above, we see
that the electrons in the low energy bonding orbitals spend more time near the
more electronegative atom, the nitrogen atom in the cyanide ion. Electrons in
the higher energy nonboning and antibonding orbital spend more time near less
electronegative atom, the carbon atom in the cyanide ion. This means that in
the cyanide ion, the carbon atom is the nucleophile atom donating electron
density to an electron acceptor. In the [Pt(CN)4]2- complex, the platinum(II) ion is
an electron acceptor. Platinum accept electrons into its empty d-orbitals.
11

Antibonding molecular orbital (π acceptor), accepting electrons from the metal atom.
Nonbonding molecular orbital donating electrons to the metal atom, e- pair located at carbon.
Nonbonding σ molecular orbital, e- pair located at nitrogen.
Carbon CN- Nitrogen
Figure 9. Molecular orbital diagram of CN- [10].
Higher frequency C-N stretching bands
Stretching vibrations of cyanide ligands can be easily identified in the IR
spectrum since they exhibit very strong and very sharp bands at 2200-2000
cm-1 (Figure10).
Figure 10. Infrared spectra of K2[Co(CN)6] (solid line) and K2[Pt(CN)4]•3H2O(broken line).
The ν(CN) of free CN- group is found at 2080 cm-1 in aqueous solution. Upon
coordination to a metal, the ν(CN) is shifted to higher frequencies. The CN- ion
acts as a σ-donor by donating electrons to the metal and also as a π-acceptor
12

by accepting electrons from the metal into its empty antibonding π orbital, see
molecular orbital diagram, Figure 9. σ-Donation tends to rise the ν(CN) since
electrons are removed from the σ orbital, which is a nonbonding molecule
orbital, while π-backbonding tends to decrease the ν(CN) because the electrons
enter the antibonding molecule π* orbital. Thus, the ν(CN) of coordinated
cyanide ions are generally higher then the value for free CN- and are governed
by such characteristics of the metal ions:
(i) the electronegativity: the higher the electronegativity , the stronger the σ-
donation, and the higher the ν(CN)
(ii) the oxidation state: the higher the oxidation state, the stronger the σ-
donation, and the higher the ν(CN)
(iii) the coordination number: an increase in the coordination number
results in a decrease in the positive charge on the metal atom, which in turn
weakens the σ-bonding, thus decreasing the ν(CN) [7].
The combination of σ-donation and π-backbonding is often referred as a
synergic bonding, in that the two components enhance the effect of each other
(Figure 11). The π backbonding results in strengthening of M-C bond, since the
orbital overlap between the metal and carbon atom increases. At the same time,
because the electron density from the metal is being donated into an
antibonding molecular orbital of the carbon-nitrogen ligand, the C-N bond order
is reduced, and the carbon nitrogen bond is weaken [6].
Figure 11. A representation of the synergic model of bonding between a transition metal and cyanide.
Lower frequency M-C stretching bands
In addition to the stretching bands of vibrations of the coordinated CN- ion
ν(CN), the cyano complexes exhibit stretching vibration bands of metal-carbon
bond, and bands of bending vibration δ(MCN), (δ=in-plane bending deformation)
13

and δ(CMC) in the low-frequency region. Figure 12 shows the infrared spectra
of K3[Co(CN)6] and K2[Pt(CN)4 3H2O. The ν(MC), δ(MCN), and δ(CMC)
vibrations appear in the regions 600-350, 500-350, and 130-60 cm-1,
respectively [7].
Figure 12. Infrared spectra of K2[Co(CN)6] (solid line) and K2[Pt(CN)4]•3H2O (broken line).
Optical atomic spectrometry
Three major types of spectrometric methods are used to identify the elements
present in a matter and determine their concentrations: (1) optical spectrometry, (2)
mass spectrometry and (3) X-ray spectrometry. In optical spectrometry the elements
present in a sample are converted into gaseous atoms or elementary ions by a
process called atomization. The ultraviolet-visible absorption, emission or
fluorescence of the atomic species in the vapour is then measured.
Atomic absorption
In a hot gaseous medium, sodium atoms are capable of absorbing radiation of
wavelengths characteristic of electronic transitions from the 3s state to higher exited
states. For example, sharp absorption lines at 5890, 5896, 3302 and 3303 Å appear
in the experimental spectrum. We see in Figure 13 that each adjacent pair of these
peaks corresponds to transitions from the 3s level to 3p and the 4p levels respectively.
14

Figure 13. Energy level diagram for atomic sodium.
Nonresonance absorption due to the 3p to 5s transition is so weak that it goes
undetected because the number of sodium atoms in the 3p state is generally small at
the temperature of a flame. Thus, typically an atomic absorption spectrum consists
predominantly of resonance lines, which are the result of transitions from the ground
state to upper levels.
Flame atomization
In a flame atomizer, a solution of the sample is atomized by a flow of gaseous
oxidant, mixed with a gaseous fuel, and carried into a flame where atomization
occurs. A complex set of interconnected processes then occur in the flame. The first
is desolvation, in which the solvent evaporates to produce a finely divided solid
molecular aerosol. The aerosol is then volatilized to form gaseous molecules.
Dissociation of most of the molecules produces an atomic gas. Some of the atoms in
the gas ionize to form cations and electrons.
Measurement of absorbance
Quantitative absorption methods require two power measurements: one
before a beam has passed through the medium that contains the analyte (P0) and the
15

other after (P), see Figure 14. Two terms, which are widely used in absorption
spectrometry and are related to the ratio of P0 and P, are transmittance and
absorbance. The absorbance A of a medium is defined by the equation:
For monochromatic radiation, absorbance is directly proportional to the path length b
through the medium and the concentration c of the absorbing species. Where ε is a
proportionality constant called absorptivity. The magnitude of ε depends on the units
used for b and c. For solutions of an absorbing species, b is often given in
centimetres and c in grams per litre. Absorptivity then has the unit of L g-1 cm-1.
Figure 14. Attenuation of a beam of radiation by an absorbing solution.
X-ray diffraction
The diffraction techniques are quite different from the spectroscopic methods
so far discussed. Whereas the latter are based on the absorption of certain
wavelengths from radiation with a range of wavelengths, diffraction techniques
employ radiation with a single wavelength, i.e. monochromatic radiation.
X-ray diffraction occurs when a monochromatic beam of X-radiation interacts
with matter and is scattered in different directions, with no absorption of energy.
Similarly, a beam of neutrons or electrons with well-defined wavelength can be
scattered to give typical diffraction patterns. The basis of the application of diffraction
techniques in chemical problems is to use ions or molecules as diffraction gratings
and then to determine, from the observed diffraction phenomena, the spacing
between ions in a crystal or between the atoms which constitute molecules.
The diffraction phenomena can be observed if the wavelength of the radiation
16

is of the same order of magnitude as the ′repeat distance′ of the atoms or ions in the
crystal. Crystalline solids consist of regular arrays of atoms, ions or molecules with
interatomic spacing of the order 100 pm, and X-rays fulfil this condition. The method
has been developed to provide a means for determining the exact positions of ions in
an ionic crystal lattice and of atoms within a molecule − that is, for determining
accurate values for bond angles and bond lengths, even in extremely complicated
molecules like proteins and enzymes [5].
X-ray diffraction techniques are divided in two methods: single crystal and
powder X-ray diffraction.
• Single crystal X-ray diffraction is used to determine atomic positions precisely and
therefore the bond lengths and bond angles of molecule within the unit cell. In gives
an overall, average picture of a long-range ordered structure, but is less suited to
giving information on the structural positions of defects, dopants, and non-
stoichiometric regions.
• Powder X-ray diffraction is probably the most commonly employed technique in
solid state inorganic chemistry and has many uses from analysis and assessing
phase purity to determining structure of compounds.
Powder diffraction pattern
A finely ground crystalline powder contains a very large number of small
crystals, known as crystallites, which are oriented randomly to one another. If such
sample is placed in the path of a monochromatic X-ray beam, diffraction will occur
from planes in those crystallites which happen to be oriented at the correct angle to
fulfil the Bragg condition. Collections of powder diffraction patterns are almost always
performed by automatic diffractometers to record the angle and the intensity of the
diffracted beams, which are plotted as intensity against 2θ (Figure 15) [8].
Figure 15. A powder diffraction pattern for Ni powder.
17

Experimental section Synthesis of TlPt(CN)4ClO4
The solid compound TlPt(CN)4ClO4 was prepared by the reaction between aqueous
solutions of Na2Pt(CN)4 and Tl(ClO4)3. The former compound was obtained from
K2PtCl4 by the reaction with cyanide ion in aqueous solution, followed by the change
of the cation, Na instead of K. Tl(ClO4)3 was obtained by electrolysis in aqueous
solution of TlIClO4 in HClO4 [3].
Synthesis of K2Pt(CN)4• 3H 2O
[PtCl4]2- (aq) + 4CN- (aq) ⇌ [Pt(CN)4]2- (aq) + 4Cl- (aq)
Solid compound K2PtCl4 (0.496 g, 1.195 *10-3 mole) was dissolved in 3.5 cm3 of
deionized water. Solid potassium cyanide (0.778 g, 11.952*10-3 mole) was dissolved
in 4 cm3 of deionized water. 2.4 cm3 of the KCN solution (7.17*10-3 mole) was added
to the solution of [PtCl4]2- under stirring at 298 K. The color of the solution changed
from light brown to colorless. The solution was gently heated to slowly evaporate the
solvent. After evaporation of the half of the solvent volume, a yellow powder of
K2Pt(CN)4 started to precipitate. The powder was filtrated and carefully washed with 5
drops of ice-cold water using suction-filtration. The compound was dried in a vacuum
desiccator over silica gel. After drying of the compound in the vacuum desiccator, it
acquires a darker yellow color.
Synthesis of Na2Pt(CN)4• 3H 2O
K2Pt(CN)4•3H2O (aq) + 2 NaClO4 (aq) ⇌ Na2Pt(CN)4 (aq) + 2KClO4 (s)
Solid compound K2Pt(CN)4•3H2O (0.285 g, 6.611*10-4 mole) was dissolved in 2 cm3 of
deionized water. Solid sodium perchlorate (0.372 g, 2.644*10-3 mole) was dissolved
in 2 cm3 of deionized water. 1 cm-1 of the sodium perchlorate solution (1.322*10-3
mole) was added to an ice-cold solution of K2Pt(CN)4•3H2O in an Erlenmeyer flask
and the mixture was stirred for 10 minutes. Precipitation of a low soluble KClO4
occurred immediately. Solid KClO4 was separated from the reaction mixture using
filtration. The solution was gently heated. After evaporation of the half of the solvent
volume, a yellow powder of Na2Pt(CN)4•3H2O started to precipitate. The powder was
18

filtrated and carefully washed with 5 drops of ice-cold water using suction-filtration.
The compound was dried in a vacuum desiccator over silica gel.
Synthesis of TlPt(CN)4ClO4
Na2Pt(CN)4 (aq) + Tl(ClO4)3 (aq) ⇌ Tl-Pt(CN)4ClO4 (s) + 2 Na+ (aq) + 2 ClO4- (aq)
Solid compound Na2Pt(CN)4•3H2O (0.264g, 6.610*10-4 mole) was dissolved in 2 cm3
of deionized water and 0.6 cm3 of 1.1 M solution of Tl(ClO4)3 was added to the
solution of [Pt(CN)4]2- under stirring at room temperature for 15 minutes. A yellow
precipitate was formed immediately. The solid was filtrated and washed with 10
drops of ice-cold water and dried by suction filtration. Finally the solid was dried in a
vacuum desiccator over silica gel.
Synthesis of TlPt(CN)4NO3
Solid compound TlPt(CN)4NO3 was prepared by reaction between aqueous
solutions of K2Pt(CN)4 and Tl(NO3)3.
Synthesis of aqueous solution of thallium(III) nitrate
Tl2O3 (s) + 6 HNO3 (aq) ⇌ 2 Tl(NO3)3 (aq) + 3 H2O (l)
Solution of Tl(NO3)3 (aq) was obtained by dissolving 1.512 g of solid Tl2O3 (3.31*10-3
mole) in a mixture of 4 cm3 of deionized water and 1.4 cm3 of 14.6 M HNO3 under
heating to about 350 K for 15 minutes. Additional 1.2 cm3 HNO3 (aq) was needed to
completely dissolve the solid Tl2O3. Colorless solution was obtained. It is important to
keep this solution in dark to avoid photochemical decomposition, because Tl3+ is
thermodynamic unstable and is easily reduced to Tl+. All tallium ions in the above
solution were counted as Tl3+ (0.571 M), because at this stage we were not able to
exactly determine the concentrations of Tl+ and Tl3+. An improved method for this
analysis was developed later, see below.
Synthesis of Tl-Pt(CN)4NO3
Tl(NO3)3 (aq) + K2Pt(CN)4•3H2O (aq) ⇌ Tl-Pt(CN)4NO3 (s) + 2K+ (aq) + 2NO3- (aq)
The reaction between K2Pt(CN)4•3H2O (aq) and colorless solution of Tl(NO3)3 (aq)
with Tl/Pt molar ratio 1:1, results in an immediate precipitation of a yellow powder.
0.200 g (4.636*10-4 mole) of solid K2Pt(CN)4 was dissolved in 1 cm3 of deionized
19

water. 0.812 cm3 of 0.571 M Tl(NO3)3 (aq) solution was added to the platinum solution
at 350 K under stirring for 15 minutes.
The yellow precipitate was washed with 8 drops of ice-cold water and dried by
suction filtration. The powder was stored in a vacuum desiccatior over silica gel.
Later, when examining the product, it became obvious that the precipitate was
comprised of two different phases. One phase consisted of yellow powder, while the
other consisted of a red and very hard substance. The yellow powder only was
further analyzed. In order to improve the synthesis and try to get a pure product, a
modified synthesis was carried out.
Synthesis of aqueous solution of thallium(III) nitrate
The solution of Tl(NO3)3 (aq) was prepared as before, but the reaction flask was
covered by a aluminum foil in order to protect the solutions from light and avoid
possible photochemical reduction of Tl3+ to Tl+. With this quite simple modification it
was now feasible to obtain a solution containing higher mole fraction of Tl3+. The
analysis showed the concentration of Tl3+ ion to be 0.329 M whereas the total
concentration of Tl ions in the solution was 0.370 M.
Synthesis of the TlPt(CN)4NO3
The synthesis of the TlPt(CN)4NO3 compound was performed as before but the
reaction temperature was 298 K. The reaction flask was light protected. A pale green
precipitate was obtained.
Analysis
Titrimetric determination of Tl + and Tl 3+ ions
Before using the solution of Tl(NO3)3 in the synthesis, it is important to control the
concentrations of both Tl3+ and Tl+ ions. The concentration of Tl+ and Tl3+ is
determined by redox-titration with standard (0.100 N) aqueous solution of KBrO3.
3Tl+ (aq) + BrO3- (aq) + 6H+ (aq) ⇌ 3Tl3+ (aq) + Br – (aq) + H2O (l)
The sample was acidified with concentrated aqueous hydrochloric acid 5 cm3 of (12.6
M), and a few drops of methyl orange were added as an endpoint indicator. The
solution was then titrated with 0.100 N aqueous solution of BrO3-. All thallium(I) is
20

oxidized to thallium(III). After this titration, gaseous sulphur dioxide was bubbled
through the solution in order to reduce Tl3+ to Tl+.
Tl3+ (aq) + SO2 (g) + 2H2O (l) ⇌ Tl+ (aq) + SO42- (aq) + 4H+ (aq)
The titration flask was then heated for 15-20 minutes in order to boil out all the
dissolved gas. The solution was then titrated again. Concentration of Tl3+ present in
the original sample was determined from the difference between the two titrations.
When titrating Tl+.ions in the solution of thallium(III) nitrate, it is very important
to add the bromate solution very slowly during the first titration, approximately one
drop per 30 seconds. It is very easy otherwise to put in more BrO3- than it is
necessary which gives incorrect results. At the end of second titration, after reducing
of all thallium(III), when about one fourth remains to titrate, one should also add BrO3-
very slowly, one drop per 10 seconds. The temperature of the titration flask has to be
reduced to 298 K before the beginning of the second titration.
No special precautions has to be taken when analyzing the concentration of
Tl+ and Tl3+ ions in the aqueous solution of Tl(ClO4)3.
Elemental analysis of TlPt(CN)4NO3
Determination of the thallium content in the compound TlPt(CN)4NO3 by means of atomic absorption spectrometry
The solid TlPt(CN)4NO3 compound (10.0 mg) was dissolved in an aqueous solution of
NaCN (7.2 * 10-4 M) Tl/CN ratio 1:1. A small excess of the solution of NaCN was
required to completely dissolve the compound. A small portion of the Tl3+ ions is
hydrolysed by basic cyano ligands and precipitates from the solution. 0.5 cm-3 of
concentrated aqueous solution of hydrogen chloride was added to the solution to
suppress hydrolysis. Finally a transparent aqueous solution was obtained. The
solution was quantitatively transferred to a 100.0 ml volumetric flask and diluted by
deionized water.
81.3 ml of this solution was transferred to a second 100.0 ml volumetric flask and
diluted by deionized water. This solution containing totally 8.13 mg of the compound
was analysed by atomic absorption spectroscopy. The analysis showed a
concentration of thallium in the sample of 31.65 mg /L.
31.65 mg/L * 0.1L = 3.165 mg Tl.
21

The content of thallium in the compound is 3.165 mg Tl / 8.13 mg compound *100 %
= 38.9 % of thallium.
Six different standard solutions were prepared in order to obtain a calibration curve.
These solutions were prepared from a standard solution of TlINO3 (1.000 g Tl/L).
Solution 1 : 3.0 mgTl /L Solution 4 : 22.5 mgTl /L
Solution 2 : 9.5 mgTl /L Solution 5 : 30.0 mgTl /L
Solution 3 : 16.0 mgTl /L Solution 6 : 36.5 mgTl /L
Determination of the carbon, nitrogen and hydrogen contents in the compound
TlPt(CN)4NO3
The compound TlPt(CN)4NO3 was also analysed with regard to the content of carbon,
nitrogen and hydrogen by Micro Kemi AB (Uppsala Sweden). The results of the
analysis are presented in Table 2. The fact that 0.35% hydrogen has been detected
points to presence of one water molecule of coordination in the compound.
Molecule weight TlPt(CN)4NO3 565.55 amu
Molecule weight TlPt(CN)4NO3 H2O 583.57 amu
Mass % hydrogen in the compound: 2.016 / 583.57 ≈ 0.00345 → 0.35 %
Table 2. Calculated and experimental mass % values.
Compound Calc:Tl% C% N% H% Found: Tl% C% N% H%
TlPt(CN)4NO3 36.1 8.5 12.4 0
TlPt(CN)4NO3 H2O 35.0 8.2 12.0 0.35 38.9 9.15 10.5 0.35
TlPt(CN)4NO3 2H2O 34.0 8.0 11.6 0.69
Substantial deviations of the results of the analysis for the possible compositions of
the compound indicate that the product is not homogeneous, which has been also
confirmed by the results of XRD, see below.
22

Experimental equipment used.
IR spectroscopy
IR spectra were recorded at a Perkin Elmer 100 FT-IR spectrometer. The solid
samples were either grounded up with mineral oil and placed then between NaCl
windows, or grounded up with dry solid KBr and pressed to then to a thin disk.
Raman spectroscopy
Raman spectra were measured by using a Renishaw System 1000 spectrometer
equipped with a Leica DMLM microscope and a diode laser (780 nm). Raman
spectra were also measured by means of the FT-Raman accessory on a Bio-RAD
FTS 6000 FT-IR spectrometer.
X-ray powder diffraction (XRD)
The X-ray diffraction data were recorded on a Philips PW 1820 diffractometer using
Cuα1 radiation ( λ=1,54056 Å ). The diffractograms were recorded with a current
setting of 40 mA a generator voltage of 40 kV, a divergence slit of 0.5° and a
receiving slit of 0.2°.
The X-ray diffraction data were also recorded on a STOE STADI P transmission
diffractometer at Moscow State University.
Atomic absorption spectroscopy
The atomic absorption measurements were performed on a Perkin Elmer A Analyst
300 Spectrometer.
23

Results and discussion
Vibrational spectra of the bimetallic compounds TlPt(CN)4X
Vibrational spectra provide with important information about both the composition
and the structure of a compound. In this work we investigate the IR and Raman
vibrationl spectra of compounds TlPt(CN)4ClO4 and TlPt(CN)4NO3.
Tables with all measured frequencies are presented in the end of this section: Table
6 for TlPt(CN)4ClO4 and Table 7 for TlPt(CN)4NO3).
Determination of counter ions in the bimetallic TlPt(CN)4 X compounds
The bimetallic TlPt(CN)4 X compounds have been prepared by two different
routes, using aqueous solutions of either Tl(ClO4)3 or Tl(NO3)3. The total positive
charge, +5, of the two metal ions in the solid compound can not be compensated by
four cyanide ligands. We should therefore expect presence of one negatively
charged anion in the compound. We have employed vibrational spectroscopy to
identify bands of the ClO4- and NO3
- ions in the spectra of the compounds obtained
from the perchlorate and nitrate systems, respectively.
The characteristic vibration bands of ClO4- ion (Figure 16 and Table 3) and NO3
- ion
(Figure 17 and Table 4) were observed in the IR and Raman spectra of the solid
bimetallic compounds.
The vibrational spectra of the Pt-Tl compound incorporating a perchlorate ion
The IR spectra of the bimetallic compound obtained from the Tl(ClO4)3 solution
was compared with the IR spectra of sodium perchlorate, see Figure 16 and Table 3.
One can see that all the bands characteristic for the perchlorate ion appear in the IR
spectra of the bimetallic compound as well. This unambiguously points to presence
of the ClO4- group in the TlPt(CN)4X compound. These results are further supported
by the Raman spectra of the bimetallic compound. We can therefore conclude that
the perclorate ion is present in the bimetallic Pt-Tl compound formed from the
Tl(ClO4)3 solution. The composition of the compound should therefore be formulated
as TlPt(CN)4ClO4.
24

a.
636
1140
10851109
625
3
4
5
6
7
8
9
10
1500 1400 1300 1200 1100 1000 900 800 700 600 500 400
cm-1
b.
6351141
1108 1086625
-2
0
2
4
6
8
10
12
14
1500 1400 1300 1200 1100 1000 900 800 700 600 500 400
cm-1
Figure 16. The low frequency parts of the IR spectra of: (a) solid compound TlPt(CN)4X obtained from the Tl(ClO4)3 solution, (b) NaClO4.
Table 3. Vibrational frequencies (cm-1) from the IR spectra of the TlPt(CN)4X compound obtained from the Tl(ClO4)3 solution in comparison with NaClO4.
TlPt(CN)4X NaClO4
114011091085
636 625
114111081086
635 625
The vibrational spectra of the Pt-Tl compound incorporating nitrate ion
The IR spectra of the bimetallic compound obtained from the Tl(NO3)3 solution were
compared with the spectra of potassium nitrate, see Figure 17 and Table 4. One can
see that all the bands characteristic for the nitrate ion appear in the IR spectra of the
bimetallic compound. This unambiguously points to presence of the NO3- group in the
TlPt(CN)4X compound.
25

We can therefore conclude that nitrate ion is present in the bimetallic Pt-Tl compound
formed from the Tl(NO3)3 solution. The composition of the compound should
therefore be formulated as TlPt(CN)4NO3.
a.
1384
824
37
42
47
52
57
62
1500 1400 1300 1200 1100 1000 900 800 700 600 500
cm-1
b.
1384
823
47
49
51
53
55
57
59
61
1500 1400 1300 1200 1100 1000 900 800 700 600 500
cm-1
Figure 17. The low frequency parts of the IR spectra of: (a) solid compound TlPt(CN)4X obtained from the Tl(NO3)3 solution, (b) KNO3.
Table 4. Vibrational frequencies (cm-1) from the IR spectra of the TlPt(CN)4X compound obtained from the Tl(NO3)3 solution in comparison with KNO3.
TlPt(CN)4X KNO3
1384
824
1384
823
26

The high frequency vibrations of the coordinated cyanide ions
Vibrational bands detected in the cyanide stretching region of the IR (Figure
18) and Raman (Figure 19) spectra of both TlPt(CN)4ClO4 and TlPt(CN)4NO3
compounds are identical, see Table 5 . This points to the a similar structure of the
[TlPt(CN)4]+ unit of the compounds.
At least five bands can be easily recognised in the IR spectra of the
compounds (Figure 18), while the Raman spectra (Figure 19) exhibit at least four well
defined bands. One can easily see that the frequencies of the IR bands exactly
match the frequencies of the Raman bands (Table 6 and 7). Taking into account the
complementary nature of the IR and Raman spectra, this leads to an important
conclusion regarding the symmetry of the [TlPt(CN)4]+ unit of the compounds, namely
the lack of the centre of symmetry in the species.
The frequencies of the cyanide stretching vibrations of the platinum cyano
complexes are actually in good correlation with the oxidation state of the metal ion
[6]. One can see that the observed frequencies of the cyanide stretching vibration of
the Pt-Tl compounds are well above the corresponding frequency of the K2Pt(CN)4
compound of divalent platinum (Table 5). The higher frequencies of the cyanide
vibrations are consistent with the higher oxidation state of the platinum ion in the
TlPt(CN)4X compounds. This should be attributed to partial oxidation of platinum by
thallium. The shift of the bands to higher frequency is indicative of an interaction
between platinum and thallium ions in the bimetallic compounds.
Table 5. The IR and Raman frequencies of the cyanide stretching region of the TlPt(CN)4X and related cyanide compounds.
Compound IR Raman
TlPt(CN)4ClO4 220121742154
222321872175
TlPt(CN)4NO3 22222212220421722153
2220220421872175
K2Pt(CN)4 11 21342123
21682149
K2Pt(CN)6 12 2191 22162203
27

2154
2174
2201
2153
2172
2222 22122204
54
54.5
55
55.5
56
56.5
57
2300 2280 2260 2240 2220 2200 2180 2160 2140 2120 2100 2080 2060 2040 2020 2000
cm-1
Figure 18. IR spectra of the cyanide stretching region of the compounds TlPt(CN)4ClO4 (topp) and TlPt(CN)4NO3 (bottom).
2223
2187 2175
2220
2175
2187
2204
20000
30000
40000
50000
21002115213021452160217521902205222022352250226522802295
cm-1
Figure 19. Raman spectra of the cyanide stretching region of the compounds TlPt(CN)4ClO4 (top) and TlPt(CN)4NO3 (bottom).
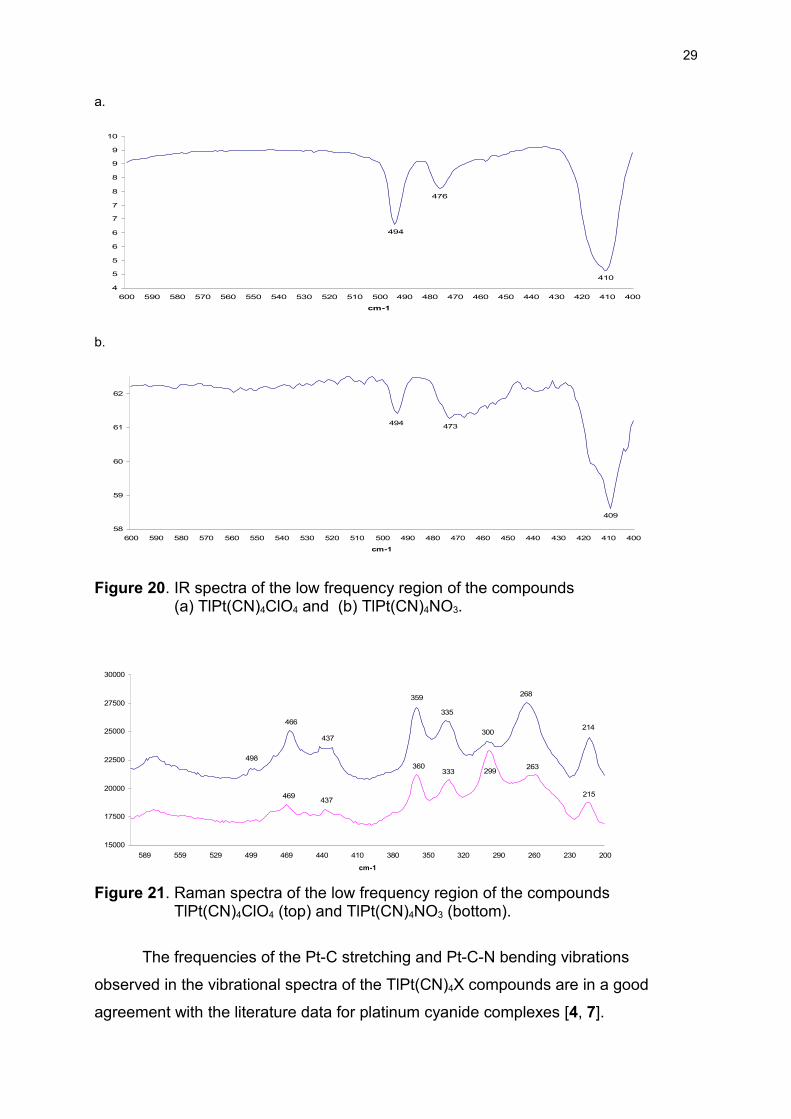
The low frequency vibrations of the TlPt(CN)4X compounds
Similarly to the vibrational bands in the CN-stretching region, the
TlPt(CN)4ClO4 and TlPt(CN)4NO3 compounds exhibit nearly identical frequencies in
the low frequency region of both their IR and Raman spectra (Figure 20 and 21)
indicating the same structure of the [TlPt(CN)4]+ unit of the compounds.
The bands appearing in the low frequency region of the vibrational spectra of
the TlPt(CN)4X compounds (Figure 20, 21) have been assigned to Pt-C stretching,
in- and out–of-plane bending vibrations of the Pt-C-N moiety, as well as to the Pt-Tl
stretching vibration, see Tables 6 and 7, in accordance with [4].
28
a.
410
476
494
4
5
5
6
6
7
7
8
8
9
9
10
600 590 580 570 560 550 540 530 520 510 500 490 480 470 460 450 440 430 420 410 400
cm-1
b.
409
473494
58
59
60
61
62
600 590 580 570 560 550 540 530 520 510 500 490 480 470 460 450 440 430 420 410 400
cm-1
Figure 20. IR spectra of the low frequency region of the compounds (a) TlPt(CN)4ClO4 and (b) TlPt(CN)4NO3.
466214
268
300
335
359
498
437
469 215
263299333360
437
15000
17500
20000
22500
25000
27500
30000
200230260290320350380410440469499529559589
cm-1
Figure 21. Raman spectra of the low frequency region of the compounds TlPt(CN)4ClO4 (top) and TlPt(CN)4NO3 (bottom).
The frequencies of the Pt-C stretching and Pt-C-N bending vibrations
observed in the vibrational spectra of the TlPt(CN)4X compounds are in a good
agreement with the literature data for platinum cyanide complexes [4, 7].
29
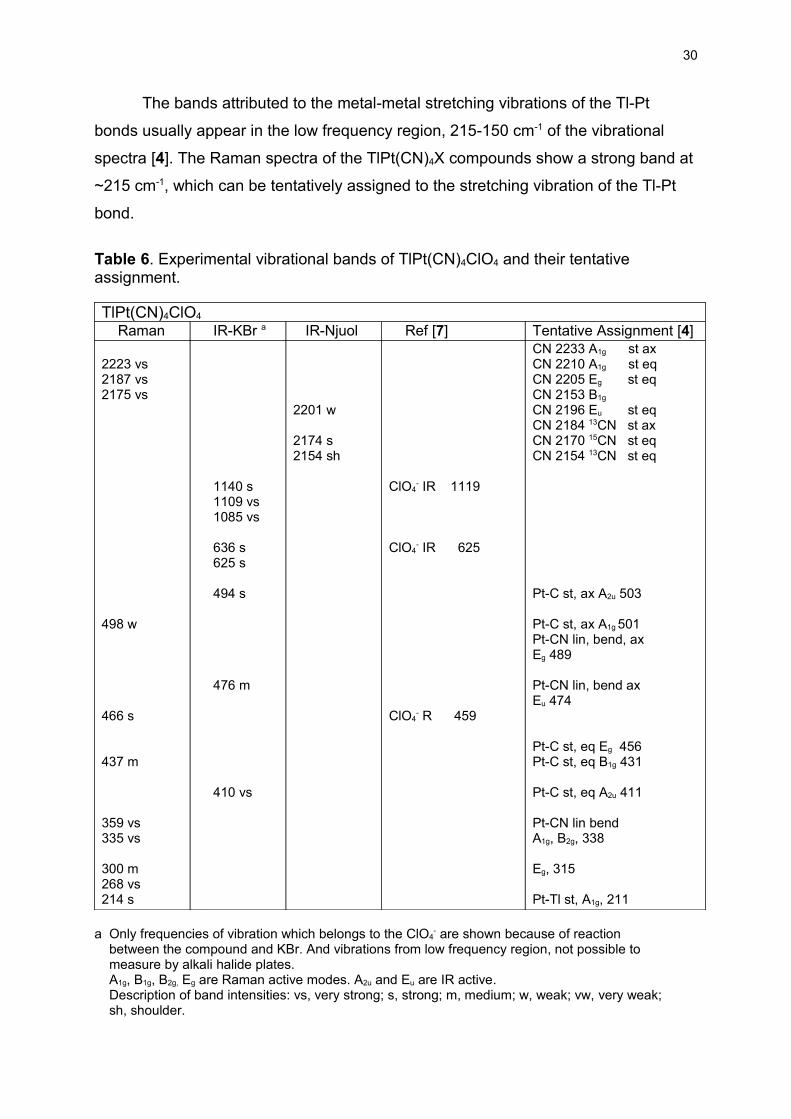
The bands attributed to the metal-metal stretching vibrations of the Tl-Pt
bonds usually appear in the low frequency region, 215-150 cm-1 of the vibrational
spectra [4]. The Raman spectra of the TlPt(CN)4X compounds show a strong band at
~215 cm-1, which can be tentatively assigned to the stretching vibration of the Tl-Pt
bond.
Table 6. Experimental vibrational bands of TlPt(CN)4ClO4 and their tentative assignment.
TlPt(CN)4ClO4
Raman IR-KBr a IR-Njuol Ref [7] Tentative Assignment [4]
2223 vs2187 vs 2175 vs
498 w
466 s
437 m
359 vs335 vs
300 m 268 vs 214 s
1140 s 1109 vs 1085 vs
636 s 625 s
494 s
476 m
410 vs
2201 w
2174 s2154 sh
ClO4- IR 1119
ClO4- IR 625
ClO4- R 459
CN 2233 A1g st axCN 2210 A1g st eqCN 2205 Eg st eqCN 2153 B1g
CN 2196 Eu st eqCN 2184 13CN st axCN 2170 15CN st eqCN 2154 13CN st eq
Pt-C st, ax A2u 503
Pt-C st, ax A1g 501Pt-CN lin, bend, axEg 489
Pt-CN lin, bend axEu 474
Pt-C st, eq Eg 456Pt-C st, eq B1g 431
Pt-C st, eq A2u 411
Pt-CN lin bendA1g, B2g, 338
Eg, 315
Pt-Tl st, A1g, 211
a Only frequencies of vibration which belongs to the ClO4- are shown because of reaction
between the compound and KBr. And vibrations from low frequency region, not possible to measure by alkali halide plates. A1g, B1g, B2g, Eg are Raman active modes. A2u and Eu are IR active. Description of band intensities: vs, very strong; s, strong; m, medium; w, weak; vw, very weak; sh, shoulder.
30

Description of tentative assignments: st, stretching; bend, bending; lin, linear; ax, axial; eq, equatorial. Table 7. Experimental vibrational bands of TlPt(CN)4NO3 and their tentative assignment.
TlPt(CN)4NO3
Raman IR-KBr a IR-Njuol Ref [7] Tentative Assignment [4]2220 vs2204 s 2187 vs 2175 vs
469 m
437 m
360 s
333 s
299 vs263 s215 s
1384 vs
824 vw
494 s
473 s
409 vs
2222 w 2212 w 2204 w 2172 vs 2153 s
NO3- IR 1370
NO3
- IR 828
CN 2233 A1g st axCN 2210 A1g st eqCN 2205 Eg st eqCN 2153 B1g
CN 2219 A2u st eqCN 2196 Eu st eqCN 2184 13CN st axCN 2170 15CN st eqCN 2154 13CN st eq
Pt-C st, ax, A2u, 503
Eg 476
Pt-C st, eq, B1g 431
Pt-C st ax A2u, 411
Pt-CN lin, bend eqA1g, B2g, 338
Eg, 315
Pt-Tl st, A1g, 211
a Only frequencies of vibration which belongs to the NO3- are shown because of reaction
between the compound and KBr. And vibrations from low frequency region, not possible to measure by alkali halide plates.
A1g, B1g, B2g, Eg are Raman active modes. A2u and Eu are IR active.
Description of band intensities: vs, very strong; s, strong; m, medium; w, weak; vw, very weak; sh, shoulder.
Description of tentative assignments: st, stretching; bend, bending; lin, linear; ax, axial; eq, equatorial.
31

X-ray powder diffraction of the compound TlPt(CN)4ClO4 and TlPt(CN)4NO3
The TlPt(CN)4X (X = ClO4 and NO3) compounds were characterized by X-ray
powder diffraction. Figure 22 shows the X-ray powder diffractogram of the compound
TlPt(CN)4ClO4 prepared at room temperature.
We could identify at least one impurity phase present in the powder from the
difractogram. The lines belonging to the impurity, indicated by arrow lines in the
diffractogram in Figure 22, have been identified and indexed (Table 8). The refined
parameters are consistent with an orthorhombic unit cell (a=11.330, b= 9.026 and
c=7.23 Å). The unit cell parameters are approximately the same as those belonging
to the family of isostructural cyanide compounds CsI2K[MIII(CN)6], MIII = Cr, Fe, and
Mn. Taking into account the composition of the solution used for the synthesis of the
compound, we assume that the impurity originates from the compound
TlI2K[PtIII(CN)6]. This compound can be considered of a minor by-product obtained
from the redox reaction between platinum(II) and thallium(III) complexes.
Figure 22. X-ray powder diffractiogram of the compound TlPt(CN)4ClO4. Arrows indicate the indexed lines attributed to the impurity phase.
Table 8. The indexed lines from the difractogram shown in Figure 22, attributed to the compound TlI2K[PtIII(CN)6].
2Theta Rel Intensity 2Theta Rel Intensity 19.8748 15.35 30.9532 17.43 24.5549 17.99 31.5883 14.35 25.5070 29.07 41.6551 11.12 26.5479 22.60 42.5999 10.74 28.3683 17.64
32

Figure 23 shows the X-ray powder diffractogram of the compound
TlPt(CN)4NO3 prepared at 70-80 °C. The compound was also prepared at 25 and 100
°C. Table 9 summarizes the recorded diffraction data for compounds TlPt(CN)4X.
Comparing Figures 22 and 23 shows that the diffractograms of the
TlPt(CN)4ClO4 and TlPt(CN)4NO3 compounds are nearly identical and the perchlorate
salt is only distinguished by the impurity lines of the TlI2K[PtIII(CN)6] compound. One
can therefore conclude that the TlPt(CN)4ClO4 and TlPt(CN)4NO3 compounds are
isostructural.
Figure 23. X-ray powder diffractiogram of the compound TlPt(CN)4NO3 synthesised at 70-80°C.
33

Table 9. Diffraction data for the TlPt(CN)4ClO4 and TlPt(CN)4NO3 compounds.
a The lines from the impurity compound TlI2K[PtIII(CN)6] are omitted.
Tl-Pt(CN)4ClO4 a Tl-Pt(CN)4NO3
Temp 25°C
2Theta Rel Int
16.5357 100.0017.7889 72.2219.3100 14.8519.8748 15.3521.1095 16.6621.6896 24.59
23.4930 26.2524.5549 17.9925.5070 29.0726.0584 17.6126.5479 22.6026.8061 21.62
28.3683 17.6430.9632 17.4331.5883 14.3533.3929 24.4735.7299 15.1536.0742 18.2337.3695 17.48
40.4387 15.4141.6551 11.1242.5999 10.47
51.0284 10.14
Temp 70-80°C
2Theta Rel Int
16.5284 100.0017.8214 96.24
21.6320 20.34
23.4615 21.41
25.2604 23.0926.4426 16.0726.8221 18.01
27.1639 21.14
33.3880 22.2135.6325 09.1936.0722 21.9237.5308 14.9438.3575 09.0740.4942 14.16
48.0725 05.8151.0334 07.10
Temp 25°C (b)
2Theta Rel Int
16.64 100.018.01 29.3
21.77 24.0
23.54 29.8
25.40 15.2
27.39 21.5
33.49 22.6
36.16 10.637.63 19.8
Temp 100°C (b)
2Theta Rel Int
16.74 100.017.99 35.7
22.26 31.323.65 35.7
25.74 21.3
27.64 24.6
33.61 28.9
36.22 11.937.63 24.0
34

Conclusions
1. The reaction between the [Pt(CN)4]2- ion the [Tl(H2O)6]3+ ion present in acidic
aqueous solutions of thallium(III) perchlorate and nitrate results in formation two
bimetallic compounds: TlPt(CN)4ClO4 and TlPt(CN)4NO3.
2. The composition of the compound obtained from the nitrate solution has been
determined by elemental analysis (N, C, H, Tl). Some deviations of the supposed
formula (TlPt(CN)4NO3) have been found, which has been attributed to presence of
impurity phases in the powder sample.
3. The counter ions (X) compensating the positive charge of a [TlPt(CN)4]+ unit in the
bimetallic TlPt(CN)4X compounds have been identified from their IR and Raman
spectra. The vibrational spectra of the powders obtained from the Tl(ClO4)3 and
Tl(NO3)3 solutions unambiguous show presence of the perchlorate and nitrate anions,
respectively, in the compounds.
4. The IR and Raman spectra of the TlPt(CN)4X (X = ClO4, NO3) compounds in the
most informative cyanide stretching region are identical, which points to a similar
structure of the [TlPt(CN)4]+ unit in the compounds. Furthermore, due to the same
vibration frequencies observed in the IR and Raman spectra of the compounds we
can conclude that the [TlPt(CN)4]+ unit lacks the center of symmetry. A strong band
observed at 215 cm-1 in the low frequency region of the Raman spectra of the
compounds has been assigned to a stretching vibration of the metal-metal bond
between the platinum and thallium ions.
5. X-ray powder diffraction studies of the bimetallic TlPt(CN)4X (X = ClO4, NO3)
compounds have shown that they are isostructural. A small amount of an impurity
phase has been found in the perchlorate compound. The diftactogram of the impurity
has been indexed and the compound has been identified as TlI2K[PtIII(CN)6].
35

Acknowledgements First of all I would like to thank especially my supervisor
Dr. Mikhail Maliarik for his contribution of knowledge and great help
to my diploma project.
I would like to thank Dr. Mikhail Gorlov, The Royal Institute of Technology (KTH),
for providing the opportunity to use their Raman spectrometer.
I would also like to thank Dr. Elena Murasheva, Moscow State University, for
performing X-ray experiments.
36

References
(1) F. A. Cotton, G. Wilkinson, Advanced Inorganic Chemistry, 5th ed, John Wiley
and Sons Inc., 1988
(2) Nagle, J. K.; Balch, A. L.; Olmstead, M. M. J. Am.Chem.Soc. 1988, 110, 319
(3) Maliarik, M.; Berg, K.; Glaser, J.; Sandström, M.; Tóth, I. Inorg. Chem. 1998, 37,
2910
(4) Jalilehvand, F.; Maliarik, M.; Sandström, M.; Mink, J.; Persson, I.; P., P.; Tóth, I.;
Glaser, J. Inorg. Chem. 2001, 41, 3889
(5) Duckett, S.; Gilbert, B. Foundations of Spectroscopy, Oxford Chemistry Primers,
Number 78, 2000
(6) Brisdon, A. K. Inorganic Spectroscopic Methods, Oxford Chemistry Primers,
Number 62, 1998
(7) K. Nakamoto, Infrared and Raman Spectra of Inorganic and coordination
compounds, Part B, 5th ed, John Wiley & Sons Inc., 1997
(8) L. Smart, E. Moore, Solid State Chemistry, 2nd ed, Nelson Thornes, 2001
(9) G. Wulfsberg, Inorganic Chemistry, University Science Books, 2000
(10)D. A. Skoog, F. J. Holler, T. A. Nieman, Principles of instrumental analysis, 5th
ed., Thomson Learning, Inc., 1998
(11)Kubas, G. J.; Jones, L. H. Inorg. Chem. 1974, 13, 2816.
Siebert, H,; Siebert, G., Z. Naturforschg. 1967, 22 b, 674.
37