Embed Size (px)
Citation preview
Institutional Presentation & Results
2011 (July)
1
2
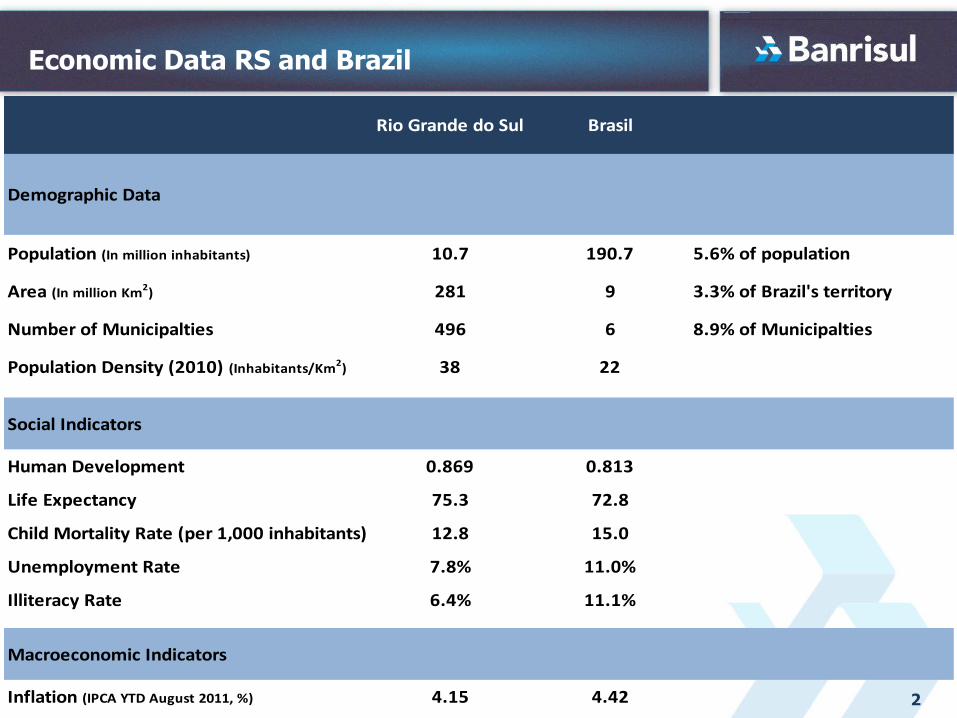
Economic Data RS and Brazil
Rio Grande do Sul Brasil
Population (In million inhabitants) 10.7 190.7 5.6% of population
Area (In million Km2) 281 9 3.3% of Brazil's territory
Number of Municipalties 496 6 8.9% of Municipalties
Population Density (2010) (Inhabitants/Km2) 38 22
Social Indicators
Human Development 0.869 0.813
Life Expectancy 75.3 72.8
Child Mortality Rate (per 1,000 inhabitants) 12.8 15.0
Unemployment Rate 7.8% 11.0%
Illiteracy Rate 6.4% 11.1%
Macroeconomic Indicators
Inflation (IPCA YTD August 2011, %) 4.15 4.42
Demographic Data
3
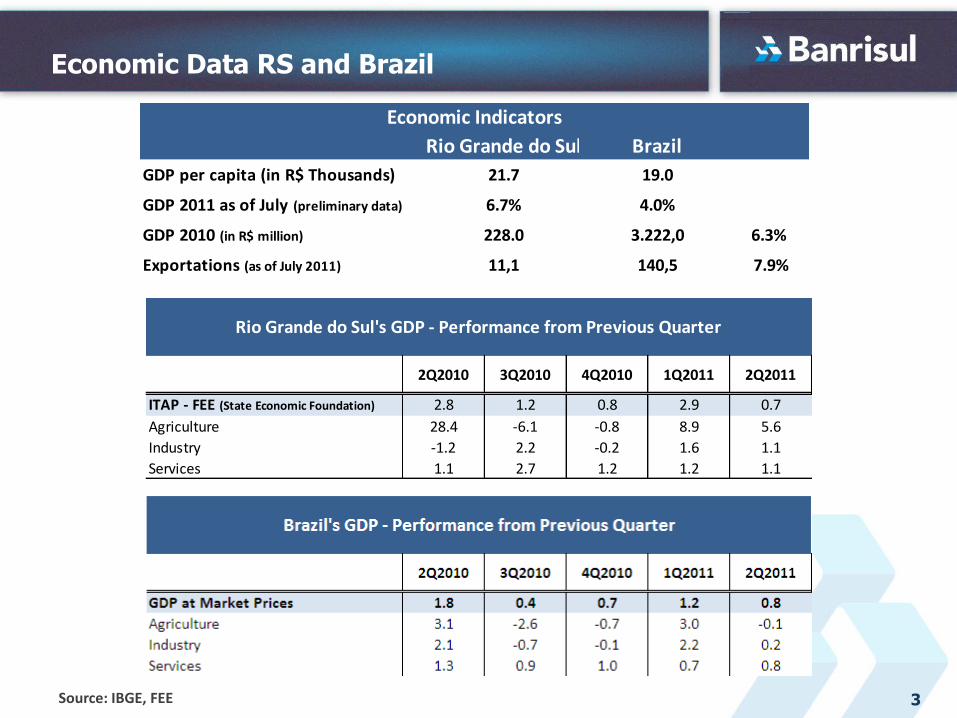
Economic Data RS and Brazil
Source: IBGE, FEE
Rio Grande do Sul Brazil
GDP per capita (in R$ Thousands) 21.7 19.0
GDP 2011 as of July (preliminary data) 6.7% 4.0%
GDP 2010 (in R$ million) 228.0 3.222,0 6.3%
Exportations (as of July 2011) 11,1 140,5 7.9%
Economic Indicators
2Q2010 3Q2010 4Q2010 1Q2011 2Q2011
ITAP - FEE (State Economic Foundation) 2.8 1.2 0.8 2.9 0.7
Agriculture 28.4 -6.1 -0.8 8.9 5.6
Industry -1.2 2.2 -0.2 1.6 1.1
Services 1.1 2.7 1.2 1.2 1.1
Rio Grande do Sul's GDP - Performance from Previous Quarter
4
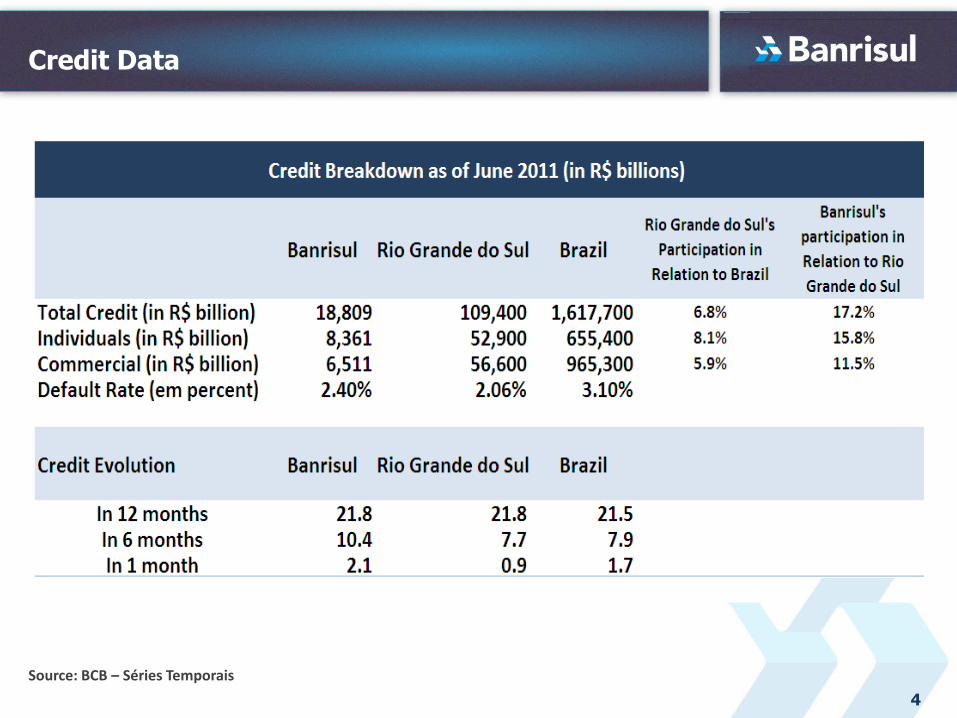
Credit Data
Source: BCB – Séries Temporais
5
Banrisul
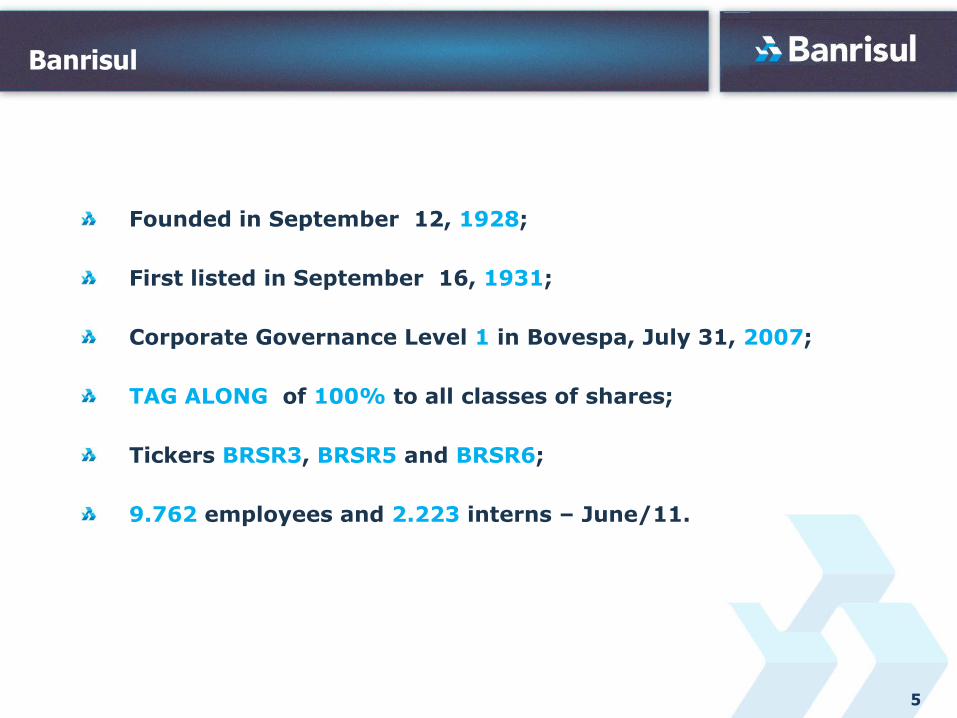
Founded in September 12, 1928;
First listed in September 16, 1931;
Corporate Governance Level 1 in Bovespa, July 31, 2007;
TAG ALONG of 100% to all classes of shares;
Tickers BRSR3, BRSR5 and BRSR6;
9.762 employees and 2.223 interns – June/11.
6
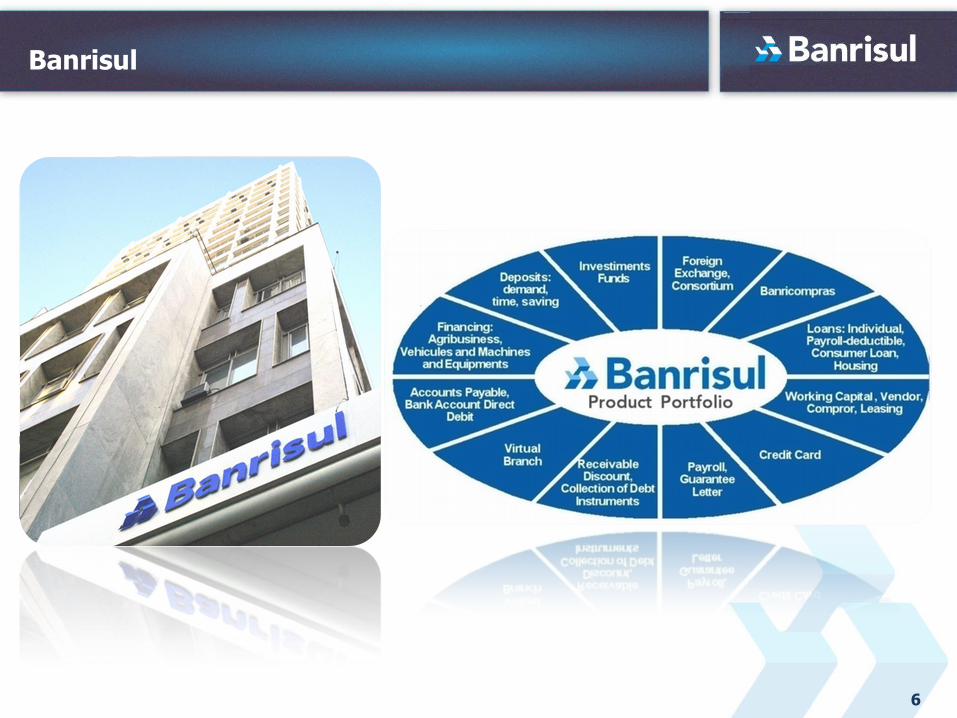
Banrisul
7
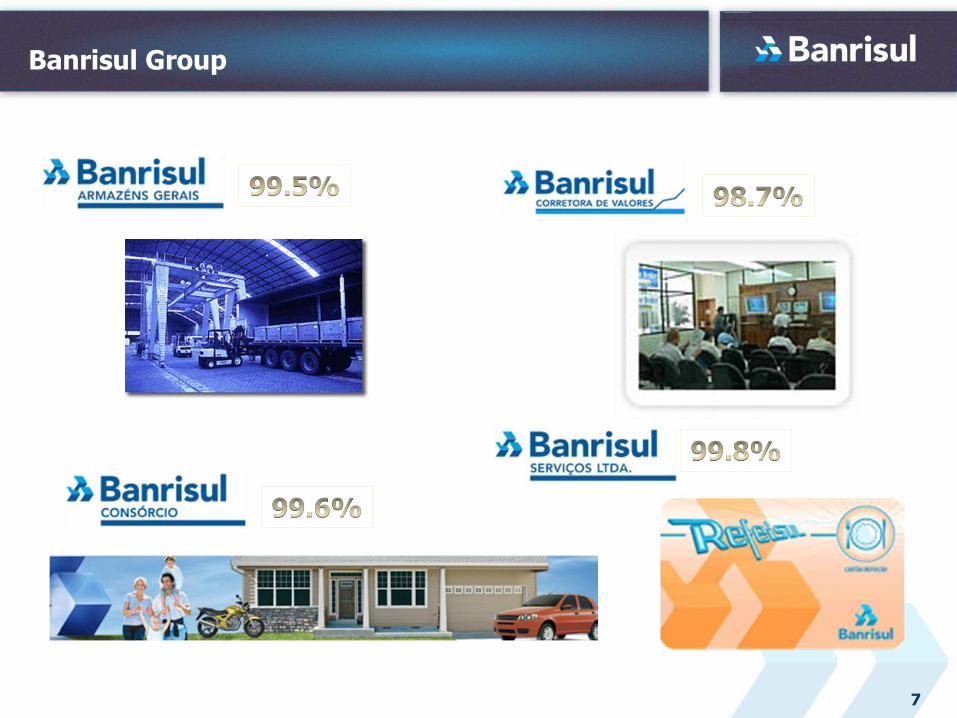
Banrisul Group
In R$ Million
8
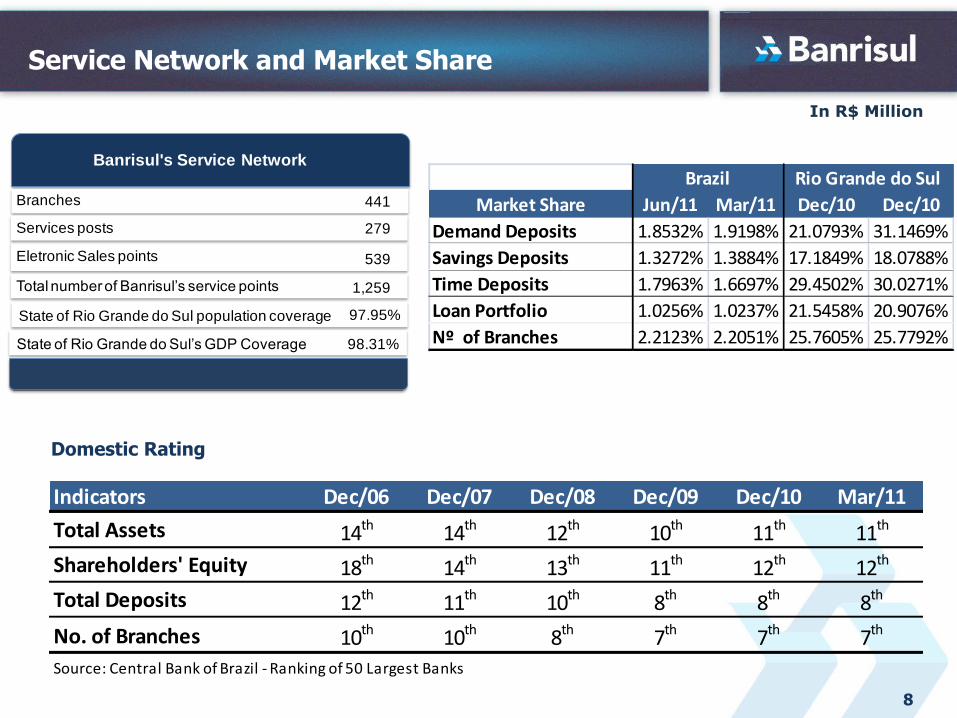
Service Network and Market Share
Domestic Rating
Banrisul's Service Network
Branches
Eletronic Sales points
441
539
Total number of Banrisul’s service points 1,259
Services posts 279
State of Rio Grande do Sul population coverage 97.95%
State of Rio Grande do Sul’s GDP Coverage 98.31%
Market Share Jun/11 Mar/11 Dec/10 Dec/10
Demand Deposits 1.8532% 1.9198% 21.0793% 31.1469%
Savings Deposits 1.3272% 1.3884% 17.1849% 18.0788%
Time Deposits 1.7963% 1.6697% 29.4502% 30.0271%
Loan Portfolio 1.0256% 1.0237% 21.5458% 20.9076%
Nº of Branches 2.2123% 2.2051% 25.7605% 25.7792%
Brazil Rio Grande do Sul
Indicators Dec/06 Dec/07 Dec/08 Dec/09 Dec/10 Mar/11
Total Assets 14th 14th 12th 10th 11th 11th
Shareholders' Equity 18th 14th 13th 11th 12th 12th
Total Deposits 12th 11th 10th 8th 8th 8th
No. of Branches 10th 10th 8th 7th 7th 7th
Source: Central Bank of Brazil - Ranking of 50 Largest Banks
9
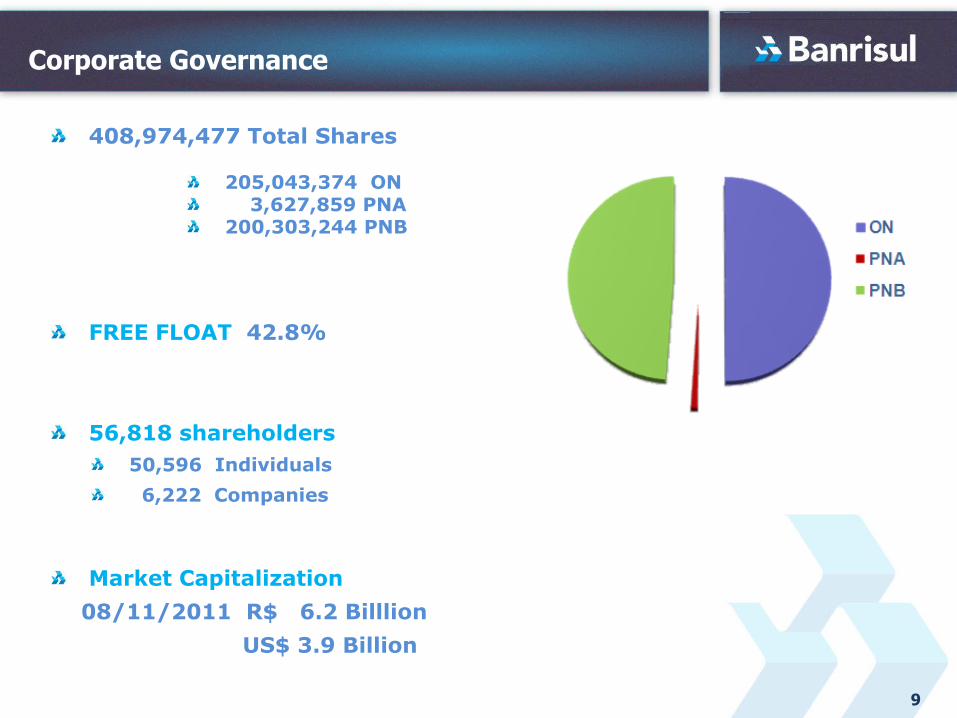
Corporate Governance
408,974,477 Total Shares
205,043,374 ON3,627,859 PNA
200,303,244 PNB
FREE FLOAT 42.8%
56,818 shareholders
50,596 Individuals
6,222 Companies
Market Capitalization
08/11/2011 R$ 6.2 Billlion
US$ 3.9 Billion
10
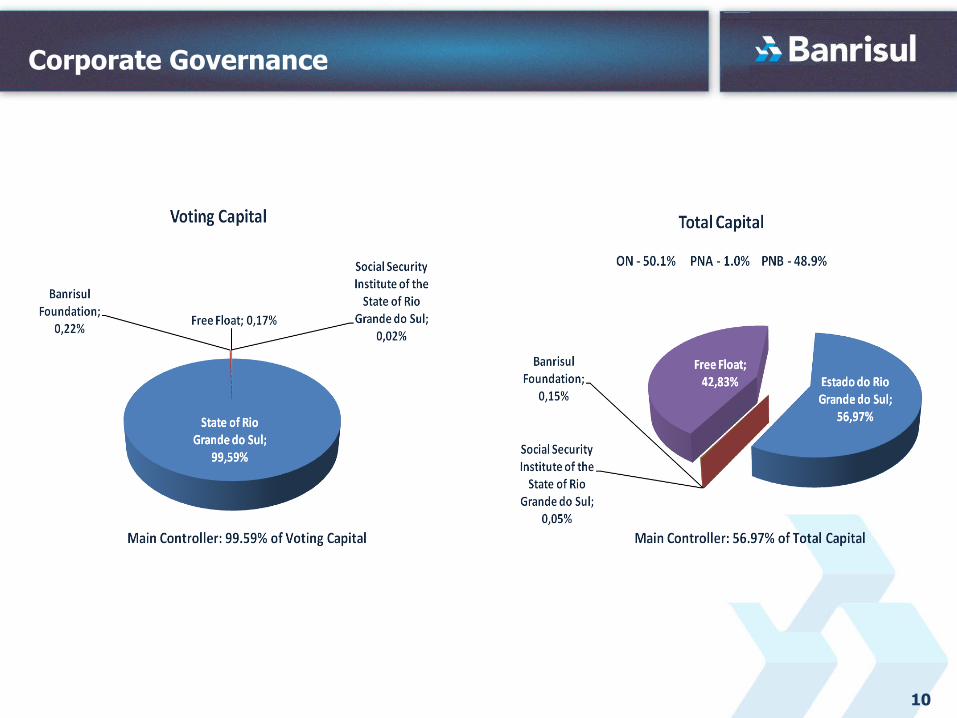
Corporate Governance
11
Corporate Governance8
5%
86
%
88
%
89
%
92
%
94
%
93
%
95
%
95
%
96
%
96
%
95
%
96
%
95
%
95
%
96
%
14% 13% 11% 9% 7% 6% 5% 5% 4% 3% 3% 4% 3% 4% 4% 3%
Ju
n/
10
Ju
l/1
0
Au
g/
10
Sep
/1
0
Oct/
10
No
v/
10
Dec/
10
Jan
/1
1
Feb
/1
1
Mar/
11
Ap
r/1
1
May/
11
Ju
n/
11
Ju
l/1
1
Au
g/
11
Sep
/1
1
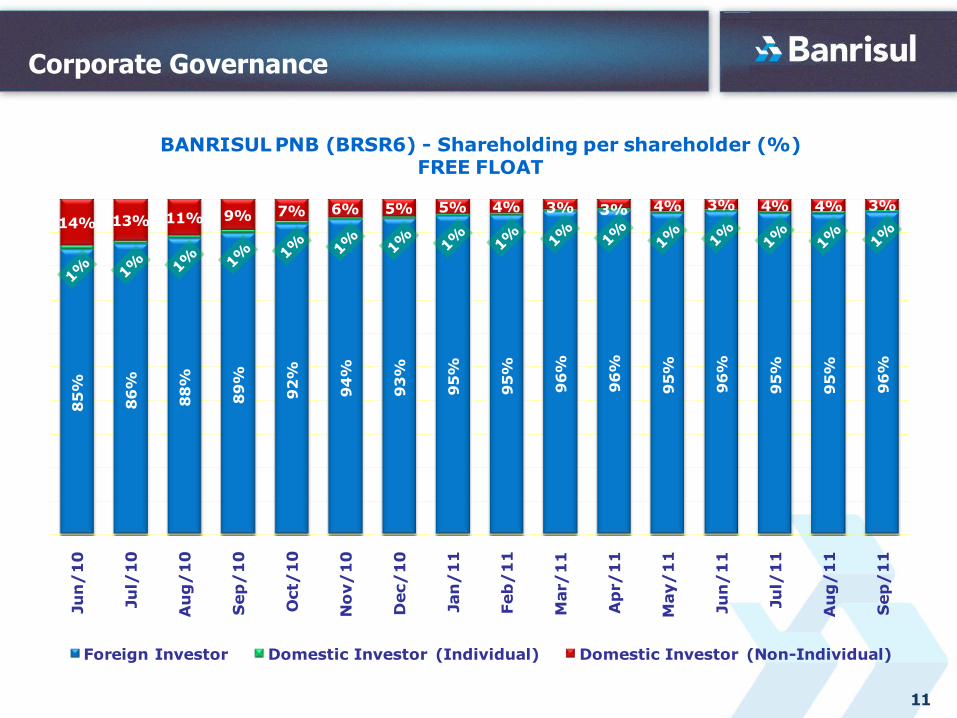
BANRISUL PNB (BRSR6) - Shareholding per shareholder (%) FREE FLOAT
Foreign Investor Domestic Investor (Individual) Domestic Investor (Non-Individual)
12
Corporate GovernanceJu
n-1
0
Ju
l-1
0
Au
g-1
0
Sep
-10
Oct-
10
No
v-1
0
Dec-1
0
Jan
-11
Feb
-11
Mar-
11
Ap
r-1
1
May-1
1
Ju
n-1
1
Ju
l-1
1
Au
g-1
1
Sep
-11
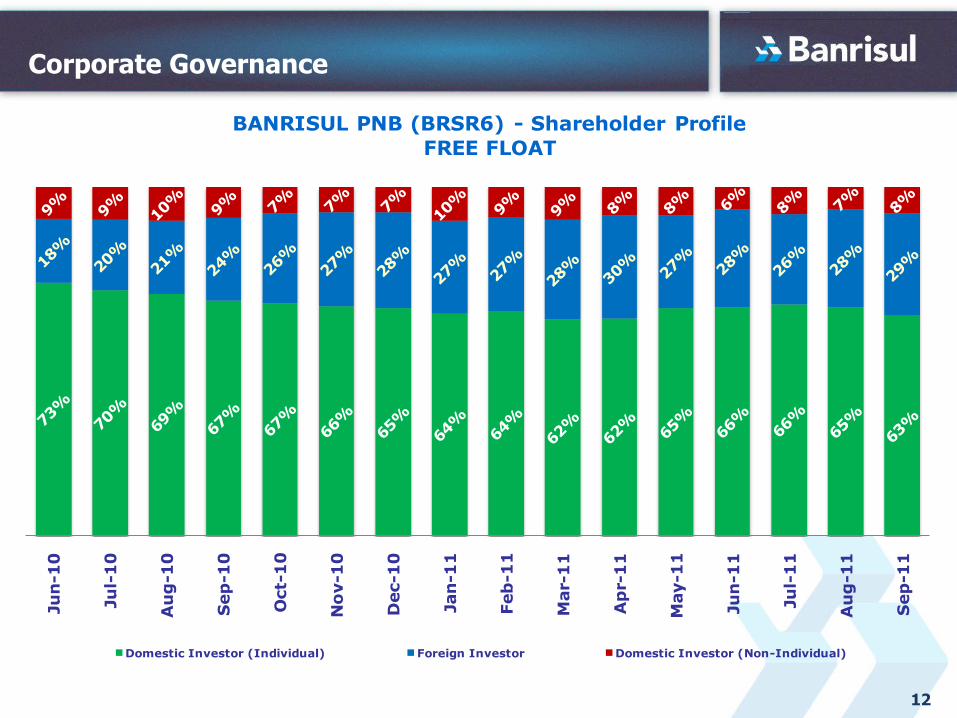
BANRISUL PNB (BRSR6) - Shareholder Profile
FREE FLOAT
Domestic Investor (Individual) Foreign Investor Domestic Investor (Non-Individual)
13
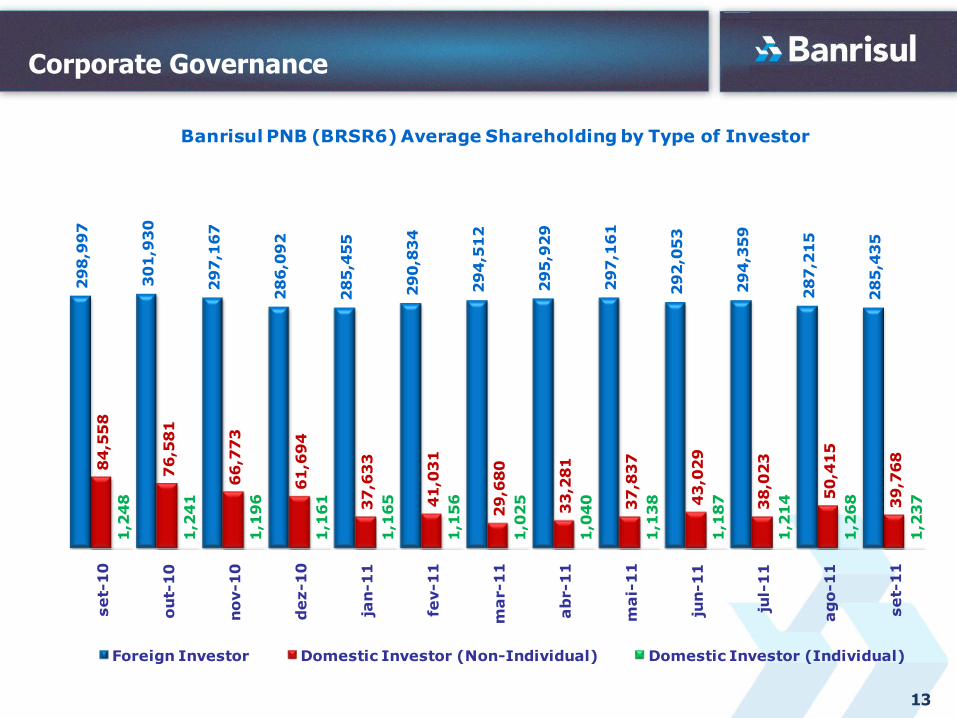
Corporate Governance2
98
,99
7
30
1,9
30
29
7,1
67
28
6,0
92
28
5,4
55
29
0,8
34
29
4,5
12
29
5,9
29
29
7,1
61
29
2,0
53
29
4,3
59
28
7,2
15
28
5,4
35
84
,55
8
76
,58
1
66
,77
3
61
,69
4
37
,63
3
41
,03
1
29
,68
0
33
,28
1
37
,83
7
43
,02
9
38
,02
3
50
,41
5
39
,76
8
1,2
48
1,2
41
1,1
96
1,1
61
1,1
65
1,1
56
1,0
25
1,0
40
1,1
38
1,1
87
1,2
14
1,2
68
1,2
37
se
t-1
0
ou
t-1
0
no
v-1
0
de
z-1
0
jan
-1
1
fev-1
1
ma
r-1
1
ab
r-1
1
ma
i-1
1
jun
-1
1
jul-
11
ag
o-1
1
se
t-1
1
Banrisul PNB (BRSR6) Average Shareholding by Type of Investor
Foreign Investor Domestic Investor (Non-Individual) Domestic Investor (Individual)
14
Capital Market
-40%
-30%
-20%
-10%
0%
10%
20%
30%
09-S
ep-1
0
23-S
ep-1
0
07-O
ct-1
0
21-O
ct-1
0
04-
No
v-1
0
18-
No
v-1
0
02-D
ec-1
0
16-D
ec-1
0
30-D
ec-1
0
13-J
an-1
1
27-J
an-1
1
10-
Feb-
11
24-
Feb-
11
10-
Ma
r-1
1
24-
Ma
r-1
1
07-A
pr-1
1
21-A
pr-1
1
05-M
ay-1
1
19-M
ay-1
1
02-J
un-1
1
16-J
un-1
1
30-J
un-1
1
14-J
ul-1
1
28-J
ul-1
1
11-
Au
g-1
1
25-
Au
g-1
1
08-S
ep-1
1
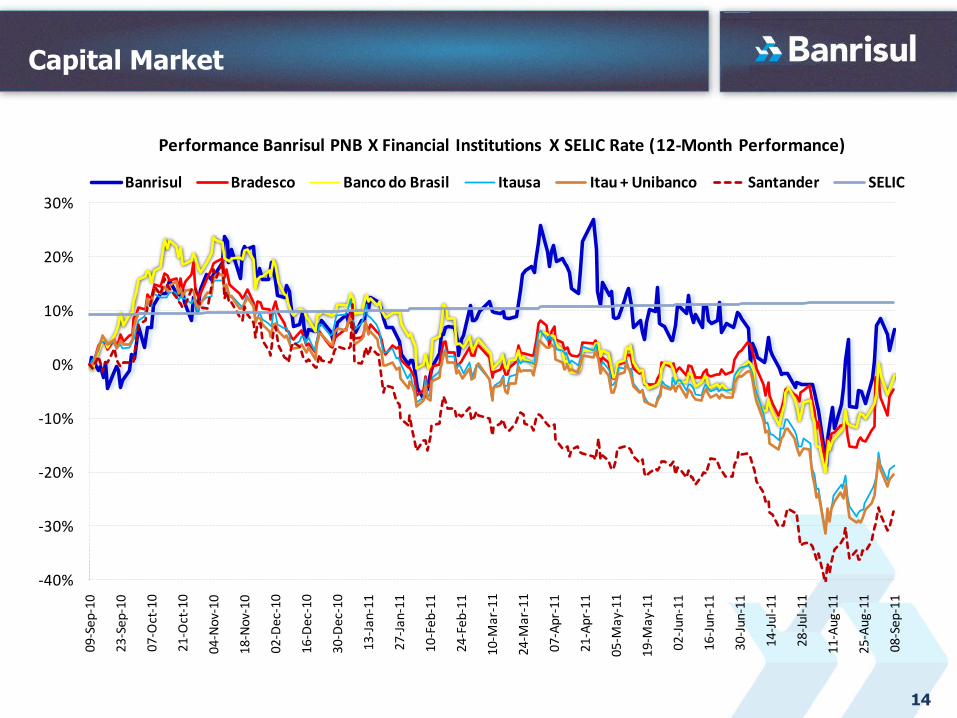
Performance Banrisul PNB X Financial Institutions X SELIC Rate (12-Month Performance)
Banrisul Bradesco Banco do Brasil Itausa Itau + Unibanco Santander SELIC
15
Capital Market
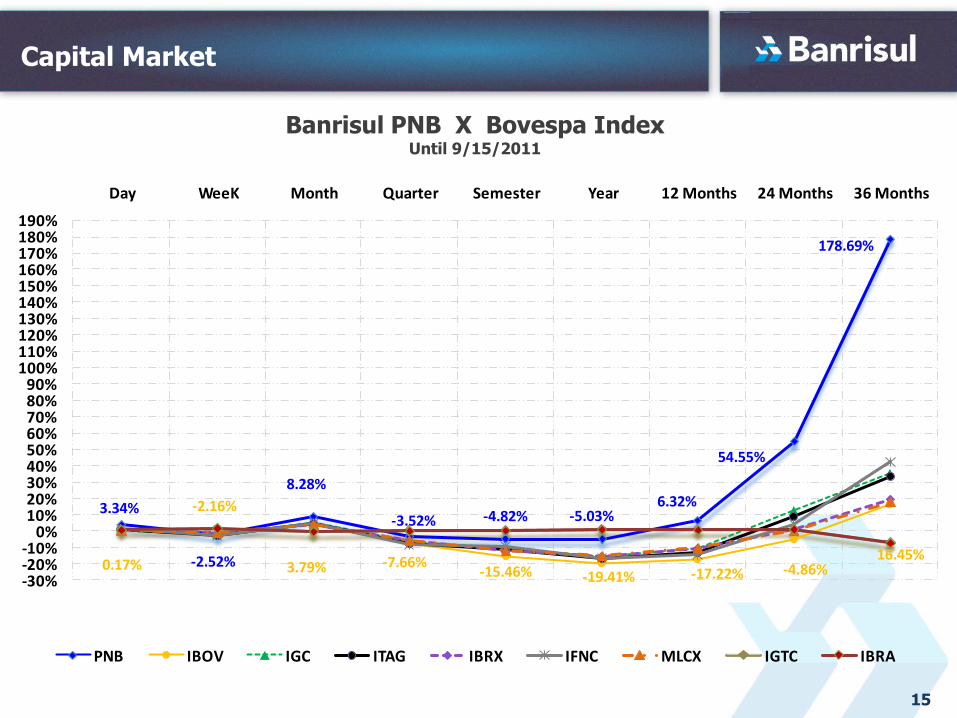
3.34%
-2.52%
8.28%
-3.52% -4.82% -5.03%6.32%
54.55%
178.69%
0.17%
-2.16%
3.79% -7.66%-15.46% -19.41% -17.22% -4.86%
16.45%
-30%-20%-10%
0%10%20%30%40%50%60%70%80%90%
100%110%120%130%140%150%160%170%180%190%
Day WeeK Month Quarter Semester Year 12 Months 24 Months 36 Months
PNB IBOV IGC ITAG IBRX IFNC MLCX IGTC IBRA
Banrisul PNB X Bovespa IndexUntil 9/15/2011
16
Rate of Growth
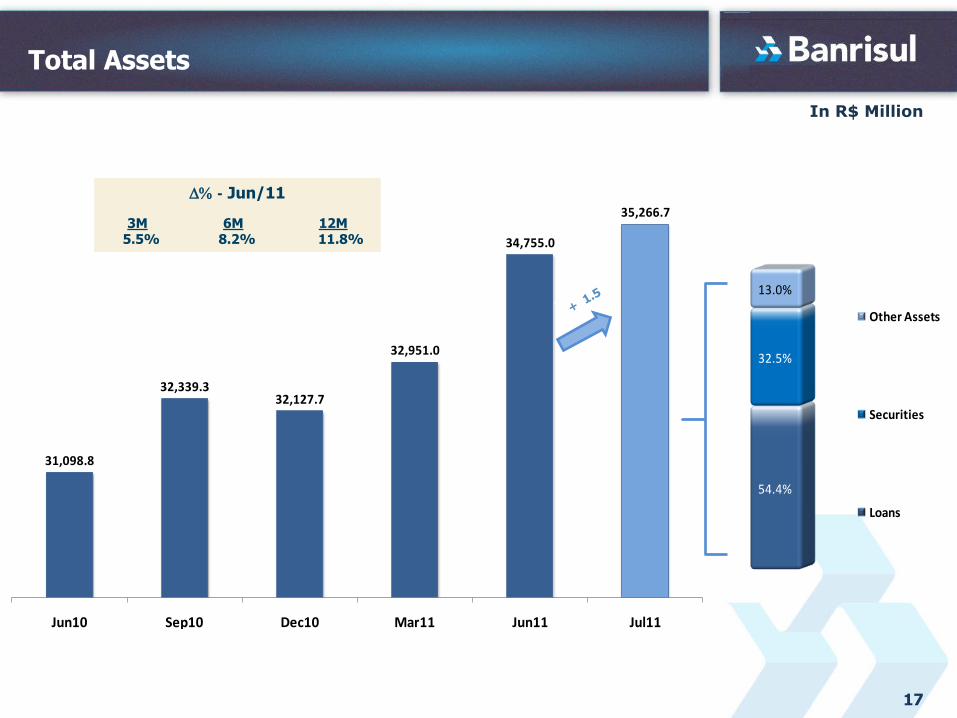
In R$ Million
54.4%
32.5%
13.0%
Other Assets
Securities
Loans
17
Total Assets
31,098.8
32,339.332,127.7
32,951.0
34,755.0
35,266.7
Jun10 Sep10 Dec10 Mar11 Jun11 Jul11
D% - Jun/11
3M 6M 12M5.5% 8.2% 11.8%
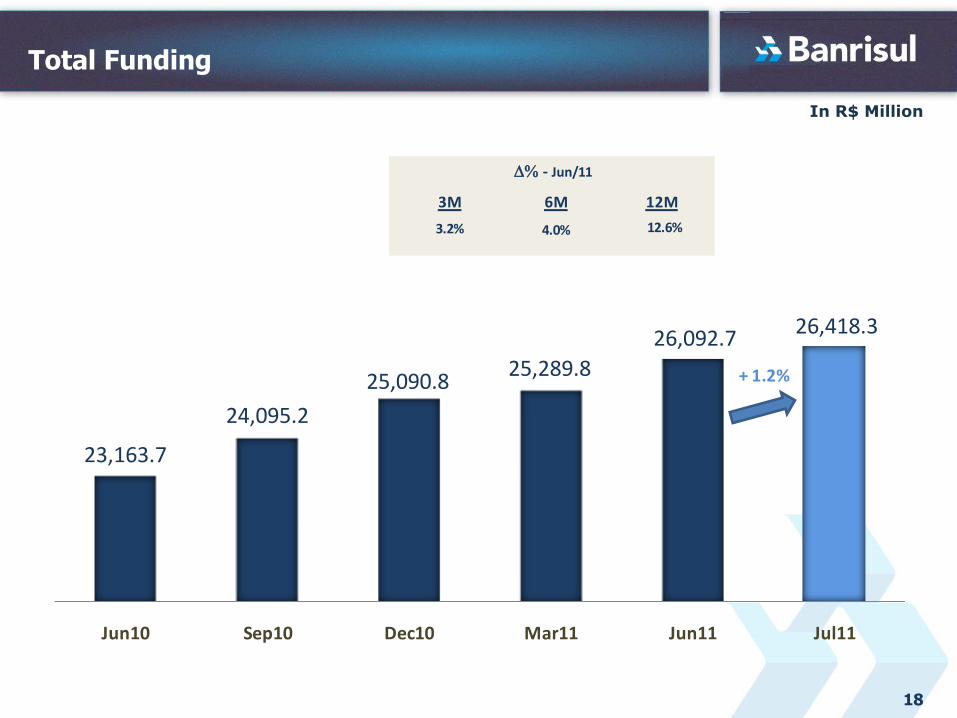
In R$ Million
18
Total Funding
23,163.7
24,095.2
25,090.825,289.8
26,092.7 26,418.3
Jun10 Sep10 Dec10 Mar11 Jun11 Jul11
+ 1.2%
3.2% 4.0% 12.6%
3M 6M 12M
D% - Jun/11
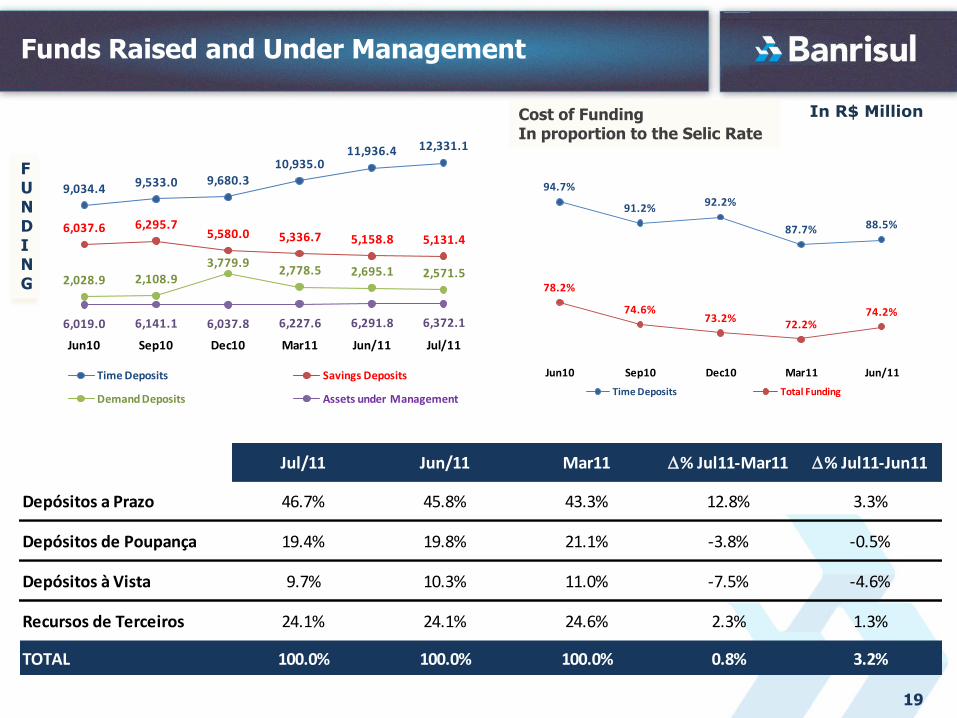
In R$ Million
9,034.4 9,533.0 9,680.3 10,935.0
11,936.4 12,331.1
6,037.6 6,295.7 5,580.0 5,336.7 5,158.8 5,131.4
2,028.9 2,108.9 3,779.9
2,778.5 2,695.1 2,571.5
6,019.0 6,141.1 6,037.8 6,227.6 6,291.8 6,372.1 0. 0
10, 000. 0
20, 000. 0
30, 000. 0
40, 000. 0
50, 000. 0
60, 000. 0
0. 0
2, 000. 0
4, 000. 0
6, 000. 0
8, 000. 0
10, 000. 0
12, 000. 0
14, 000. 0
Jun10 Sep10 Dec10 Mar11 Jun/11 Jul/11
Time Deposits Savings Deposits
Demand Deposits Assets under Management
19
Funds Raised and Under Management
FUNDING
Cost of FundingIn proportion to the Selic Rate
94.7%
91.2%92.2%
87.7% 88.5%
78.2%
74.6%73.2%
72.2%74.2%
70. 0%
75. 0%
80. 0%
85. 0%
90. 0%
95. 0%
100. 0%
Jun10 Sep10 Dec10 Mar11 Jun/11
Time Deposits Total Funding
Jul/11 Jun/11 Mar11 D% Jul11-Mar11 D% Jul11-Jun11
Depósitos a Prazo 46.7% 45.8% 43.3% 12.8% 3.3%
Depósitos de Poupança 19.4% 19.8% 21.1% -3.8% -0.5%
Depósitos à Vista 9.7% 10.3% 11.0% -7.5% -4.6%
Recursos de Terceiros 24.1% 24.1% 24.6% 2.3% 1.3%
TOTAL 100.0% 100.0% 100.0% 0.8% 3.2%
In R$ Million
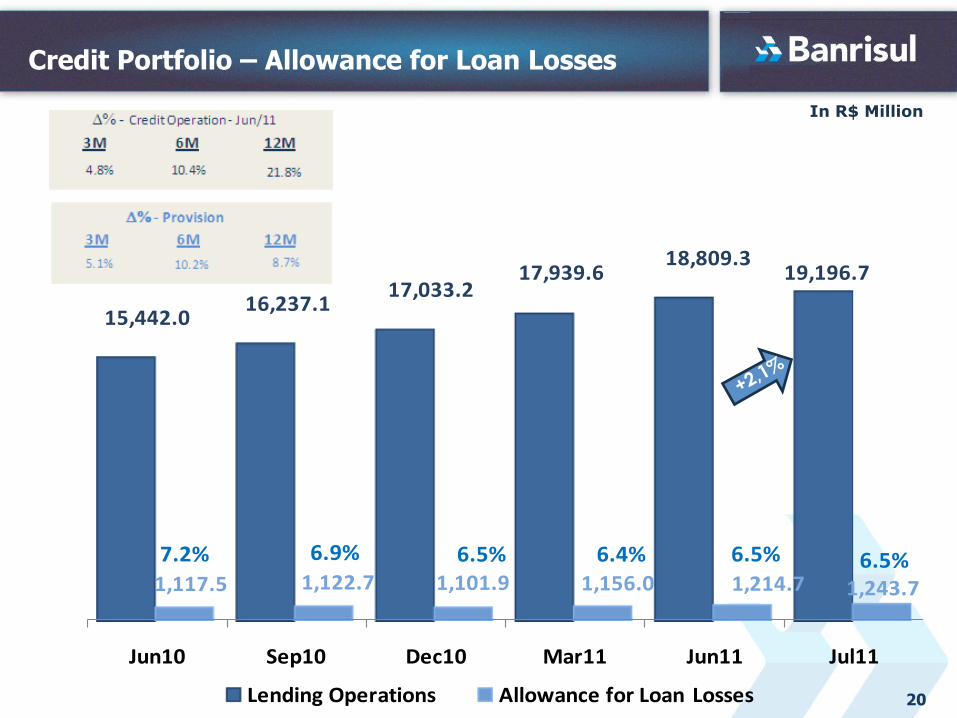
20
Credit Portfolio – Allowance for Loan Losses
15,442.016,237.1
17,033.217,939.6
18,809.3 19,196.7
1,117.5 1,122.7 1,101.9 1,156.0 1,214.7 1,243.7
Jun10 Sep10 Dec10 Mar11 Jun11 Jul11
Lending Operations Allowance for Loan Losses
7.2% 6.9% 6.5% 6.4% 6.5% 6.5%
In R$ Million
21
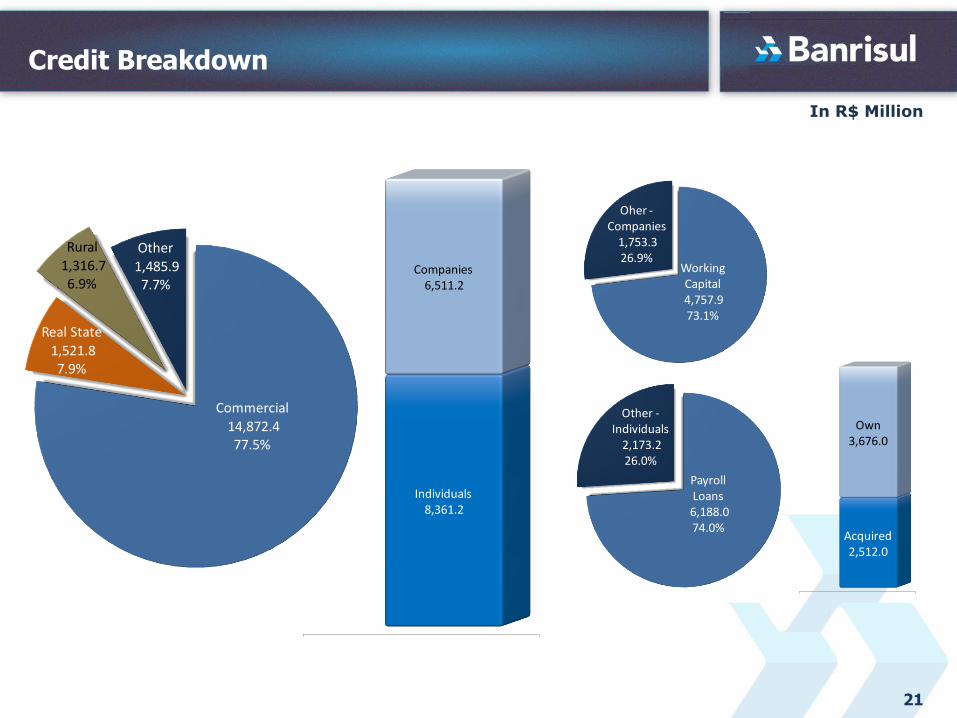
Credit Breakdown
Commercial
14,872.4 77.5%
Real State
1,521.8 7.9%
Rural1,316.7 6.9%
Other1,485.9 7.7%
Individuals8,361.2
Companies6,511.2
Working Capital4,757.9 73.1%
Oher -Companies
1,753.3 26.9%
Payroll Loans6,188.0 74.0%
Other -Individuals
2,173.2 26.0%
Acquired2,512.0
Own3,676.0
In R$ Million
22
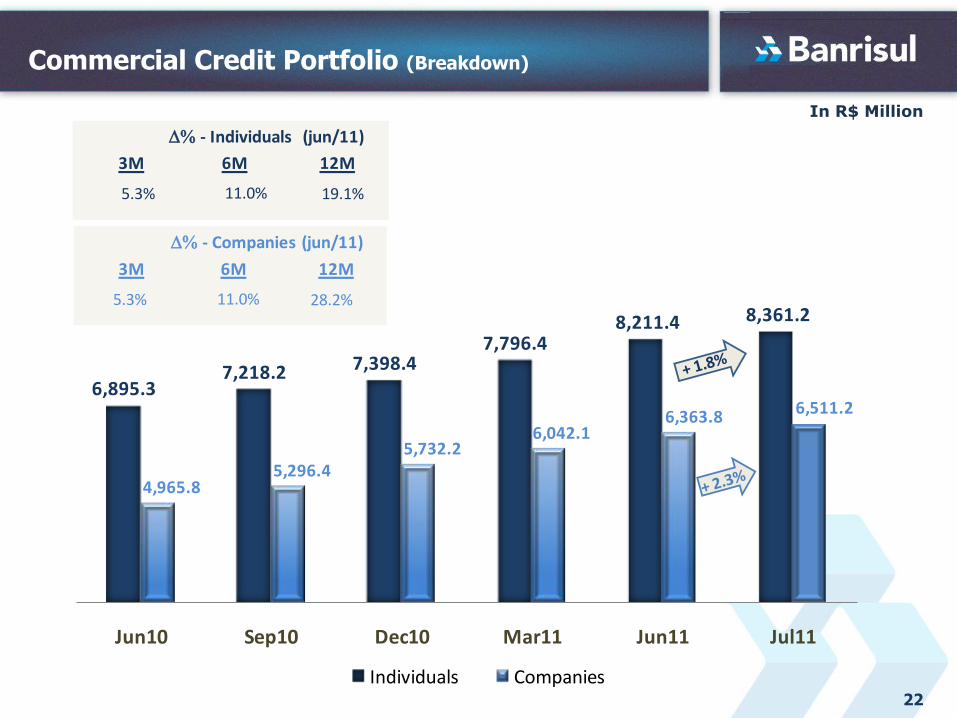
Commercial Credit Portfolio (Breakdown)
6,895.37,218.2 7,398.4
7,796.48,211.4 8,361.2
4,965.85,296.4
5,732.26,042.1
6,363.8 6,511.2
Jun10 Sep10 Dec10 Mar11 Jun11 Jul11
Individuals Companies
5.3% 11.0% 19.1%
3M 6M 12M
D% - Individuals (jun/11)
5.3% 11.0% 28.2%
3M 6M 12M
D% - Companies (jun/11)
23
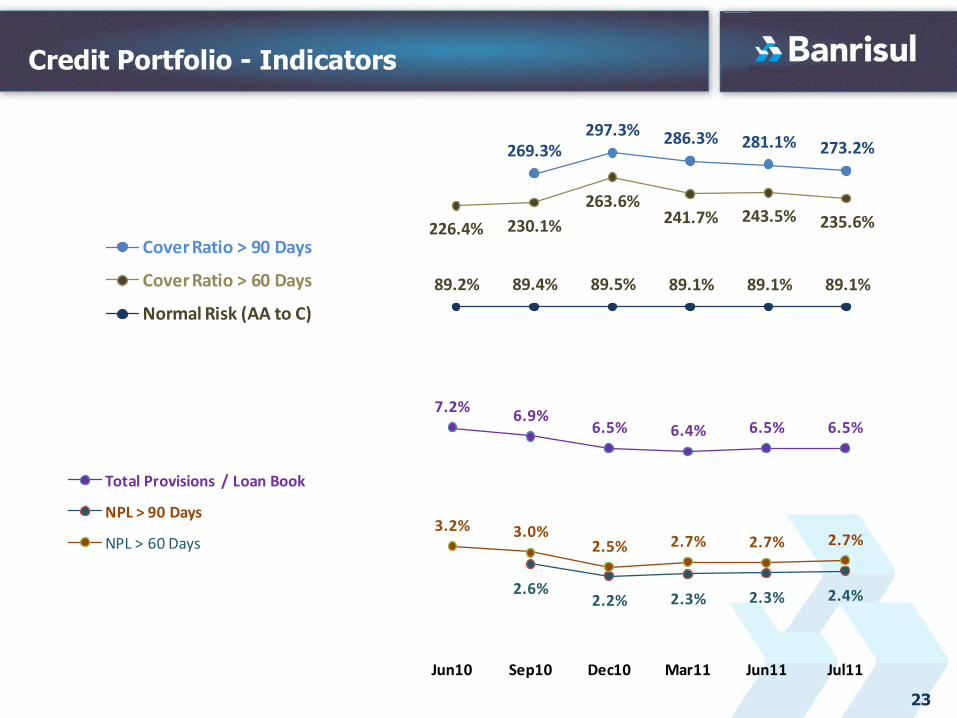
Credit Portfolio - Indicators
269.3%297.3% 286.3% 281.1% 273.2%
226.4% 230.1%
263.6%241.7% 243.5% 235.6%
89.2% 89.4% 89.5% 89.1% 89.1% 89.1%
Cover Ratio > 90 Days
Cover Ratio > 60 Days
Normal Risk (AA to C)
7.2%6.9%
6.5% 6.4% 6.5% 6.5%
2.6%2.2% 2.3% 2.3% 2.4%
3.2% 3.0%2.5% 2.7% 2.7% 2.7%
Jun10 Sep10 Dec10 Mar11 Jun11 Jul11
Total Provisions / Loan Book
NPL > 90 Days
NPL > 60 Days
In R$ Million
24
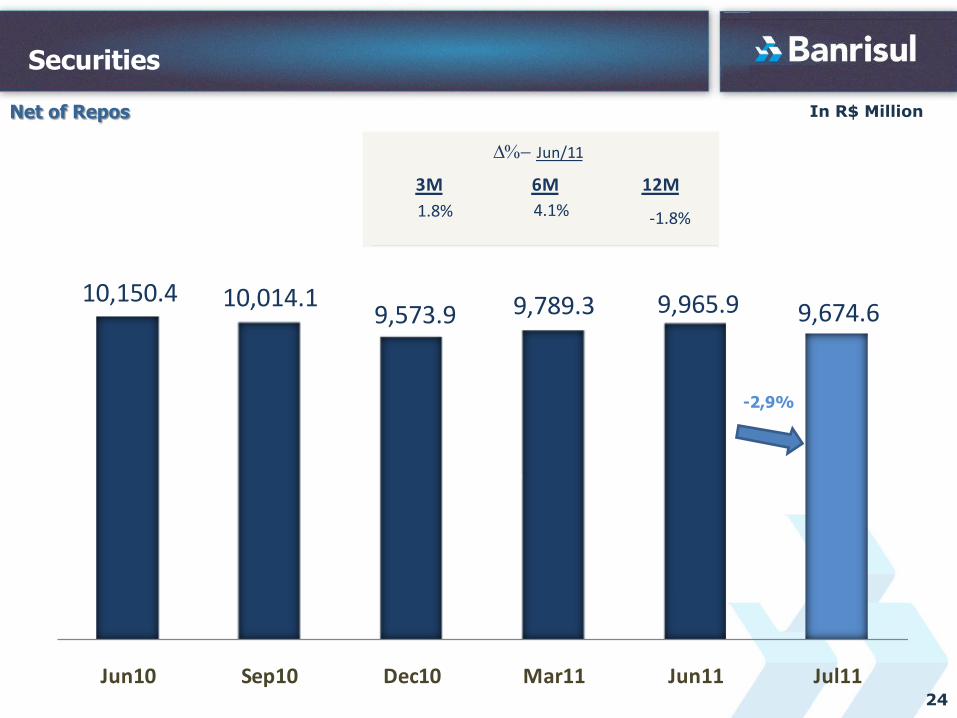
Securities
Net of Repos
10,150.4 10,014.19,573.9 9,789.3 9,965.9 9,674.6
Jun10 Sep10 Dec10 Mar11 Jun11 Jul11
1.8% 4.1% -1.8%
3M 6M 12M
D%- Jun/11
-2,9%
In R$ Million
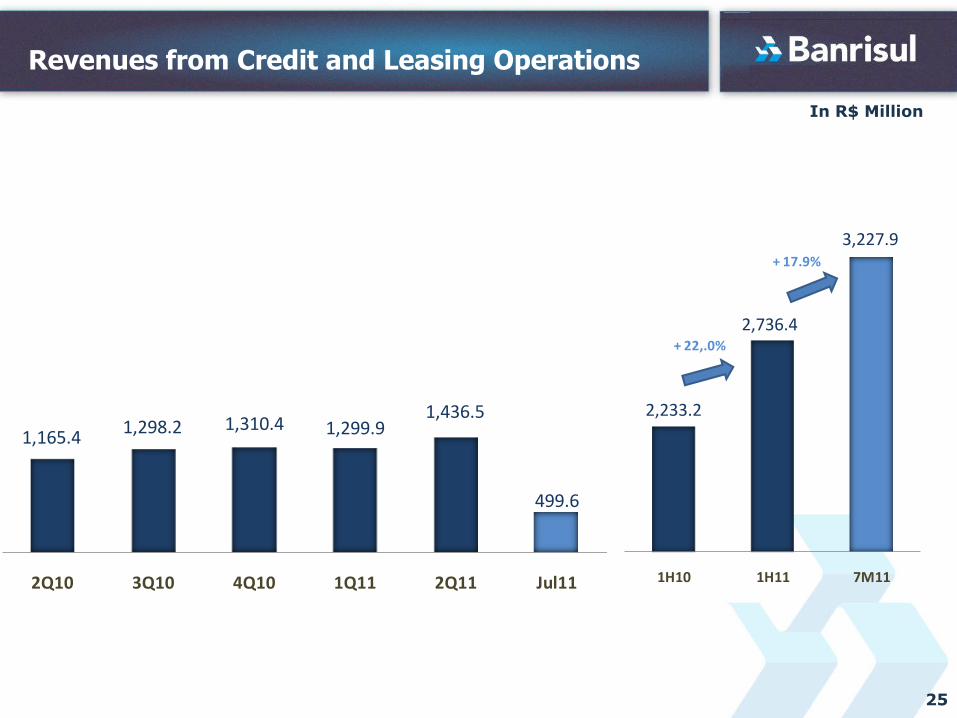
25
Revenues from Credit and Leasing Operations
1,165.41,298.2 1,310.4 1,299.9
1,436.5
499.6
2Q10 3Q10 4Q10 1Q11 2Q11 Jul11
2,233.2
2,736.4
3,227.9
1H10 1H11 7M11
+ 22,.0%
+ 17.9%
In R$ Million
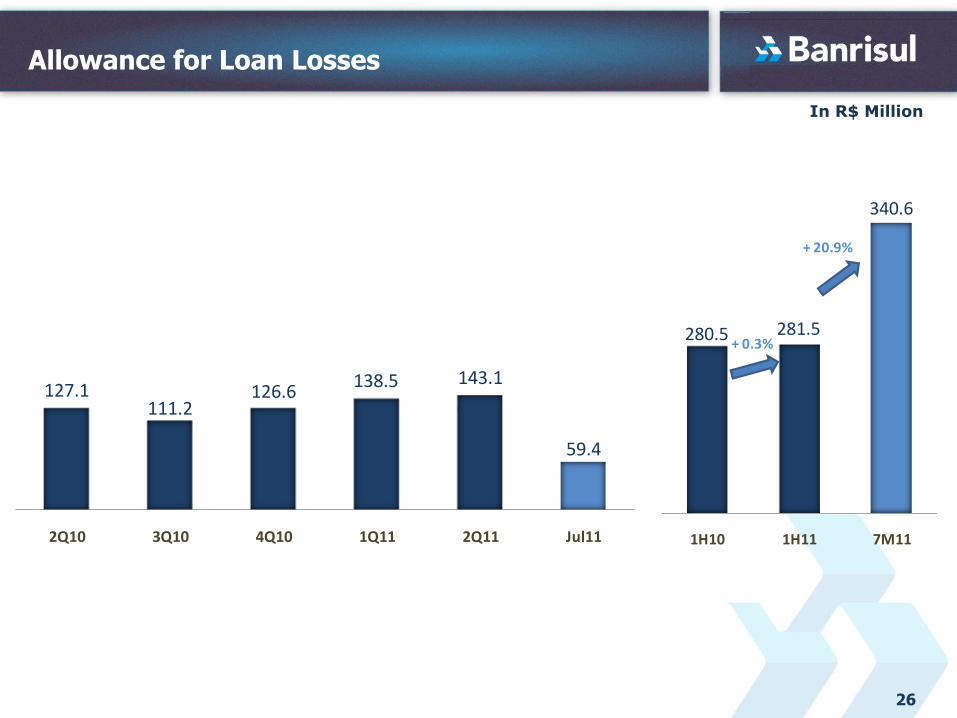
26
Allowance for Loan Losses
127.1111.2
126.6138.5 143.1
59.4
2Q10 3Q10 4Q10 1Q11 2Q11 Jul11
280.5 281.5
340.6
1H10 1H11 7M11
+ 0.3%
+ 20.9%
In R$ Million
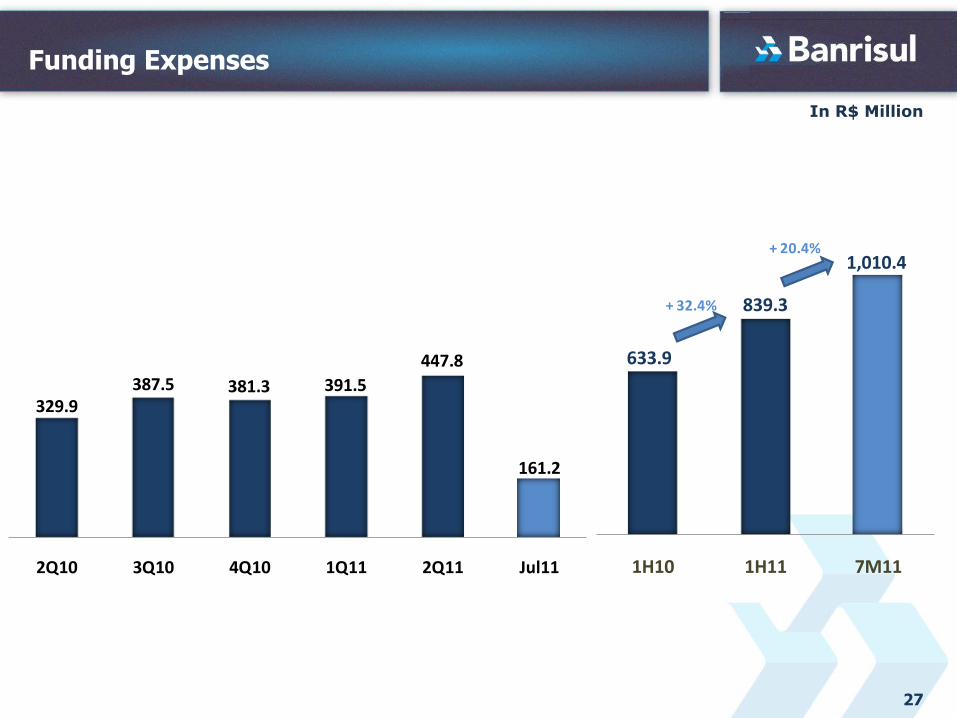
27
Funding Expenses
329.9387.5 381.3 391.5
447.8
161.2
2Q10 3Q10 4Q10 1Q11 2Q11 Jul11
633.9
839.3
1,010.4
1H10 1H11 7M11
+ 20.4%
+ 32.4%
In R$ Million
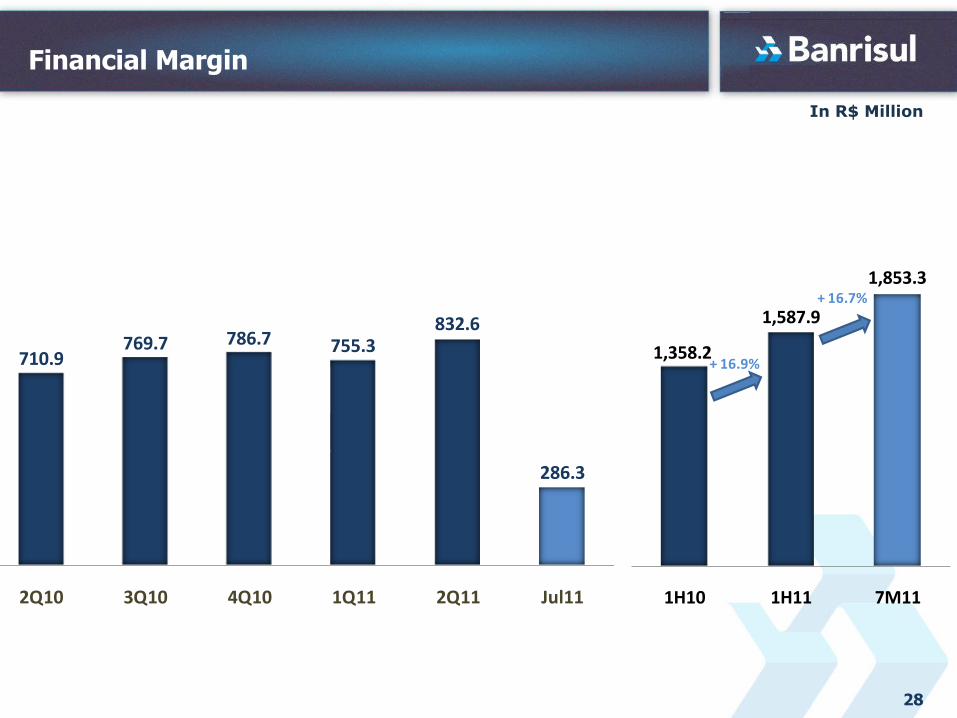
28
Financial Margin
710.9769.7 786.7 755.3
832.6
286.3
2Q10 3Q10 4Q10 1Q11 2Q11 Jul11
1,358.2
1,587.9
1,853.3
1H10 1H11 7M11
+ 16.7%
+ 16.9%
In R$ Million
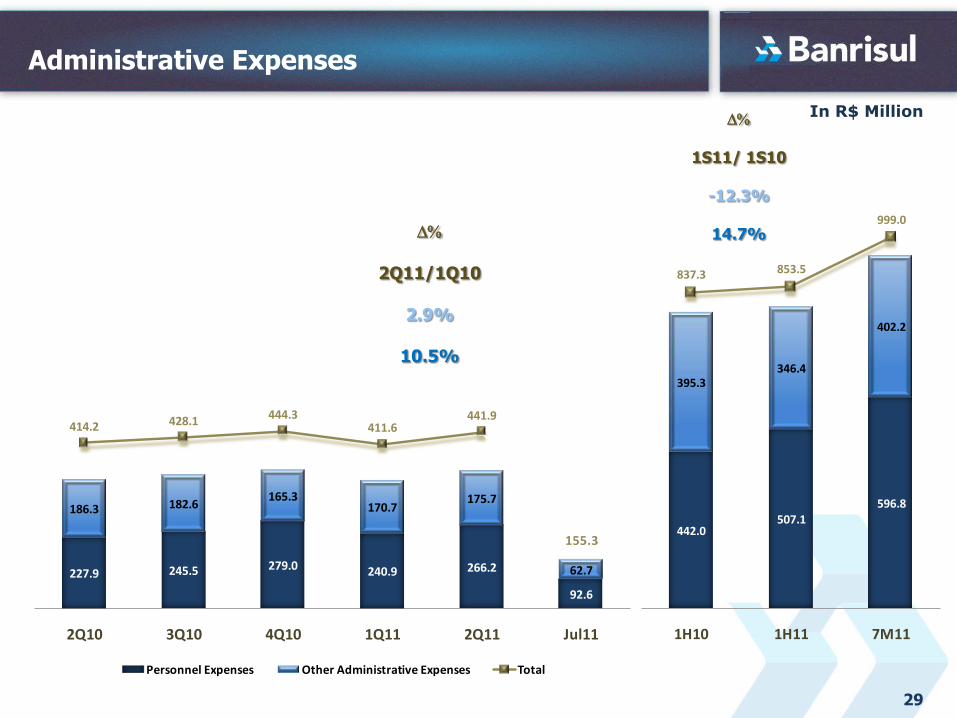
29
Administrative Expenses
D%
2Q11/1Q10
2.9%
10.5%
D%
1S11/ 1S10
-12.3%
14.7%
227.9 245.5 279.0 240.9 266.2
92.6
186.3 182.6165.3
170.7175.7
62.7
414.2 428.1 444.3411.6
441.9
155.3
2Q10 3Q10 4Q10 1Q11 2Q11 Jul11
Personnel Expenses Other Administrative Expenses Total
442.0507.1
596.8
395.3346.4
402.2
837.3 853.5
999.0
1H10 1H11 7M11
In R$ Million
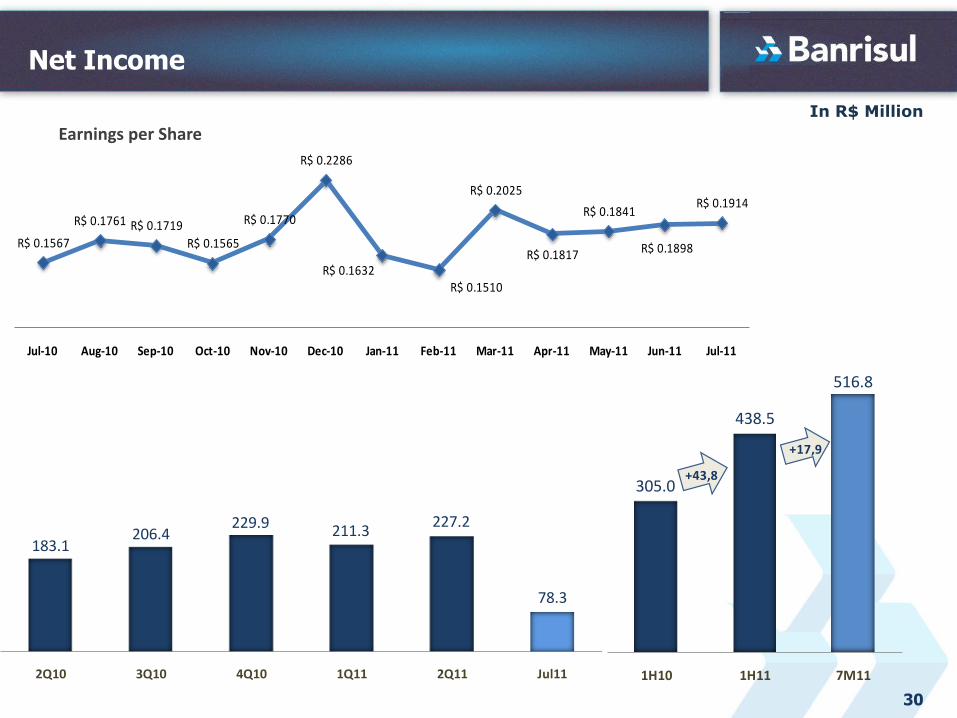
R$ 0.1567
R$ 0.1761 R$ 0.1719
R$ 0.1565
R$ 0.1770
R$ 0.2286
R$ 0.1632 R$ 0.1510
R$ 0.2025
R$ 0.1817
R$ 0.1841
R$ 0.1898
R$ 0.1914
Jul-10 Aug-10 Sep-10 Oct-10 Nov-10 Dec-10 Jan-11 Feb-11 Mar-11 Apr-11 May-11 Jun-11 Jul-11
30
Net Income
Earnings per Share
183.1206.4
229.9 211.3227.2
78.3
2Q10 3Q10 4Q10 1Q11 2Q11 Jul11
305.0
438.5
516.8
1H10 1H11 7M11
+43,8
+17,9
In R$ Million
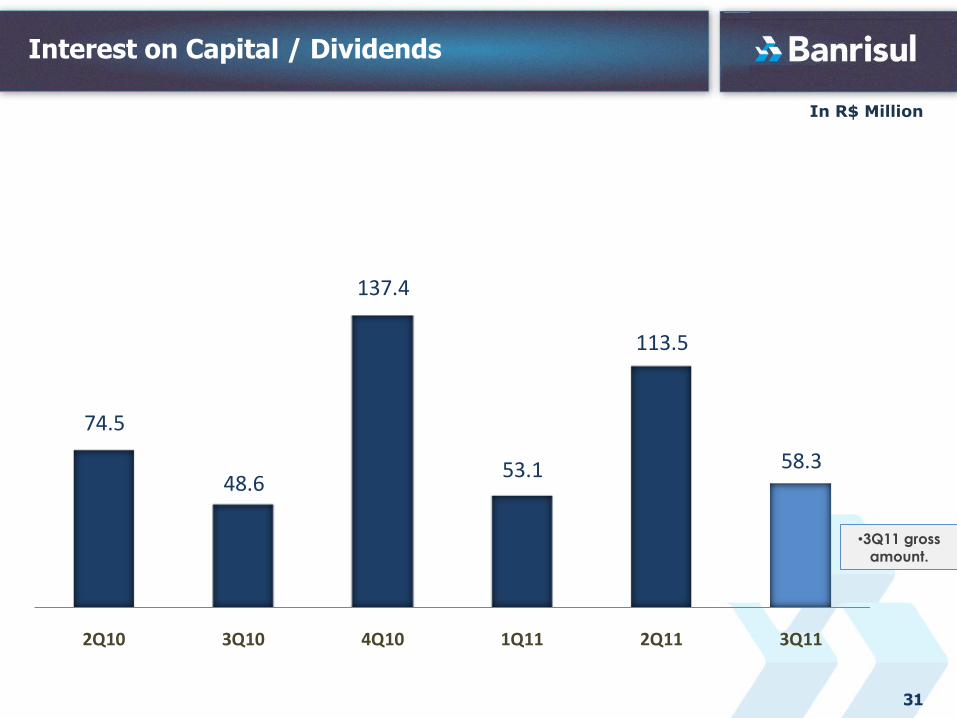
31
Interest on Capital / Dividends
•3Q11 gross
amount.
74.5
48.6
137.4
53.1
113.5
58.3
2Q10 3Q10 4Q10 1Q11 2Q11 3Q11
In R$ Million
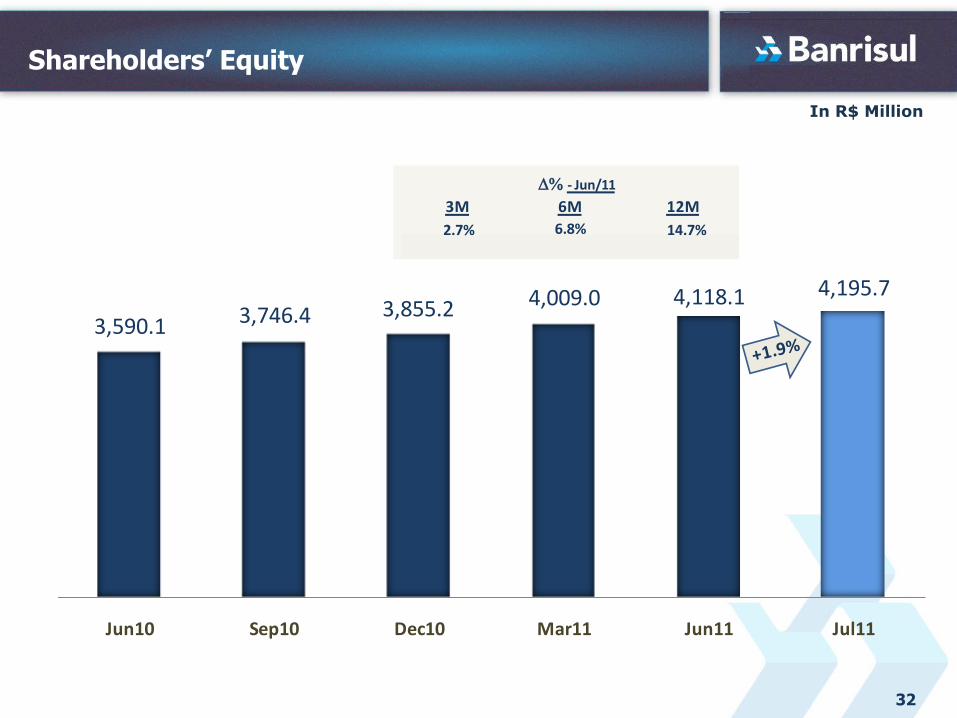
32
Shareholders’ Equity
3,590.1 3,746.4 3,855.2 4,009.0 4,118.1 4,195.7
Jun10 Sep10 Dec10 Mar11 Jun11 Jul11
2.7% 6.8% 14.7%
3M 6M 12M
D% - Jun/11
33
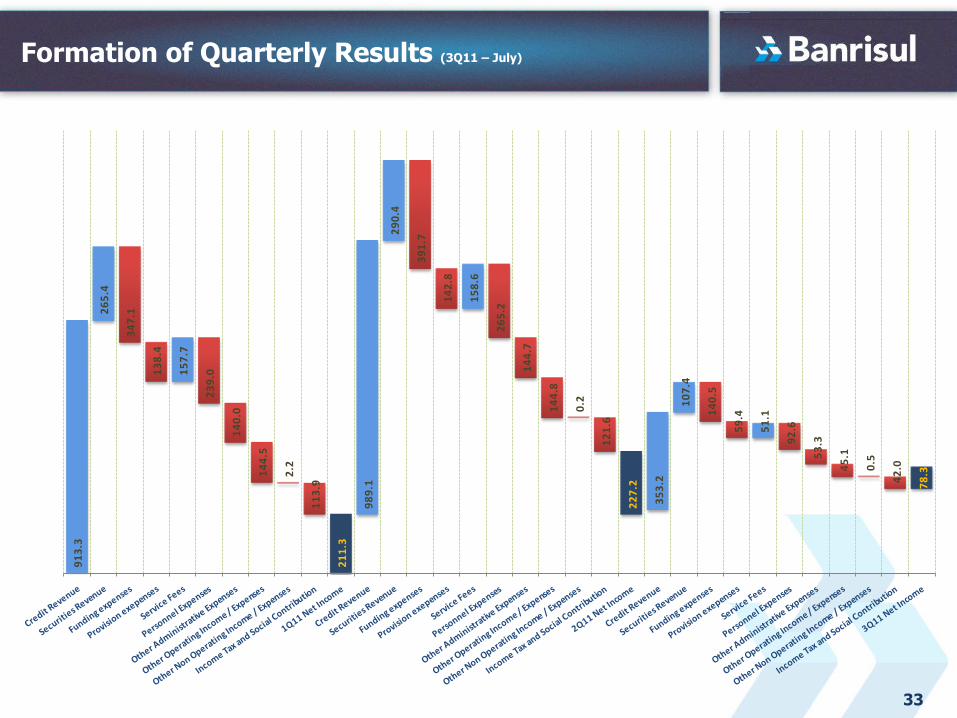
Formation of Quarterly Results (3Q11 – July)
91
3.3
26
5.4
34
7.1
13
8.4
15
7.7
23
9.0
14
0.0
14
4.5
2.2
11
3.9
21
1.3
98
9.1
29
0.4
39
1.7
14
2.8
15
8.6
26
5.2
14
4.7
14
4.8
0.2
12
1.6
22
7.2
35
3.2
10
7.4
14
0.5
59
.4
51
.1
92
.6
53
.3
45
.1
0.5
42
.0
78
.3
34
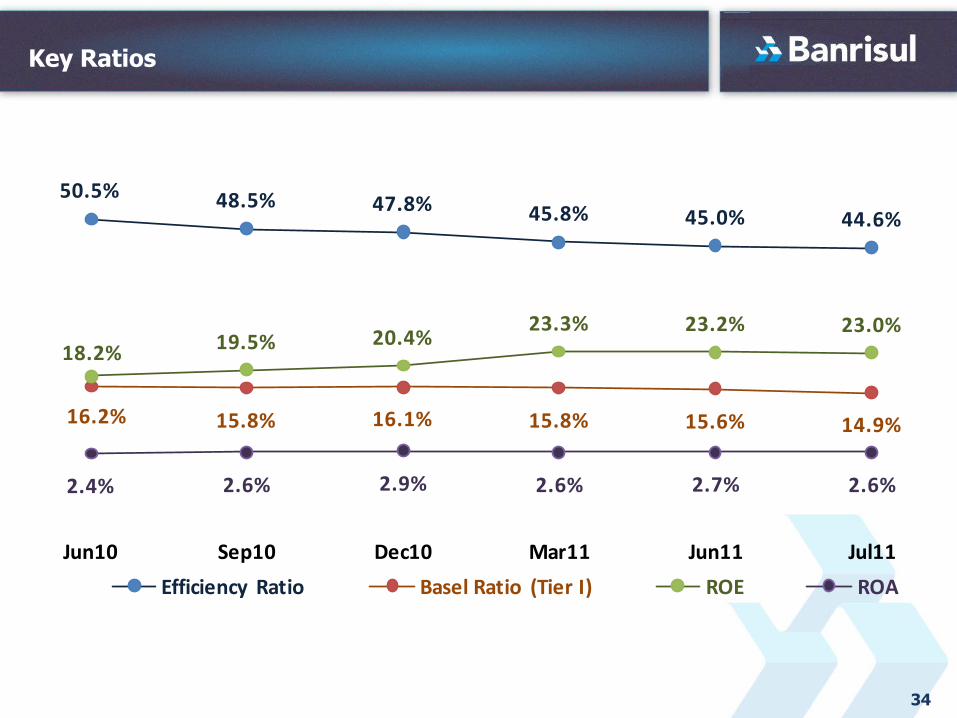
Key Ratios
50.5% 48.5% 47.8% 45.8% 45.0% 44.6%
16.2% 15.8% 16.1% 15.8% 15.6% 14.9%
18.2% 19.5% 20.4%23.3% 23.2% 23.0%
2.4% 2.6% 2.9% 2.6% 2.7% 2.6%
Jun10 Sep10 Dec10 Mar11 Jun11 Jul11
Efficiency Ratio Basel Ratio (Tier I) ROE ROA
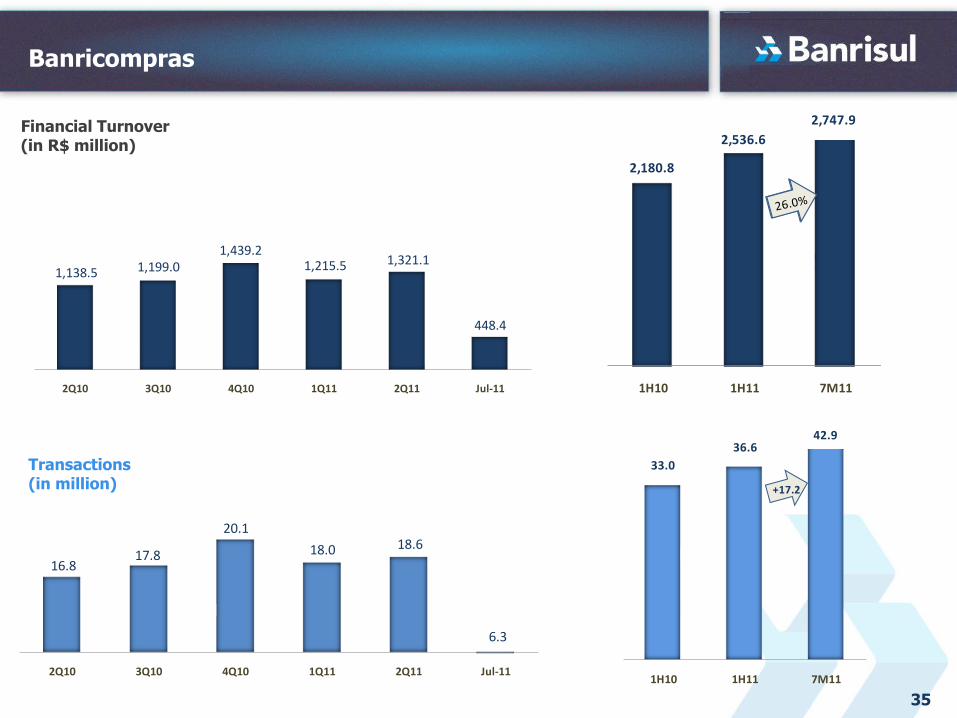
1,138.5 1,199.01,439.2
1,215.5 1,321.1
448.4
2Q10 3Q10 4Q10 1Q11 2Q11 Jul-11
35
Banricompras
Financial Turnover(in R$ million)
Transactions(in million)
16.817.8
20.1
18.0 18.6
6.3
2Q10 3Q10 4Q10 1Q11 2Q11 Jul-11
2,180.8
2,536.6
2,747.9
1H10 1H11 7M11
33.0
36.642.9
1H10 1H11 7M11
+17.2
36
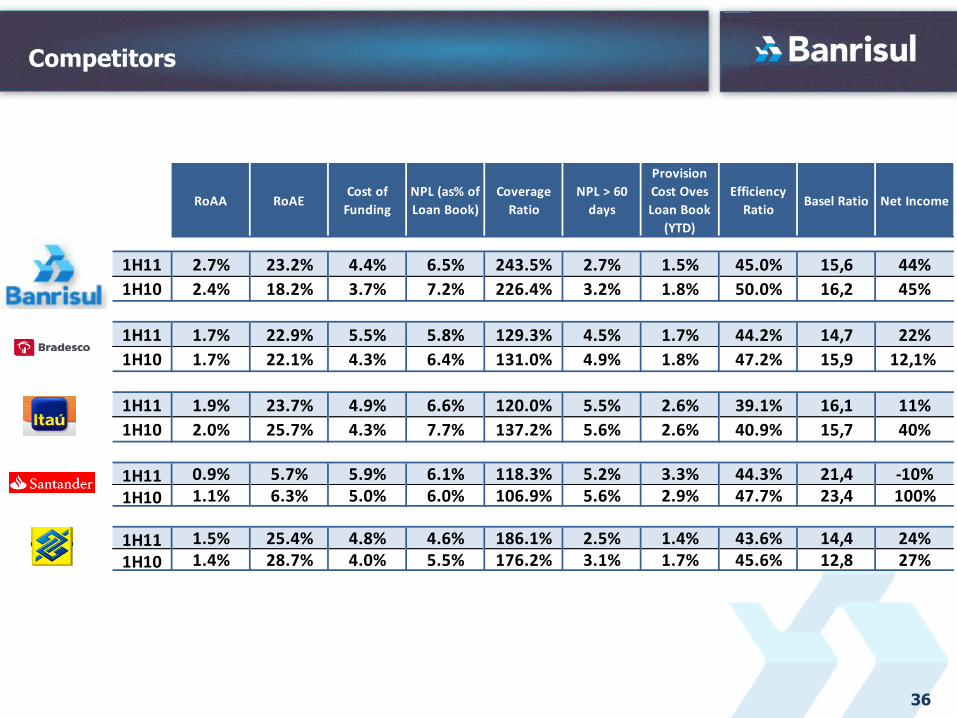
Competitors
RoAA RoAECost of
Funding
NPL (as% of
Loan Book)
Coverage
Ratio
NPL > 60
days
Provision
Cost Oves
Loan Book
(YTD)
Efficiency
RatioBasel Ratio Net Income
1H11 2.7% 23.2% 4.4% 6.5% 243.5% 2.7% 1.5% 45.0% 15,6 44%
1H10 2.4% 18.2% 3.7% 7.2% 226.4% 3.2% 1.8% 50.0% 16,2 45%
1H11 1.7% 22.9% 5.5% 5.8% 129.3% 4.5% 1.7% 44.2% 14,7 22%
1H10 1.7% 22.1% 4.3% 6.4% 131.0% 4.9% 1.8% 47.2% 15,9 12,1%
1H11 1.9% 23.7% 4.9% 6.6% 120.0% 5.5% 2.6% 39.1% 16,1 11%
1H10 2.0% 25.7% 4.3% 7.7% 137.2% 5.6% 2.6% 40.9% 15,7 40%
1H11 0.9% 5.7% 5.9% 6.1% 118.3% 5.2% 3.3% 44.3% 21,4 -10%
1H10 1.1% 6.3% 5.0% 6.0% 106.9% 5.6% 2.9% 47.7% 23,4 100%
1H11 1.5% 25.4% 4.8% 4.6% 186.1% 2.5% 1.4% 43.6% 14,4 24%
1H10 1.4% 28.7% 4.0% 5.5% 176.2% 3.1% 1.7% 45.6% 12,8 27%
37
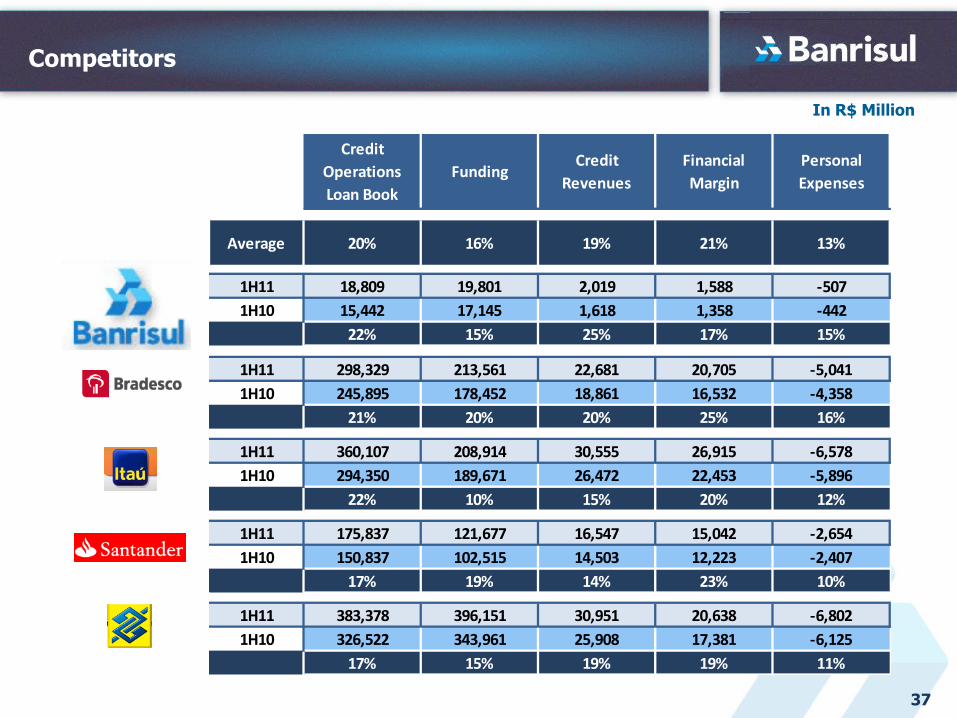
Competitors
Credit
Operations
Loan Book
FundingCredit
Revenues
Financial
Margin
Personal
Expenses
Average 20% 16% 19% 21% 13%
1H11 18,809 19,801 2,019 1,588 -507
1H10 15,442 17,145 1,618 1,358 -442
22% 15% 25% 17% 15%
1H11 298,329 213,561 22,681 20,705 -5,041
1H10 245,895 178,452 18,861 16,532 -4,358
21% 20% 20% 25% 16%
1H11 360,107 208,914 30,555 26,915 -6,578
1H10 294,350 189,671 26,472 22,453 -5,896
22% 10% 15% 20% 12%
1H11 175,837 121,677 16,547 15,042 -2,654
1H10 150,837 102,515 14,503 12,223 -2,407
17% 19% 14% 23% 10%
1H11 383,378 396,151 30,951 20,638 -6,802
1H10 326,522 343,961 25,908 17,381 -6,125
17% 15% 19% 19% 11%
In R$ Million
38
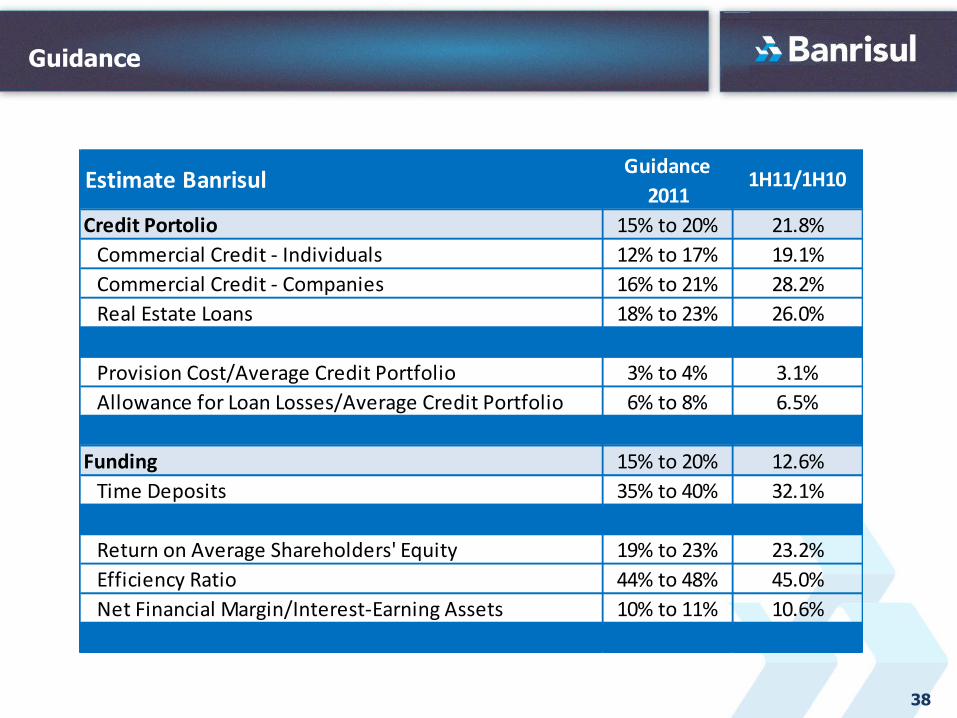
Guidance
Credit Portolio 15% to 20% 21.8%
Commercial Credit - Individuals 12% to 17% 19.1%
Commercial Credit - Companies 16% to 21% 28.2%
Real Estate Loans 18% to 23% 26.0%
Provision Cost/Average Credit Portfolio 3% to 4% 3.1%
Allowance for Loan Losses/Average Credit Portfolio 6% to 8% 6.5%
Funding 15% to 20% 12.6%
Time Deposits 35% to 40% 32.1%
Return on Average Shareholders' Equity 19% to 23% 23.2%
Efficiency Ratio 44% to 48% 45.0%
Net Financial Margin/Interest-Earning Assets 10% to 11% 10.6%
Estimate BanrisulGuidance
20111H11/1H10
39
This presentation contains forward-lookingstatements relating to the prospects of thebusiness, estimates for operating and financialresults, and those related to growth prospectsof BANRISUL. These are merely projectionsand, as such, are based exclusively on theexpectations of BANRISUL’s managementconcerning the future of the business and itscontinued access to capital to fund theCompany’s business plan. Such forward-looking statements depend, substantially, onchanges in market conditions, governmentregulations, competitive pressures, theperformance of the Brazilian economy and theindustry, among other factors and risksdisclosed in BANRISUL’s filed disclosuredocuments and are, therefore, subject tochangewithout prior notice.
BANCO DO ESTADO DO RIO GRANDE DO SUL S.A.
Investor Relations
E-mail: [email protected] Site: www.banrisul.com
Phone: +55 51 - 3215-3232Fax: +55 51- 3215-3200
40
![Itausa Elekeiroz.ppt [Modo de Compatibilidade] · destilação contínua do produto final em uma só coluna, ... (VP e CA). 7. Investimentos Realizados: 2002 a 2008 ... Itausa Elekeiroz.ppt](https://img.dokumen.tips/doc/110x75/5b8683d57f8b9a9a4d8d0120/itausa-modo-de-compatibilidade-destilacao-continua-do-produto-final-em.jpg)