Embed Size (px)
Citation preview

Kajaria CeramicsCMP* (Rs) 710
Upside/ (Downside) (%) 21
Bloomberg Ticker KJC IN
Market Cap. (Rs bn) 113
Free Float (%) 53
Shares O/S (mn) 159
Consumer Durable | India
Institutional Equity Research
Initiating Coverage | September 14, 2017
1
BUYTarget Price: Rs861
Share price (%) 1 mth 3 mth 12 mth
Absolute performance 14.7 3.4 7.9
Relative to Nifty 10.7 (1.6) (7.9)
Shareholding Pattern (%) Mar'17 Jun’17
Promoter 47.4 47.4
Public 52.6 52.6
1 Year Stock Price Performance
Note: * CMP as on Sept 13, 2017
Research Analyst : Sameer Deshmukh
Contact : (022) 33201327
Email : [email protected]
Growing from Strength to Strength
Key Financials (Rs mn) FY15 FY16 FY17 FY18E FY19E
Sales 21,869 24,135 25,496 28,819 33,103
EBITDA 3,541 4,575 4,963 5,616 6,628
Net profit 1,814 2,313 2,521 2,960 3,587
EPS Rs) 11.1 14.6 15.9 18.6 22.6
DPS (Rs) 2.0 2.5 3.0 3.5 4.0
P/E (x) 64.2 48.8 44.6 38.1 31.5
P/B (x) 14.5 11.6 9.6 8.0 6.7
EV/EBITDA (x) 32.7 25.5 23.2 20.5 17.2
ROE (%) 30.7 29.9 26.5 25.9 26.1
Dividend yield (%) 0.3 0.4 0.4 0.5 0.6
Source: Company, RSec Research
Market leadership in tiles, accelerated macro initiatives, implementation of GST, improved operating leverage and strong new product funnel would be the key growth drivers for Kajaria Ceramics, going forward. We expect the Company to post 13.9% revenue and 19.3% earnings CAGR through FY17-19E. We initiate coverage on the stock with BUY recommendation and Target Price of Rs861, which implies an upside of 21% from the current levels.
GST – A Potential Game ChangerCurrently, 60% of domestic tiles volumes are controlled by the unorganised players, out of which a large portion has been able to compete mainly due to avoiding payment of taxes. Complete audit trail of transactions under the GST regime would make it extremely difficult for these players to avoid taxes any more. It is estimated that 10-20% of the unorganised players would be out of business in due course. This should benefit large organised players like Kajaria and fasten the process of conversion of the industry from unorganised to organised.
Huge Headroom for Further GrowthIn spite of being the market leader, Kajaria just has a market share of 10% in overall and 20% in organised tiles industry providing huge upside potential for growth. Increasing distribution reach, enhanced range of products, focussed advertising spends and faster conversion to organised industry would propel growth for Kajaria in coming years, in our view.
Multiple Macro Initiatives, Rising Urbanisation Augur WellSeveral macro initiatives by the Central Government, which include projects such as Housing for All (60mn homes by 2022), Swachh Bharat Abhiyaan (60mn toilets by 2019), Smart City Mission (Phased development of 100 smart cities), implementation of RERA, interest subsidy on housing loans and Atal Mission for Rejuvenation & Urban transformation (AMRUT) would benefit the organised tiles industry in general and the market leader Kajaria Ceramics in particular.
Outlook & ValuationWe expect Kajaria to post consolidated revenues of Rs28.8bn and Rs33.1bn and net profit of Rs3bn and Rs3.6bn in FY18E and FY19E, respectively. Based on expected EPS of Rs22.6, the stock currently trades at reasonable P/E multiple of 31.5x FY19E earnings. Looking ahead, we expect Kajaria to command premium multiples in coming years on the back of market leadership, superior financial performance and strong new product funnel along with faster consolidation of organised industry under GST regime. We initiate coverage on the stock with BUY recommendation and Target Price of Rs861, based on 34x Sep’19 EPS.
400
450
500
550
600
650
700
750
800
Sep-
16
Oct
-16
Nov
-16
Dec
-16
Dec
-16
Jan-
17
Feb-
17
Mar
-17
Apr-
17
May
-17
Jun-
17
Jul-1
7
Aug-
17
Sep-
17

Kajaria CeramicsInitiating Coverage | India
Institutional Equity Research
2
CMP* (Rs) 710
Upside/ (Downside) (%) 21
Bloomberg Ticker KJC IN
BUYTarget Price: Rs861
Investment Rationale Increasing Urbanisation & Multiple Macro Initiatives to Drive Demand Growth of Domestic Tiles IndustryThe Central Government has undertaken several initiatives, which would drive the growth of ceramic tiles industry in coming years. Some of the macro-programmes include:
f Housing for All: The Government mulls building 60mn homes by 2022 with 40mn homes in rural and 20mn homes in urban areas.
f Swachh Bharat Abhiyaan: 60mn toilets are proposed to be built across 4,041 towns by 2019.
f Smart City Mission: First phase of development of 20 cities is underway and outlay to the tune of Rs508bn is earmarked for developing 100 cities.
f Atal Mission for Rejuvenation & Urban Transformation (AMRUT): 500 cities will be developed under this project.
f Pradhan Mantri Awas Yojana: Under this project, the Central Government provides assistance to local urban bodies for rehabilitation of existing slum dwellers, credit linked subsidy, affordable housing partnership and subsidy for beneficiary led individual house construction/enhancement.
Several other factors would also propel growth of the ceramic industry, which include:
f Housing Deficit by 2022: As per the white paper on Indian housing industry published by consultancy firm RNCOS, Demand supply mismatch, rising income levels and increasing migration to urban centers could lead to overall housing shortage of 34mn units by 2022.
f RERA Implementation: Implementation of Real Estate (Regulation and Development Act) 2016 is expected to facilitate timely completion of real estate projects.
f Implementation of pay commission recommendations: Implementation of 7th Pay Commission’s recommendations would result in 23.6% overall increase in salaries, allowances and pension, which would increase the disposable incomes in the hands of the consumers.
f GST Roll-out: Rollout of Goods & Services Tax would enable the organised players to compete effectively with their unorganised counterparts. As the latter would now come under the tax net, it would result in lower price differential between the two. Currently, over half of industry demand is being catered to by the unorganised players.
f Increased Affordability of Tiles: Increasing operating efficiencies, higher economies of scale, technological advances have resulted in sharp fall in prices of ceramic tiles over the past few years. It also led to increased affordability of tiles, which has propelled growth of ceramics, Polished vitrified tiles (PVT) and Glazed vitrified tiles (GVT).
f Anti Dumping Duty on Chinese Ceramic Tiles: Imposition of anti dumping duty on Chinese ceramic tiles for five years with effect from Feb’2017 has resulted in increased price competitiveness of domestic players enabling them to fend off competition from the Chinese players.

Kajaria CeramicsInitiating Coverage | India
Institutional Equity Research
3
CMP* (Rs) 710
Upside/ (Downside) (%) 21
Bloomberg Ticker KJC IN
BUYTarget Price: Rs861
Lower per-capita Consumption Provides Strong Headroom for Further Growth Although India is the third largest producer and consumer of tiles globally, accounting for ~7% of total production and consumption, per capita consumption of tiles remains abysmally low. India’s per capita consumption at 0.6sqm is very low compared to 3.6sqm for China and 4sqm for Brazil.
Exhibit 1: Trend in Indian Ties Consumption Exhibit 2: Trend in Indian Tiles Production
Source: Company, RSec Research
Exhibit 3: Per Capita Consumption of tiles in key countries
Source: Company, RSec Research
Data from Census 2011 clearly depict huge potential for the domestic tiles industry in coming years. As per the Census, Mud is used as floor material in 47% of households, while cement is used in 31% households. Mosaic/floor tiles account for just 11% of total households. However, the share of Mud floorings has fallen from 67% in 1991 to 47% in 2011, while share of tiles has increased from 4% to 11% in the same period.
With higher income levels, increasing urbanisation, rising aspirations, better awareness and easier availability, we expect the share of Mud and Cement flooring to come down substantially in coming years with the increased usage of floor tiles.
625
681
718
756 763 786
500
550
600
650
700
750
800
850
CY11 CY12 CY13 CY14 CY15 CY16
India tiles consumption mn sqm
617
691
750
825 850
871
500
550
600
650
700
750
800
850
900
CY11 CY12 CY13 CY14 CY15 CY16
India tiles production mn sqm
3.6
0.6
4.0 4.2
1.4
9.5
-
2.0
4.0
6.0
8.0
10.0
China India Brazil Vietnam Indonesia Saudi
Per capita consumption (sqm)
Kajaria CeramicsInitiating Coverage | India
Institutional Equity Research
4
CMP* (Rs) 710
Upside/ (Downside) (%) 21
Bloomberg Ticker KJC IN
BUYTarget Price: Rs861
Exhibit 4: Different types of material for Flooring
Source: Census 2011, RSec Research
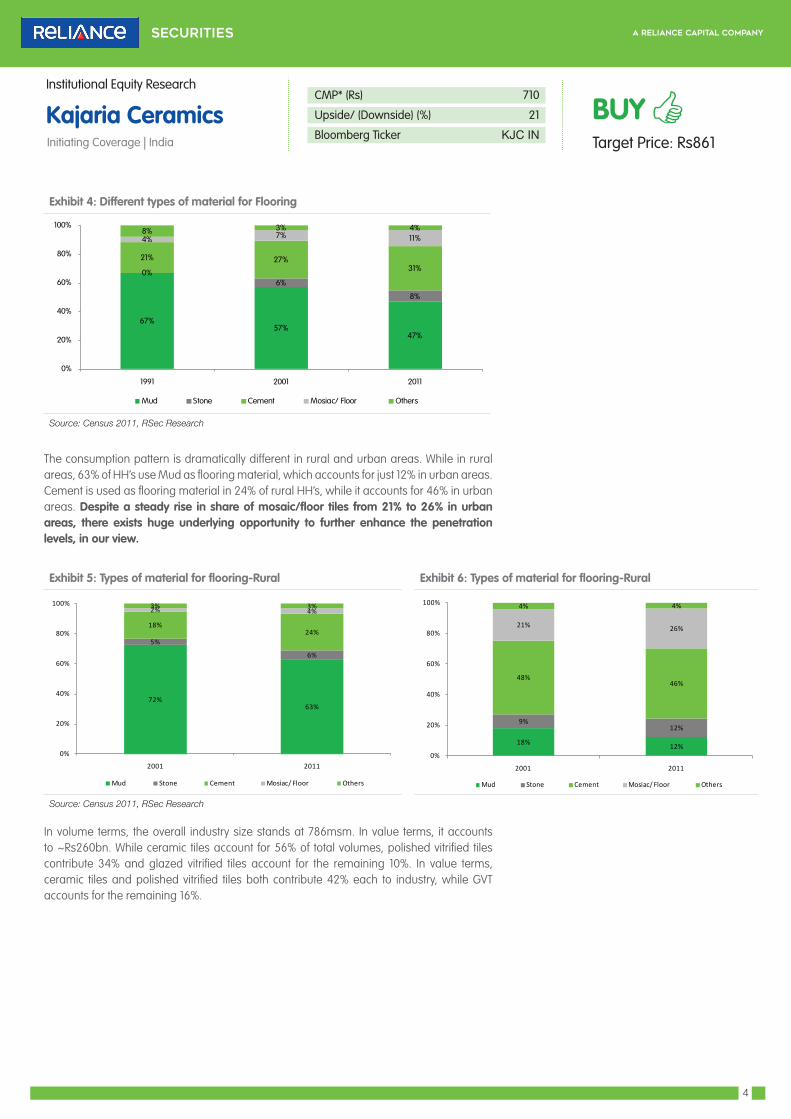
The consumption pattern is dramatically different in rural and urban areas. While in rural areas, 63% of HH’s use Mud as flooring material, which accounts for just 12% in urban areas. Cement is used as flooring material in 24% of rural HH’s, while it accounts for 46% in urban areas. Despite a steady rise in share of mosaic/floor tiles from 21% to 26% in urban areas, there exists huge underlying opportunity to further enhance the penetration levels, in our view.
Exhibit 5: Types of material for flooring-Rural Exhibit 6: Types of material for flooring-Rural
Source: Census 2011, RSec Research
In volume terms, the overall industry size stands at 786msm. In value terms, it accounts to ~Rs260bn. While ceramic tiles account for 56% of total volumes, polished vitrified tiles contribute 34% and glazed vitrified tiles account for the remaining 10%. In value terms, ceramic tiles and polished vitrified tiles both contribute 42% each to industry, while GVT accounts for the remaining 16%.
67%57%
47%
0%6%
8%
21% 27%31%
4% 7% 11%8% 3% 4%
0%
20%
40%
60%
80%
100%
1991 2001 2011
Mud Stone Cement Mosiac/ Floor Others
72%63%
5%
6%
18%24%
2% 4%3% 3%
0%
20%
40%
60%
80%
100%
2001 2011
Mud Stone Cement Mosiac/ Floor Others
18% 12%
9%12%
48%46%
21% 26%
4% 4%
0%
20%
40%
60%
80%
100%
2001 2011
Mud Stone Cement Mosiac/ Floor Others

Kajaria CeramicsInitiating Coverage | India
Institutional Equity Research
5
CMP* (Rs) 710
Upside/ (Downside) (%) 21
Bloomberg Ticker KJC IN
BUYTarget Price: Rs861
Exhibit 7: Bifurcation of tiles industry in volume terms Exhibit 8: Bifurcation of tiles industry in value terms
Source: Company, RSec Research
Exhibit 9: Average Realisation Rs per sqm
Source: Company, RSec Research
Exhibit 10: Types of Tiles & Their Key Characteristics
Types of Tiles Structure & Key Features
Ceramic tiles Made of clay
Vitrified Mixture of clay, silica, quartz and feldspar
Soluble salt vitrified Upgraded ceramic tiles with higher kiln temperature providing better durability
Double charged vitrified Fed through a press that prints pattern with double layer of pigment 3-4mm more than normal tiles
Full body Vitrified tiles that have pigment in entire body of the tile
Glazed vitrified Vitrified tile with glaze on the surface
Digital print tiles Tiles, designs of which are printed on the surface. Created by photos on the computer platform and then applied to tiles using Ink-jets
Source: Company, RSec Research
Ceramic tiles56%
Polished vitrified tiles34%
Glazed vitrified tiles10%
Ceramic tiles42%
Polished vitrified tiles42%
Glazed vitrified tiles16%
259
418
533
-
100
200
300
400
500
600
Ceramic tiles Polished vitrified tiles Glazed vitrified tiles
Kajaria CeramicsInitiating Coverage | India
Institutional Equity Research
6
CMP* (Rs) 710
Upside/ (Downside) (%) 21
Bloomberg Ticker KJC IN
BUYTarget Price: Rs861
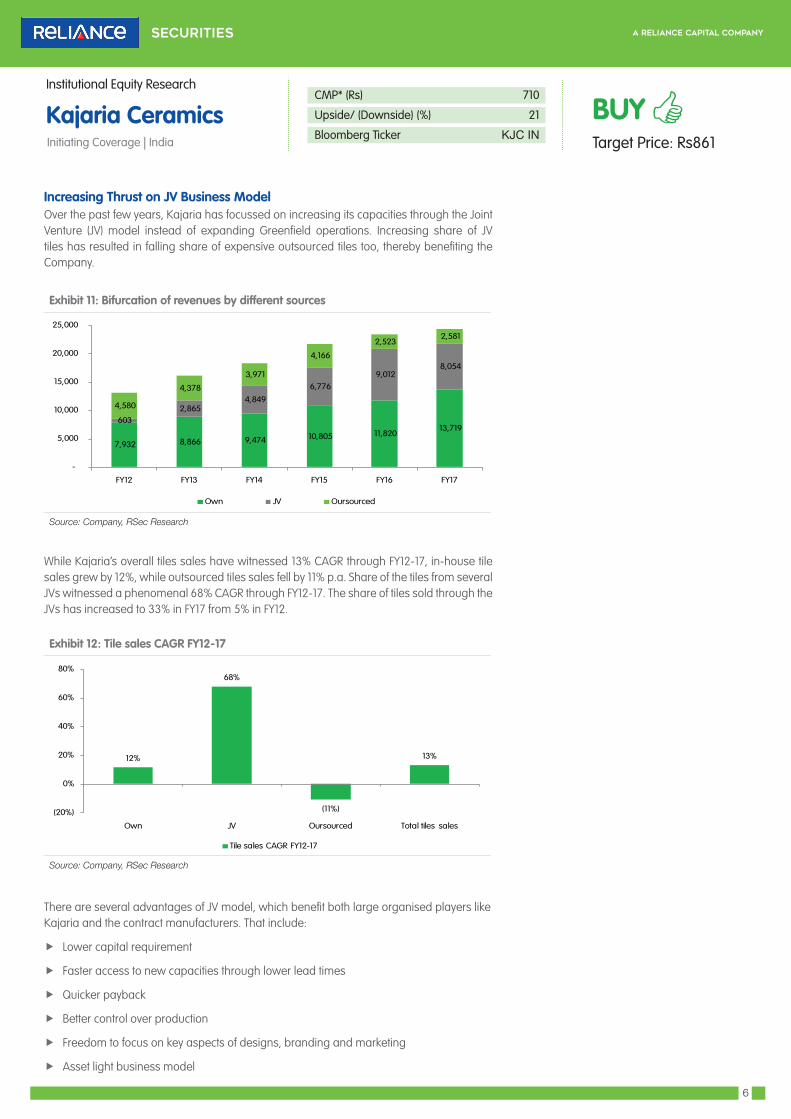
Increasing Thrust on JV Business ModelOver the past few years, Kajaria has focussed on increasing its capacities through the Joint Venture (JV) model instead of expanding Greenfield operations. Increasing share of JV tiles has resulted in falling share of expensive outsourced tiles too, thereby benefiting the Company.
Exhibit 11: Bifurcation of revenues by different sources
Source: Company, RSec Research
While Kajaria’s overall tiles sales have witnessed 13% CAGR through FY12-17, in-house tile sales grew by 12%, while outsourced tiles sales fell by 11% p.a. Share of the tiles from several JVs witnessed a phenomenal 68% CAGR through FY12-17. The share of tiles sold through the JVs has increased to 33% in FY17 from 5% in FY12.
Exhibit 12: Tile sales CAGR FY12-17
Source: Company, RSec Research
There are several advantages of JV model, which benefit both large organised players like Kajaria and the contract manufacturers. That include:
f Lower capital requirement
f Faster access to new capacities through lower lead times
f Quicker payback
f Better control over production
f Freedom to focus on key aspects of designs, branding and marketing
f Asset light business model
12%
68%
(11%)
13%
(20%)
0%
20%
40%
60%
80%
Own JV Oursourced Total tiles sales
Tile sales CAGR FY12-17
7,932 8,866 9,474 10,805 11,820 13,719
603 2,865
4,849
6,776 9,012
8,054
4,580
4,378
3,971
4,166
2,523 2,581
-
5,000
10,000
15,000
20,000
25,000
FY12 FY13 FY14 FY15 FY16 FY17
Own JV Oursourced

Kajaria CeramicsInitiating Coverage | India
Institutional Equity Research
7
CMP* (Rs) 710
Upside/ (Downside) (%) 21
Bloomberg Ticker KJC IN
BUYTarget Price: Rs861
f Improvement in debt equity levels
f Allows each partner to focus on its respective strengths
f Underwriting of production by large players giving growth visibility to contract manufacturers
Kajaria’s total manufacturing capacity stood at 68.9msm in March’17, out of which its in-house capacity stood at 41.5msm while the rest 27.4msm comes from several JV partners. It has three in-house manufacturing facilities located in Rajasthan (26.6 msm in Galipur and 6.5 msm in Malutana) and Uttar Pradesh (8.4 msm in Sikandrabad). Out of its 5 JVs, 4 are based at Morbi (the ceramic hub of India) and 1 in Vijayawada (AP). However, post divestment of Taurus JV, combined capacity now stands at 63.9msm.
Exhibit 13: Total Capacity as per regions (March’17) Exhibit 14: Total capacity as per manufacturing facilities (March’17)
Source: Company, RSec Research
While Kajaria’s overall tiles production witnessed 15% CAGR from 29.6mn sqm in FY12 to 58.5mn sqm in FY17, its in-house production witnessed just 6% CAGR in the same period, while production from JVs delivered a staggering 54% CAGR through FY12-17.
Exhibit 15: Bifurcation between own & JV production
Source: Company, RSec Research
UP12%
Rajasthan48%
Morbi, Gujarat36%
AP4%
Soriso Ceramics JV, 3.6
Jaxx vitrified JV, 10.2
Vennar ceramics JV, 2.9
Cosa ceramics JV, 5.7
Taurus Tiles JV, 5.0
Galipur own, 26.6
Sikandarabad own, 8.4
Maultana own, 6.5
27.1 28.1 27.1 30.5 33.2 37.2
2.5 8.6 13.9
19.2
25.0 21.3
0
10
20
30
40
50
60
FY12 FY13 FY14 FY15 FY16 FY17
Own manufacturing JV
Kajaria CeramicsInitiating Coverage | India
Institutional Equity Research
8
CMP* (Rs) 710
Upside/ (Downside) (%) 21
Bloomberg Ticker KJC IN
BUYTarget Price: Rs861
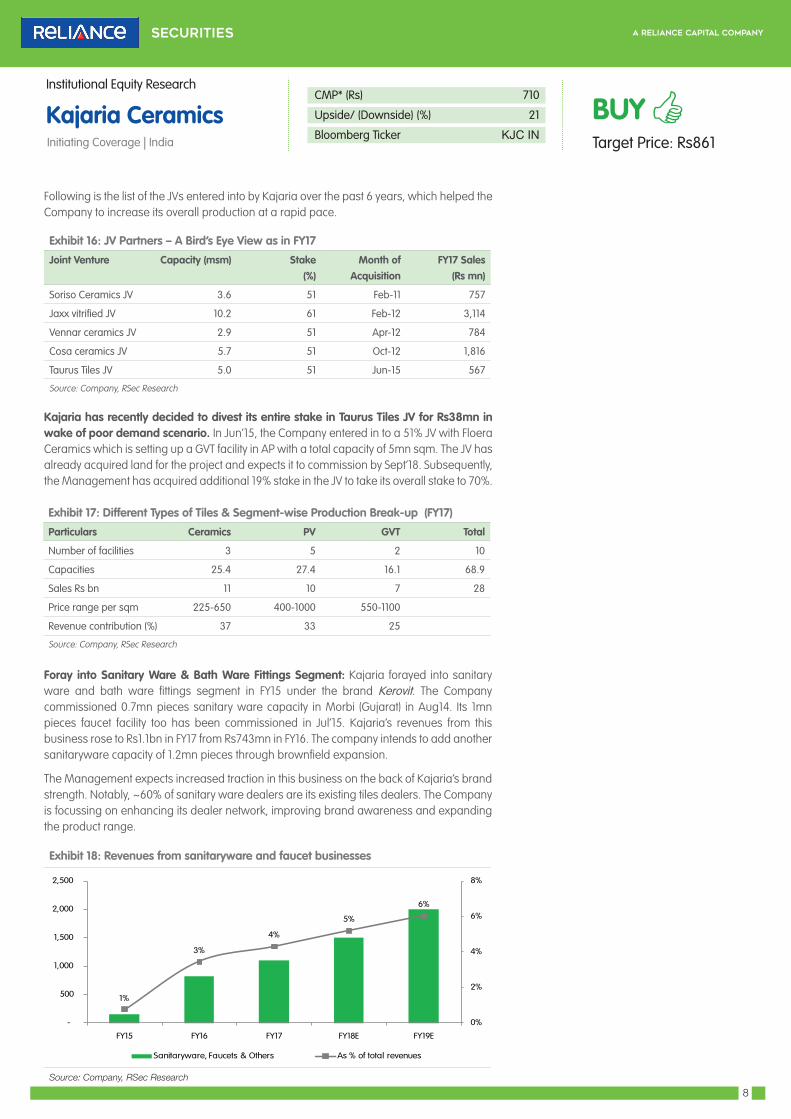
Following is the list of the JVs entered into by Kajaria over the past 6 years, which helped the Company to increase its overall production at a rapid pace.
Exhibit 16: JV Partners – A Bird’s Eye View as in FY17
Joint Venture Capacity (msm) Stake (%)
Month of Acquisition
FY17 Sales (Rs mn)
Soriso Ceramics JV 3.6 51 Feb-11 757
Jaxx vitrified JV 10.2 61 Feb-12 3,114
Vennar ceramics JV 2.9 51 Apr-12 784
Cosa ceramics JV 5.7 51 Oct-12 1,816
Taurus Tiles JV 5.0 51 Jun-15 567
Source: Company, RSec Research
Kajaria has recently decided to divest its entire stake in Taurus Tiles JV for Rs38mn in wake of poor demand scenario. In Jun’15, the Company entered in to a 51% JV with Floera Ceramics which is setting up a GVT facility in AP with a total capacity of 5mn sqm. The JV has already acquired land for the project and expects it to commission by Sept’18. Subsequently, the Management has acquired additional 19% stake in the JV to take its overall stake to 70%.
Exhibit 17: Different Types of Tiles & Segment-wise Production Break-up (FY17)
Particulars Ceramics PV GVT Total
Number of facilities 3 5 2 10
Capacities 25.4 27.4 16.1 68.9
Sales Rs bn 11 10 7 28
Price range per sqm 225-650 400-1000 550-1100
Revenue contribution (%) 37 33 25
Source: Company, RSec Research
Foray into Sanitary Ware & Bath Ware Fittings Segment: Kajaria forayed into sanitary ware and bath ware fittings segment in FY15 under the brand Kerovit. The Company commissioned 0.7mn pieces sanitary ware capacity in Morbi (Gujarat) in Aug14. Its 1mn pieces faucet facility too has been commissioned in Jul’15. Kajaria’s revenues from this business rose to Rs1.1bn in FY17 from Rs743mn in FY16. The company intends to add another sanitaryware capacity of 1.2mn pieces through brownfield expansion.
The Management expects increased traction in this business on the back of Kajaria’s brand strength. Notably, ~60% of sanitary ware dealers are its existing tiles dealers. The Company is focussing on enhancing its dealer network, improving brand awareness and expanding the product range.
Exhibit 18: Revenues from sanitaryware and faucet businesses
Source: Company, RSec Research
1%
3%
4%
5%
6%
0%
2%
4%
6%
8%
-
500
1,000
1,500
2,000
2,500
FY15 FY16 FY17 FY18E FY19E
Sanitaryware, Faucets & Others As % of total revenues
Kajaria CeramicsInitiating Coverage | India
Institutional Equity Research
9
CMP* (Rs) 710
Upside/ (Downside) (%) 21
Bloomberg Ticker KJC IN
BUYTarget Price: Rs861
Looking ahead, we expect the contribution of this business to Kajaria’s overall revenues to increase from 3% in FY16 to 6% in FY19E, even then the tiles segment will remain as the dominant segment for years to come.
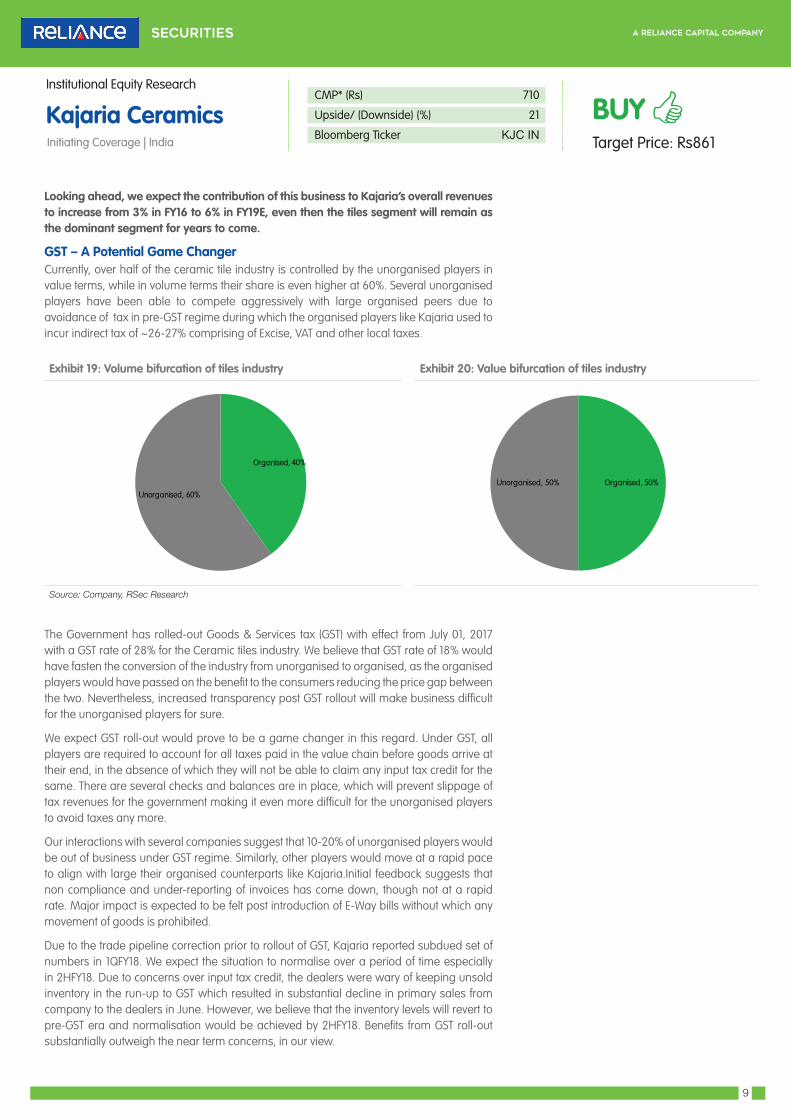
GST – A Potential Game ChangerCurrently, over half of the ceramic tile industry is controlled by the unorganised players in value terms, while in volume terms their share is even higher at 60%. Several unorganised players have been able to compete aggressively with large organised peers due to avoidance of tax in pre-GST regime during which the organised players like Kajaria used to incur indirect tax of ~26-27% comprising of Excise, VAT and other local taxes.
Exhibit 19: Volume bifurcation of tiles industry Exhibit 20: Value bifurcation of tiles industry
Source: Company, RSec Research
The Government has rolled-out Goods & Services tax (GST) with effect from July 01, 2017 with a GST rate of 28% for the Ceramic tiles industry. We believe that GST rate of 18% would have fasten the conversion of the industry from unorganised to organised, as the organised players would have passed on the benefit to the consumers reducing the price gap between the two. Nevertheless, increased transparency post GST rollout will make business difficult for the unorganised players for sure.
We expect GST roll-out would prove to be a game changer in this regard. Under GST, all players are required to account for all taxes paid in the value chain before goods arrive at their end, in the absence of which they will not be able to claim any input tax credit for the same. There are several checks and balances are in place, which will prevent slippage of tax revenues for the government making it even more difficult for the unorganised players to avoid taxes any more.
Our interactions with several companies suggest that 10-20% of unorganised players would be out of business under GST regime. Similarly, other players would move at a rapid pace to align with large their organised counterparts like Kajaria.Initial feedback suggests that non compliance and under-reporting of invoices has come down, though not at a rapid rate. Major impact is expected to be felt post introduction of E-Way bills without which any movement of goods is prohibited.
Due to the trade pipeline correction prior to rollout of GST, Kajaria reported subdued set of numbers in 1QFY18. We expect the situation to normalise over a period of time especially in 2HFY18. Due to concerns over input tax credit, the dealers were wary of keeping unsold inventory in the run-up to GST which resulted in substantial decline in primary sales from company to the dealers in June. However, we believe that the inventory levels will revert to pre-GST era and normalisation would be achieved by 2HFY18. Benefits from GST roll-out substantially outweigh the near term concerns, in our view.
Organised, 40%
Unorganised, 60%Organised, 50%Unorganised, 50%

Kajaria CeramicsInitiating Coverage | India
Institutional Equity Research
10
CMP* (Rs) 710
Upside/ (Downside) (%) 21
Bloomberg Ticker KJC IN
BUYTarget Price: Rs861
Focussed Spends on BrandOver the past three years, Kajaria has been making large investments on the brand through higher A&P spends. Its average Advertising spends have increased at a CAGR of 22% through FY12-17 and account for ~3% of its revenues.
Exhibit 21: Increasing investment behind brands
Source: Company, RSec Research
The Company roped in actor Akshay Kumar as its brand ambassador in 2HFY17 and has introduced several print and advertising campaigns featuring the actor with strong thrust on nationalist tagline ‘Desh Ki Mitti Se Bani Tile Se Desh Ko Banate Hain’.
Continuous effort to strengthen its brands through increased investment is expected to benefit Kajaria in coming years, even more so in the context of GST implementation that could wipe out a large part of unorganised players, thereby benefiting the incumbents.
The Company has been able to create a strong brand recall amongst its consumers. In this endeavour, it has focussed on outdoor display campaigns at major airports i.e. Mumbai, New Delhi, Hyderabad and Bangalore among others to improve the brand perception in the psyche of the consumers. Kajaria is the only ceramic tile company in India that has been conferred with “Superbrand” title for eight consecutive years.
Some of the new launches include Signature Walls in PVT with sizes of 30x60cm and 40x80cm and double charge in 60x120cm, Sapphire for the first time in India, Stone finished vitrified tiles Stone Art in 60x60cm and new additions in Solitaire range. The company has also introduced The Ultima technical body slabs with digital printing.
Instead of focussing on volatile and low-margin institutional segment, Kajaria has consistently stressed on growing its retail customer base and has built its brand in that direction. While the industry as a whole derives half of its revenues from institutional segment, Kajaria has focussed aggressively on growing the retail base, which accounts for ~70% of its revenues, while institutional segment contributes the rest.
Exhibit 22: Ceramic Industry customer profile Exhibit 23: Kajaria ceramics customer profile
Source: Company, RSec Research
1.7% 1.7% 1.7%
2.5% 2.4%
3.1%
0.0%
0.9%
1.8%
2.7%
3.6%
-
200
400
600
800
1,000
FY12 FY13 FY14 FY15 FY16 FY17
A&P spends A&P to sales
Retail50%
Institutional50%
Retail70%
Institutional30%
Eternity-Ultima collection-I
Eternity-Ultima collection-II
Source: Company, RSec Research
Kajaria CeramicsInitiating Coverage | India
Institutional Equity Research
11
CMP* (Rs) 710
Upside/ (Downside) (%) 21
Bloomberg Ticker KJC IN
BUYTarget Price: Rs861
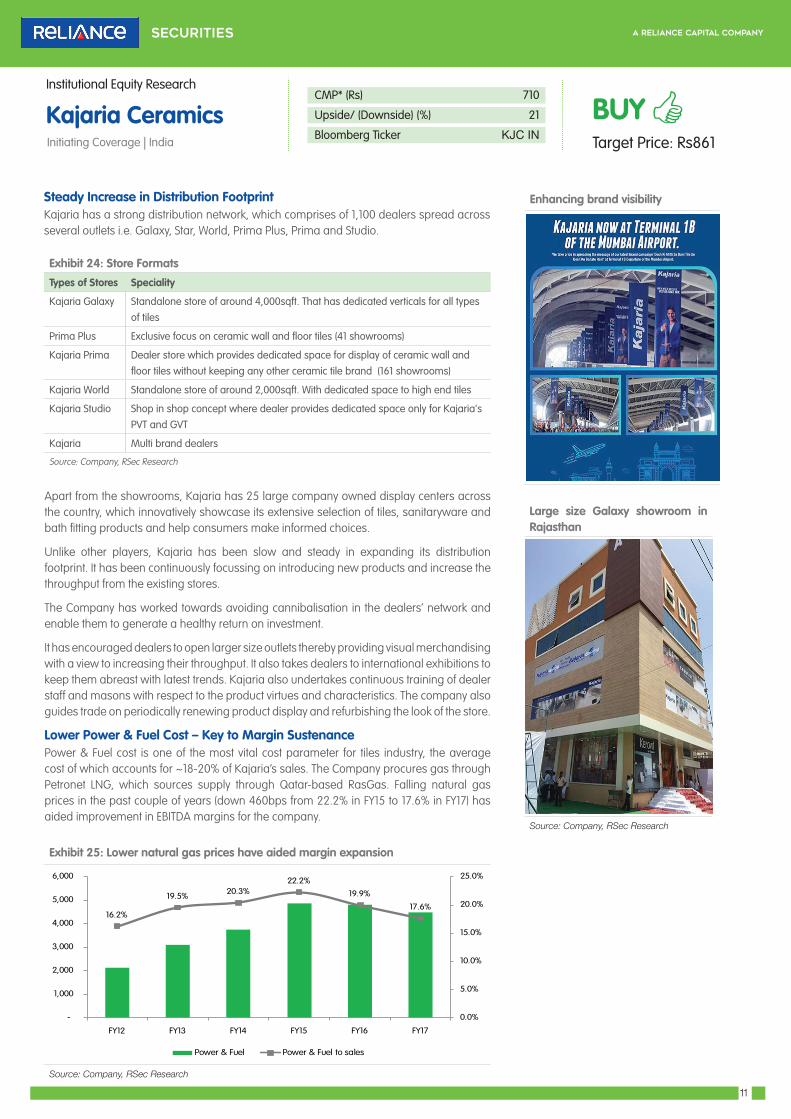
Steady Increase in Distribution FootprintKajaria has a strong distribution network, which comprises of 1,100 dealers spread across several outlets i.e. Galaxy, Star, World, Prima Plus, Prima and Studio.
Exhibit 24: Store Formats
Types of Stores Speciality
Kajaria Galaxy Standalone store of around 4,000sqft. That has dedicated verticals for all types of tiles
Prima Plus Exclusive focus on ceramic wall and floor tiles (41 showrooms)
Kajaria Prima Dealer store which provides dedicated space for display of ceramic wall and floor tiles without keeping any other ceramic tile brand (161 showrooms)
Kajaria World Standalone store of around 2,000sqft. With dedicated space to high end tiles
Kajaria Studio Shop in shop concept where dealer provides dedicated space only for Kajaria's PVT and GVT
Kajaria Multi brand dealers
Source: Company, RSec Research
Apart from the showrooms, Kajaria has 25 large company owned display centers across the country, which innovatively showcase its extensive selection of tiles, sanitaryware and bath fitting products and help consumers make informed choices.
Unlike other players, Kajaria has been slow and steady in expanding its distribution footprint. It has been continuously focussing on introducing new products and increase the throughput from the existing stores.
The Company has worked towards avoiding cannibalisation in the dealers’ network and enable them to generate a healthy return on investment.
It has encouraged dealers to open larger size outlets thereby providing visual merchandising with a view to increasing their throughput. It also takes dealers to international exhibitions to keep them abreast with latest trends. Kajaria also undertakes continuous training of dealer staff and masons with respect to the product virtues and characteristics. The company also guides trade on periodically renewing product display and refurbishing the look of the store.
Lower Power & Fuel Cost – Key to Margin SustenancePower & Fuel cost is one of the most vital cost parameter for tiles industry, the average cost of which accounts for ~18-20% of Kajaria’s sales. The Company procures gas through Petronet LNG, which sources supply through Qatar-based RasGas. Falling natural gas prices in the past couple of years (down 460bps from 22.2% in FY15 to 17.6% in FY17) has aided improvement in EBITDA margins for the company.
Exhibit 25: Lower natural gas prices have aided margin expansion
Source: Company, RSec Research
16.2%
19.5% 20.3%22.2%
19.9%
17.6%
0.0%
5.0%
10.0%
15.0%
20.0%
25.0%
-
1,000
2,000
3,000
4,000
5,000
6,000
FY12 FY13 FY14 FY15 FY16 FY17
Power & Fuel Power & Fuel to sales
Enhancing brand visibility
Large size Galaxy showroom in Rajasthan
Source: Company, RSec Research

Kajaria CeramicsInitiating Coverage | India
Institutional Equity Research
12
CMP* (Rs) 710
Upside/ (Downside) (%) 21
Bloomberg Ticker KJC IN
BUYTarget Price: Rs861
The new contract entered into in January 2016 would expire in 2028 and price for the buyer is based on market dynamics based on crude price linked formula. The earlier contract (Fixed price take or pay) was renegotiated by the Government of India in light of decline in global LNG prices.
With respect to domestic natural gas prices, the central government has revised the pricing guideliness. It considers the weighted average price of four benchmark rates that include Henry Hub (USA), Alberts (Canada), NBP (UK) and Russian Gas. The domestic prices are now benchmarked to prices of gas in the prior year and kicks in with a lag of one quarter and is reset every six months.
Exhibit 26: Exchange rate between USD/INR Exhibit 27: Natural gas prices USD/mmbtu
Source: Company, RSec Research
Exhibit 28: Domestic notified gas prices (USD/scm)
Source: Company, RSec Research
5.054.66
3.82
3.06
2.5 2.48
0
1
2
3
4
5
6
Nov-March 2015 April-Sep 2015 Oct-March 2016 April-Sep 2016 Oct-March 2017 April-Sep 2017
Domestic notified gas prices (USD/scm)
54
56
58
60
62
64
66
68
70
May
-13
Jul-1
3Se
p-13
Nov
-13
Jan-
14M
ar-1
4M
ay-1
4Ju
l-14
Sep-
14N
ov-1
4Ja
n-15
Mar
-15
May
-15
Jul-1
5Se
p-15
Nov
-15
Jan-
16M
ar-1
6M
ay-1
6Ju
l-16
Sep-
16N
ov-1
6Ja
n-17
Mar
-17
May
-17
Jul-1
7Se
p-17
USD/INR
4
8
12
16
20
Ma
y-13
Jul-1
3
Sep
-13
Nov
-13
Jan-
14
Ma
r-14
Ma
y-14
Jul-1
4
Sep
-14
Nov
-14
Jan-
15
Ma
r-15
Ma
y-15
Jul-1
5
Sep
-15
Nov
-15
Jan-
16
Ma
r-16
Ma
y-16
Jul-1
6
Sep
-16
Nov
-16
Jan-
17
Ma
r-17
Ma
y-17
Jul-1
7
Sep
-17
Price USD/mmbtu
Kajaria CeramicsInitiating Coverage | India
Institutional Equity Research
13
CMP* (Rs) 710
Upside/ (Downside) (%) 21
Bloomberg Ticker KJC IN
BUYTarget Price: Rs861
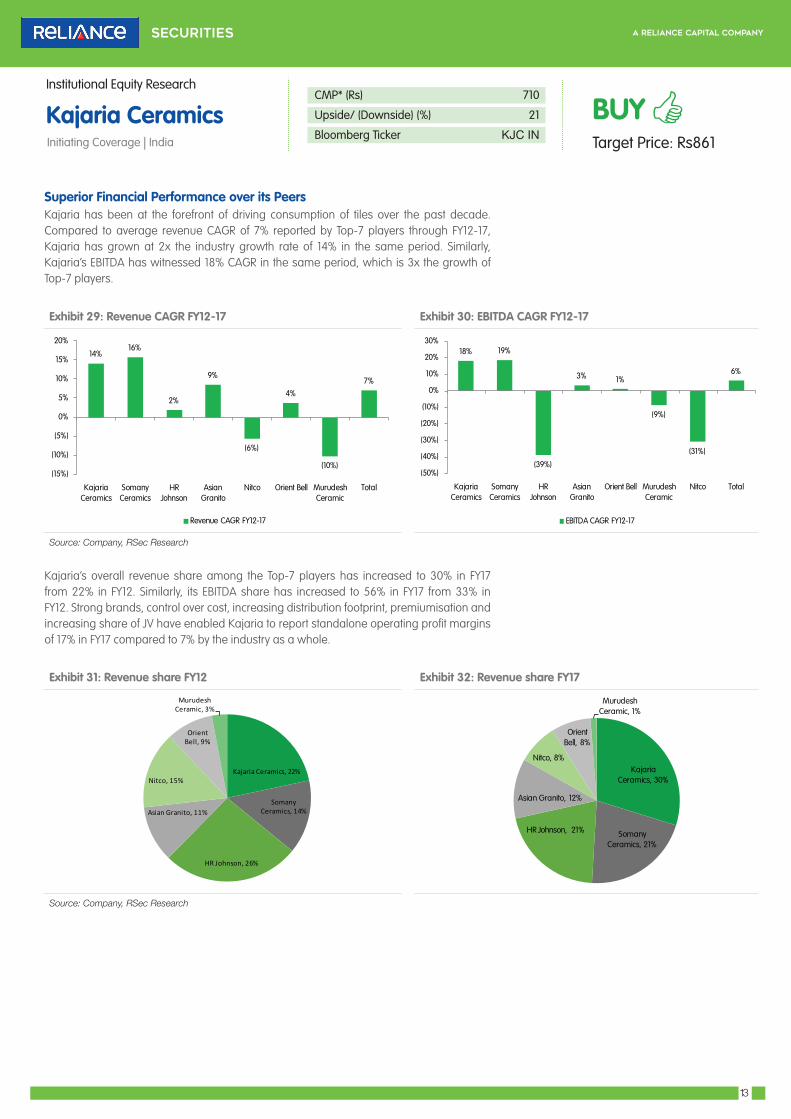
Superior Financial Performance over its PeersKajaria has been at the forefront of driving consumption of tiles over the past decade. Compared to average revenue CAGR of 7% reported by Top-7 players through FY12-17, Kajaria has grown at 2x the industry growth rate of 14% in the same period. Similarly, Kajaria’s EBITDA has witnessed 18% CAGR in the same period, which is 3x the growth of Top-7 players.
Exhibit 29: Revenue CAGR FY12-17 Exhibit 30: EBITDA CAGR FY12-17
Source: Company, RSec Research
Kajaria’s overall revenue share among the Top-7 players has increased to 30% in FY17 from 22% in FY12. Similarly, its EBITDA share has increased to 56% in FY17 from 33% in FY12. Strong brands, control over cost, increasing distribution footprint, premiumisation and increasing share of JV have enabled Kajaria to report standalone operating profit margins of 17% in FY17 compared to 7% by the industry as a whole.
Exhibit 31: Revenue share FY12 Exhibit 32: Revenue share FY17
Source: Company, RSec Research
14%16%
2%
9%
(6%)
4%
(10%)
7%
(15%)
(10%)
(5%)
0%
5%
10%
15%
20%
Kajaria Ceramics
Somany Ceramics
HR Johnson
Asian Granito
Nitco Orient Bell Murudesh Ceramic
Total
Revenue CAGR FY12-17
18% 19%
(39%)
3% 1%
(9%)
(31%)
6%
(50%)
(40%)
(30%)
(20%)
(10%)
0%
10%
20%
30%
Kajaria Ceramics
Somany Ceramics
HR Johnson
Asian Granito
Orient Bell Murudesh Ceramic
Nitco Total
EBITDA CAGR FY12-17
Kajaria Ceramics, 30%
Somany Ceramics, 21%
HR Johnson, 21%
Asian Granito, 12%
Nitco, 8%
Orient Bell, 8%
Murudesh Ceramic, 1%
Kajaria Ceramics, 22%
Somany Ceramics, 14%
HR Johnson, 26%
Asian Granito, 11%
Nitco, 15%
Orient Bell, 9%
Murudesh Ceramic, 3%
Kajaria CeramicsInitiating Coverage | India
Institutional Equity Research
14
CMP* (Rs) 710
Upside/ (Downside) (%) 21
Bloomberg Ticker KJC IN
BUYTarget Price: Rs861
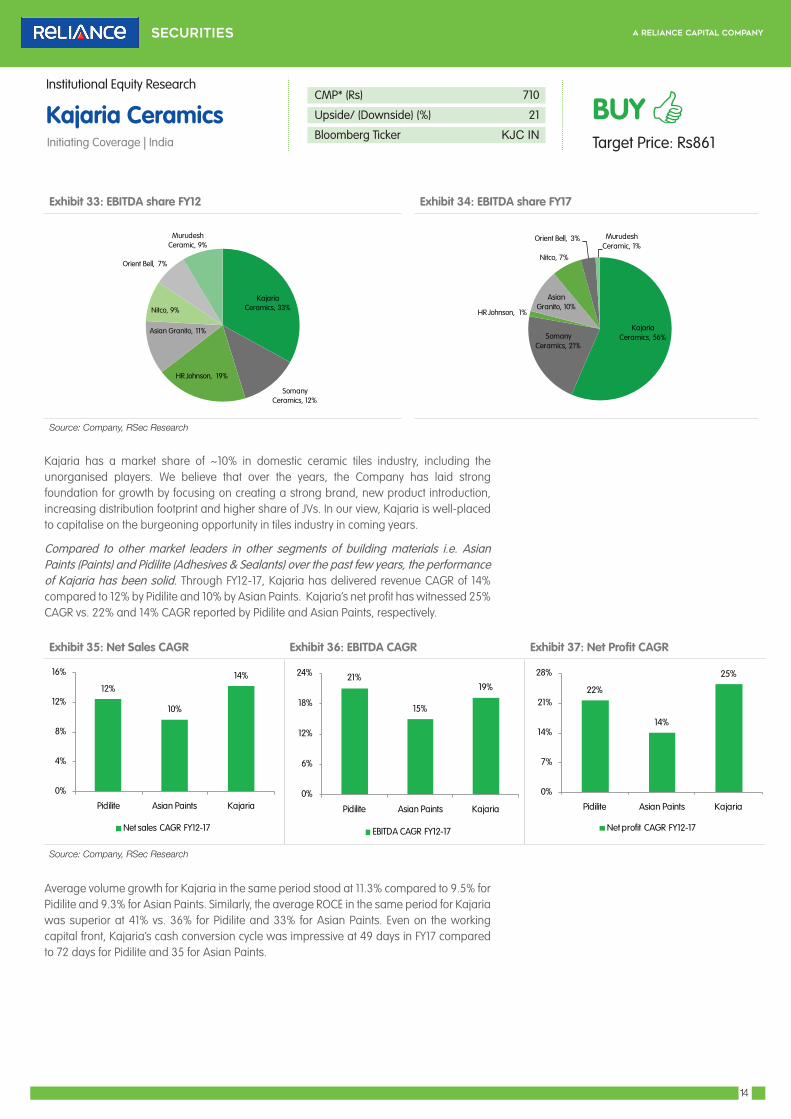
Exhibit 33: EBITDA share FY12 Exhibit 34: EBITDA share FY17
Source: Company, RSec Research
Kajaria has a market share of ~10% in domestic ceramic tiles industry, including the unorganised players. We believe that over the years, the Company has laid strong foundation for growth by focusing on creating a strong brand, new product introduction, increasing distribution footprint and higher share of JVs. In our view, Kajaria is well-placed to capitalise on the burgeoning opportunity in tiles industry in coming years.
Compared to other market leaders in other segments of building materials i.e. Asian Paints (Paints) and Pidilite (Adhesives & Sealants) over the past few years, the performance of Kajaria has been solid. Through FY12-17, Kajaria has delivered revenue CAGR of 14% compared to 12% by Pidilite and 10% by Asian Paints. Kajaria’s net profit has witnessed 25% CAGR vs. 22% and 14% CAGR reported by Pidilite and Asian Paints, respectively.
Exhibit 35: Net Sales CAGR Exhibit 36: EBITDA CAGR Exhibit 37: Net Profit CAGR
Source: Company, RSec Research
Average volume growth for Kajaria in the same period stood at 11.3% compared to 9.5% for Pidilite and 9.3% for Asian Paints. Similarly, the average ROCE in the same period for Kajaria was superior at 41% vs. 36% for Pidilite and 33% for Asian Paints. Even on the working capital front, Kajaria’s cash conversion cycle was impressive at 49 days in FY17 compared to 72 days for Pidilite and 35 for Asian Paints.
Kajaria Ceramics, 56%Somany
Ceramics, 21%
HR Johnson, 1%
Asian Granito, 10%
Nitco, 7%
Orient Bell, 3% Murudesh Ceramic, 1%
Kajaria Ceramics, 33%
Somany Ceramics, 12%
HR Johnson, 19%
Asian Granito, 11%
Nitco, 9%
Orient Bell, 7%
Murudesh Ceramic, 9%
12%
10%
14%
0%
4%
8%
12%
16%
Pidilite Asian Paints Kajaria
Net sales CAGR FY12-17
21%
15%
19%
0%
6%
12%
18%
24%
Pidilite Asian Paints Kajaria
EBITDA CAGR FY12-17
22%
14%
25%
0%
7%
14%
21%
28%
Pidilite Asian Paints Kajaria
Net profit CAGR FY12-17

Kajaria CeramicsInitiating Coverage | India
Institutional Equity Research
15
CMP* (Rs) 710
Upside/ (Downside) (%) 21
Bloomberg Ticker KJC IN
BUYTarget Price: Rs861
Exhibit 38: Average Volume Growth Exhibit 39: Average ROCE
Source: Company, RSec Research
In spite of superior financial performance, Kajaria trades at 30% PE discount to Asian Paints and 15% PE discount to Pidilite. Similarly, it trades at a 35-40% discount to these two players based on FY19E EV/EBITDA multiple.
Exhibit 40: Valuation discount to narrow down Exhibit 41: Kajaria’s growth trajectory remains firm
Source: Company, RSec Research
Increasing market shares, superior financial performance, higher proportion of organised players post GST roll-out and increase in pace of government initiatives towards mass housing would result in narrowing down of these multiples, going forward.
9.5% 9.3%
11.3%
0.0%
3.0%
6.0%
9.0%
12.0%
Pidilite Asian Paints Kajaria
Average Volume growth FY12-17
36%33%
41%
0%
12%
24%
36%
48%
Pidilite Asian Paints Kajaria
Average ROCE FY12-17E
14%
17%
14%13%
14%
19%
0%
5%
10%
15%
20%
25%
Revenue CAGR FY17-19E Net profit CAGR FY17-19E
Pidilite Asian Paints Kajaria
37.1
25.4
46.1
30.1 31.6
17.2
0
8
16
24
32
40
48
56
FY19E PE EV/EBITDA
Pidilite Asian Paints Kajaria
Kajaria CeramicsInitiating Coverage | India
Institutional Equity Research
16
CMP* (Rs) 710
Upside/ (Downside) (%) 21
Bloomberg Ticker KJC IN
BUYTarget Price: Rs861
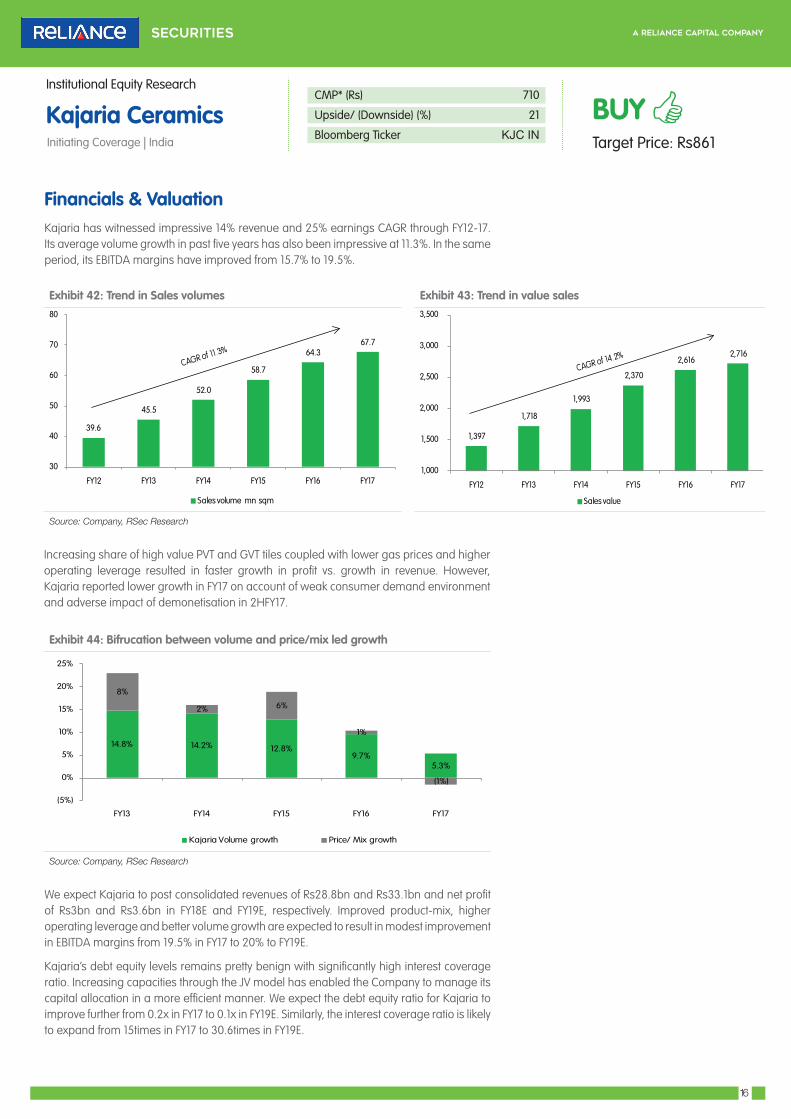
Financials & ValuationKajaria has witnessed impressive 14% revenue and 25% earnings CAGR through FY12-17. Its average volume growth in past five years has also been impressive at 11.3%. In the same period, its EBITDA margins have improved from 15.7% to 19.5%.
Exhibit 42: Trend in Sales volumes Exhibit 43: Trend in value sales
Source: Company, RSec Research
Increasing share of high value PVT and GVT tiles coupled with lower gas prices and higher operating leverage resulted in faster growth in profit vs. growth in revenue. However, Kajaria reported lower growth in FY17 on account of weak consumer demand environment and adverse impact of demonetisation in 2HFY17.
Exhibit 44: Bifrucation between volume and price/mix led growth
Source: Company, RSec Research
We expect Kajaria to post consolidated revenues of Rs28.8bn and Rs33.1bn and net profit of Rs3bn and Rs3.6bn in FY18E and FY19E, respectively. Improved product-mix, higher operating leverage and better volume growth are expected to result in modest improvement in EBITDA margins from 19.5% in FY17 to 20% to FY19E.
Kajaria’s debt equity levels remains pretty benign with significantly high interest coverage ratio. Increasing capacities through the JV model has enabled the Company to manage its capital allocation in a more efficient manner. We expect the debt equity ratio for Kajaria to improve further from 0.2x in FY17 to 0.1x in FY19E. Similarly, the interest coverage ratio is likely to expand from 15times in FY17 to 30.6times in FY19E.
14.8% 14.2% 12.8%9.7%
5.3%
8%
2% 6%
1%
(1%)
(5%)
0%
5%
10%
15%
20%
25%
FY13 FY14 FY15 FY16 FY17
Kajaria Volume growth Price/ Mix growth
39.6
45.5
52.0
58.7
64.3 67.7
30
40
50
60
70
80
FY12 FY13 FY14 FY15 FY16 FY17
Sales volume mn sqm
1,397
1,718
1,993
2,370
2,616 2,716
1,000
1,500
2,000
2,500
3,000
3,500
FY12 FY13 FY14 FY15 FY16 FY17
Sales value
Kajaria CeramicsInitiating Coverage | India
Institutional Equity Research
17
CMP* (Rs) 710
Upside/ (Downside) (%) 21
Bloomberg Ticker KJC IN
BUYTarget Price: Rs861
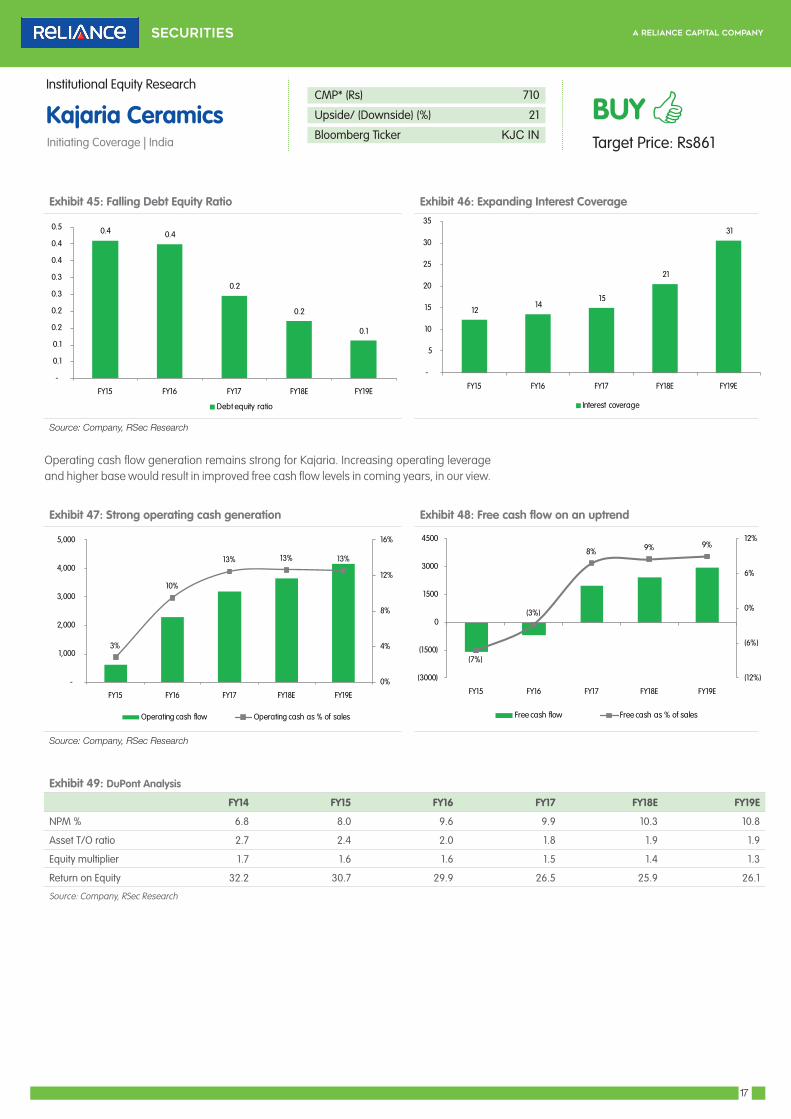
Exhibit 45: Falling Debt Equity Ratio Exhibit 46: Expanding Interest Coverage
Source: Company, RSec Research
Operating cash flow generation remains strong for Kajaria. Increasing operating leverage and higher base would result in improved free cash flow levels in coming years, in our view.
Exhibit 47: Strong operating cash generation Exhibit 48: Free cash flow on an uptrend
Source: Company, RSec Research
Exhibit 49: DuPont Analysis
FY14 FY15 FY16 FY17 FY18E FY19E
NPM % 6.8 8.0 9.6 9.9 10.3 10.8
Asset T/O ratio 2.7 2.4 2.0 1.8 1.9 1.9
Equity multiplier 1.7 1.6 1.6 1.5 1.4 1.3
Return on Equity 32.2 30.7 29.9 26.5 25.9 26.1
Source: Company, RSec Research
12 14
15
21
31
-
5
10
15
20
25
30
35
FY15 FY16 FY17 FY18E FY19E
Interest coverage
0.4 0.4
0.2
0.2
0.1
-
0.1
0.1
0.2
0.2
0.3
0.3
0.4
0.4
0.5
FY15 FY16 FY17 FY18E FY19E
Debt equity ratio
3%
10%
13% 13% 13%
0%
4%
8%
12%
16%
-
1,000
2,000
3,000
4,000
5,000
FY15 FY16 FY17 FY18E FY19E
Operating cash flow Operating cash as % of sales
(7%)
(3%)
8% 9% 9%
(12%)
(6%)
0%
6%
12%
(3000)
(1500)
0
1500
3000
4500
FY15 FY16 FY17 FY18E FY19E
Free cash flow Free cash as % of sales
Kajaria CeramicsInitiating Coverage | India
Institutional Equity Research
18
CMP* (Rs) 710
Upside/ (Downside) (%) 21
Bloomberg Ticker KJC IN
BUYTarget Price: Rs861
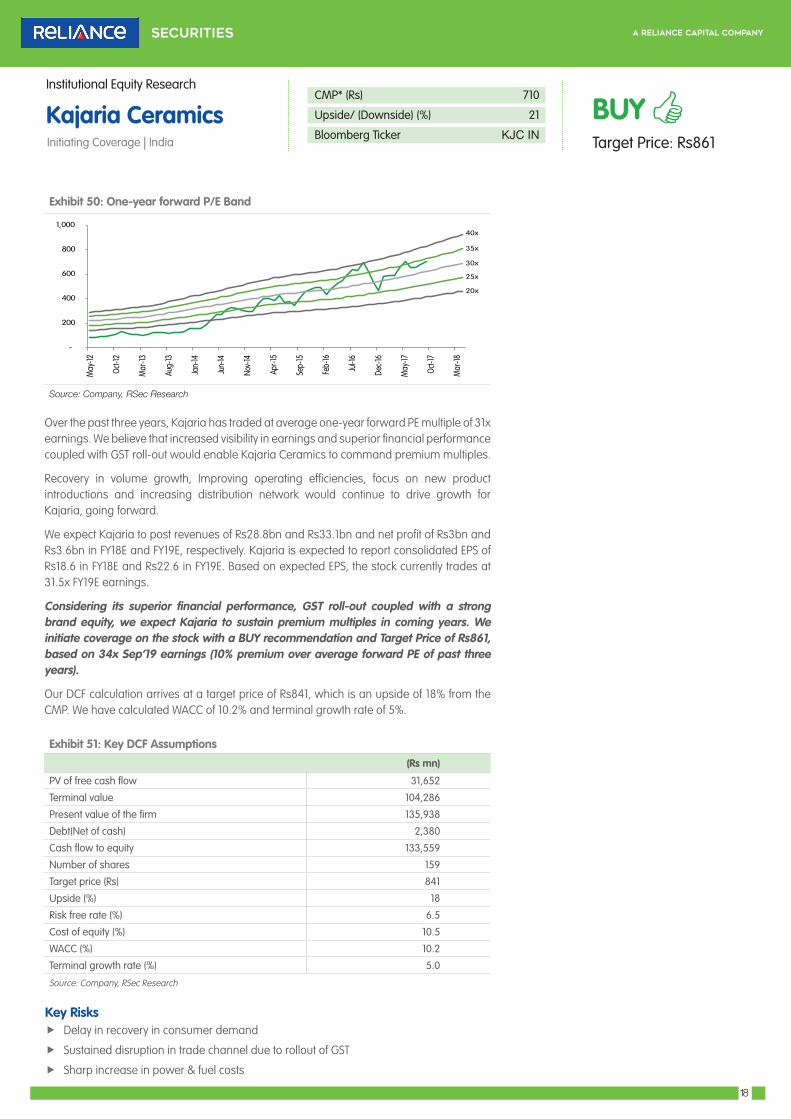
Exhibit 50: One-year forward P/E Band
Source: Company, RSec Research
Over the past three years, Kajaria has traded at average one-year forward PE multiple of 31x earnings. We believe that increased visibility in earnings and superior financial performance coupled with GST roll-out would enable Kajaria Ceramics to command premium multiples.
Recovery in volume growth, Improving operating efficiencies, focus on new product introductions and increasing distribution network would continue to drive growth for Kajaria, going forward.
We expect Kajaria to post revenues of Rs28.8bn and Rs33.1bn and net profit of Rs3bn and Rs3.6bn in FY18E and FY19E, respectively. Kajaria is expected to report consolidated EPS of Rs18.6 in FY18E and Rs22.6 in FY19E. Based on expected EPS, the stock currently trades at 31.5x FY19E earnings.
Considering its superior financial performance, GST roll-out coupled with a strong brand equity, we expect Kajaria to sustain premium multiples in coming years. We initiate coverage on the stock with a BUY recommendation and Target Price of Rs861, based on 34x Sep’19 earnings (10% premium over average forward PE of past three years).
Our DCF calculation arrives at a target price of Rs841, which is an upside of 18% from the CMP. We have calculated WACC of 10.2% and terminal growth rate of 5%.
Exhibit 51: Key DCF Assumptions
(Rs mn)
PV of free cash flow 31,652
Terminal value 104,286
Present value of the firm 135,938
Debt(Net of cash) 2,380
Cash flow to equity 133,559
Number of shares 159
Target price (Rs) 841
Upside (%) 18
Risk free rate (%) 6.5
Cost of equity (%) 10.5
WACC (%) 10.2
Terminal growth rate (%) 5.0
Source: Company, RSec Research
Key Risks f Delay in recovery in consumer demand
f Sustained disruption in trade channel due to rollout of GST
f Sharp increase in power & fuel costs
-
200
400
600
800
1,000
May
-12
Oct-1
2
Mar
-13
Aug-
13
Jan-
14
Jun-
14
Nov -
14
Apr-1
5
Sep-
15
Feb-
16
Jul-1
6
Dec -
16
May
-17
Oct-1
7
Mar
-18
20x
25x
30x
35x
40x
Kajaria CeramicsInitiating Coverage | India
Institutional Equity Research
19
CMP* (Rs) 710
Upside/ (Downside) (%) 21
Bloomberg Ticker KJC IN
BUYTarget Price: Rs861
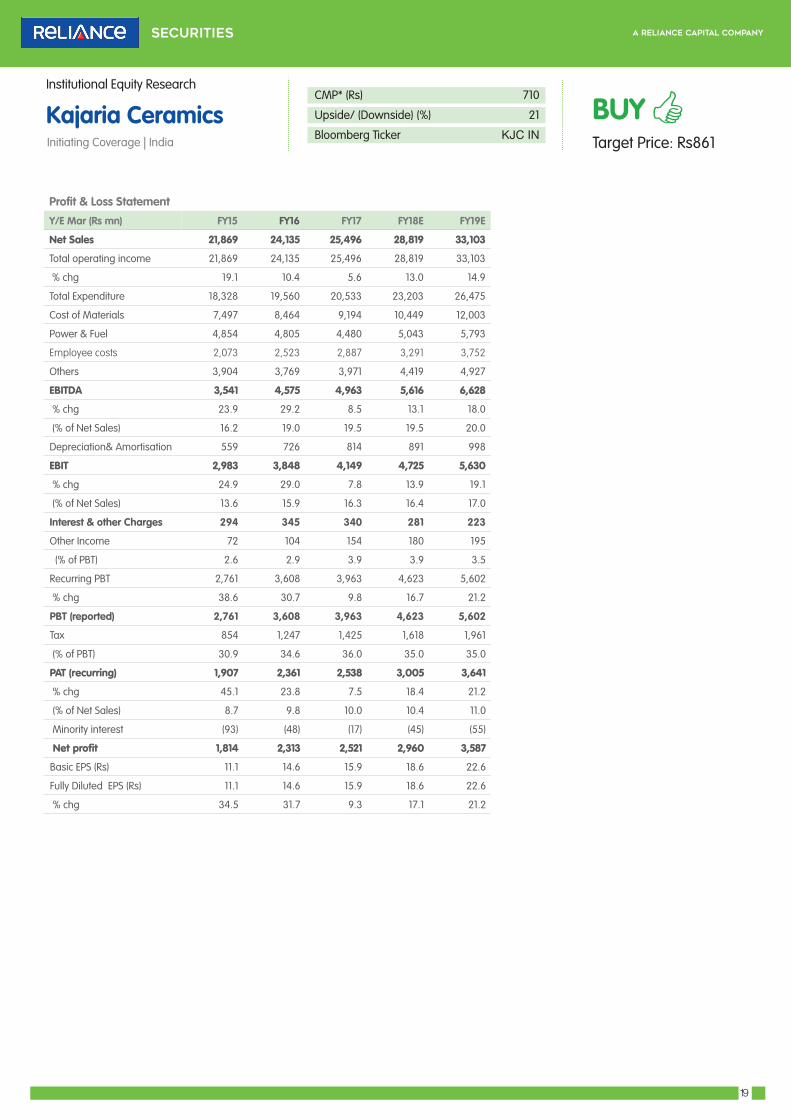
Profit & Loss Statement
Y/E Mar (Rs mn) FY15 FY16 FY17 FY18E FY19E
Net Sales 21,869 24,135 25,496 28,819 33,103
Total operating income 21,869 24,135 25,496 28,819 33,103
% chg 19.1 10.4 5.6 13.0 14.9
Total Expenditure 18,328 19,560 20,533 23,203 26,475
Cost of Materials 7,497 8,464 9,194 10,449 12,003
Power & Fuel 4,854 4,805 4,480 5,043 5,793
Employee costs 2,073 2,523 2,887 3,291 3,752
Others 3,904 3,769 3,971 4,419 4,927
EBITDA 3,541 4,575 4,963 5,616 6,628
% chg 23.9 29.2 8.5 13.1 18.0
(% of Net Sales) 16.2 19.0 19.5 19.5 20.0
Depreciation& Amortisation 559 726 814 891 998
EBIT 2,983 3,848 4,149 4,725 5,630
% chg 24.9 29.0 7.8 13.9 19.1
(% of Net Sales) 13.6 15.9 16.3 16.4 17.0
Interest & other Charges 294 345 340 281 223
Other Income 72 104 154 180 195
(% of PBT) 2.6 2.9 3.9 3.9 3.5
Recurring PBT 2,761 3,608 3,963 4,623 5,602
% chg 38.6 30.7 9.8 16.7 21.2
PBT (reported) 2,761 3,608 3,963 4,623 5,602
Tax 854 1,247 1,425 1,618 1,961
(% of PBT) 30.9 34.6 36.0 35.0 35.0
PAT (recurring) 1,907 2,361 2,538 3,005 3,641
% chg 45.1 23.8 7.5 18.4 21.2
(% of Net Sales) 8.7 9.8 10.0 10.4 11.0
Minority interest (93) (48) (17) (45) (55)
Net profit 1,814 2,313 2,521 2,960 3,587
Basic EPS (Rs) 11.1 14.6 15.9 18.6 22.6
Fully Diluted EPS (Rs) 11.1 14.6 15.9 18.6 22.6
% chg 34.5 31.7 9.3 17.1 21.2

Kajaria CeramicsInitiating Coverage | India
Institutional Equity Research
20
CMP* (Rs) 710
Upside/ (Downside) (%) 21
Bloomberg Ticker KJC IN
BUYTarget Price: Rs861
Balance Sheet
Y/E Mar (Rs mn) FY15 FY16 FY17 FY18E FY19E
Share capital 159 159 159 159 159
Reserves 7,601 9,560 11,592 13,885 16,709
Net worth 7,760 9,719 11,751 14,044 16,868
Total borrowings 3,193 3,891 2,900 2,400 1,900
Minority Interest 625 761 760 805 860
Deferred tax 818 949 1,106 1,290 1,498
Total liabilities 12,395 15,320 16,518 18,539 21,127
Gross block 12,447 15,414 16,618 17,818 19,018
Less: Acc. depreciation 3,846 4,209 4,845 5,736 6,735
Net block 8,601 11,205 11,773 12,082 12,284
CWIP 778 78 83 83 83
Investments 1 1 1 850 1,250
Current assets 6,293 7,897 8,545 9,914 12,552
Inventories 3,033 3,842 3,720 4,323 5,131
Debtors 2,152 2,741 3,389 3,602 3,972
Cash 112 215 520 953 2,260
Other CA 600 762 684 773 888
Loans and advances 396 338 232 262 301
Current liabilities 3,100 3,677 3,678 4,157 4,775
Provisions 177 184 206 232 267
Net current assets 3,016 4,036 4,662 5,524 7,510
Total Assets 12,395 15,320 16,518 18,539 21,127

Kajaria CeramicsInitiating Coverage | India
Institutional Equity Research
21
CMP* (Rs) 710
Upside/ (Downside) (%) 21
Bloomberg Ticker KJC IN
BUYTarget Price: Rs861
Cash Flow Statement
Y/E Mar (Rs mn) FY15 FY16 FY17 FY18E FY19E
Net profit 1,907 2,361 2,538 3,005 3,641
Depn and w/o 559 726 814 891 998
Deferred tax 81 134 161 183 209
Change in working cap (1,932) (916) (321) (429) (680)
Operating cash flow 614 2,304 3,192 3,650 4,169
Capital expenditure (2,204) (2,967) (1,205) (1,200) (1,200)
Investments - - - (849) (400)
Investing cash flow (2,204) (2,967) (1,205) (2,049) (1,600)
Free cash flow (1,590) (663) 1,987 2,450 2,969
Dividend (381) (477) (572) (667) (763)
Debt/Preference shares 1,255 698 (991) (500) (500)
Financing cash flow 873 222 (1,563) (1,167) (1,263)
Others 767 545 (120) - -
Net change in cash 50 104 304 434 1,306
Opening cash 61 112 215 520 953 Closing cash 112 215 520 953 2,260
Key Ratio
Y/E Mar (Rs mn) FY15 FY16 FY17 FY18E FY19E
Valuation Ratio (x)
P/E (on FDEPS) 64.2 48.8 44.6 38.1 31.5
P/CEPS 48.7 37.1 33.8 29.3 24.6
P/BV 14.5 11.6 9.6 8.0 6.7
Dividend yield (%) 0.3 0.4 0.4 0.5 0.6
EV/Sales 5.3 4.8 4.5 4.0 3.4
EV/EBITDA 32.7 25.5 23.2 20.5 17.2
Per Share Data (Rs)
EPS (Basic) 11.1 14.6 15.9 18.6 22.6
Core EPS 11.1 14.6 15.9 18.6 22.6
Cash EPS 14.6 19.1 21.0 24.2 28.9
DPS 2.0 2.5 3.0 3.5 4.0
Book Value 48.8 61.2 74.0 88.4 106.2
Returns (%)
RoCE 39.7 38.1 36.2 37.3 38.8
RoE 30.7 29.9 26.5 25.9 26.1
Turnover ratios (x)
Asset Turnover (Gross Block) 2.4 2.0 1.8 1.9 1.9
Inventory / Sales (days) 51 58 53 55 57
Receivables (days) 36 41 49 46 44
Payables (days) 52 56 53 53 53
Cash conversion cycle (days) 35 44 49 48 48
Kajaria CeramicsInitiating Coverage | India
Institutional Equity Research
22
CMP* (Rs) 710
Upside/ (Downside) (%) 21
Bloomberg Ticker KJC IN
BUYTarget Price: Rs861
Reliance Securities Limited (RSL), the broking arm of Reliance Capital is one of the India’s leading retail broking houses. Reliance Capital is amongst India’s leading and most valuable
financial services companies in the private sector. Reliance Capital has interests in asset management and mutual funds, life and general insurance, commercial finance, equities and
commodities broking, wealth management services, distribution of financial products, private equity, asset reconstruction, proprietary investments and other activities in financial services.
The list of associates of RSL is available on the website www.reliancecapital.co.in . RSL is registered as a Research Analyst under SEBI (Research Analyst) Regulations, 2014
General Disclaimers: This Research Report (hereinafter called ‘Report’) is prepared and distributed by RSL for information purposes only. The recommendations, if any, made herein are
expression of views and/or opinions and should not be deemed or construed to be neither advice for the purpose of purchase or sale of any security, derivatives or any other security
through RSL nor any solicitation or offering of any investment /trading opportunity on behalf of the issuer(s) of the respective security(ies) referred to herein. These information / opinions /
views are not meant to serve as a professional investment guide for the readers. No action is solicited based upon the information provided herein. Recipients of this Report should rely
on information/data arising out of their own investigations. Readers are advised to seek independent professional advice and arrive at an informed trading/investment decision before
executing any trades or making any investments. This Report has been prepared on the basis of publicly available information, internally developed data and other sources believed by
RSL to be reliable. RSL or its directors, employees, affiliates or representatives do not assume any responsibility for, or warrant the accuracy, completeness, adequacy and reliability of such
information / opinions / views. While due care has been taken to ensure that the disclosures and opinions given are fair and reasonable, none of the directors, employees, affiliates or
representatives of RSL shall be liable for any direct, indirect, special, incidental, consequential, punitive or exemplary damages, including lost profits arising in any way whatsoever from
the information / opinions / views contained in this Report.
Risks: Trading and investment in securities are subject to market risks. There are no assurances or guarantees that the objectives of any of trading / investment in securities will be
achieved. The trades/ investments referred to herein may not be suitable to all categories of traders/investors. The names of securities mentioned herein do not in any manner indicate
their prospects or returns. The value of securities referred to herein may be adversely affected by the performance or otherwise of the respective issuer companies, changes in the market
conditions, micro and macro factors and forces affecting capital markets like interest rate risk, credit risk, liquidity risk and reinvestment risk. Derivative products may also be affected by
various risks including but not limited to counter party risk, market risk, valuation risk, liquidity risk and other risks. Besides the price of the underlying asset, volatility, tenor and interest
rates may affect the pricing of derivatives.
Disclaimers in respect of jurisdiction: The possession, circulation and/or distribution of this Report may be restricted or regulated in certain jurisdictions by appropriate laws. No action
has been or will be taken by RSL in any jurisdiction (other than India), where any action for such purpose(s) is required. Accordingly, this Report shall not be possessed, circulated and/
or distributed in any such country or jurisdiction unless such action is in compliance with all applicable laws and regulations of such country or jurisdiction. RSL requires such recipient to
inform himself about and to observe any restrictions at his own expense, without any liability to RSL. Any dispute arising out of this Report shall be subject to the exclusive jurisdiction of
the Courts in India.
Disclosure of Interest: The research analysts who have prepared this Report hereby certify that the views /opinions expressed in this Report are their personal independent views/opinions
in respect of the securities and their respective issuers. None of RSL, research analysts, or their relatives had any known direct /indirect material conflict of interest including any long/short
position(s) in any specific security on which views/opinions have been made in this Report, during its preparation. RSL’s Associates may have other potential/material conflict of interest
with respect to any recommendation and related information and opinions at the time of publication of research report. RSL, its Associates, the research analysts, or their relatives might
have financial interest in the issuer company(ies) of the said securities. RSL or its Associates may have received a compensation from the said issuer company(ies) in last 12 months for the
brokerage or non brokerage services.RSL, its Associates, the research analysts or their relatives have not received any compensation or other benefits directly or indirectly from the said
issuer company(ies) or any third party in last 12 months in any respect whatsoever for preparation of this report.
The research analysts has served as an officer, director or employee of the said issuer company(ies)?: No
RSL, its Associates, the research analysts or their relatives holds ownership of 1% or more, in respect of the said issuer company(ies).?: No
Copyright: The copyright in this Report belongs exclusively to RSL. This Report shall only be read by those persons to whom it has been delivered. No reprinting, reproduction, copying,
distribution of this Report in any manner whatsoever, in whole or in part, is permitted without the prior express written consent of RSL.
RSL’s activities were neither suspended nor have defaulted with any stock exchange with whom RSL is registered. Further, there does not exist any material adverse order/judgments/
strictures assessed by any regulatory, government or public authority or agency or any law enforcing agency in last three years. Further, there does not exist any material enquiry of
whatsoever nature instituted or pending against RSL as on the date of this Report.
Important These disclaimers, risks and other disclosures must be read in conjunction with the information / opinions / views of which they form part of.
RSL CIN: U65990MH2005PLC154052. SEBI registration no. ( Stock Brokers: NSE - INB / INF / INE 231234833; BSE - INB / INF / INE 011234839,
Depository Participants: CDSL IN-DP-257-2016 IN-DP-NSDL-363-2013, Research Analyst: INH000002384); AMFI ARN No.29889.
Rating GuidesRating Expected absolute returns (%) over 12 months
BUY >10%
HOLD -5% to 10%
REDUCE >-5%