Embed Size (px)
Citation preview
INSTITUTIONAL EQUITY RESEARCH
Page | 1 | PHILLIPCAPITAL INDIA RESEARCH
Gold Finance NBFCs All that glitters is gold; gold NBFCs a direct play on upcycle INDIA | NBFC Sector & Initiating Coverage
17 October 2016
Large gold holdings with households make India the biggest gold‐loan market India has the largest gold stock in the world – Indian households hold more than 22,000 metric tonnes of gold, which is more than 10% of the world’s total gold stock. Over the past ten years, the value of gold in India has seen a 13% CAGR, outpacing the country’s real GDP, inflation, and population growth by 6‐12%. Its large household holdings make India one of the largest gold markets, offering huge potential for gold financiers such as Muthoot Finance and Manappuram Finance. Huge untapped potential as the organised segment penetration remains sub‐4% Industry estimates suggest that around 10‐12% of the country’s household gold holdings are pledged. Of this, around 70‐75% is with the unorganised segment and the rest is with organised players such as specialised gold‐loan NBFCs and banks; the latter’s share has been increasing rapidly due to their increased focus on gold loans. The gold‐loan market in India is grossly under‐penetrated (<4%) considering the size of gold holdings with households. This presents significant scope for organised gold‐loan financiers. Gold finance NBFCs are better positioned than banks While banks hold a larger market share of gold financing vs. NBFCs, the latter are better placed on the competition front and are rapidly gaining market share from other organised and unorganised players. The competitive intensity with banks and other non‐specialised NBFCs has subsided over the last couple of years, as many non‐serious players either exited or slowed down considerably due to adverse market conditions. Gold‐finance NBFCs used this period to improve their product structure and business model, which, along with favourable market conditions, augurs well for these companies. Manappuram and Muthoot are direct plays on the gold upcycle Historically, Muthoot and Manappuram’s balance sheets have shown a high correlation to gold price movements (coefficient of 0.97x over FY07‐12). While gold prices’ CAGR was 21% over FY07‐12, these players’ aggregate AUM CAGR was 80%. FY12‐14 saw balance sheet erosion for both companies led by regulatory tightening by the RBI and a sharp fall in gold prices. However, with gold prices in a strong uptrend for the last nine months, we expect Gold loan AUMs of both companies to rebound – at a CAGR of 25% over FY16‐19. Valuations to track balance‐sheet growth Historical evidence shows that the valuation of niche NBFCs (CIFC, SHTF, SCUF, MMFS) has tracked their balance‐sheet growth. We expect both Manappuram and Muthoot to see more than 25‐35% CAGR in FY16‐19, aided by firm gold prices, changed product structure, and diversification. Hence, we believe that despite 2‐3x growth in MAGFIL’s/ Muthoot’s market capitalization over the last one year, they are still very attractive opportunities for long term investment. When seen in isolation too, MAGFIL’s/ Muthoot’s valuations at 2.1x/ 1.9x FY18E BV are extremely attractive considering robust RoEs of 20‐22%. We initiate coverage on both with Buy Ratings.
Companies MANAPPURAM FINANCE Reco BUY CMP, Rs 94 Target Price, Rs 130 Upside (%) 37 MUTHOOT FINANCE Reco BUY CMP, Rs 350 Target Price, Rs 450 Upside (%) 29 Pradeep Agrawal (+ 9122 6667 9953) [email protected] Manish Agarwalla (+ 9122 6667 9962) [email protected]
Peer Valuation CMP Reco Target MCAP ______RoA (%)______ ______RoE (%)______ ______ABV (Rs)______ ______P/ABV (x)______(Rs) Price (Rs) Rs bn FY16 FY17E FY18E FY16 FY17E FY18E FY16 FY17E FY18E FY16 FY17E FY18E
Manappuram Finance 94.5 BUY 130 79 2.9 4.5 4.9 12.6 20.1 22.3 32.5 37.9 45.5 2.9 2.5 2.1Muthoot Finance 350 BUY 450 140 3.0 3.6 3.8 15.1 17.8 19.8 140.8 160.6 187.7 2.5 2.2 1.9
Source: Company, PhillipCapital India Research
Page | 2 | PHILLIPCAPITAL INDIA RESEARCH
NBFC SECTOR
Table of Contents
Industry ∙∙∙∙∙∙∙∙∙∙∙∙∙∙∙∙∙∙∙∙∙∙∙∙∙∙∙∙∙∙∙∙∙∙∙∙∙∙∙∙∙∙∙∙∙∙∙∙∙∙∙∙∙∙∙∙∙∙∙∙∙∙∙∙∙∙∙∙∙∙∙∙∙∙∙∙∙∙∙∙∙∙∙∙∙∙∙∙∙∙∙∙∙∙∙∙∙∙∙∙∙∙∙∙∙∙∙∙∙∙∙∙∙∙∙∙∙∙∙∙∙∙∙∙∙∙∙∙∙∙∙∙∙∙∙∙∙∙∙∙ 3
Large household holdings make India a big market for gold‐loan financiers ∙∙∙∙∙∙∙∙∙∙∙∙∙∙∙∙∙∙∙∙∙∙∙∙∙∙∙∙ 3
Huge untapped potential as organised‐segment penetration remains below 4% ∙∙∙∙∙∙∙∙∙∙∙∙∙∙∙∙∙∙∙∙ 3
Gold‐finance NBFCs are better positioned than banks ∙∙∙∙∙∙∙∙∙∙∙∙∙∙∙∙∙∙∙∙∙∙∙∙∙∙∙∙∙∙∙∙∙∙∙∙∙∙∙∙∙∙∙∙∙∙∙∙∙∙∙∙∙∙∙∙∙∙∙∙∙∙∙ 4
Stable gold prices bode well for gold NBFCs – a direct play on the gold upcycle ∙∙∙∙∙∙∙∙∙∙∙∙∙∙∙∙∙∙∙∙∙∙ 4
Regulatory overhang behind; gold‐loan NBFC have started gaining lost ground ∙∙∙∙∙∙∙∙∙∙∙∙∙∙∙∙∙∙∙∙∙∙∙ 4
Valuations to track balance‐sheet growth ∙∙∙∙∙∙∙∙∙∙∙∙∙∙∙∙∙∙∙∙∙∙∙∙∙∙∙∙∙∙∙∙∙∙∙∙∙∙∙∙∙∙∙∙∙∙∙∙∙∙∙∙∙∙∙∙∙∙∙∙∙∙∙∙∙∙∙∙∙∙∙∙∙∙∙∙∙∙∙∙∙∙ 5
Companies Section
Manapuram Finance ∙∙∙∙∙∙∙∙∙∙∙∙∙∙∙∙∙∙∙∙∙∙∙∙∙∙∙∙∙∙∙∙∙∙∙∙∙∙∙∙∙∙∙∙∙∙∙∙∙∙∙∙∙∙∙∙∙∙∙∙∙∙∙∙∙∙∙∙∙∙∙∙∙∙∙∙∙∙∙∙∙∙∙∙∙∙∙∙∙∙∙∙∙∙∙∙∙∙∙∙∙∙∙∙∙∙∙∙∙∙∙∙∙∙∙∙∙∙∙ 9
Muthoot Finance ∙∙∙∙∙∙∙∙∙∙∙∙∙∙∙∙∙∙∙∙∙∙∙∙∙∙∙∙∙∙∙∙∙∙∙∙∙∙∙∙∙∙∙∙∙∙∙∙∙∙∙∙∙∙∙∙∙∙∙∙∙∙∙∙∙∙∙∙∙∙∙∙∙∙∙∙∙∙∙∙∙∙∙∙∙∙∙∙∙∙∙∙∙∙∙∙∙∙∙∙∙∙∙∙∙∙∙∙∙∙∙∙∙∙∙∙∙∙∙∙∙∙∙∙ 17
Page | 3 | PHILLIPCAPITAL INDIA RESEARCH
NBFC SECTOR
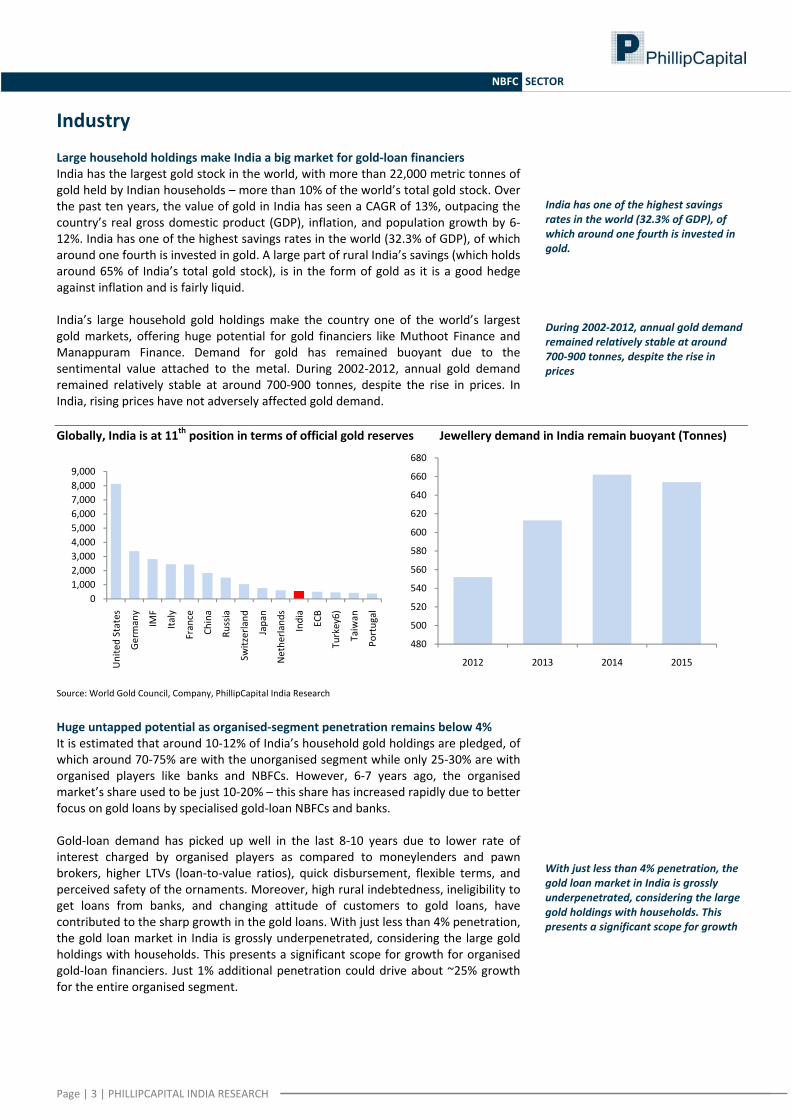
Industry Large household holdings make India a big market for gold‐loan financiers India has the largest gold stock in the world, with more than 22,000 metric tonnes of gold held by Indian households – more than 10% of the world’s total gold stock. Over the past ten years, the value of gold in India has seen a CAGR of 13%, outpacing the country’s real gross domestic product (GDP), inflation, and population growth by 6‐12%. India has one of the highest savings rates in the world (32.3% of GDP), of which around one fourth is invested in gold. A large part of rural India’s savings (which holds around 65% of India’s total gold stock), is in the form of gold as it is a good hedge against inflation and is fairly liquid. India’s large household gold holdings make the country one of the world’s largest gold markets, offering huge potential for gold financiers like Muthoot Finance and Manappuram Finance. Demand for gold has remained buoyant due to the sentimental value attached to the metal. During 2002‐2012, annual gold demand remained relatively stable at around 700‐900 tonnes, despite the rise in prices. In India, rising prices have not adversely affected gold demand. Globally, India is at 11th position in terms of official gold reserves Jewellery demand in India remain buoyant (Tonnes)
Source: World Gold Council, Company, PhillipCapital India Research
Huge untapped potential as organised‐segment penetration remains below 4% It is estimated that around 10‐12% of India’s household gold holdings are pledged, of which around 70‐75% are with the unorganised segment while only 25‐30% are with organised players like banks and NBFCs. However, 6‐7 years ago, the organised market’s share used to be just 10‐20% – this share has increased rapidly due to better focus on gold loans by specialised gold‐loan NBFCs and banks. Gold‐loan demand has picked up well in the last 8‐10 years due to lower rate of interest charged by organised players as compared to moneylenders and pawn brokers, higher LTVs (loan‐to‐value ratios), quick disbursement, flexible terms, and perceived safety of the ornaments. Moreover, high rural indebtedness, ineligibility to get loans from banks, and changing attitude of customers to gold loans, have contributed to the sharp growth in the gold loans. With just less than 4% penetration, the gold loan market in India is grossly underpenetrated, considering the large gold holdings with households. This presents a significant scope for growth for organised gold‐loan financiers. Just 1% additional penetration could drive about ~25% growth for the entire organised segment.
01,0002,0003,0004,0005,0006,0007,0008,0009,000
United States
Germany
IMF
Italy
France
China
Russia
Switzerland
Japan
Nethe
rland
s
India
ECB
Turkey6)
Taiwan
Portugal
480
500
520
540
560
580
600
620
640
660
680
2012 2013 2014 2015
India has one of the highest savings rates in the world (32.3% of GDP), of which around one fourth is invested in gold.
During 2002‐2012, annual gold demand remained relatively stable at around 700‐900 tonnes, despite the rise in prices
With just less than 4% penetration, the gold loan market in India is grossly underpenetrated, considering the large gold holdings with households. This presents a significant scope for growth
Page | 4 | PHILLIPCAPITAL INDIA RESEARCH
NBFC SECTOR
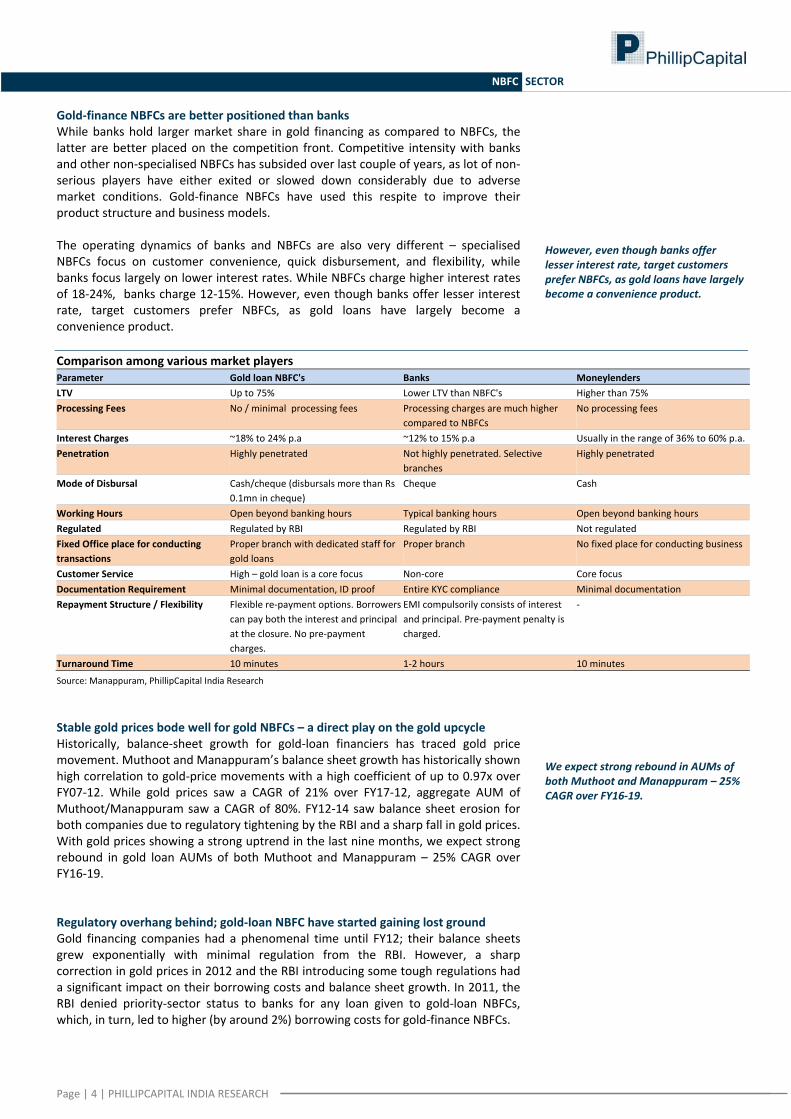
Gold‐finance NBFCs are better positioned than banks While banks hold larger market share in gold financing as compared to NBFCs, the latter are better placed on the competition front. Competitive intensity with banks and other non‐specialised NBFCs has subsided over last couple of years, as lot of non‐serious players have either exited or slowed down considerably due to adverse market conditions. Gold‐finance NBFCs have used this respite to improve their product structure and business models. The operating dynamics of banks and NBFCs are also very different – specialised NBFCs focus on customer convenience, quick disbursement, and flexibility, while banks focus largely on lower interest rates. While NBFCs charge higher interest rates of 18‐24%, banks charge 12‐15%. However, even though banks offer lesser interest rate, target customers prefer NBFCs, as gold loans have largely become a convenience product. Comparison among various market players Parameter Gold loan NBFC's Banks Moneylenders LTV Up to 75% Lower LTV than NBFC's Higher than 75% Processing Fees No / minimal processing fees Processing charges are much higher
compared to NBFCs No processing fees
Interest Charges ~18% to 24% p.a ~12% to 15% p.a Usually in the range of 36% to 60% p.a.Penetration Highly penetrated Not highly penetrated. Selective
branches Highly penetrated
Mode of Disbursal Cash/cheque (disbursals more than Rs 0.1mn in cheque)
Cheque Cash
Working Hours Open beyond banking hours Typical banking hours Open beyond banking hours Regulated Regulated by RBI Regulated by RBI Not regulated Fixed Office place for conducting transactions
Proper branch with dedicated staff for gold loans
Proper branch No fixed place for conducting business
Customer Service High – gold loan is a core focus Non‐core Core focus Documentation Requirement Minimal documentation, ID proof Entire KYC compliance Minimal documentation Repayment Structure / Flexibility Flexible re‐payment options. Borrowers
can pay both the interest and principal at the closure. No pre‐payment charges.
EMI compulsorily consists of interest and principal. Pre‐payment penalty is charged.
‐
Turnaround Time 10 minutes 1‐2 hours 10 minutes
Source: Manappuram, PhillipCapital India Research Stable gold prices bode well for gold NBFCs – a direct play on the gold upcycle Historically, balance‐sheet growth for gold‐loan financiers has traced gold price movement. Muthoot and Manappuram’s balance sheet growth has historically shown high correlation to gold‐price movements with a high coefficient of up to 0.97x over FY07‐12. While gold prices saw a CAGR of 21% over FY17‐12, aggregate AUM of Muthoot/Manappuram saw a CAGR of 80%. FY12‐14 saw balance sheet erosion for both companies due to regulatory tightening by the RBI and a sharp fall in gold prices. With gold prices showing a strong uptrend in the last nine months, we expect strong rebound in gold loan AUMs of both Muthoot and Manappuram – 25% CAGR over FY16‐19. Regulatory overhang behind; gold‐loan NBFC have started gaining lost ground Gold financing companies had a phenomenal time until FY12; their balance sheets grew exponentially with minimal regulation from the RBI. However, a sharp correction in gold prices in 2012 and the RBI introducing some tough regulations had a significant impact on their borrowing costs and balance sheet growth. In 2011, the RBI denied priority‐sector status to banks for any loan given to gold‐loan NBFCs, which, in turn, led to higher (by around 2%) borrowing costs for gold‐finance NBFCs.
However, even though banks offer lesser interest rate, target customers prefer NBFCs, as gold loans have largely become a convenience product.
We expect strong rebound in AUMs of both Muthoot and Manappuram – 25% CAGR over FY16‐19.
Page | 5 | PHILLIPCAPITAL INDIA RESEARCH
NBFC SECTOR
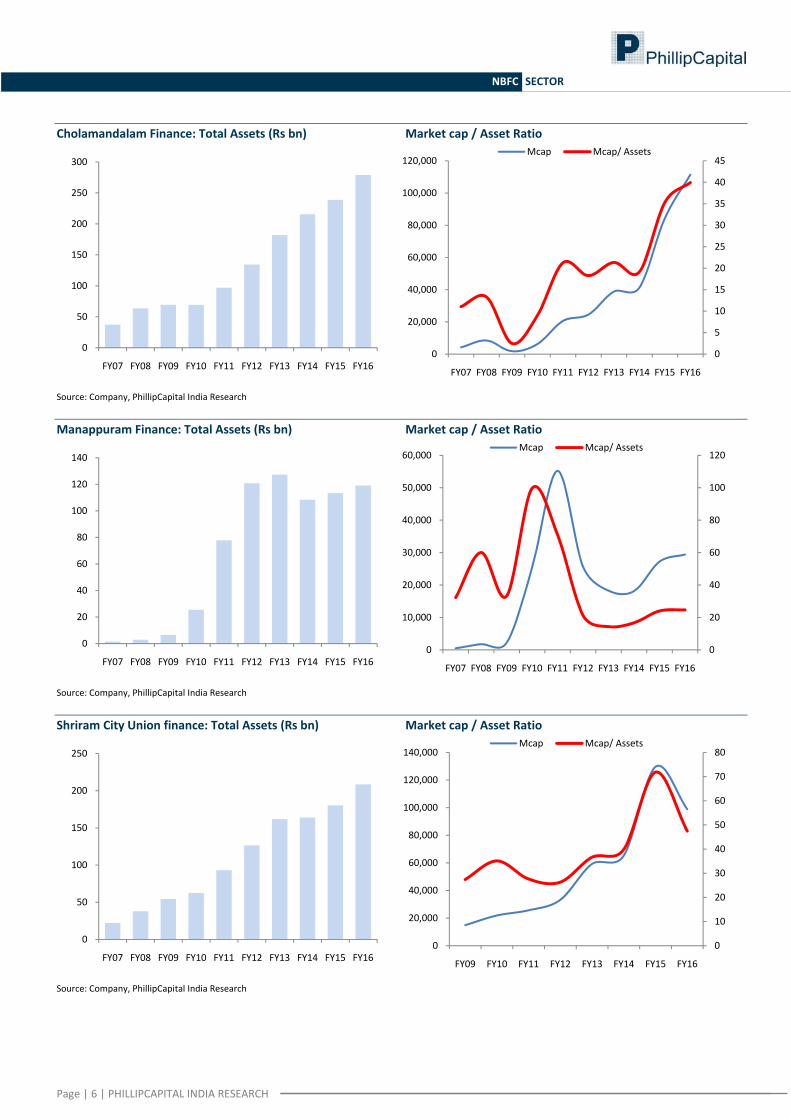
Also in 2012, the RBI reduced the limit for banks to lend to a single NBFC in the gold‐loan business to 7.5% from 10%. Another major blow came in March 2012, when the RBI capped maximum LTV at 60%. Lower LTVs, along with softening gold prices, led to significant portfolio erosion for Muthoot and Manappuram, as customers turned to banks and unorganised sectors, where there were no LTV limits. The market share of specialised gold‐loan NBFCs fell to 31% in FY13 from a high of 36.5% in FY12 – it declined further to 27.6% in FY14. Sharp deterioration in business compelled Gold loan NBFCs to reconsider their strategies and rework their business plans. They regained some of the lost ground – by FY15, they had clawed back a market share of 29.4%. Today, with a stable regulatory regime and gold prices holding firm, these NBFCs seem poised for healthy growth. Manappuram expects gold prices to be relatively stable in FY17, at US$ 1,200‐1,400 per troy ounce. Valuations to track balance‐sheet growth Historical evidence suggests that valuations of niche NBFCs such as Cholamandalam, Shriram Transport, Shriram City Union, and Mahindra Finance have tracked their balance‐sheet growth. We expect both Manappuram and Muthoot to see more than 25‐35% CAGR in FY16‐19, aided by firm gold prices, changed product structure, and diversification. Hence, we believe that despite 2‐3x growth in MAGFIL’s/ Muthoot market capitalization over the last one year, it is still a very attractive opportunity for long term investment. When seen in isolation too, MAGFIL’s/ Muthoot valuations at 2.1x/ 1.9x FY18E BV are extremely attractive looking at robust RoEs of 20‐22%.
Manappuram and Muthoot are likely to see more than 25‐30% CAGR in FY16‐19, aided by firm gold prices, changed product structure, and diversification.
The market share of specialised gold‐loan NBFCs fell to 31% in FY13 from a high of 36.5% in FY12 – it declined further to 27.6% in FY14.
Page | 6 | PHILLIPCAPITAL INDIA RESEARCH
NBFC SECTOR
Cholamandalam Finance: Total Assets (Rs bn) Market cap / Asset Ratio
Source: Company, PhillipCapital India Research Manappuram Finance: Total Assets (Rs bn) Market cap / Asset Ratio
Source: Company, PhillipCapital India Research Shriram City Union finance: Total Assets (Rs bn) Market cap / Asset Ratio
Source: Company, PhillipCapital India Research
0
50
100
150
200
250
300
FY07 FY08 FY09 FY10 FY11 FY12 FY13 FY14 FY15 FY160
5
10
15
20
25
30
35
40
45
0
20,000
40,000
60,000
80,000
100,000
120,000
FY07 FY08 FY09 FY10 FY11 FY12 FY13 FY14 FY15 FY16
Mcap Mcap/ Assets
0
20
40
60
80
100
120
140
FY07 FY08 FY09 FY10 FY11 FY12 FY13 FY14 FY15 FY160
20
40
60
80
100
120
0
10,000
20,000
30,000
40,000
50,000
60,000
FY07 FY08 FY09 FY10 FY11 FY12 FY13 FY14 FY15 FY16
Mcap Mcap/ Assets
0
50
100
150
200
250
FY07 FY08 FY09 FY10 FY11 FY12 FY13 FY14 FY15 FY160
10
20
30
40
50
60
70
80
0
20,000
40,000
60,000
80,000
100,000
120,000
140,000
FY09 FY10 FY11 FY12 FY13 FY14 FY15 FY16
Mcap Mcap/ Assets

Page | 7 | PHILLIPCAPITAL INDIA RESEARCH
NBFC SECTOR
Mahindra Finance: Total Assets (Rs bn) Market cap / Asset Ratio
Source: Company, PhillipCapital India Research Muthoot Finance: Total Assets (Rs bn) Market cap / Asset Ratio
Source: Company, PhillipCapital India Research Shriram Transport Finance: Total Assets (Rs bn) Market cap / Asset Ratio
Source: Company, PhillipCapital India Research
0
50
100
150
200
250
300
350
400
450
FY07 FY08 FY09 FY10 FY11 FY12 FY13 FY14 FY15 FY160
10000
20000
30000
40000
50000
60000
70000
0
20,000
40,000
60,000
80,000
100,000
120,000
140,000
160,000
FY07 FY08 FY09 FY10 FY11 FY12 FY13 FY14 FY15 FY16
Mcap Mcap/ Assets
0
50
100
150
200
250
300
350
FY07 FY08 FY09 FY10 FY11 FY12 FY13 FY14 FY15 FY160
5000
10000
15000
20000
25000
30000
35000
0
10,000
20,000
30,000
40,000
50,000
60,000
70,000
80,000
90,000
FY12 FY13 FY14 FY15 FY16
Mcap Mcap/ Assets
0
100
200
300
400
500
600
700
800
FY07 FY08 FY09 FY10 FY11 FY12 FY13 FY14 FY15 FY160
10000
20000
30000
40000
50000
60000
0
50,000
100,000
150,000
200,000
250,000
300,000
FY09 FY10 FY11 FY12 FY13 FY14 FY15 FY16
Mcap Mcap/ Assets

Page | 8 | PHILLIPCAPITAL INDIA RESEARCH
NBFC SECTOR
Compa
nies Sectio
n
INSTITUTIONAL EQUITY RESEARCH
Page | 9 | PHILLIPCAPITAL INDIA RESEARCH
Manappuram Finance (MGFL IN) What doesn’t kill you makes you stronger INDIA | NBFCs | Initiating coverage
17 October 2016
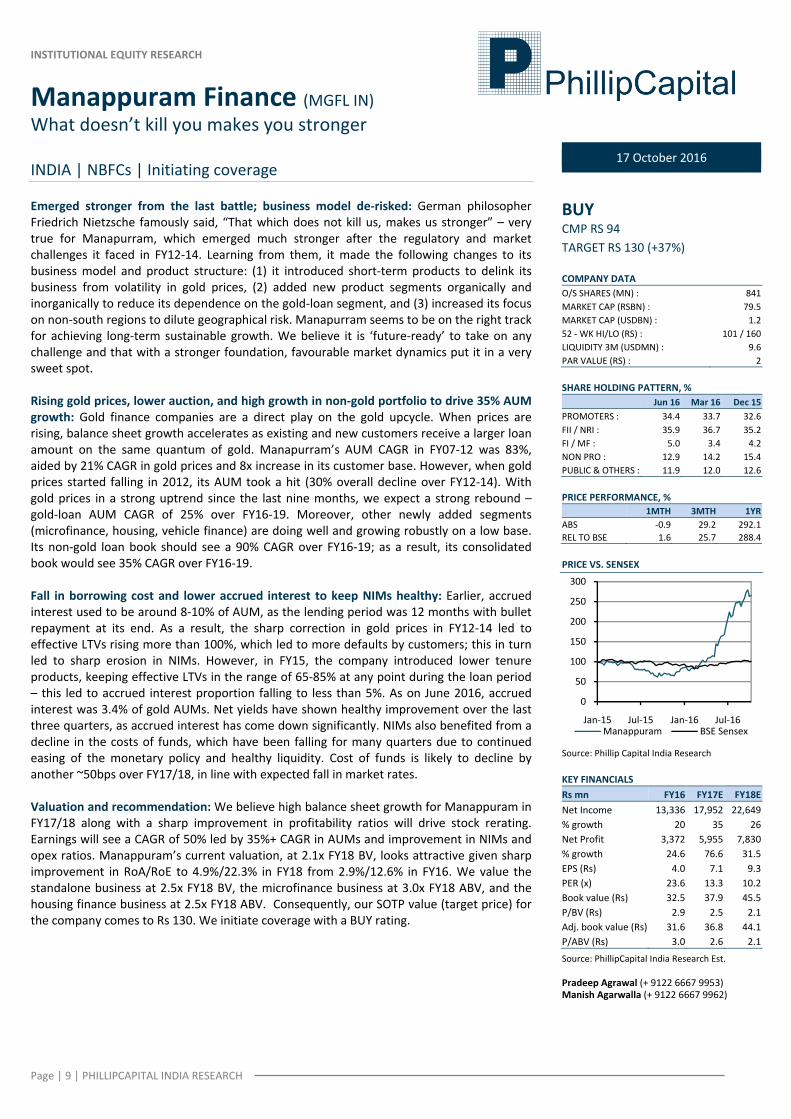
Emerged stronger from the last battle; business model de‐risked: German philosopher Friedrich Nietzsche famously said, “That which does not kill us, makes us stronger” – very true for Manapurram, which emerged much stronger after the regulatory and market challenges it faced in FY12‐14. Learning from them, it made the following changes to its business model and product structure: (1) it introduced short‐term products to delink its business from volatility in gold prices, (2) added new product segments organically and inorganically to reduce its dependence on the gold‐loan segment, and (3) increased its focus on non‐south regions to dilute geographical risk. Manapurram seems to be on the right track for achieving long‐term sustainable growth. We believe it is ‘future‐ready’ to take on any challenge and that with a stronger foundation, favourable market dynamics put it in a very sweet spot. Rising gold prices, lower auction, and high growth in non‐gold portfolio to drive 35% AUM growth: Gold finance companies are a direct play on the gold upcycle. When prices are rising, balance sheet growth accelerates as existing and new customers receive a larger loan amount on the same quantum of gold. Manapurram’s AUM CAGR in FY07‐12 was 83%, aided by 21% CAGR in gold prices and 8x increase in its customer base. However, when gold prices started falling in 2012, its AUM took a hit (30% overall decline over FY12‐14). With gold prices in a strong uptrend since the last nine months, we expect a strong rebound – gold‐loan AUM CAGR of 25% over FY16‐19. Moreover, other newly added segments (microfinance, housing, vehicle finance) are doing well and growing robustly on a low base. Its non‐gold loan book should see a 90% CAGR over FY16‐19; as a result, its consolidated book would see 35% CAGR over FY16‐19. Fall in borrowing cost and lower accrued interest to keep NIMs healthy: Earlier, accrued interest used to be around 8‐10% of AUM, as the lending period was 12 months with bullet repayment at its end. As a result, the sharp correction in gold prices in FY12‐14 led to effective LTVs rising more than 100%, which led to more defaults by customers; this in turn led to sharp erosion in NIMs. However, in FY15, the company introduced lower tenure products, keeping effective LTVs in the range of 65‐85% at any point during the loan period – this led to accrued interest proportion falling to less than 5%. As on June 2016, accrued interest was 3.4% of gold AUMs. Net yields have shown healthy improvement over the last three quarters, as accrued interest has come down significantly. NIMs also benefited from a decline in the costs of funds, which have been falling for many quarters due to continued easing of the monetary policy and healthy liquidity. Cost of funds is likely to decline by another ~50bps over FY17/18, in line with expected fall in market rates. Valuation and recommendation: We believe high balance sheet growth for Manappuram in FY17/18 along with a sharp improvement in profitability ratios will drive stock rerating. Earnings will see a CAGR of 50% led by 35%+ CAGR in AUMs and improvement in NIMs and opex ratios. Manappuram’s current valuation, at 2.1x FY18 BV, looks attractive given sharp improvement in RoA/RoE to 4.9%/22.3% in FY18 from 2.9%/12.6% in FY16. We value the standalone business at 2.5x FY18 BV, the microfinance business at 3.0x FY18 ABV, and the housing finance business at 2.5x FY18 ABV. Consequently, our SOTP value (target price) for the company comes to Rs 130. We initiate coverage with a BUY rating.
BUY CMP RS 94 TARGET RS 130 (+37%) COMPANY DATA O/S SHARES (MN) : 841MARKET CAP (RSBN) : 79.5MARKET CAP (USDBN) : 1.252 ‐ WK HI/LO (RS) : 101 / 160LIQUIDITY 3M (USDMN) : 9.6PAR VALUE (RS) : 2 SHARE HOLDING PATTERN, % Jun 16 Mar 16 Dec 15PROMOTERS : 34.4 33.7 32.6FII / NRI : 35.9 36.7 35.2FI / MF : 5.0 3.4 4.2NON PRO : 12.9 14.2 15.4PUBLIC & OTHERS : 11.9 12.0 12.6 PRICE PERFORMANCE, %
1MTH 3MTH 1YRABS ‐0.9 29.2 292.1REL TO BSE 1.6 25.7 288.4 PRICE VS. SENSEX
Source: Phillip Capital India Research KEY FINANCIALS Rs mn FY16 FY17E FY18ENet Income 13,336 17,952 22,649% growth 20 35 26Net Profit 3,372 5,955 7,830% growth 24.6 76.6 31.5EPS (Rs) 4.0 7.1 9.3PER (x) 23.6 13.3 10.2Book value (Rs) 32.5 37.9 45.5P/BV (Rs) 2.9 2.5 2.1Adj. book value (Rs) 31.6 36.8 44.1P/ABV (Rs) 3.0 2.6 2.1
Source: PhillipCapital India Research Est. Pradeep Agrawal (+ 9122 6667 9953) Manish Agarwalla (+ 9122 6667 9962)
0
50
100
150
200
250
300
Jan‐15 Jul‐15 Jan‐16 Jul‐16Manappuram BSE Sensex
Page | 10 | PHILLIPCAPITAL INDIA RESEARCH
MANAPPURAM FINANCE LTD INITIATING COVERAGE
Emerged stronger; business model de‐risked Manapurram fought tough battles on many fronts (including regulatory) for almost two years (FY12‐14). This weakened the company greatly, as not only did its balance sheet erode quite a lot, but it also put a question mark on the sustainability of its business model. Learning from challenges, Manapurram changed its business model and product structure. It: (1) introduced short‐term products to delink its business from volatility in gold prices, (2) added new product segments organically and inorganically to reduce its dependence on the gold‐loan segment, and (3) increased its focus on non‐south regions to dilute geographical risk. It has made these changes over FY15‐16 and the results have been inspiring. It seems to be on track to achieve its objective of long‐term sustainable growth. We believe it is ‘future ready’ to take on any challenge. Moreover, with a stronger foundation, favourable market dynamics put it in a very sweet spot. New product structure makes business less vulnerable to gold price movements Over FY15‐16, Manapurram introduced short duration products of 3‐6 months and also adjusted the LTVs based on loan tenure, with the highest LTV of 75% on a three‐month loan and lowest LTV of 60% on a 12‐month loan. Its objective was to protect its business from volatility in gold prices and drive volume growth. Before FY12, it was offering 12‐month loans with LTVs of up to 85%. This combination of high LTVs and long‐tenure products worked well for the company until FY12, as gold prices were on an uptrend from 2008 until 2012. However, with a fall in gold prices and the RBI suddenly tightening norms in 2012, the company was caught off guard. The turn of events had a significant impact on its asset quality and growth. While its GNPA increased to 2% in September 2014 from just 0.6% in FY12, AUMs declined 30% over FY12‐14 vs. +96% CAGR over FY08‐12. Its new products are well accepted by customers, evident from the increased share of these products in its total portfolio. Currently almost 90% of the company’s entire portfolio is into short‐term buckets of 3‐6 months, which makes them relatively immune to any corrections in gold prices. In the current product structure, even if gold prices were to fall by ~20% within three months to a year, Manapurram would have enough collateral to recover its principal as well as interest dues by auctioning the underlying collateral. Focus shifted to lower tenure products after the last down‐cycle (FY12‐14) Product Features Earlier Now Duration 12 Months 3 Months 6 Month 9 Months 12 MonthsLTV 75% 75% 70% 65% 60%Loss given default Medium Negligible Negligible Negligible Negligible
Source: Company, PhillipCapital India Research
Learning from challenges, Manapurram changed its business model and product structure
With a stronger foundation, favourable market dynamics put it in a very sweet spot
Manapurram introduced short duration products of 3‐6 months to protect its business from volatility in gold prices and drive volume growth
Page | 11 | PHILLIPCAPITAL INDIA RESEARCH
MANAPPURAM FINANCE LTD INITIATING COVERAGE
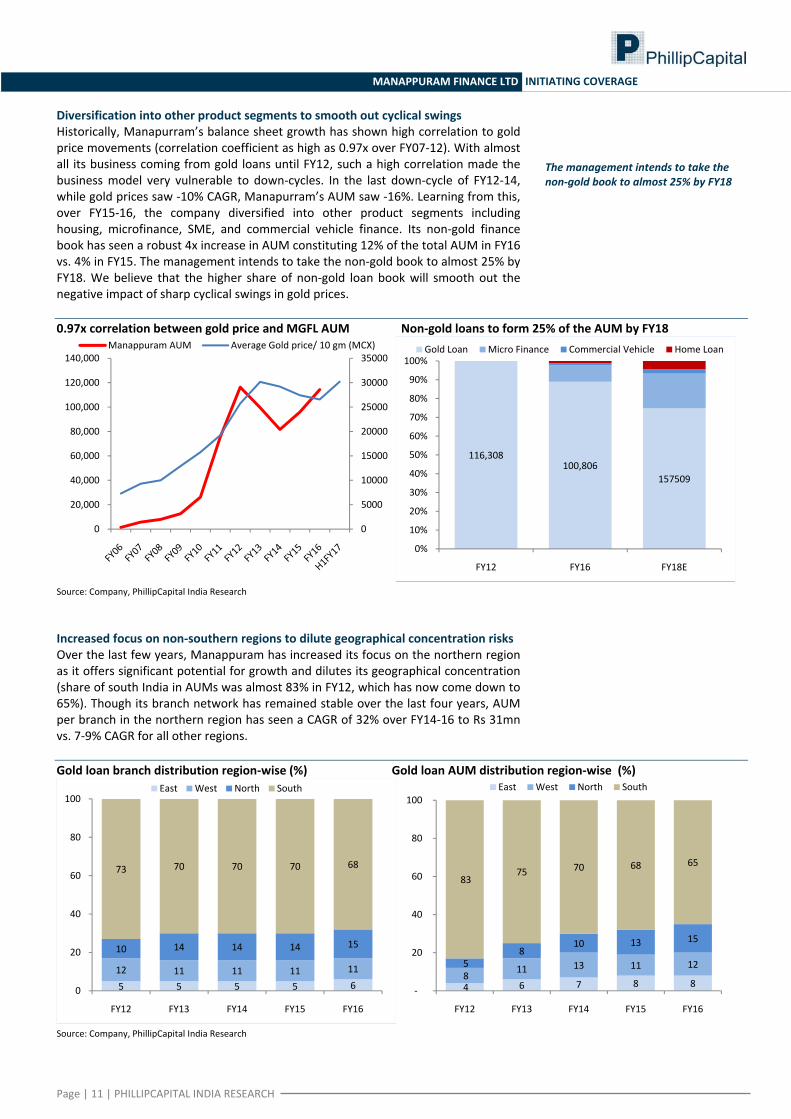
Diversification into other product segments to smooth out cyclical swings Historically, Manapurram’s balance sheet growth has shown high correlation to gold price movements (correlation coefficient as high as 0.97x over FY07‐12). With almost all its business coming from gold loans until FY12, such a high correlation made the business model very vulnerable to down‐cycles. In the last down‐cycle of FY12‐14, while gold prices saw ‐10% CAGR, Manapurram’s AUM saw ‐16%. Learning from this, over FY15‐16, the company diversified into other product segments including housing, microfinance, SME, and commercial vehicle finance. Its non‐gold finance book has seen a robust 4x increase in AUM constituting 12% of the total AUM in FY16 vs. 4% in FY15. The management intends to take the non‐gold book to almost 25% by FY18. We believe that the higher share of non‐gold loan book will smooth out the negative impact of sharp cyclical swings in gold prices. 0.97x correlation between gold price and MGFL AUM Non‐gold loans to form 25% of the AUM by FY18
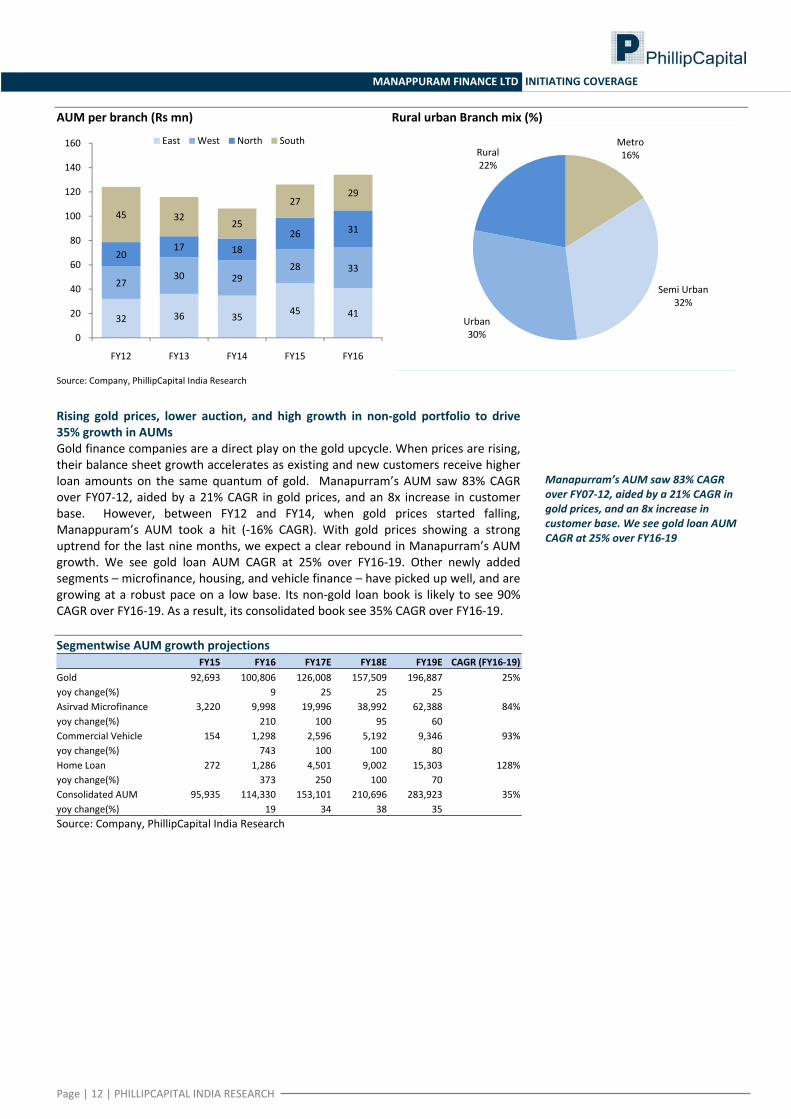
Source: Company, PhillipCapital India Research Increased focus on non‐southern regions to dilute geographical concentration risks Over the last few years, Manappuram has increased its focus on the northern region as it offers significant potential for growth and dilutes its geographical concentration (share of south India in AUMs was almost 83% in FY12, which has now come down to 65%). Though its branch network has remained stable over the last four years, AUM per branch in the northern region has seen a CAGR of 32% over FY14‐16 to Rs 31mn vs. 7‐9% CAGR for all other regions. Gold loan branch distribution region‐wise (%) Gold loan AUM distribution region‐wise (%)
Source: Company, PhillipCapital India Research
0
5000
10000
15000
20000
25000
30000
35000
0
20,000
40,000
60,000
80,000
100,000
120,000
140,000Manappuram AUM Average Gold price/ 10 gm (MCX)
116,308100,806
157509
0%
10%
20%
30%
40%
50%
60%
70%
80%
90%
100%
FY12 FY16 FY18E
Gold Loan Micro Finance Commercial Vehicle Home Loan
5 5 5 5 612 11 11 11 11
10 14 14 14 15
73 70 70 70 68
0
20
40
60
80
100
FY12 FY13 FY14 FY15 FY16
East West North South
4 6 7 8 88
11 13 11 125 8
10 13 15
83 75 70 68 65
‐
20
40
60
80
100
FY12 FY13 FY14 FY15 FY16
East West North South
The management intends to take the non‐gold book to almost 25% by FY18
Page | 12 | PHILLIPCAPITAL INDIA RESEARCH
MANAPPURAM FINANCE LTD INITIATING COVERAGE
AUM per branch (Rs mn) Rural urban Branch mix (%)
Source: Company, PhillipCapital India Research
Rising gold prices, lower auction, and high growth in non‐gold portfolio to drive 35% growth in AUMs Gold finance companies are a direct play on the gold upcycle. When prices are rising, their balance sheet growth accelerates as existing and new customers receive higher loan amounts on the same quantum of gold. Manapurram’s AUM saw 83% CAGR over FY07‐12, aided by a 21% CAGR in gold prices, and an 8x increase in customer base. However, between FY12 and FY14, when gold prices started falling, Manappuram’s AUM took a hit (‐16% CAGR). With gold prices showing a strong uptrend for the last nine months, we expect a clear rebound in Manapurram’s AUM growth. We see gold loan AUM CAGR at 25% over FY16‐19. Other newly added segments – microfinance, housing, and vehicle finance – have picked up well, and are growing at a robust pace on a low base. Its non‐gold loan book is likely to see 90% CAGR over FY16‐19. As a result, its consolidated book see 35% CAGR over FY16‐19. Segmentwise AUM growth projections FY15 FY16 FY17E FY18E FY19E CAGR (FY16‐19)Gold 92,693 100,806 126,008 157,509 196,887 25%yoy change(%) 9 25 25 25Asirvad Microfinance 3,220 9,998 19,996 38,992 62,388 84%yoy change(%) 210 100 95 60Commercial Vehicle 154 1,298 2,596 5,192 9,346 93%yoy change(%) 743 100 100 80Home Loan 272 1,286 4,501 9,002 15,303 128%yoy change(%) 373 250 100 70Consolidated AUM 95,935 114,330 153,101 210,696 283,923 35%yoy change(%) 19 34 38 35 Source: Company, PhillipCapital India Research
32 36 35 45 41
2730 29
28 3320
17 1826 31
45 3225
2729
0
20
40
60
80
100
120
140
160
FY12 FY13 FY14 FY15 FY16
East West North South Metro16%
Semi Urban32%
Urban30%
Rural22%
Manapurram’s AUM saw 83% CAGR over FY07‐12, aided by a 21% CAGR in gold prices, and an 8x increase in customer base. We see gold loan AUM CAGR at 25% over FY16‐19
Page | 13 | PHILLIPCAPITAL INDIA RESEARCH
MANAPPURAM FINANCE LTD INITIATING COVERAGE
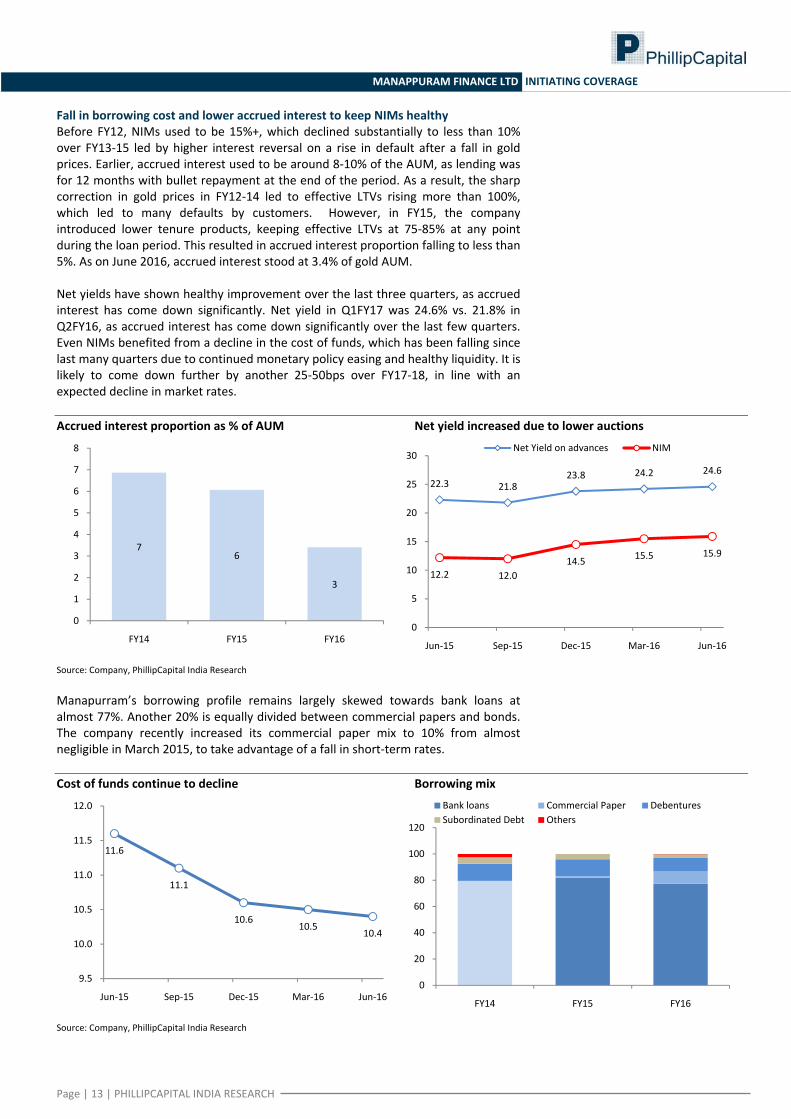
Fall in borrowing cost and lower accrued interest to keep NIMs healthy Before FY12, NIMs used to be 15%+, which declined substantially to less than 10% over FY13‐15 led by higher interest reversal on a rise in default after a fall in gold prices. Earlier, accrued interest used to be around 8‐10% of the AUM, as lending was for 12 months with bullet repayment at the end of the period. As a result, the sharp correction in gold prices in FY12‐14 led to effective LTVs rising more than 100%, which led to many defaults by customers. However, in FY15, the company introduced lower tenure products, keeping effective LTVs at 75‐85% at any point during the loan period. This resulted in accrued interest proportion falling to less than 5%. As on June 2016, accrued interest stood at 3.4% of gold AUM. Net yields have shown healthy improvement over the last three quarters, as accrued interest has come down significantly. Net yield in Q1FY17 was 24.6% vs. 21.8% in Q2FY16, as accrued interest has come down significantly over the last few quarters. Even NIMs benefited from a decline in the cost of funds, which has been falling since last many quarters due to continued monetary policy easing and healthy liquidity. It is likely to come down further by another 25‐50bps over FY17‐18, in line with an expected decline in market rates. Accrued interest proportion as % of AUM Net yield increased due to lower auctions
Source: Company, PhillipCapital India Research Manapurram’s borrowing profile remains largely skewed towards bank loans at almost 77%. Another 20% is equally divided between commercial papers and bonds. The company recently increased its commercial paper mix to 10% from almost negligible in March 2015, to take advantage of a fall in short‐term rates. Cost of funds continue to decline Borrowing mix
Source: Company, PhillipCapital India Research
76
3
0
1
2
3
4
5
6
7
8
FY14 FY15 FY16
22.3 21.823.8 24.2 24.6
12.2 12.014.5 15.5 15.9
0
5
10
15
20
25
30
Jun‐15 Sep‐15 Dec‐15 Mar‐16 Jun‐16
Net Yield on advances NIM
11.6
11.1
10.610.5
10.4
9.5
10.0
10.5
11.0
11.5
12.0
Jun‐15 Sep‐15 Dec‐15 Mar‐16 Jun‐160
20
40
60
80
100
120
FY14 FY15 FY16
Bank loans Commercial Paper DebenturesSubordinated Debt Others
Page | 14 | PHILLIPCAPITAL INDIA RESEARCH
MANAPPURAM FINANCE LTD INITIATING COVERAGE
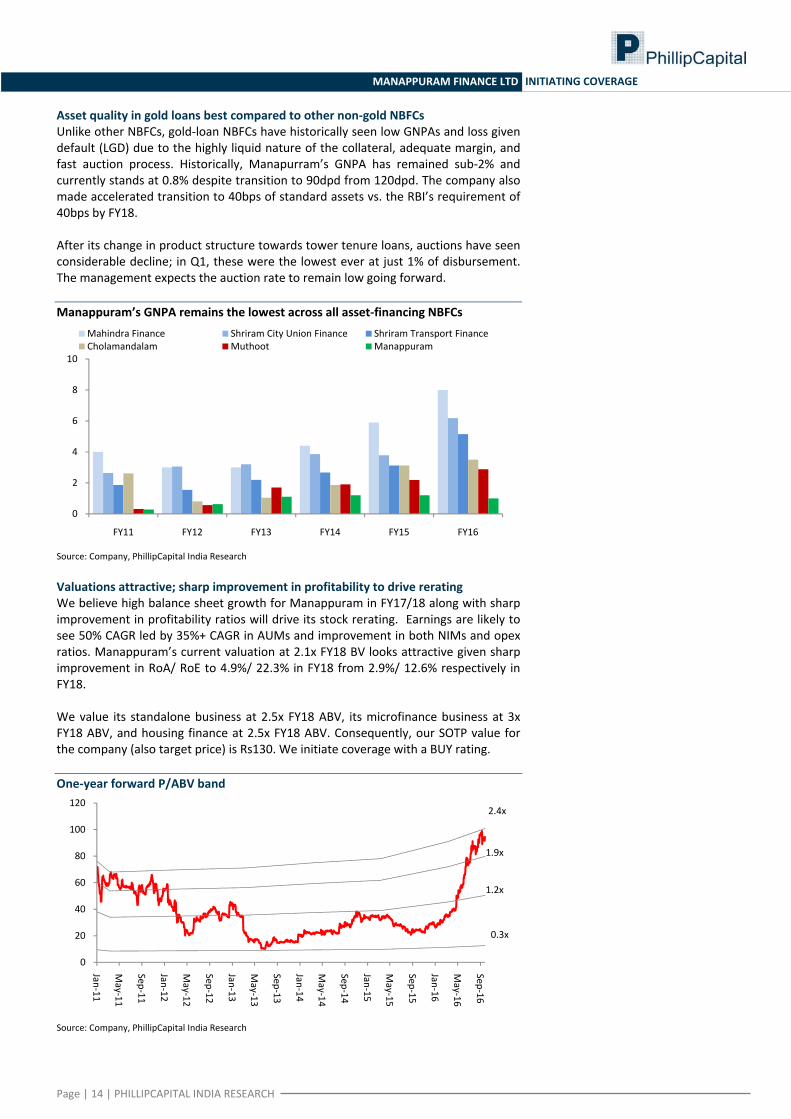
Asset quality in gold loans best compared to other non‐gold NBFCs Unlike other NBFCs, gold‐loan NBFCs have historically seen low GNPAs and loss given default (LGD) due to the highly liquid nature of the collateral, adequate margin, and fast auction process. Historically, Manapurram’s GNPA has remained sub‐2% and currently stands at 0.8% despite transition to 90dpd from 120dpd. The company also made accelerated transition to 40bps of standard assets vs. the RBI’s requirement of 40bps by FY18. After its change in product structure towards tower tenure loans, auctions have seen considerable decline; in Q1, these were the lowest ever at just 1% of disbursement. The management expects the auction rate to remain low going forward. Manappuram’s GNPA remains the lowest across all asset‐financing NBFCs
Source: Company, PhillipCapital India Research Valuations attractive; sharp improvement in profitability to drive rerating We believe high balance sheet growth for Manappuram in FY17/18 along with sharp improvement in profitability ratios will drive its stock rerating. Earnings are likely to see 50% CAGR led by 35%+ CAGR in AUMs and improvement in both NIMs and opex ratios. Manappuram’s current valuation at 2.1x FY18 BV looks attractive given sharp improvement in RoA/ RoE to 4.9%/ 22.3% in FY18 from 2.9%/ 12.6% respectively in FY18. We value its standalone business at 2.5x FY18 ABV, its microfinance business at 3x FY18 ABV, and housing finance at 2.5x FY18 ABV. Consequently, our SOTP value for the company (also target price) is Rs130. We initiate coverage with a BUY rating. One‐year forward P/ABV band
Source: Company, PhillipCapital India Research
0
2
4
6
8
10
FY11 FY12 FY13 FY14 FY15 FY16
Mahindra Finance Shriram City Union Finance Shriram Transport FinanceCholamandalam Muthoot Manappuram
0
20
40
60
80
100
120
Jan‐11
May‐11
Sep‐11
Jan‐12
May‐12
Sep‐12
Jan‐13
May‐13
Sep‐13
Jan‐14
May‐14
Sep‐14
Jan‐15
May‐15
Sep‐15
Jan‐16
May‐16
Sep‐16
0.3x
1.2x
1.9x
2.4x
Page | 15 | PHILLIPCAPITAL INDIA RESEARCH
MANAPPURAM FINANCE LTD INITIATING COVERAGE
Background Manappuram Finance, incorporated in 1992, is the second‐largest gold loan NBFC in India. It has 3,293 branches across 28 states and UTs with assets under management (AUM) of nearly Rs 115bn and a workforce of 17,752. Over the last two years, the company has diversified into new business areas like microfinance, vehicle and housing finance, and SME lending. In February 2015, it acquired Asirvad Microfinance Pvt. Ltd that had an AUM of ~Rs 3bn.
Management Mr VP Nandakumar, MD & CEO (age 62): He promoted Manappuram Finance in 1992. He is a managing committee member of leading trade and industry associations such as ASSOCHAM and FICCI. He is the chairman of the Kerala state council of the Confederation of Indian Industry (CII). He was a member of the FICCI delegation to the fourth session of India‐Poland Joint Commission for Economic Cooperation held at Warsaw, Poland, in June 2015. Mr Nandakumar has a postgraduate degree in science and qualifications in banking and foreign trade. He has attended Management Development Programmes for CEOs at IIMs Ahmedabad and IIM Bangalore. In December 2013, he took part in a Global Strategic Leadership Program at the Wharton Business School, Philadelphia (USA). Mr BN Raveendrababu, Executive Director. He is a postgraduate in commerce with additional qualifications in management accounting from the UK. Before joining Manappuram Group, he occupied senior positions in finance and accounts in various organisations. Key Shareholders
% of total Promoters 34.36 Nandkumar V P 28.12 Sushma Nandkumar 5.71 Other Individuals 0.53Other key shareholders Baring India Private Equity Fund 12.6 Goldman Sachs (Singapore) 1.0 WF Asian Reconnaissance Fund Ltd 4.5 AshishDhawan 2.9 DSP Blackrock Microcap Fund 3.1 Morgan Stanley Asia(Singapore) 2.0 MeryllLynch Capital Markets 1.2 BRIC II Mauritius Trading 1.5 MousseganeshLtd 1.3 Total 30.1
Source: Company, PhillipCapital India Research
Page | 16 | PHILLIPCAPITAL INDIA RESEARCH
MANAPPURAM FINANCE INITIATING COVERAGE
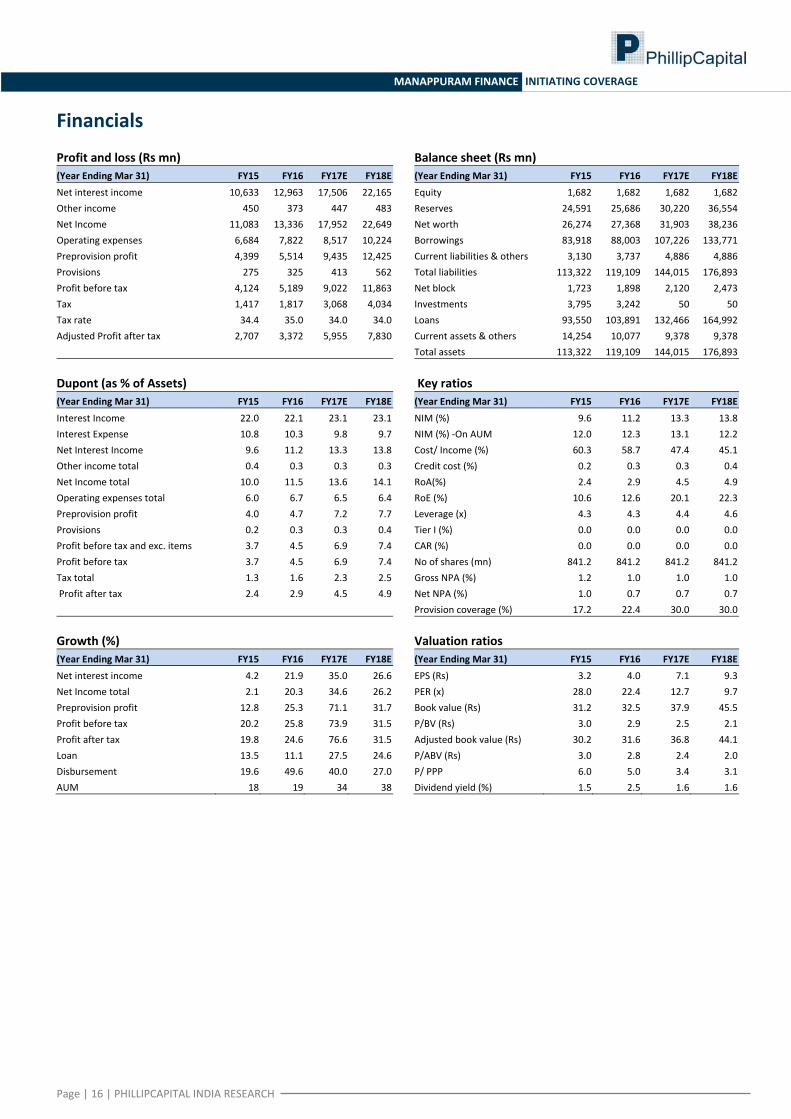
Financials Profit and loss (Rs mn) Balance sheet (Rs mn)(Year Ending Mar 31) FY15 FY16 FY17E FY18E (Year Ending Mar 31) FY15 FY16 FY17E FY18E
Net interest income 10,633 12,963 17,506 22,165 Equity 1,682 1,682 1,682 1,682Other income 450 373 447 483 Reserves 24,591 25,686 30,220 36,554Net Income 11,083 13,336 17,952 22,649 Net worth 26,274 27,368 31,903 38,236Operating expenses 6,684 7,822 8,517 10,224 Borrowings 83,918 88,003 107,226 133,771Preprovision profit 4,399 5,514 9,435 12,425 Current liabilities & others 3,130 3,737 4,886 4,886Provisions 275 325 413 562 Total liabilities 113,322 119,109 144,015 176,893Profit before tax 4,124 5,189 9,022 11,863 Net block 1,723 1,898 2,120 2,473Tax 1,417 1,817 3,068 4,034 Investments 3,795 3,242 50 50Tax rate 34.4 35.0 34.0 34.0 Loans 93,550 103,891 132,466 164,992Adjusted Profit after tax 2,707 3,372 5,955 7,830 Current assets & others 14,254 10,077 9,378 9,378 Total assets 113,322 119,109 144,015 176,893
Dupont (as % of Assets) Key ratios(Year Ending Mar 31) FY15 FY16 FY17E FY18E (Year Ending Mar 31) FY15 FY16 FY17E FY18E
Interest Income 22.0 22.1 23.1 23.1 NIM (%) 9.6 11.2 13.3 13.8Interest Expense 10.8 10.3 9.8 9.7 NIM (%) ‐On AUM 12.0 12.3 13.1 12.2Net Interest Income 9.6 11.2 13.3 13.8 Cost/ Income (%) 60.3 58.7 47.4 45.1Other income total 0.4 0.3 0.3 0.3 Credit cost (%) 0.2 0.3 0.3 0.4Net Income total 10.0 11.5 13.6 14.1 RoA(%) 2.4 2.9 4.5 4.9Operating expenses total 6.0 6.7 6.5 6.4 RoE (%) 10.6 12.6 20.1 22.3Preprovision profit 4.0 4.7 7.2 7.7 Leverage (x) 4.3 4.3 4.4 4.6Provisions 0.2 0.3 0.3 0.4 Tier I (%) 0.0 0.0 0.0 0.0Profit before tax and exc. items 3.7 4.5 6.9 7.4 CAR (%) 0.0 0.0 0.0 0.0Profit before tax 3.7 4.5 6.9 7.4 No of shares (mn) 841.2 841.2 841.2 841.2Tax total 1.3 1.6 2.3 2.5 Gross NPA (%) 1.2 1.0 1.0 1.0 Profit after tax 2.4 2.9 4.5 4.9 Net NPA (%) 1.0 0.7 0.7 0.7 Provision coverage (%) 17.2 22.4 30.0 30.0
Growth (%) Valuation ratios(Year Ending Mar 31) FY15 FY16 FY17E FY18E (Year Ending Mar 31) FY15 FY16 FY17E FY18E
Net interest income 4.2 21.9 35.0 26.6 EPS (Rs) 3.2 4.0 7.1 9.3Net Income total 2.1 20.3 34.6 26.2 PER (x) 28.0 22.4 12.7 9.7Preprovision profit 12.8 25.3 71.1 31.7 Book value (Rs) 31.2 32.5 37.9 45.5Profit before tax 20.2 25.8 73.9 31.5 P/BV (Rs) 3.0 2.9 2.5 2.1Profit after tax 19.8 24.6 76.6 31.5 Adjusted book value (Rs) 30.2 31.6 36.8 44.1Loan 13.5 11.1 27.5 24.6 P/ABV (Rs) 3.0 2.8 2.4 2.0Disbursement 19.6 49.6 40.0 27.0 P/ PPP 6.0 5.0 3.4 3.1AUM 18 19 34 38 Dividend yield (%) 1.5 2.5 1.6 1.6
INSTITUTIONAL EQUITY RESEARCH
Page | 17 | PHILLIPCAPITAL INDIA RESEARCH
Muthoot Finance (MUTH IN)
Biggest beneficiary of gold‐cycle turnaround INDIA | NBFCs | Initiating coverage
17 October 2016
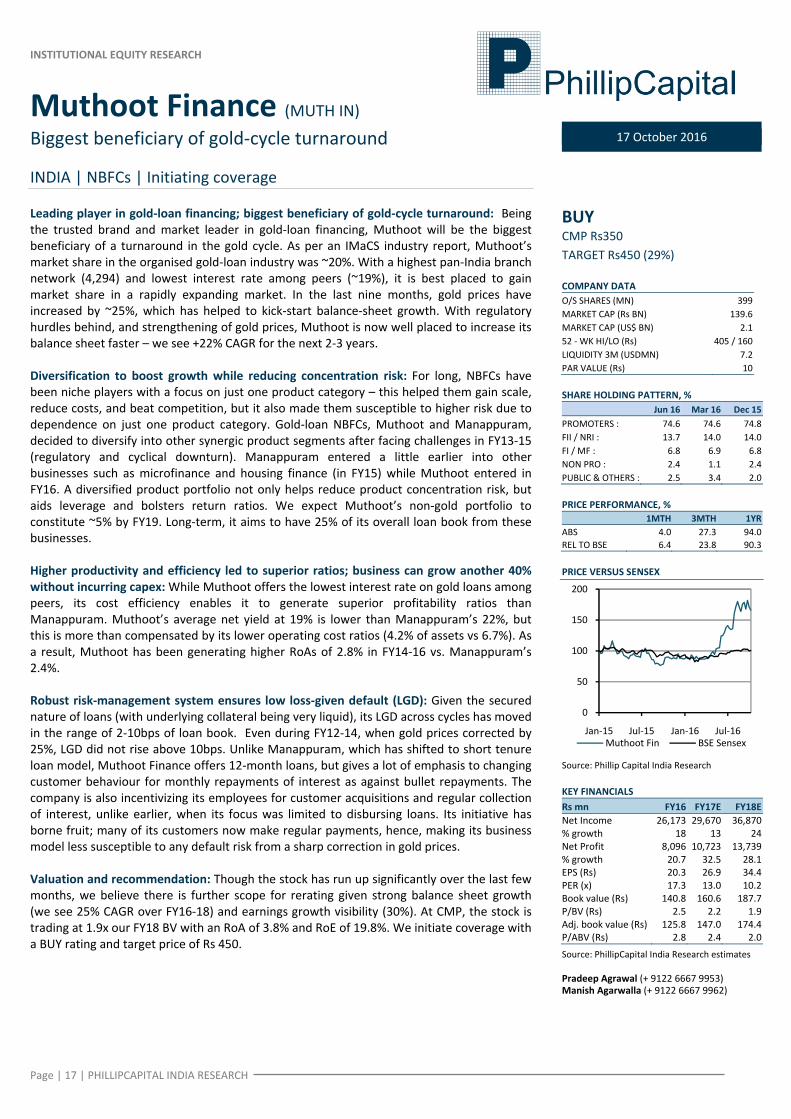
Leading player in gold‐loan financing; biggest beneficiary of gold‐cycle turnaround: Being the trusted brand and market leader in gold‐loan financing, Muthoot will be the biggest beneficiary of a turnaround in the gold cycle. As per an IMaCS industry report, Muthoot’s market share in the organised gold‐loan industry was ~20%. With a highest pan‐India branch network (4,294) and lowest interest rate among peers (~19%), it is best placed to gain market share in a rapidly expanding market. In the last nine months, gold prices have increased by ~25%, which has helped to kick‐start balance‐sheet growth. With regulatory hurdles behind, and strengthening of gold prices, Muthoot is now well placed to increase its balance sheet faster – we see +22% CAGR for the next 2‐3 years. Diversification to boost growth while reducing concentration risk: For long, NBFCs have been niche players with a focus on just one product category – this helped them gain scale, reduce costs, and beat competition, but it also made them susceptible to higher risk due to dependence on just one product category. Gold‐loan NBFCs, Muthoot and Manappuram, decided to diversify into other synergic product segments after facing challenges in FY13‐15 (regulatory and cyclical downturn). Manappuram entered a little earlier into other businesses such as microfinance and housing finance (in FY15) while Muthoot entered in FY16. A diversified product portfolio not only helps reduce product concentration risk, but aids leverage and bolsters return ratios. We expect Muthoot’s non‐gold portfolio to constitute ~5% by FY19. Long‐term, it aims to have 25% of its overall loan book from these businesses. Higher productivity and efficiency led to superior ratios; business can grow another 40% without incurring capex: While Muthoot offers the lowest interest rate on gold loans among peers, its cost efficiency enables it to generate superior profitability ratios than Manappuram. Muthoot’s average net yield at 19% is lower than Manappuram’s 22%, but this is more than compensated by its lower operating cost ratios (4.2% of assets vs 6.7%). As a result, Muthoot has been generating higher RoAs of 2.8% in FY14‐16 vs. Manappuram’s 2.4%. Robust risk‐management system ensures low loss‐given default (LGD): Given the secured nature of loans (with underlying collateral being very liquid), its LGD across cycles has moved in the range of 2‐10bps of loan book. Even during FY12‐14, when gold prices corrected by 25%, LGD did not rise above 10bps. Unlike Manappuram, which has shifted to short tenure loan model, Muthoot Finance offers 12‐month loans, but gives a lot of emphasis to changing customer behaviour for monthly repayments of interest as against bullet repayments. The company is also incentivizing its employees for customer acquisitions and regular collection of interest, unlike earlier, when its focus was limited to disbursing loans. Its initiative has borne fruit; many of its customers now make regular payments, hence, making its business model less susceptible to any default risk from a sharp correction in gold prices. Valuation and recommendation: Though the stock has run up significantly over the last few months, we believe there is further scope for rerating given strong balance sheet growth (we see 25% CAGR over FY16‐18) and earnings growth visibility (30%). At CMP, the stock is trading at 1.9x our FY18 BV with an RoA of 3.8% and RoE of 19.8%. We initiate coverage with a BUY rating and target price of Rs 450.
BUY CMP Rs350 TARGET Rs450 (29%) COMPANY DATA O/S SHARES (MN) 399MARKET CAP (Rs BN) 139.6MARKET CAP (US$ BN) 2.152 ‐ WK HI/LO (Rs) 405 / 160LIQUIDITY 3M (USDMN) 7.2PAR VALUE (Rs) 10 SHARE HOLDING PATTERN, % Jun 16 Mar 16 Dec 15PROMOTERS : 74.6 74.6 74.8FII / NRI : 13.7 14.0 14.0FI / MF : 6.8 6.9 6.8NON PRO : 2.4 1.1 2.4PUBLIC & OTHERS : 2.5 3.4 2.0 PRICE PERFORMANCE, %
1MTH 3MTH 1YRABS 4.0 27.3 94.0REL TO BSE 6.4 23.8 90.3 PRICE VERSUS SENSEX
Source: Phillip Capital India Research KEY FINANCIALS Rs mn FY16 FY17E FY18ENet Income 26,173 29,670 36,870% growth 18 13 24Net Profit 8,096 10,723 13,739% growth 20.7 32.5 28.1EPS (Rs) 20.3 26.9 34.4PER (x) 17.3 13.0 10.2Book value (Rs) 140.8 160.6 187.7P/BV (Rs) 2.5 2.2 1.9Adj. book value (Rs) 125.8 147.0 174.4P/ABV (Rs) 2.8 2.4 2.0
Source: PhillipCapital India Research estimates Pradeep Agrawal (+ 9122 6667 9953) Manish Agarwalla (+ 9122 6667 9962)
0
50
100
150
200
Jan‐15 Jul‐15 Jan‐16 Jul‐16Muthoot Fin BSE Sensex
Page | 18 | PHILLIPCAPITAL INDIA RESEARCH
MUTHOOT FINANCE INITIATING COVERAGE
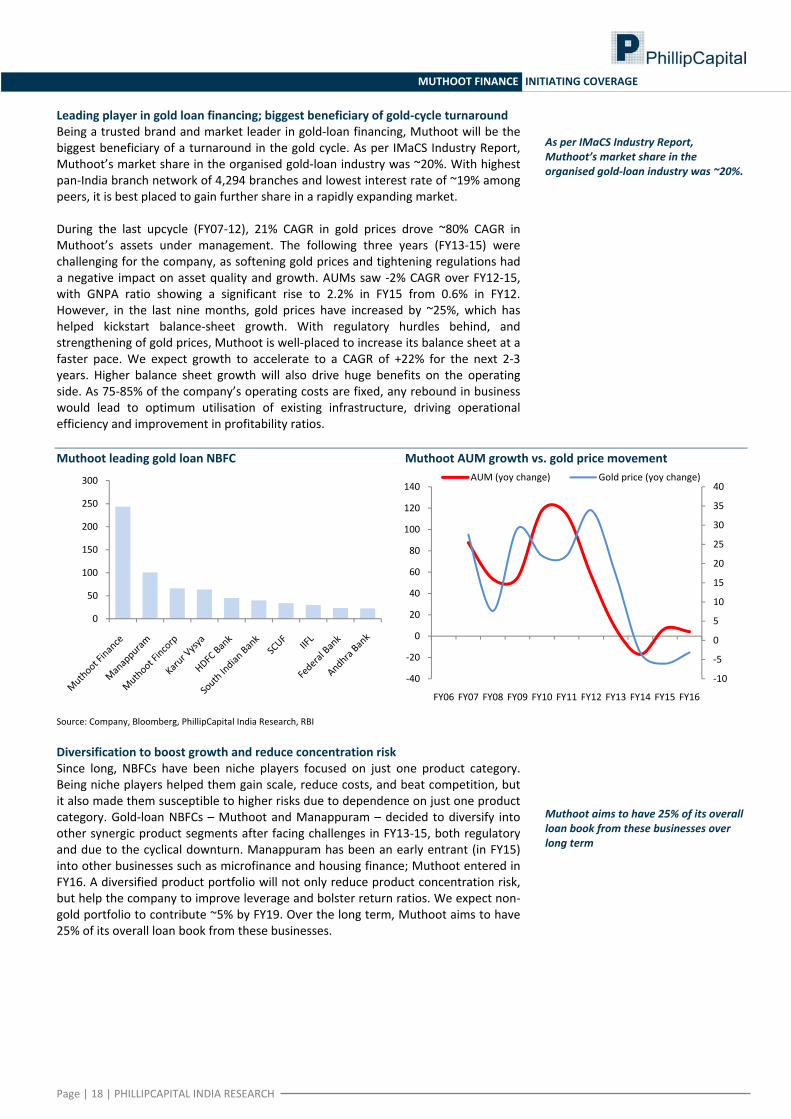
Leading player in gold loan financing; biggest beneficiary of gold‐cycle turnaround Being a trusted brand and market leader in gold‐loan financing, Muthoot will be the biggest beneficiary of a turnaround in the gold cycle. As per IMaCS Industry Report, Muthoot’s market share in the organised gold‐loan industry was ~20%. With highest pan‐India branch network of 4,294 branches and lowest interest rate of ~19% among peers, it is best placed to gain further share in a rapidly expanding market. During the last upcycle (FY07‐12), 21% CAGR in gold prices drove ~80% CAGR in Muthoot’s assets under management. The following three years (FY13‐15) were challenging for the company, as softening gold prices and tightening regulations had a negative impact on asset quality and growth. AUMs saw ‐2% CAGR over FY12‐15, with GNPA ratio showing a significant rise to 2.2% in FY15 from 0.6% in FY12. However, in the last nine months, gold prices have increased by ~25%, which has helped kickstart balance‐sheet growth. With regulatory hurdles behind, and strengthening of gold prices, Muthoot is well‐placed to increase its balance sheet at a faster pace. We expect growth to accelerate to a CAGR of +22% for the next 2‐3 years. Higher balance sheet growth will also drive huge benefits on the operating side. As 75‐85% of the company’s operating costs are fixed, any rebound in business would lead to optimum utilisation of existing infrastructure, driving operational efficiency and improvement in profitability ratios. Muthoot leading gold loan NBFC Muthoot AUM growth vs. gold price movement
Source: Company, Bloomberg, PhillipCapital India Research, RBI Diversification to boost growth and reduce concentration risk Since long, NBFCs have been niche players focused on just one product category. Being niche players helped them gain scale, reduce costs, and beat competition, but it also made them susceptible to higher risks due to dependence on just one product category. Gold‐loan NBFCs – Muthoot and Manappuram – decided to diversify into other synergic product segments after facing challenges in FY13‐15, both regulatory and due to the cyclical downturn. Manappuram has been an early entrant (in FY15) into other businesses such as microfinance and housing finance; Muthoot entered in FY16. A diversified product portfolio will not only reduce product concentration risk, but help the company to improve leverage and bolster return ratios. We expect non‐gold portfolio to contribute ~5% by FY19. Over the long term, Muthoot aims to have 25% of its overall loan book from these businesses.
0
50
100
150
200
250
300
‐10
‐5
0
5
10
15
20
25
30
35
40
‐40
‐20
0
20
40
60
80
100
120
140
FY06 FY07 FY08 FY09 FY10 FY11 FY12 FY13 FY14 FY15 FY16
AUM (yoy change) Gold price (yoy change)
As per IMaCS Industry Report, Muthoot’s market share in the organised gold‐loan industry was ~20%.
Muthoot aims to have 25% of its overall loan book from these businesses over long term
Page | 19 | PHILLIPCAPITAL INDIA RESEARCH
MUTHOOT FINANCE INITIATING COVERAGE
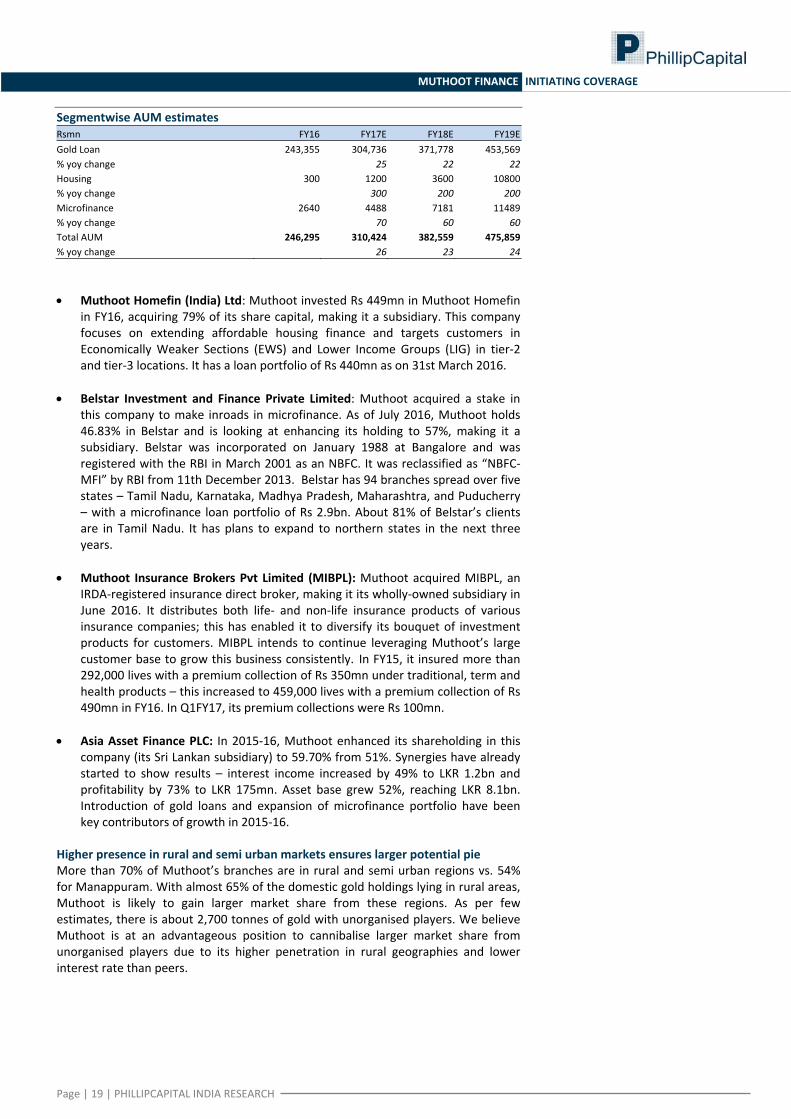
Segmentwise AUM estimates Rsmn FY16 FY17E FY18E FY19EGold Loan 243,355 304,736 371,778 453,569% yoy change 25 22 22Housing 300 1200 3600 10800% yoy change 300 200 200Microfinance 2640 4488 7181 11489% yoy change 70 60 60Total AUM 246,295 310,424 382,559 475,859% yoy change 26 23 24
• Muthoot Homefin (India) Ltd: Muthoot invested Rs 449mn in Muthoot Homefin
in FY16, acquiring 79% of its share capital, making it a subsidiary. This company focuses on extending affordable housing finance and targets customers in Economically Weaker Sections (EWS) and Lower Income Groups (LIG) in tier‐2 and tier‐3 locations. It has a loan portfolio of Rs 440mn as on 31st March 2016.
• Belstar Investment and Finance Private Limited: Muthoot acquired a stake in this company to make inroads in microfinance. As of July 2016, Muthoot holds 46.83% in Belstar and is looking at enhancing its holding to 57%, making it a subsidiary. Belstar was incorporated on January 1988 at Bangalore and was registered with the RBI in March 2001 as an NBFC. It was reclassified as “NBFC‐MFI” by RBI from 11th December 2013. Belstar has 94 branches spread over five states – Tamil Nadu, Karnataka, Madhya Pradesh, Maharashtra, and Puducherry – with a microfinance loan portfolio of Rs 2.9bn. About 81% of Belstar’s clients are in Tamil Nadu. It has plans to expand to northern states in the next three years.
• Muthoot Insurance Brokers Pvt Limited (MIBPL): Muthoot acquired MIBPL, an
IRDA‐registered insurance direct broker, making it its wholly‐owned subsidiary in June 2016. It distributes both life‐ and non‐life insurance products of various insurance companies; this has enabled it to diversify its bouquet of investment products for customers. MIBPL intends to continue leveraging Muthoot’s large customer base to grow this business consistently. In FY15, it insured more than 292,000 lives with a premium collection of Rs 350mn under traditional, term and health products – this increased to 459,000 lives with a premium collection of Rs 490mn in FY16. In Q1FY17, its premium collections were Rs 100mn.
• Asia Asset Finance PLC: In 2015‐16, Muthoot enhanced its shareholding in this
company (its Sri Lankan subsidiary) to 59.70% from 51%. Synergies have already started to show results – interest income increased by 49% to LKR 1.2bn and profitability by 73% to LKR 175mn. Asset base grew 52%, reaching LKR 8.1bn. Introduction of gold loans and expansion of microfinance portfolio have been key contributors of growth in 2015‐16.
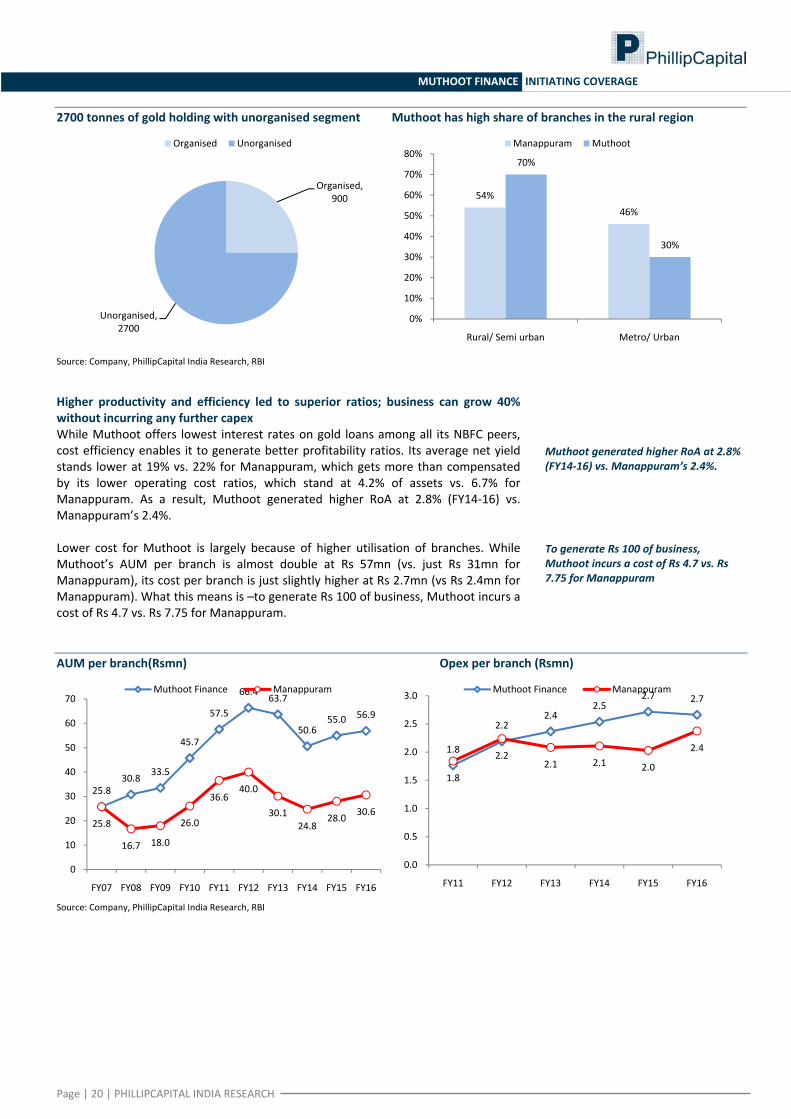
Higher presence in rural and semi urban markets ensures larger potential pie More than 70% of Muthoot’s branches are in rural and semi urban regions vs. 54% for Manappuram. With almost 65% of the domestic gold holdings lying in rural areas, Muthoot is likely to gain larger market share from these regions. As per few estimates, there is about 2,700 tonnes of gold with unorganised players. We believe Muthoot is at an advantageous position to cannibalise larger market share from unorganised players due to its higher penetration in rural geographies and lower interest rate than peers.
Page | 20 | PHILLIPCAPITAL INDIA RESEARCH
MUTHOOT FINANCE INITIATING COVERAGE
2700 tonnes of gold holding with unorganised segment Muthoot has high share of branches in the rural region
Source: Company, PhillipCapital India Research, RBI
Higher productivity and efficiency led to superior ratios; business can grow 40% without incurring any further capex While Muthoot offers lowest interest rates on gold loans among all its NBFC peers, cost efficiency enables it to generate better profitability ratios. Its average net yield stands lower at 19% vs. 22% for Manappuram, which gets more than compensated by its lower operating cost ratios, which stand at 4.2% of assets vs. 6.7% for Manappuram. As a result, Muthoot generated higher RoA at 2.8% (FY14‐16) vs. Manappuram’s 2.4%. Lower cost for Muthoot is largely because of higher utilisation of branches. While Muthoot’s AUM per branch is almost double at Rs 57mn (vs. just Rs 31mn for Manappuram), its cost per branch is just slightly higher at Rs 2.7mn (vs Rs 2.4mn for Manappuram). What this means is –to generate Rs 100 of business, Muthoot incurs a cost of Rs 4.7 vs. Rs 7.75 for Manappuram. AUM per branch(Rsmn) Opex per branch (Rsmn)
Source: Company, PhillipCapital India Research, RBI
Organised, 900
Unorganised, 2700
Organised Unorganised
54%46%
70%
30%
0%
10%
20%
30%
40%
50%
60%
70%
80%
Rural/ Semi urban Metro/ Urban
Manappuram Muthoot
25.830.8 33.5
45.7
57.5
66.4 63.7
50.655.0 56.9
25.8
16.7 18.0
26.0
36.640.0
30.124.8
28.0 30.6
0
10
20
30
40
50
60
70
FY07 FY08 FY09 FY10 FY11 FY12 FY13 FY14 FY15 FY16
Muthoot Finance Manappuram
1.8
2.22.4
2.52.7 2.7
1.8
2.22.1 2.1 2.0
2.4
0.0
0.5
1.0
1.5
2.0
2.5
3.0
FY11 FY12 FY13 FY14 FY15 FY16
Muthoot Finance Manappuram
To generate Rs 100 of business, Muthoot incurs a cost of Rs 4.7 vs. Rs 7.75 for Manappuram
Muthoot generated higher RoA at 2.8% (FY14‐16) vs. Manappuram’s 2.4%.
Page | 21 | PHILLIPCAPITAL INDIA RESEARCH
MUTHOOT FINANCE INITIATING COVERAGE
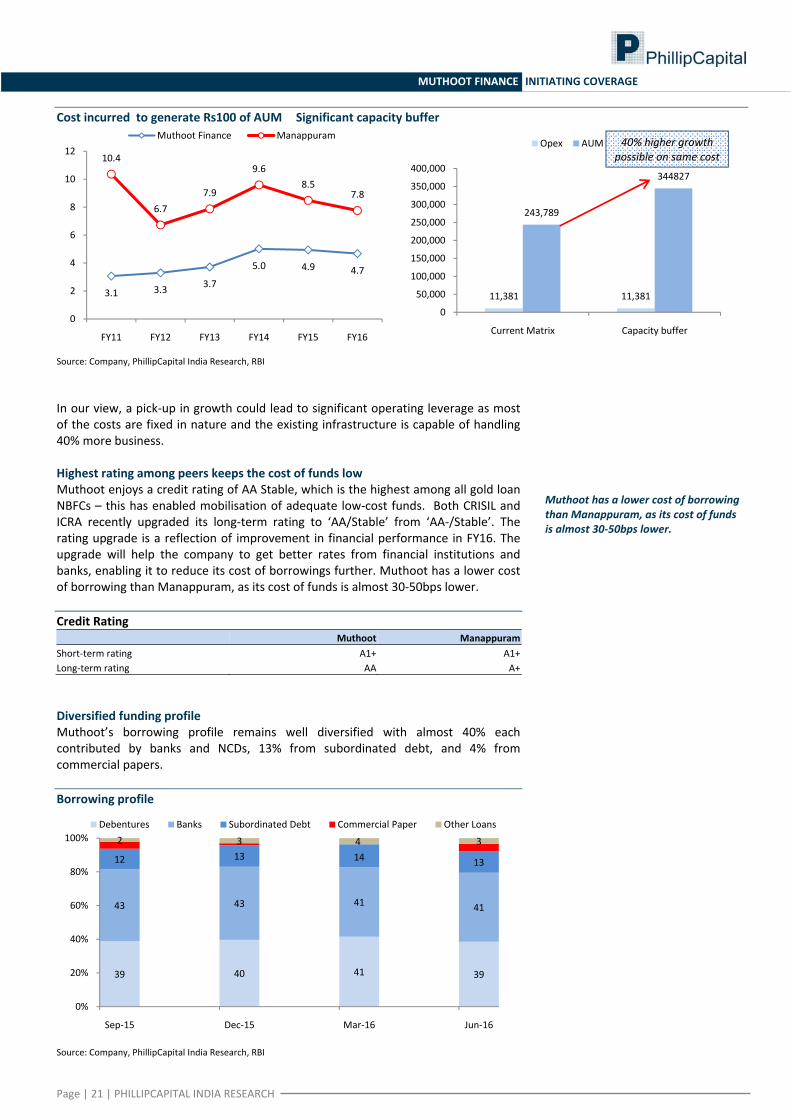
Cost incurred to generate Rs100 of AUM Significant capacity buffer
Source: Company, PhillipCapital India Research, RBI In our view, a pick‐up in growth could lead to significant operating leverage as most of the costs are fixed in nature and the existing infrastructure is capable of handling 40% more business. Highest rating among peers keeps the cost of funds low Muthoot enjoys a credit rating of AA Stable, which is the highest among all gold loan NBFCs – this has enabled mobilisation of adequate low‐cost funds. Both CRISIL and ICRA recently upgraded its long‐term rating to ‘AA/Stable’ from ‘AA‐/Stable’. The rating upgrade is a reflection of improvement in financial performance in FY16. The upgrade will help the company to get better rates from financial institutions and banks, enabling it to reduce its cost of borrowings further. Muthoot has a lower cost of borrowing than Manappuram, as its cost of funds is almost 30‐50bps lower. Credit Rating Muthoot ManappuramShort‐term rating A1+ A1+Long‐term rating AA A+ Diversified funding profile Muthoot’s borrowing profile remains well diversified with almost 40% each contributed by banks and NCDs, 13% from subordinated debt, and 4% from commercial papers. Borrowing profile
Source: Company, PhillipCapital India Research, RBI
3.1 3.3 3.7
5.0 4.9 4.7
10.4
6.77.9
9.68.5
7.8
0
2
4
6
8
10
12
FY11 FY12 FY13 FY14 FY15 FY16
Muthoot Finance Manappuram
11,381 11,381
243,789
344827
0
50,000
100,000
150,000
200,000
250,000
300,000
350,000
400,000
Current Matrix Capacity buffer
Opex AUM 40% higher growth possible on same cost
39 40 41 39
43 43 41 41
12 13 14 13
2 3 4 3
0%
20%
40%
60%
80%
100%
Sep‐15 Dec‐15 Mar‐16 Jun‐16
Debentures Banks Subordinated Debt Commercial Paper Other Loans
Muthoot has a lower cost of borrowing than Manappuram, as its cost of funds is almost 30‐50bps lower.
Page | 22 | PHILLIPCAPITAL INDIA RESEARCH
MUTHOOT FINANCE INITIATING COVERAGE
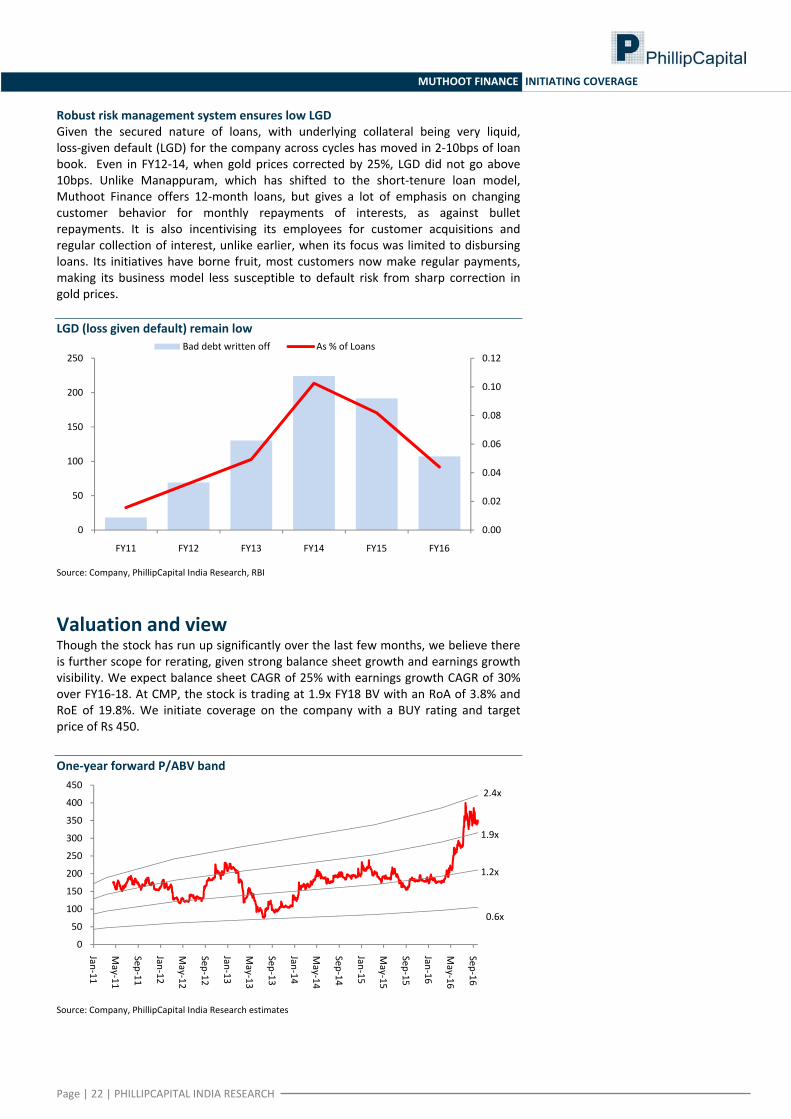
Robust risk management system ensures low LGD Given the secured nature of loans, with underlying collateral being very liquid, loss‐given default (LGD) for the company across cycles has moved in 2‐10bps of loan book. Even in FY12‐14, when gold prices corrected by 25%, LGD did not go above 10bps. Unlike Manappuram, which has shifted to the short‐tenure loan model, Muthoot Finance offers 12‐month loans, but gives a lot of emphasis on changing customer behavior for monthly repayments of interests, as against bullet repayments. It is also incentivising its employees for customer acquisitions and regular collection of interest, unlike earlier, when its focus was limited to disbursing loans. Its initiatives have borne fruit, most customers now make regular payments, making its business model less susceptible to default risk from sharp correction in gold prices. LGD (loss given default) remain low
Source: Company, PhillipCapital India Research, RBI
Valuation and view Though the stock has run up significantly over the last few months, we believe there is further scope for rerating, given strong balance sheet growth and earnings growth visibility. We expect balance sheet CAGR of 25% with earnings growth CAGR of 30% over FY16‐18. At CMP, the stock is trading at 1.9x FY18 BV with an RoA of 3.8% and RoE of 19.8%. We initiate coverage on the company with a BUY rating and target price of Rs 450. One‐year forward P/ABV band
Source: Company, PhillipCapital India Research estimates
0.00
0.02
0.04
0.06
0.08
0.10
0.12
0
50
100
150
200
250
FY11 FY12 FY13 FY14 FY15 FY16
Bad debt written off As % of Loans
0
50
100
150
200
250
300
350
400
450
Jan‐11
May‐11
Sep‐11
Jan‐12
May‐12
Sep‐12
Jan‐13
May‐13
Sep‐13
Jan‐14
May‐14
Sep‐14
Jan‐15
May‐15
Sep‐15
Jan‐16
May‐16
Sep‐16
0.6x
1.2x
1.9x
2.4x

Page | 23 | PHILLIPCAPITAL INDIA RESEARCH
MUTHOOT FINANCE INITIATING COVERAGE
Background Muthoot Finance is the flagship company of the Muthoot Group, headquartered in Kerala, India. It has emerged as the largest gold‐financing company in India with a gold‐loan portfolio of Rs 258.2bn. The group has been in this business for over 77 years. The company also offers home loans and insurance through its subsidiaries.
Management Mr MG George Muthoot, Chairman. He is a graduate in engineering from Manipal University. He is the National Executive Committee Member of the Federation of Indian Chamber of Commerce and Industry (“FICCI”) and the current Chairman of FICCI‐Kerala State Council. Mr Muthoot has been the guiding spirit of the company in its transformation as a professionally run leading conglomerate with geographic presence across the country. Mr George Alexander Muthoot, Managing Director. He is a chartered accountant who qualified with a first rank in Kerala and ranked 20th overall in India in 1978. He has a bachelor degree in commerce from Kerala University (gold medallist). He was awarded the Times of India group Business Excellence Award in customised Financial Services in March 2009. He served as the Chairman of the Kerala Non‐banking Finance Companies Welfare Association from 2004 to 2007 and is currently its Vice Chairman. He is also the Member Secretary of Finance Companies Association, Chennai. He is the founder member for The Indus Entrepreneurs International, Kochi Chapter, and is now a member of the Core Committee of The Indus Entrepreneurs International Kochi Chapter. His insight and understanding of the gold loan business and professional zeal has been the catalyst for the company’s meteoric rise to becoming India’s largest gold‐loan company. Key Shareholders Promoter Family Number (mn) % of totalPromoter Family 298 74.63Birla Sun Life 6 1.39Reliance Capital 6 1.59Acacia Partners, Lp 4 1.02GMO 5 1.22Total 319 80
Source: Company, PhillipCapital India Research estimates, BSE

Page | 24 | PHILLIPCAPITAL INDIA RESEARCH
MUTHOOT FINANCE INITIATING COVERAGE
Financials Profit and loss (Rs mn) Balance sheet (Rs mn) (Year Ending Mar 31) FY15 FY16 FY17E FY18E (Year Ending Mar 31) FY15 FY16 FY17E FY18E
Net interest income 22,074 26,037 29,526 36,654 Equity 3,980 3,990 3,990 3,990
Other income 108 136 144 216 Reserves 46,855 52,202 60,098 70,888
Net Income 22,183 26,173 29,670 36,870 Net worth 50,835 56,192 64,088 74,878
Operating expenses 11,533 11,381 12,397 14,865 Borrowings 194,647 186,409 233,427 285,691
Pre‐provision profit 10,650 14,792 17,273 22,005 Current liabilities & others 22,210 27,885 31,948 35,641
Provisions 371 1,624 877 997 Total liabilities 267,693 270,487 329,463 396,210
Profit before tax 10,279 13,168 16,395 21,008 Net block 2,642 2,274 1,883 1,587
Tax 3,573 5,072 5,673 7,269 Investments 385 983 47 47
Tax rate(%) 34.8 38.5 34.6 34.6 Loans 235,412 245,241 305,739 372,781
Adjusted Profit after tax 6,705 8,096 10,723 13,739 Current assets & others 29,254 21,990 21,794 21,794
Total assets 267,693 270,487 329,463 396,210
Dupont (as % of Assets) Key ratios (Year Ending Mar 31) FY15 FY16 FY17E FY18E (Year Ending Mar 31) FY15 FY16 FY17E FY18E
Interest Income 19.1 20.3 20.0 20.0 NIM (%) 8.4 9.7 9.8 10.1
Interest Expense 10.8 12.1 10.9 10.9 NIM (%) ‐On AUM 9.8 10.9 10.8 10.8
Net Interest Income 8.4 9.7 9.8 10.1 Cost/ Income (%) 52.0 43.5 41.8 40.3
Other income total 0.0 0.1 0.0 0.1 Credit cost (%) 0.1 0.6 0.3 0.3
Net Income total 8.5 9.7 9.9 10.2 RoA(%) 2.6 3.0 3.6 3.8
Operating expenses total 4.4 4.2 4.1 4.1 RoE (%) 14.3 15.1 17.8 19.8
Preprovision profit 4.1 5.5 5.8 6.1 Leverage (x) 5.6 5.0 5.0 5.2
Provisions 0.1 0.6 0.3 0.3 Tier I (%) 18.0 20.5 20.3 20.7
Profit before tax and ex items 3.9 4.9 5.5 5.8 CAR (%) 21.9 23.4 23.9 23.1
Profit before tax 3.9 4.9 5.5 5.8 No of shares (mn) 398.0 399.0 399.0 399.0
Tax total 1.4 1.9 1.9 2.0 Gross NPA (%) 2.2 2.9 2.4 2.2
Profit after tax 2.6 3.0 3.6 3.8 Net NPA (%) 1.9 2.5 1.8 1.4
Provision coverage (%) 14.2 14.5 25.9 35.4
Growth (%) Valuation ratios (Year Ending Mar 31) FY15 FY16 FY17E FY18E (Year Ending Mar 31) FY15 FY16 FY17E FY18E
Net interest income ‐4.1 18.0 13.4 24.1 FDEPS (Rs) 16.8 20.3 26.9 34.4
Net Income total ‐4.4 18.0 13.4 24.3 PER (x) 20.7 17.2 13.0 10.2
Preprovision profit ‐13.9 38.9 16.8 27.4 Book value (Rs) 127.7 140.8 160.6 187.7
Profit before tax ‐13.9 28.1 24.5 28.1 P/BV (Rs) 2.7 2.5 2.2 1.9
Profit after tax ‐14.0 20.7 32.5 28.1 Adjusted book value (Rs) 116.7 125.8 147.0 174.4
Loan 7.0 4.2 24.7 21.9 P/ABV (Rs) 3.0 2.8 2.4 2.0
AUM 7.1 4.1 25.0 22.0 P/ PPP 13.0 9.4 8.1 6.3
Dividend yield (%) 1.7 1.7 1.7 1.7
Page | 25 | PHILLIPCAPITAL INDIA RESEARCH
NBFC SECTOR
Rating Methodology We rate stock on absolute return basis. Our target price for the stocks has an investment horizon of one year. Rating Criteria Definition
BUY >= +15% Target price is equal to or more than 15% of current market price
NEUTRAL ‐15% > to < +15% Target price is less than +15% but more than ‐15%
SELL <= ‐15% Target price is less than or equal to ‐15%.
Contact Information (Regional Member Companies)
SINGAPORE: Phillip Securities Pte Ltd 250 North Bridge Road, #06‐00 RafflesCityTower,
Singapore 179101 Tel : (65) 6533 6001 Fax: (65) 6535 3834
www.phillip.com.sg
MALAYSIA: Phillip Capital Management Sdn Bhd B‐3‐6 Block B Level 3, Megan Avenue II,
No. 12, Jalan Yap Kwan Seng, 50450 Kuala Lumpur Tel (60) 3 2162 8841 Fax (60) 3 2166 5099
www.poems.com.my
HONG KONG: Phillip Securities (HK) Ltd 11/F United Centre 95 Queensway Hong Kong Tel (852) 2277 6600 Fax: (852) 2868 5307
www.phillip.com.hk
JAPAN: Phillip Securities Japan, Ltd 4‐2 Nihonbashi Kabutocho, Chuo‐ku
Tokyo 103‐0026 Tel: (81) 3 3666 2101 Fax: (81) 3 3664 0141
www.phillip.co.jp
INDONESIA: PT Phillip Securities Indonesia ANZTower Level 23B, Jl Jend Sudirman Kav 33A,
Jakarta 10220, Indonesia Tel (62) 21 5790 0800 Fax: (62) 21 5790 0809
www.phillip.co.id
CHINA: Phillip Financial Advisory (Shanghai) Co. Ltd. No 550 Yan An East Road, OceanTower Unit 2318
Shanghai 200 001 Tel (86) 21 5169 9200 Fax: (86) 21 6351 2940
www.phillip.com.cn
THAILAND: Phillip Securities (Thailand) Public Co. Ltd. 15th Floor, VorawatBuilding, 849 Silom Road,
Silom, Bangrak, Bangkok 10500 Thailand Tel (66) 2 2268 0999 Fax: (66) 2 2268 0921
www.phillip.co.th
FRANCE: King & Shaxson Capital Ltd. 3rd Floor, 35 Rue de la Bienfaisance
75008 Paris France Tel (33) 1 4563 3100 Fax : (33) 1 4563 6017
www.kingandshaxson.com
UNITED KINGDOM: King & Shaxson Ltd. 6th Floor, Candlewick House, 120 Cannon Street
London, EC4N 6AS Tel (44) 20 7929 5300 Fax: (44) 20 7283 6835
www.kingandshaxson.com
UNITED STATES: Phillip Futures Inc. 141 W Jackson Blvd Ste 3050
The Chicago Board of TradeBuilding Chicago, IL 60604 USA
Tel (1) 312 356 9000 Fax: (1) 312 356 9005
AUSTRALIA: PhillipCapital Australia Level 10, 330 Collins Street
Melbourne, VIC 3000, Australia Tel: (61) 3 8633 9800 Fax: (61) 3 8633 9899
www.phillipcapital.com.au
SRI LANKA: Asha Phillip Securities Limited Level 4, Millennium House, 46/58 Navam Mawatha,
Colombo 2, Sri Lanka Tel: (94) 11 2429 100 Fax: (94) 11 2429 199
www.ashaphillip.net/home.htm
INDIA PhillipCapital (India) Private Limited
No. 1, 18th Floor, Urmi Estate, 95 Ganpatrao Kadam Marg, Lower Parel West, Mumbai 400013 Tel: (9122) 2300 2999 Fax: (9122) 6667 9955 www.phillipcapital.in
Management(91 22) 2483 1919
Kinshuk Bharti Tiwari (Head – Institutional Equity) (91 22) 6667 9946(91 22) 6667 9735
Research IT Services Pharma & Speciality Chem
Dhawal Doshi (9122) 6667 9769 Vibhor Singhal (9122) 6667 9949 Surya Patra (9122) 6667 9768Nitesh Sharma, CFA (9122) 6667 9965 Shyamal Dhruve (9122) 6667 9992 Mehul Sheth (9122) 6667 9996Banking, NBFCs Infrastructure StrategyManish Agarwalla (9122) 6667 9962 Vibhor Singhal (9122) 6667 9949 Naveen Kulkarni, CFA, FRM (9122) 6667 9947Pradeep Agrawal (9122) 6667 9953 Deepak Agarwal (9122) 6667 9944 TelecomParesh Jain (9122) 6667 9948 Logistics, Transportation & Midcap Naveen Kulkarni, CFA, FRM (9122) 6667 9947Consumer & Retail Vikram Suryavanshi (9122) 6667 9951 Manoj Behera (9122) 6667 9973Naveen Kulkarni, CFA, FRM (9122) 6667 9947 Media TechnicalsJubil Jain (9122) 6667 9766 Manoj Behera (9122) 6667 9973 Subodh Gupta, CMT (9122) 6667 9762Preeyam Tolia (9122) 6667 9950 Metals Production ManagerCement Dhawal Doshi (9122) 6667 9769 Ganesh Deorukhkar (9122) 6667 9966Vaibhav Agarwal (9122) 6667 9967 Yash Doshi (9122) 6667 9987 EditorEconomics Mid‐Caps & Database Manager Roshan Sony 98199 72726Anjali Verma (9122) 6667 9969 Deepak Agarwal (9122) 6667 9944 Sr. Manager – Equities SupportEngineering, Capital Goods Oil & Gas Rosie Ferns (9122) 6667 9971Jonas Bhutta (9122) 6667 9759 Sabri Hazarika (9122) 6667 9756Vikram Rawat (9122) 6667 9986
Sales & Distribution Ashvin Patil (9122) 6667 9991 Sales Trader Zarine Damania (9122) 6667 9976Shubhangi Agrawal (9122) 6667 9964 Dilesh Doshi (9122) 6667 9747 Bharati Ponda (9122) 6667 9943Kishor Binwal (9122) 6667 9989 Suniil Pandit (9122) 6667 9745Bhavin Shah (9122) 6667 9974Ashka Mehta Gulati (9122) 6667 9934 ExecutionArchan Vyas (9122) 6667 9785 Mayur Shah (9122) 6667 9945
Corporate Communications
Vineet Bhatnagar (Managing Director)
Jignesh Shah (Head – Equity Derivatives)
Automobiles
Page | 26 | PHILLIPCAPITAL INDIA RESEARCH
NBFC SECTOR
Disclosures and Disclaimers PhillipCapital (India) Pvt. Ltd. has three independent equity research groups: Institutional Equities, Institutional Equity Derivatives, and Private Client Group. This report has been prepared by Institutional Equities Group. The views and opinions expressed in this document may, may not match, or may be contrary at times with the views, estimates, rating, and target price of the other equity research groups of PhillipCapital (India) Pvt. Ltd.
This report is issued by PhillipCapital (India) Pvt. Ltd., which is regulated by the SEBI. PhillipCapital (India) Pvt. Ltd. is a subsidiary of Phillip (Mauritius) Pvt. Ltd. References to "PCIPL" in this report shall mean PhillipCapital (India) Pvt. Ltd unless otherwise stated. This report is prepared and distributed by PCIPL for information purposes only, and neither the information contained herein, nor any opinion expressed should be construed or deemed to be construed as solicitation or as offering advice for the purposes of the purchase or sale of any security, investment, or derivatives. The information and opinions contained in the report were considered by PCIPL to be valid when published. The report also contains information provided to PCIPL by third parties. The source of such information will usually be disclosed in the report. Whilst PCIPL has taken all reasonable steps to ensure that this information is correct, PCIPL does not offer any warranty as to the accuracy or completeness of such information. Any person placing reliance on the report to undertake trading does so entirely at his or her own risk and PCIPL does not accept any liability as a result. Securities and Derivatives markets may be subject to rapid and unexpected price movements and past performance is not necessarily an indication of future performance.
This report does not regard the specific investment objectives, financial situation, and the particular needs of any specific person who may receive this report. Investors must undertake independent analysis with their own legal, tax, and financial advisors and reach their own conclusions regarding the appropriateness of investing in any securities or investment strategies discussed or recommended in this report and should understand that statements regarding future prospects may not be realised. Under no circumstances can it be used or considered as an offer to sell or as a solicitation of any offer to buy or sell the securities mentioned within it. The information contained in the research reports may have been taken from trade and statistical services and other sources, which PCIL believe is reliable. PhillipCapital (India) Pvt. Ltd. or any of its group/associate/affiliate companies do not guarantee that such information is accurate or complete and it should not be relied upon as such. Any opinions expressed reflect judgments at this date and are subject to change without notice.
Important: These disclosures and disclaimers must be read in conjunction with the research report of which it forms part. Receipt and use of the research report is subject to all aspects of these disclosures and disclaimers. Additional information about the issuers and securities discussed in this research report is available on request.
Certifications: The research analyst(s) who prepared this research report hereby certifies that the views expressed in this research report accurately reflect the research analyst’s personal views about all of the subject issuers and/or securities, that the analyst(s) have no known conflict of interest and no part of the research analyst’s compensation was, is, or will be, directly or indirectly, related to the specific views or recommendations contained in this research report.
Additional Disclosures of Interest: Unless specifically mentioned in Point No. 9 below: 1. The Research Analyst(s), PCIL, or its associates or relatives of the Research Analyst does not have any financial interest in the company(ies) covered in
this report. 2. The Research Analyst, PCIL or its associates or relatives of the Research Analyst affiliates collectively do not hold more than 1% of the securities of the
company (ies)covered in this report as of the end of the month immediately preceding the distribution of the research report. 3. The Research Analyst, his/her associate, his/her relative, and PCIL, do not have any other material conflict of interest at the time of publication of this
research report. 4. The Research Analyst, PCIL, and its associates have not received compensation for investment banking or merchant banking or brokerage services or for
any other products or services from the company(ies) covered in this report, in the past twelve months. 5. The Research Analyst, PCIL or its associates have not managed or co‐managed in the previous twelve months, a private or public offering of securities for
the company (ies) covered in this report. 6. PCIL or its associates have not received compensation or other benefits from the company(ies) covered in this report or from any third party, in
connection with the research report. 7. The Research Analyst has not served as an Officer, Director, or employee of the company (ies) covered in the Research report. 8. The Research Analyst and PCIL has not been engaged in market making activity for the company(ies) covered in the Research report. 9. Details of PCIL, Research Analyst and its associates pertaining to the companies covered in the Research report: Sr. no. Particulars Yes/No
1 Whether compensation has been received from the company(ies) covered in the Research report in the past 12 months for investment banking transaction by PCIL
No
2 Whether Research Analyst, PCIL or its associates or relatives of the Research Analyst affiliates collectively hold more than 1% of thecompany(ies) covered in the Research report
No
3 Whether compensation has been received by PCIL or its associates from the company(ies) covered in the Research report No4 PCIL or its affiliates have managed or co‐managed in the previous twelve months a private or public offering of securities for the
company(ies) covered in the Research report No
5 Research Analyst, his associate, PCIL or its associates have received compensation for investment banking or merchant banking or brokerage services or for any other products or services from the company(ies) covered in the Research report, in the last twelve months
No
Independence: PhillipCapital (India) Pvt. Ltd. has not had an investment banking relationship with, and has not received any compensation for investment banking services from, the subject issuers in the past twelve (12) months, and PhillipCapital (India) Pvt. Ltd does not anticipate receiving or intend to seek compensation for investment banking services from the subject issuers in the next three (3) months. PhillipCapital (India) Pvt. Ltd is not a market maker in the securities mentioned in this research report, although it, or its affiliates/employees, may have positions in, purchase or sell, or be materially interested in any of the securities covered in the report.
Suitability and Risks: This research report is for informational purposes only and is not tailored to the specific investment objectives, financial situation or particular requirements of any individual recipient hereof. Certain securities may give rise to substantial risks and may not be suitable for certain investors. Each investor must make its own determination as to the appropriateness of any securities referred to in this research report based upon the legal, tax and accounting considerations applicable to such investor and its own investment objectives or strategy, its financial situation and its investing experience. The value of any security may be positively or adversely affected by changes in foreign exchange or interest rates, as well as by other financial, economic, or political factors. Past performance is not necessarily indicative of future performance or results.
Page | 27 | PHILLIPCAPITAL INDIA RESEARCH
NBFC SECTOR
Sources, Completeness and Accuracy: The material herein is based upon information obtained from sources that PCIPL and the research analyst believe to be reliable, but neither PCIPL nor the research analyst represents or guarantees that the information contained herein is accurate or complete and it should not be relied upon as such. Opinions expressed herein are current opinions as of the date appearing on this material, and are subject to change without notice. Furthermore, PCIPL is under no obligation to update or keep the information current. Without limiting any of the foregoing, in no event shall PCIL, any of its affiliates/employees or any third party involved in, or related to computing or compiling the information have any liability for any damages of any kind including but not limited to any direct or consequential loss or damage, however arising, from the use of this document.
Copyright: The copyright in this research report belongs exclusively to PCIPL. All rights are reserved. Any unauthorised use or disclosure is prohibited. No reprinting or reproduction, in whole or in part, is permitted without the PCIPL’s prior consent, except that a recipient may reprint it for internal circulation only and only if it is reprinted in its entirety.
Caution: Risk of loss in trading/investment can be substantial and even more than the amount / margin given by you. The recipient should carefully consider whether trading/investment is appropriate for the recipient in light of the recipient’s experience, objectives, financial resources and other relevant circumstances. PCIPL and any of its employees, directors, associates, group entities, or affiliates shall not be liable for losses, if any, incurred by the recipient. The recipient is further cautioned that trading/investments in financial markets are subject to market risks and are advised to seek trading/investment advice before investing. There is no guarantee/assurance as to returns or profits or capital protection or appreciation. PCIPL and any of its employees, directors, associates, group entities, affiliates are not inducing the recipient for trading/investing in the financial market(s). Trading/Investment decision is the sole responsibility of the recipient.
For U.S. persons only: This research report is a product of PhillipCapital (India) Pvt Ltd., which is the employer of the research analyst(s) who has prepared the research report. The research analyst(s) preparing the research report is/are resident outside the United States (U.S.) and are not associated persons of any U.S.‐regulated broker‐dealer and therefore the analyst(s) is/are not subject to supervision by a U.S. broker‐dealer, and is/are not required to satisfy the regulatory licensing requirements of FINRA or required to otherwise comply with U.S. rules or regulations regarding, among other things, communications with a subject company, public appearances, and trading securities held by a research analyst account.
This report is intended for distribution by PhillipCapital (India) Pvt Ltd. only to "Major Institutional Investors" as defined by Rule 15a‐6(b)(4) of the U.S. Securities and Exchange Act, 1934 (the Exchange Act) and interpretations thereof by the U.S. Securities and Exchange Commission (SEC) in reliance on Rule 15a 6(a)(2). If the recipient of this report is not a Major Institutional Investor as specified above, then it should not act upon this report and return the same to the sender. Further, this report may not be copied, duplicated, and/or transmitted onward to any U.S. person, which is not a Major Institutional Investor. In reliance on the exemption from registration provided by Rule 15a‐6 of the Exchange Act and interpretations thereof by the SEC in order to conduct certain business with Major Institutional Investors, PhillipCapital (India) Pvt Ltd. has entered into an agreement with a U.S. registered broker‐dealer, Decker & Co, LLC. Transactions in securities discussed in this research report should be effected through Decker & Co, LLC or another U.S. registered broker dealer. If Distribution is to Australian Investors This report is produced by PhillipCapital (India) Pvt Ltd and is being distributed in Australia by Phillip Capital Limited (Australian Financial Services Licence No. 246827). This report contains general securities advice and does not take into account your personal objectives, situation and needs. Please read the Disclosures and Disclaimers set out above. By receiving or reading this report, you agree to be bound by the terms and limitations set out above. Any failure to comply with these terms and limitations may constitute a violation of law. This report has been provided to you for personal use only and shall not be reproduced, distributed or published by you in whole or in part, for any purpose. If you have received this report by mistake, please delete or destroy it, and notify the sender immediately. PhillipCapital (India) Pvt. Ltd. Registered office: No. 1, 18th Floor, Urmi Estate, 95 Ganpatrao Kadam Marg, Lower Parel West, Mumbai 400013