Embed Size (px)
Citation preview
INSTITUTIONAL EQUITY RESEARCH
Page | 1 | PHILLIPCAPITAL INDIA RESEARCH
Atul Ltd (ATLP IN) Business diversification mutes growth INDIA | SPECIALTY CHEMICALS | Initiating Coverage
29 March 2016
Price leadership in p‐cresol leads value growth Aromatic is one of Atul’s most successful segments, not only due to its stellar performance over the last five years (revenue CAGR of ~29% to Rs 5.2bn in FY15), but also because of its global leadership position in p‐Cresol and derivatives. It is the largest manufacturer p‐Cresol and derivatives in India/ in the world with a strong customer base across advanced and developing markets. Although the price of P‐cresol softened with crude, Atul’s price leadership helped it retain most of the benefit from lower input cost (crude derivative). We see value growth in this segment ahead. Visible growth in user industries and brands cushions polymer business Polymers is Atul’s flagship segment with ~28% sales contribution and products such as epoxy resins/hardeners, sulphones, and polyurethane. While it is the largest manufacturer of sulphones in the world, it is the largest domestic player in the epoxy market. Considering anticipated rapid growth in construction chemicals and paints and coatings in the emerging markets, recovery in automobiles, and steady progress in the domestic branded business, we estimate 10% CAGR for this business over FY16‐18 to Rs 8.3bn in FY18. Crop protection: Global leadership in 2,4D is the only highlight; otherwise, it is muted Atul has a diversified portfolio of crop protection chemicals (covering fungicides, herbicides and insecticides), and it is one of the world's five leading manufacturers of 2,4‐D range of chlorophenoxy derivatives. Going by the industry forecast of recovery in the global agro market, and favourable monsoon in the domestic market, we build in 7% revenue CAGR over FY16‐18 to Rs 3.45bn. Colors: Near‐term outlook remains bleak Colors is an integrated operation for Atul, with leading position in sulphur black in India and vat dyes in the world. This division saw healthy 25% CAGR in FY13‐15 primarily led by spike in the prices of dyes and dye intermediates and a jump in the export volumes. However, overall dye prices have softened a bit in FY16; simultaneously, exports demand for vat dyes (a leading product for Atul) seems to have corrected meaningfully, led by global slowdown, making the outlook bleak. Indian export of vat dyes fell ~35% over the last 12 months. Perils of wide business diversification mutes growth Considering muted growth across polymers, crop protection, colors, and bulk chemicals, we estimate Atul will deliver muted 8% CAGR in revenues and 12% in profits over FY15‐18. Atul’s most diversified business model (amongst Indian peers) seems struggling for growth with no major expansion plan in the near future and adverse impact of economic slowdown. Initiate NEUTRAL rating with a TP of Rs 1650 Atul trades at 13x FY18 EPS and 7x FY18 EV/EBITDA. While we consider Atul’s strong historical track record of steady growth and cash generation positive, its visible muted growth – both on revenues and profits – make us pessimistic. We value Atul at Rs 1,650, i.e. 8x FY18 EV/EBITDA (vs. 9x target multiple for Aarti Industries) and initiate coverage with a Neutral rating.
NEUTRAL CMP RS 1470 TARGET RS 1650 (+12%) COMPANY DATA O/S SHARES (MN) : 30MARKET CAP (RSBN) : 45MARKET CAP (USDBN) : 0.752 ‐ WK HI/LO (RS) : 1805 / 1034LIQUIDITY 3M (USDMN) : 0.4PAR VALUE (RS) : 10 SHARE HOLDING PATTERN, % Dec 15 Sep 15 Jun 15PROMOTERS : 50.8 50.8 50.7FII / NRI : 6.3 6.9 7.0FI / MF : 13.0 13.6 13.4NON PRO : 29.9 10.0 9.8PUBLIC & OTHERS : 0.0 18.7 19.1 PRICE PERFORMANCE, %
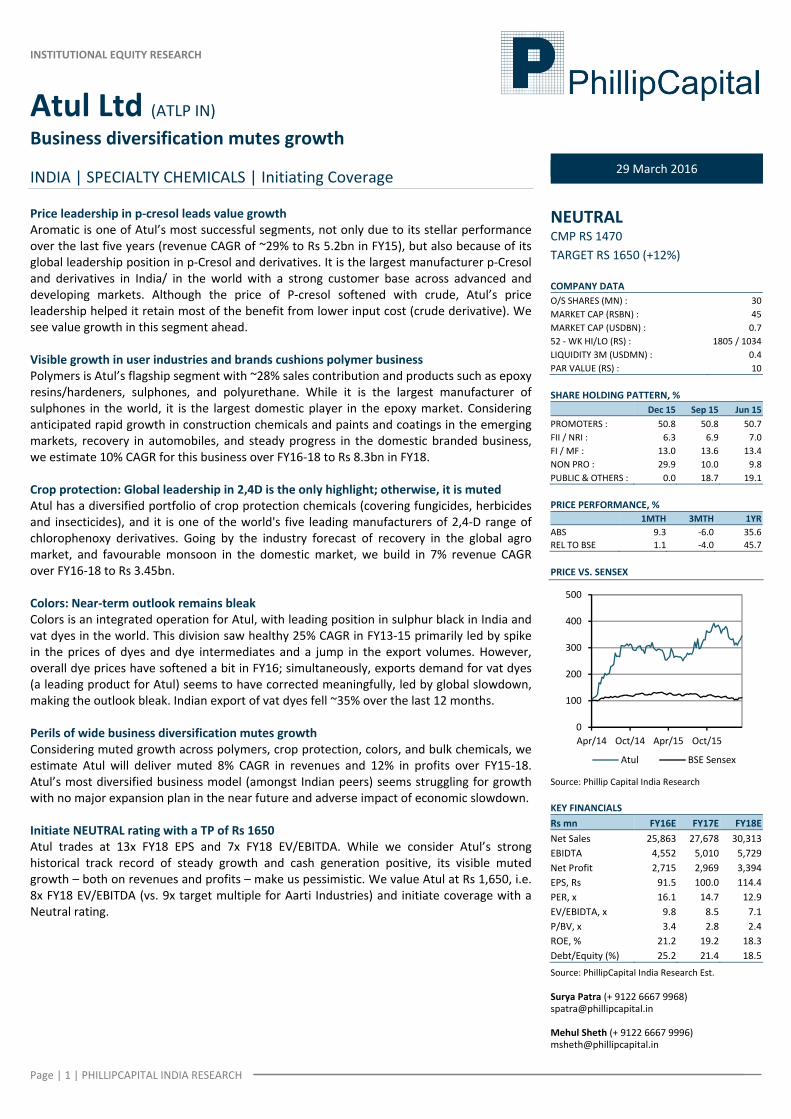
1MTH 3MTH 1YRABS 9.3 ‐6.0 35.6REL TO BSE 1.1 ‐4.0 45.7 PRICE VS. SENSEX
Source: Phillip Capital India Research KEY FINANCIALS Rs mn FY16E FY17E FY18ENet Sales 25,863 27,678 30,313EBIDTA 4,552 5,010 5,729Net Profit 2,715 2,969 3,394EPS, Rs 91.5 100.0 114.4PER, x 16.1 14.7 12.9EV/EBIDTA, x 9.8 8.5 7.1P/BV, x 3.4 2.8 2.4ROE, % 21.2 19.2 18.3Debt/Equity (%) 25.2 21.4 18.5
Source: PhillipCapital India Research Est. Surya Patra (+ 9122 6667 9968) [email protected] Mehul Sheth (+ 9122 6667 9996) [email protected]
0
100
200
300
400
500
Apr/14 Oct/14 Apr/15 Oct/15
Atul BSE Sensex
Page | 2 | PHILLIPCAPITAL INDIA RESEARCH
ATUL LTD. INITIATING COVERAGE
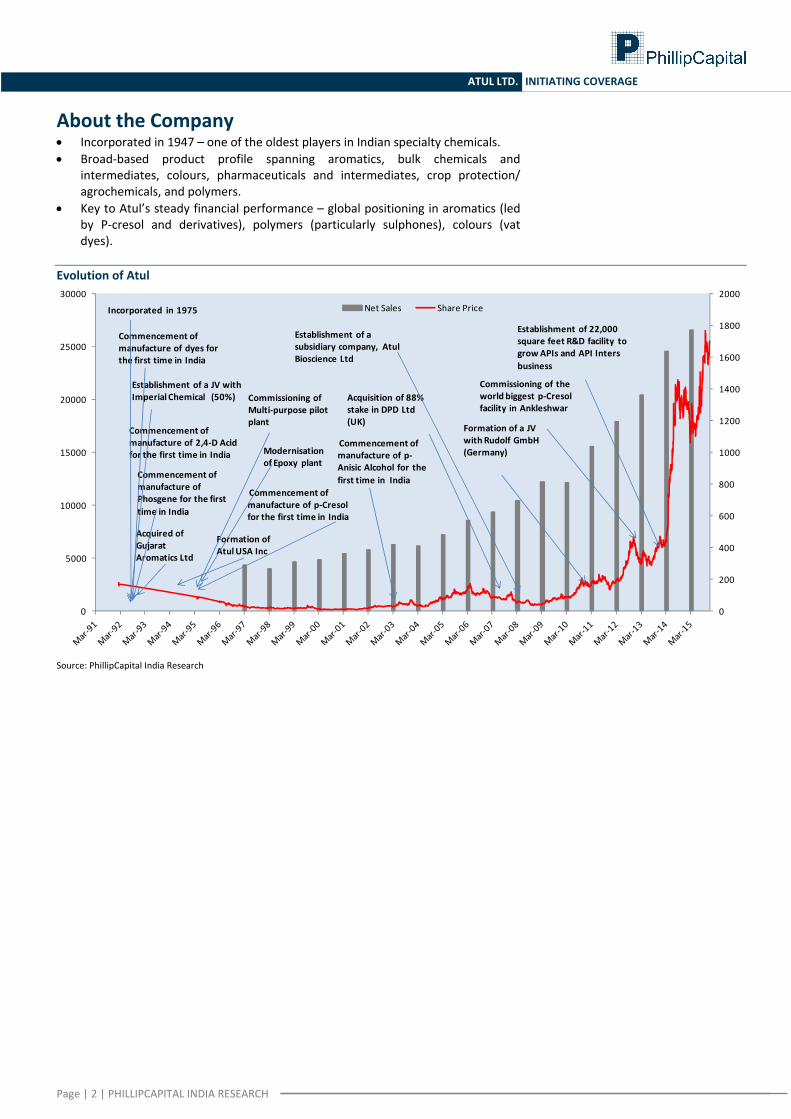
About the Company • Incorporated in 1947 – one of the oldest players in Indian specialty chemicals. • Broad‐based product profile spanning aromatics, bulk chemicals and
intermediates, colours, pharmaceuticals and intermediates, crop protection/ agrochemicals, and polymers.
• Key to Atul’s steady financial performance – global positioning in aromatics (led by P‐cresol and derivatives), polymers (particularly sulphones), colours (vat dyes).
Evolution of Atul
Source: PhillipCapital India Research
0
200
400
600
800
1000
1200
1400
1600
1800
2000
0
5000
10000
15000
20000
25000
30000Net Sales Share Price
Commencement of manufacture of dyes for the first time in India
Establishment of a JV with Imperial Chemical (50%)
Commencement of manufacture of Phosgene for the first time in India
Commencement of manufacture of 2,4‐D Acid for the first time in India
Acquired of Gujarat Aromatics Ltd
Commissioning of Multi‐purpose pilot plant
Modernisation of Epoxy plant
Formation of Atul USA Inc
Commencement of manufacture of p‐Cresol for the first time in India
Commencement of manufacture of p‐Anisic Alcohol for the first time in India
Establishment of a subsidiary company, Atul Bioscience Ltd
Acquisition of 88% stake in DPD Ltd (UK)
Commissioning of the world biggest p‐Cresol facility in Ankleshwar
Establishment of 22,000 square feet R&D facility to grow APIs and API Inters business
Formation of a JV with Rudolf GmbH (Germany)
Incorporated in 1975
Page | 3 | PHILLIPCAPITAL INDIA RESEARCH
ATUL LTD. INITIATING COVERAGE
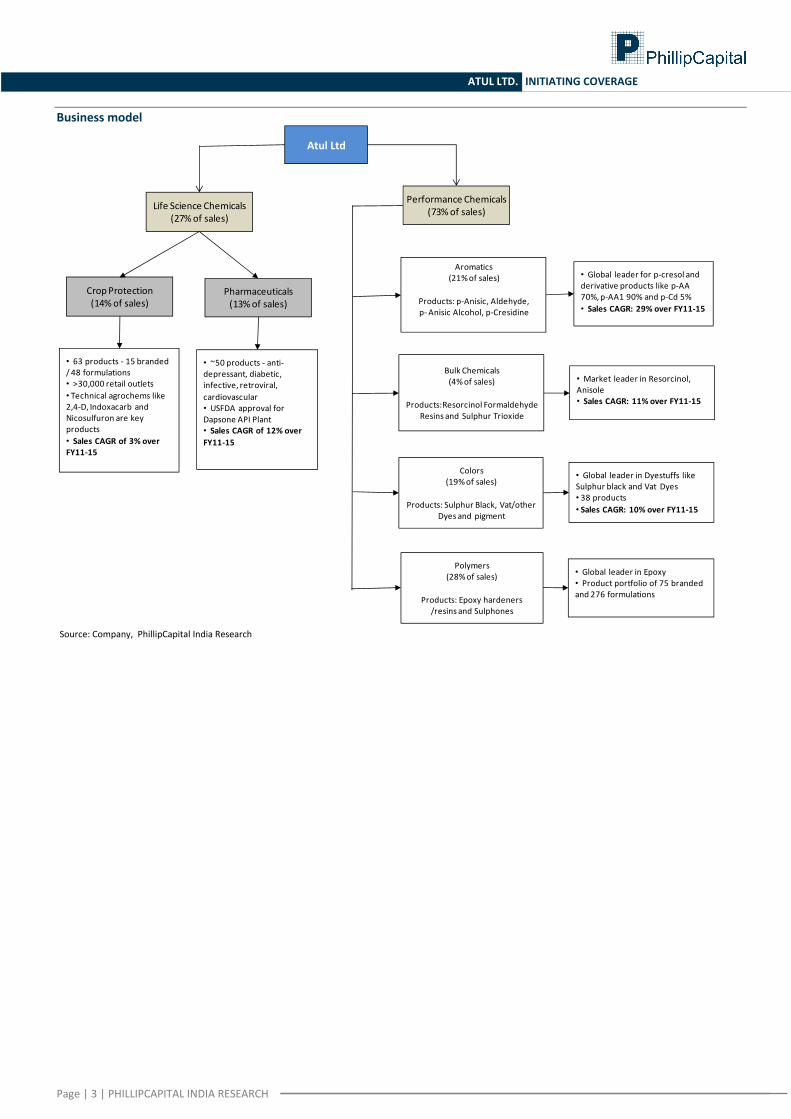
Business model
Source: Company, PhillipCapital India Research
Atul Ltd
Life Science Chemicals(27% of sales)
Performance Chemicals(73% of sales)
Crop Protection (14% of sales)
Pharmaceuticals(13% of sales)
• 63 products ‐ 15 branded / 48 formulations• >30,000 retail outlets• Technical agrochems like 2,4‐D, Indoxacarb and Nicosulfuron are key products• Sales CAGR of 3% over FY11‐15
• ~50 products ‐ anti‐depressant, diabetic, infective, retroviral, cardiovascular• USFDA approval for Dapsone API Plant• Sales CAGR of 12% over FY11‐15
Aromatics(21% of sales)
Products: p‐Anisic, Aldehyde, p‐Anisic Alcohol, p‐Cresidine
Bulk Chemicals(4% of sales)
Products:Resorcinol Formaldehyde Resins and Sulphur Trioxide
Colors(19%of sales)
Products: Sulphur Black, Vat/other Dyes and pigment
Polymers(28% of sales)
Products: Epoxy hardeners /resins and Sulphones
• Global leader for p‐cresol and derivative products like p‐AA 70%, p‐AA1 90% and p‐Cd 5%• Sales CAGR: 29% over FY11‐15
• Market leader in Resorcinol, Anisole• Sales CAGR: 11% over FY11‐15
• Global leader in Dyestuffs like Sulphur black and Vat Dyes• 38 products• Sales CAGR: 10% over FY11‐15
• Global leader in Epoxy• Product portfolio of 75 branded and 276 formulations
Page | 4 | PHILLIPCAPITAL INDIA RESEARCH
ATUL LTD. INITIATING COVERAGE
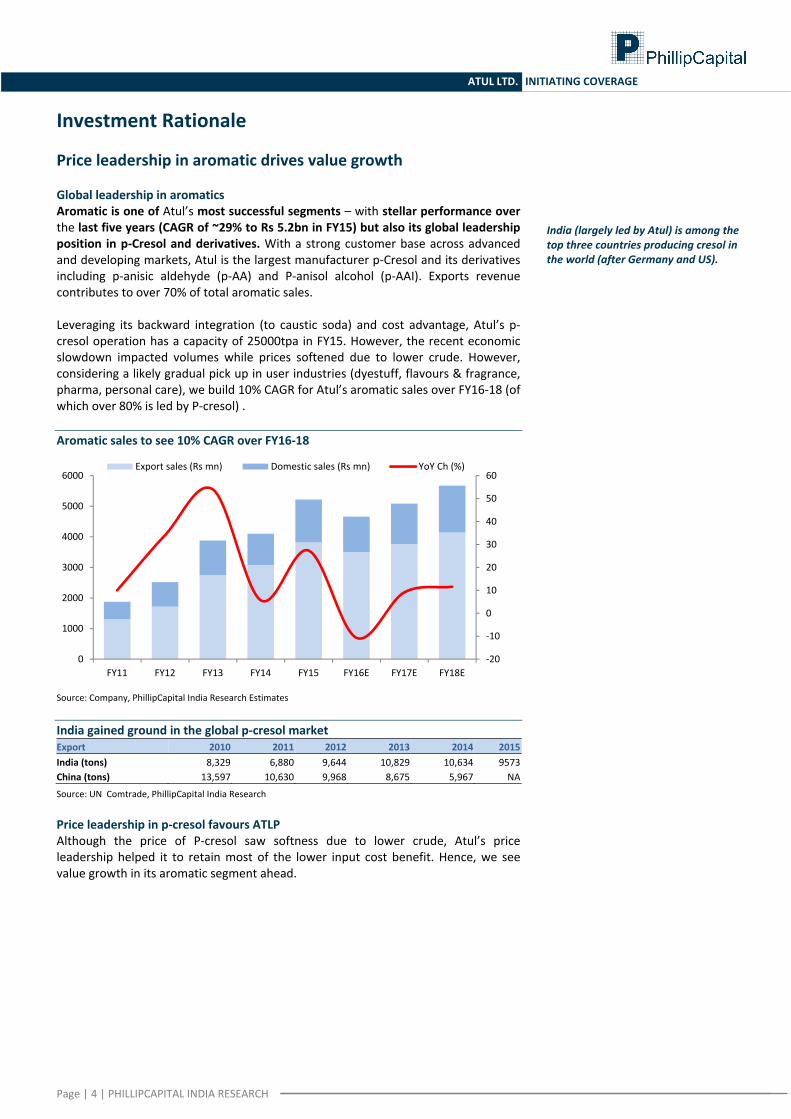
Investment Rationale Price leadership in aromatic drives value growth Global leadership in aromatics Aromatic is one of Atul’s most successful segments – with stellar performance over the last five years (CAGR of ~29% to Rs 5.2bn in FY15) but also its global leadership position in p‐Cresol and derivatives. With a strong customer base across advanced and developing markets, Atul is the largest manufacturer p‐Cresol and its derivatives including p‐anisic aldehyde (p‐AA) and P‐anisol alcohol (p‐AAI). Exports revenue contributes to over 70% of total aromatic sales. Leveraging its backward integration (to caustic soda) and cost advantage, Atul’s p‐cresol operation has a capacity of 25000tpa in FY15. However, the recent economic slowdown impacted volumes while prices softened due to lower crude. However, considering a likely gradual pick up in user industries (dyestuff, flavours & fragrance, pharma, personal care), we build 10% CAGR for Atul’s aromatic sales over FY16‐18 (of which over 80% is led by P‐cresol) . Aromatic sales to see 10% CAGR over FY16‐18
Source: Company, PhillipCapital India Research Estimates India gained ground in the global p‐cresol market Export 2010 2011 2012 2013 2014 2015India (tons) 8,329 6,880 9,644 10,829 10,634 9573China (tons) 13,597 10,630 9,968 8,675 5,967 NA
Source: UN Comtrade, PhillipCapital India Research Price leadership in p‐cresol favours ATLP Although the price of P‐cresol saw softness due to lower crude, Atul’s price leadership helped it to retain most of the lower input cost benefit. Hence, we see value growth in its aromatic segment ahead.
‐20
‐10
0
10
20
30
40
50
60
0
1000
2000
3000
4000
5000
6000
FY11 FY12 FY13 FY14 FY15 FY16E FY17E FY18E
Export sales (Rs mn) Domestic sales (Rs mn) YoY Ch (%)
India (largely led by Atul) is among the top three countries producing cresol in the world (after Germany and US).
Page | 5 | PHILLIPCAPITAL INDIA RESEARCH
ATUL LTD. INITIATING COVERAGE
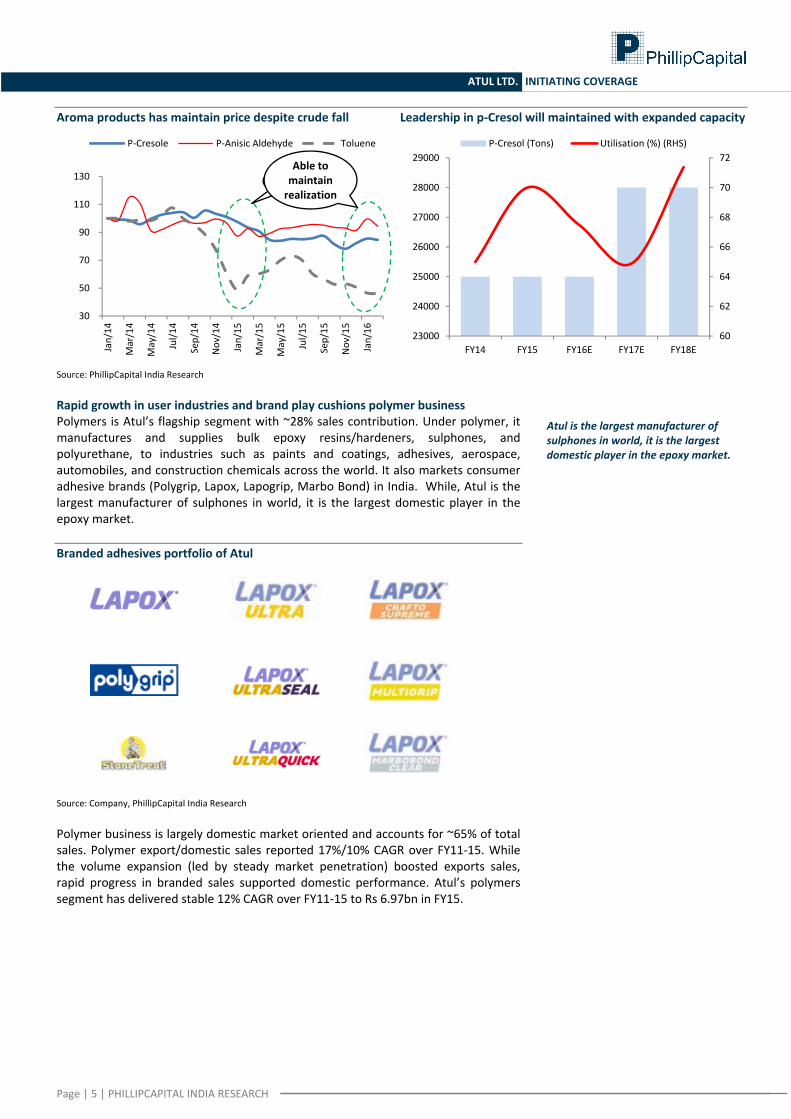
Aroma products has maintain price despite crude fall Leadership in p‐Cresol will maintained with expanded capacity
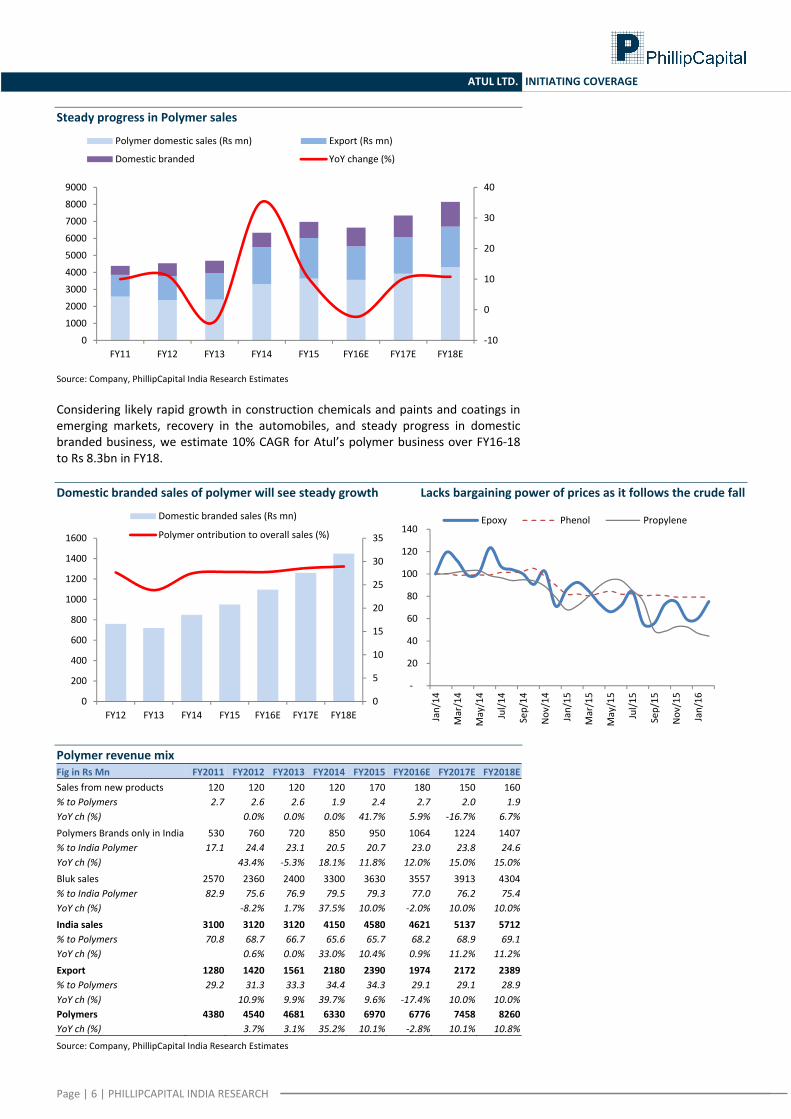
Source: PhillipCapital India Research Rapid growth in user industries and brand play cushions polymer business Polymers is Atul’s flagship segment with ~28% sales contribution. Under polymer, it manufactures and supplies bulk epoxy resins/hardeners, sulphones, and polyurethane, to industries such as paints and coatings, adhesives, aerospace, automobiles, and construction chemicals across the world. It also markets consumer adhesive brands (Polygrip, Lapox, Lapogrip, Marbo Bond) in India. While, Atul is the largest manufacturer of sulphones in world, it is the largest domestic player in the epoxy market. Branded adhesives portfolio of Atul
Source: Company, PhillipCapital India Research Polymer business is largely domestic market oriented and accounts for ~65% of total sales. Polymer export/domestic sales reported 17%/10% CAGR over FY11‐15. While the volume expansion (led by steady market penetration) boosted exports sales, rapid progress in branded sales supported domestic performance. Atul’s polymers segment has delivered stable 12% CAGR over FY11‐15 to Rs 6.97bn in FY15.
30
50
70
90
110
130
Jan/14
Mar/14
May/14
Jul/1
4
Sep/14
Nov/14
Jan/15
Mar/15
May/15
Jul/1
5
Sep/15
Nov/15
Jan/16
P‐Cresole P‐Anisic Aldehyde Toluene
Able to maintain realization
60
62
64
66
68
70
72
23000
24000
25000
26000
27000
28000
29000
FY14 FY15 FY16E FY17E FY18E
P‐Cresol (Tons) Utilisation (%) (RHS)
Atul is the largest manufacturer of sulphones in world, it is the largest domestic player in the epoxy market.
Page | 6 | PHILLIPCAPITAL INDIA RESEARCH
ATUL LTD. INITIATING COVERAGE
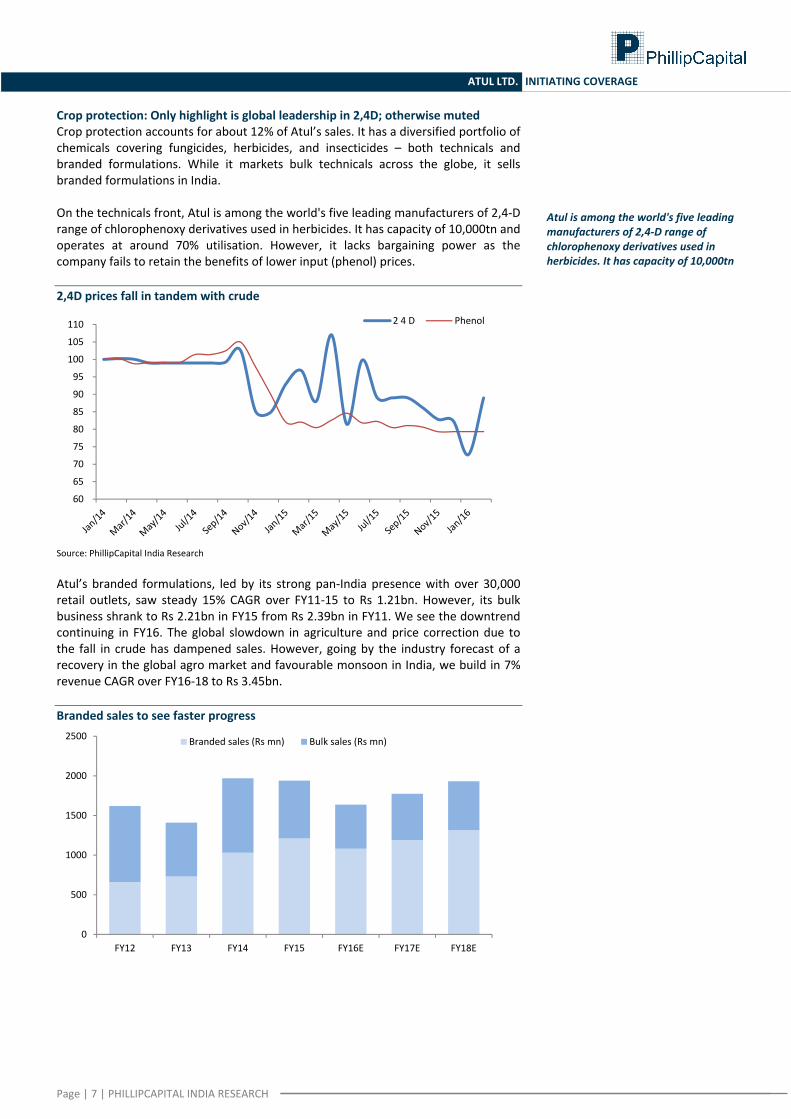
Steady progress in Polymer sales
Source: Company, PhillipCapital India Research Estimates Considering likely rapid growth in construction chemicals and paints and coatings in emerging markets, recovery in the automobiles, and steady progress in domestic branded business, we estimate 10% CAGR for Atul’s polymer business over FY16‐18 to Rs 8.3bn in FY18. Domestic branded sales of polymer will see steady growth Lacks bargaining power of prices as it follows the crude fall
Polymer revenue mix Fig in Rs Mn FY2011 FY2012 FY2013 FY2014 FY2015 FY2016E FY2017E FY2018ESales from new products 120 120 120 120 170 180 150 160% to Polymers 2.7 2.6 2.6 1.9 2.4 2.7 2.0 1.9YoY ch (%) 0.0% 0.0% 0.0% 41.7% 5.9% ‐16.7% 6.7%Polymers Brands only in India 530 760 720 850 950 1064 1224 1407% to India Polymer 17.1 24.4 23.1 20.5 20.7 23.0 23.8 24.6YoY ch (%) 43.4% ‐5.3% 18.1% 11.8% 12.0% 15.0% 15.0%Bluk sales 2570 2360 2400 3300 3630 3557 3913 4304% to India Polymer 82.9 75.6 76.9 79.5 79.3 77.0 76.2 75.4YoY ch (%) ‐8.2% 1.7% 37.5% 10.0% ‐2.0% 10.0% 10.0%India sales 3100 3120 3120 4150 4580 4621 5137 5712% to Polymers 70.8 68.7 66.7 65.6 65.7 68.2 68.9 69.1YoY ch (%) 0.6% 0.0% 33.0% 10.4% 0.9% 11.2% 11.2%Export 1280 1420 1561 2180 2390 1974 2172 2389% to Polymers 29.2 31.3 33.3 34.4 34.3 29.1 29.1 28.9YoY ch (%) 10.9% 9.9% 39.7% 9.6% ‐17.4% 10.0% 10.0%Polymers 4380 4540 4681 6330 6970 6776 7458 8260YoY ch (%) 3.7% 3.1% 35.2% 10.1% ‐2.8% 10.1% 10.8%
Source: Company, PhillipCapital India Research Estimates
‐10
0
10
20
30
40
0
1000
2000
3000
4000
5000
6000
7000
8000
9000
FY11 FY12 FY13 FY14 FY15 FY16E FY17E FY18E
Polymer domestic sales (Rs mn) Export (Rs mn)
Domestic branded YoY change (%)
0
5
10
15
20
25
30
35
0
200
400
600
800
1000
1200
1400
1600
FY12 FY13 FY14 FY15 FY16E FY17E FY18E
Domestic branded sales (Rs mn)
Polymer ontribution to overall sales (%)
‐
20
40
60
80
100
120
140
Jan/14
Mar/14
May/14
Jul/1
4
Sep/14
Nov/14
Jan/15
Mar/15
May/15
Jul/1
5
Sep/15
Nov/15
Jan/16
Epoxy Phenol Propylene
Page | 7 | PHILLIPCAPITAL INDIA RESEARCH
ATUL LTD. INITIATING COVERAGE
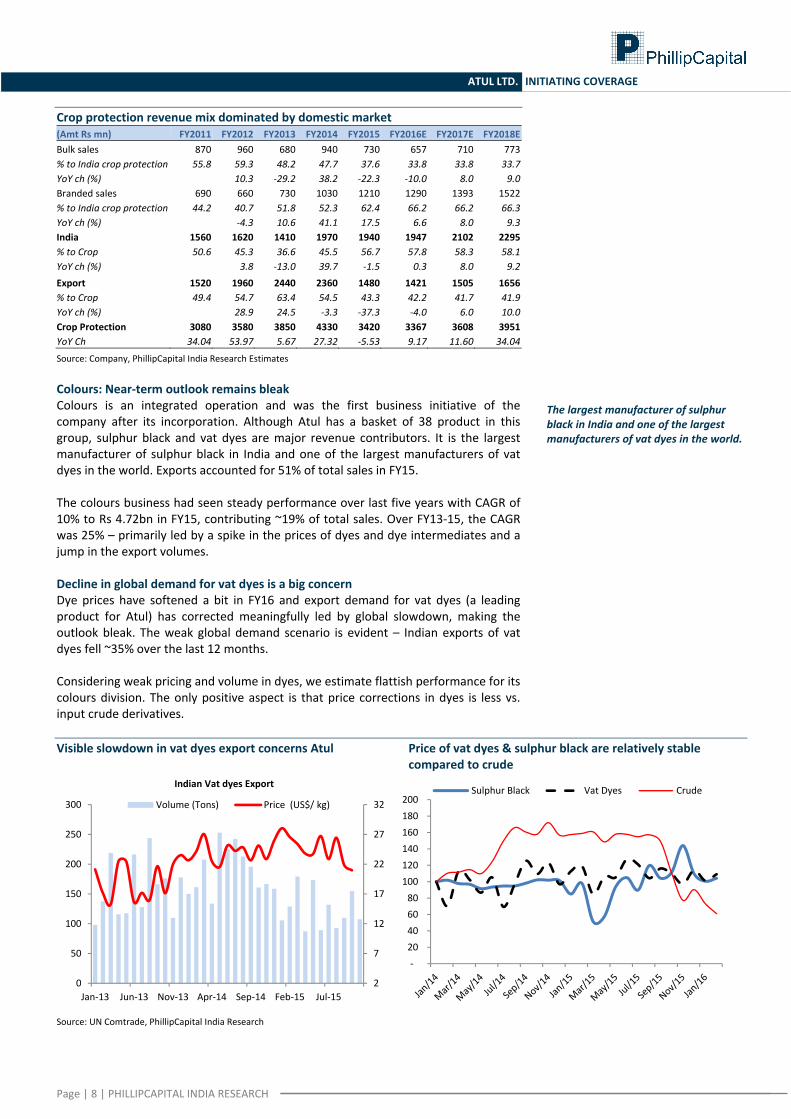
Crop protection: Only highlight is global leadership in 2,4D; otherwise muted Crop protection accounts for about 12% of Atul’s sales. It has a diversified portfolio of chemicals covering fungicides, herbicides, and insecticides – both technicals and branded formulations. While it markets bulk technicals across the globe, it sells branded formulations in India. On the technicals front, Atul is among the world's five leading manufacturers of 2,4‐D range of chlorophenoxy derivatives used in herbicides. It has capacity of 10,000tn and operates at around 70% utilisation. However, it lacks bargaining power as the company fails to retain the benefits of lower input (phenol) prices. 2,4D prices fall in tandem with crude
Source: PhillipCapital India Research Atul’s branded formulations, led by its strong pan‐India presence with over 30,000 retail outlets, saw steady 15% CAGR over FY11‐15 to Rs 1.21bn. However, its bulk business shrank to Rs 2.21bn in FY15 from Rs 2.39bn in FY11. We see the downtrend continuing in FY16. The global slowdown in agriculture and price correction due to the fall in crude has dampened sales. However, going by the industry forecast of a recovery in the global agro market and favourable monsoon in India, we build in 7% revenue CAGR over FY16‐18 to Rs 3.45bn. Branded sales to see faster progress
60
65
70
75
80
85
90
95
100
105
110 2 4 D Phenol
0
500
1000
1500
2000
2500
FY12 FY13 FY14 FY15 FY16E FY17E FY18E
Branded sales (Rs mn) Bulk sales (Rs mn)
Atul is among the world's five leading manufacturers of 2,4‐D range of chlorophenoxy derivatives used in herbicides. It has capacity of 10,000tn
Page | 8 | PHILLIPCAPITAL INDIA RESEARCH
ATUL LTD. INITIATING COVERAGE
Crop protection revenue mix dominated by domestic market (Amt Rs mn) FY2011 FY2012 FY2013 FY2014 FY2015 FY2016E FY2017E FY2018EBulk sales 870 960 680 940 730 657 710 773% to India crop protection 55.8 59.3 48.2 47.7 37.6 33.8 33.8 33.7YoY ch (%) 10.3 ‐29.2 38.2 ‐22.3 ‐10.0 8.0 9.0Branded sales 690 660 730 1030 1210 1290 1393 1522% to India crop protection 44.2 40.7 51.8 52.3 62.4 66.2 66.2 66.3YoY ch (%) ‐4.3 10.6 41.1 17.5 6.6 8.0 9.3India 1560 1620 1410 1970 1940 1947 2102 2295% to Crop 50.6 45.3 36.6 45.5 56.7 57.8 58.3 58.1YoY ch (%) 3.8 ‐13.0 39.7 ‐1.5 0.3 8.0 9.2Export 1520 1960 2440 2360 1480 1421 1505 1656% to Crop 49.4 54.7 63.4 54.5 43.3 42.2 41.7 41.9YoY ch (%) 28.9 24.5 ‐3.3 ‐37.3 ‐4.0 6.0 10.0Crop Protection 3080 3580 3850 4330 3420 3367 3608 3951YoY Ch 34.04 53.97 5.67 27.32 ‐5.53 9.17 11.60 34.04
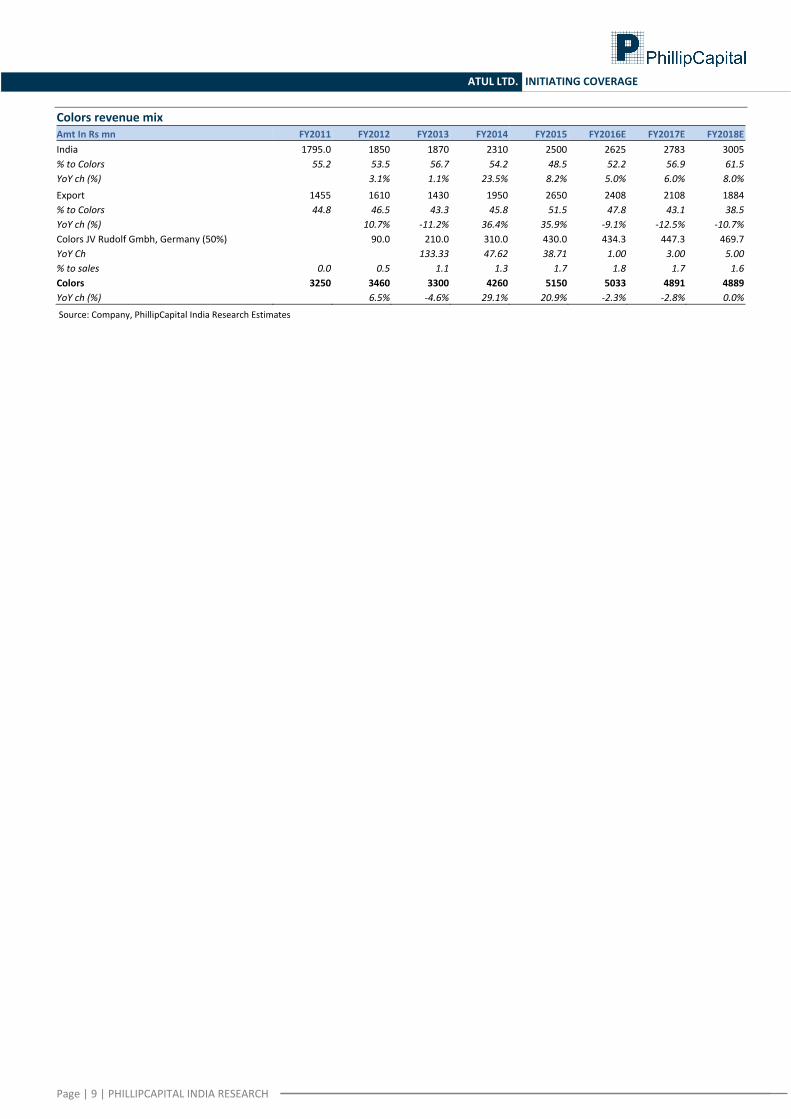
Source: Company, PhillipCapital India Research Estimates Colours: Near‐term outlook remains bleak Colours is an integrated operation and was the first business initiative of the company after its incorporation. Although Atul has a basket of 38 product in this group, sulphur black and vat dyes are major revenue contributors. It is the largest manufacturer of sulphur black in India and one of the largest manufacturers of vat dyes in the world. Exports accounted for 51% of total sales in FY15.
The colours business had seen steady performance over last five years with CAGR of 10% to Rs 4.72bn in FY15, contributing ~19% of total sales. Over FY13‐15, the CAGR was 25% – primarily led by a spike in the prices of dyes and dye intermediates and a jump in the export volumes. Decline in global demand for vat dyes is a big concern Dye prices have softened a bit in FY16 and export demand for vat dyes (a leading product for Atul) has corrected meaningfully led by global slowdown, making the outlook bleak. The weak global demand scenario is evident – Indian exports of vat dyes fell ~35% over the last 12 months. Considering weak pricing and volume in dyes, we estimate flattish performance for its colours division. The only positive aspect is that price corrections in dyes is less vs. input crude derivatives. Visible slowdown in vat dyes export concerns Atul Price of vat dyes & sulphur black are relatively stable compared to crude
Source: UN Comtrade, PhillipCapital India Research
2
7
12
17
22
27
32
0
50
100
150
200
250
300
Jan‐13 Jun‐13 Nov‐13 Apr‐14 Sep‐14 Feb‐15 Jul‐15
Indian Vat dyes Export
Volume (Tons) Price (US$/ kg)
‐20 40 60 80 100 120 140 160 180 200
Sulphur Black Vat Dyes Crude
The largest manufacturer of sulphur black in India and one of the largest manufacturers of vat dyes in the world.
Page | 9 | PHILLIPCAPITAL INDIA RESEARCH
ATUL LTD. INITIATING COVERAGE
Colors revenue mix Amt In Rs mn FY2011 FY2012 FY2013 FY2014 FY2015 FY2016E FY2017E FY2018EIndia 1795.0 1850 1870 2310 2500 2625 2783 3005% to Colors 55.2 53.5 56.7 54.2 48.5 52.2 56.9 61.5YoY ch (%) 3.1% 1.1% 23.5% 8.2% 5.0% 6.0% 8.0%Export 1455 1610 1430 1950 2650 2408 2108 1884% to Colors 44.8 46.5 43.3 45.8 51.5 47.8 43.1 38.5YoY ch (%) 10.7% ‐11.2% 36.4% 35.9% ‐9.1% ‐12.5% ‐10.7%Colors JV Rudolf Gmbh, Germany (50%) 90.0 210.0 310.0 430.0 434.3 447.3 469.7YoY Ch 133.33 47.62 38.71 1.00 3.00 5.00% to sales 0.0 0.5 1.1 1.3 1.7 1.8 1.7 1.6Colors 3250 3460 3300 4260 5150 5033 4891 4889YoY ch (%) 6.5% ‐4.6% 29.1% 20.9% ‐2.3% ‐2.8% 0.0%
Source: Company, PhillipCapital India Research Estimates
Page | 10 | PHILLIPCAPITAL INDIA RESEARCH
ATUL LTD. INITIATING COVERAGE
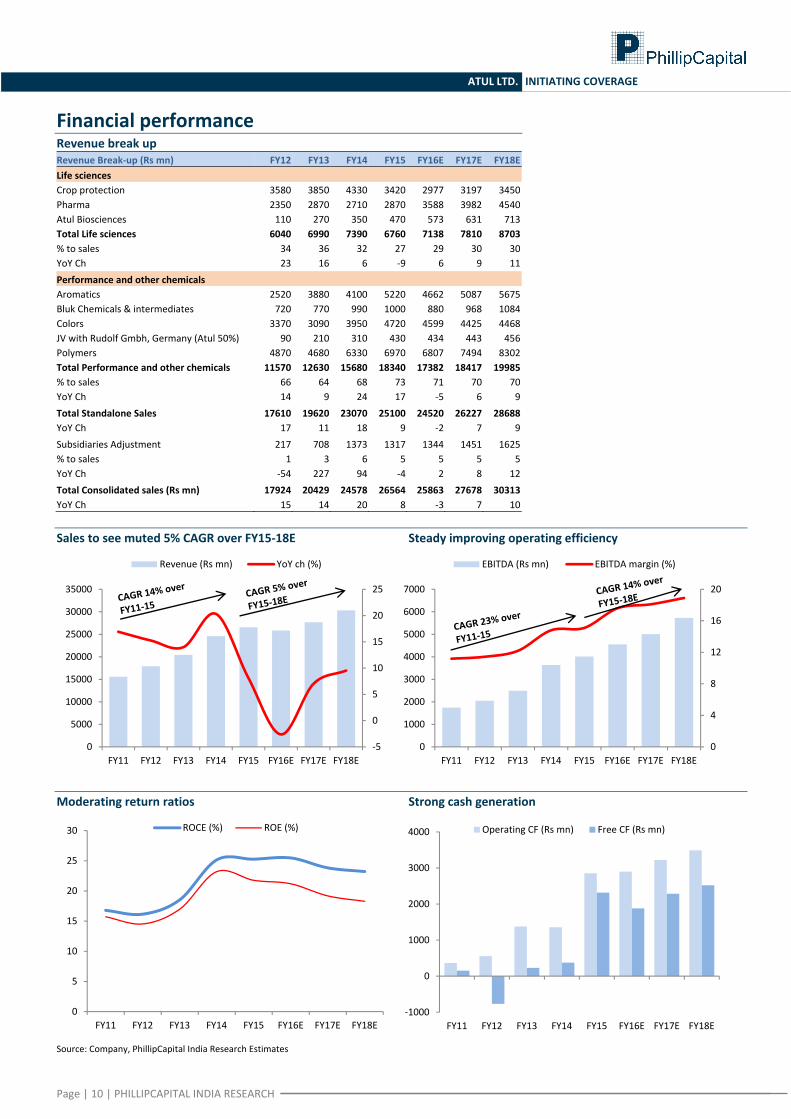
Financial performance Revenue break up Revenue Break‐up (Rs mn) FY12 FY13 FY14 FY15 FY16E FY17E FY18ELife sciences Crop protection 3580 3850 4330 3420 2977 3197 3450Pharma 2350 2870 2710 2870 3588 3982 4540Atul Biosciences 110 270 350 470 573 631 713Total Life sciences 6040 6990 7390 6760 7138 7810 8703% to sales 34 36 32 27 29 30 30YoY Ch 23 16 6 ‐9 6 9 11Performance and other chemicals Aromatics 2520 3880 4100 5220 4662 5087 5675Bluk Chemicals & intermediates 720 770 990 1000 880 968 1084Colors 3370 3090 3950 4720 4599 4425 4468JV with Rudolf Gmbh, Germany (Atul 50%) 90 210 310 430 434 443 456Polymers 4870 4680 6330 6970 6807 7494 8302Total Performance and other chemicals 11570 12630 15680 18340 17382 18417 19985% to sales 66 64 68 73 71 70 70YoY Ch 14 9 24 17 ‐5 6 9Total Standalone Sales 17610 19620 23070 25100 24520 26227 28688YoY Ch 17 11 18 9 ‐2 7 9Subsidiaries Adjustment 217 708 1373 1317 1344 1451 1625% to sales 1 3 6 5 5 5 5YoY Ch ‐54 227 94 ‐4 2 8 12Total Consolidated sales (Rs mn) 17924 20429 24578 26564 25863 27678 30313YoY Ch 15 14 20 8 ‐3 7 10
Sales to see muted 5% CAGR over FY15‐18E Steady improving operating efficiency
Moderating return ratios Strong cash generation
Source: Company, PhillipCapital India Research Estimates
‐5
0
5
10
15
20
25
0
5000
10000
15000
20000
25000
30000
35000
FY11 FY12 FY13 FY14 FY15 FY16E FY17E FY18E
Revenue (Rs mn) YoY ch (%)
0
4
8
12
16
20
0
1000
2000
3000
4000
5000
6000
7000
FY11 FY12 FY13 FY14 FY15 FY16E FY17E FY18E
EBITDA (Rs mn) EBITDA margin (%)
0
5
10
15
20
25
30
FY11 FY12 FY13 FY14 FY15 FY16E FY17E FY18E
ROCE (%) ROE (%)
‐1000
0
1000
2000
3000
4000
FY11 FY12 FY13 FY14 FY15 FY16E FY17E FY18E
Operating CF (Rs mn) Free CF (Rs mn)
Page | 11 | PHILLIPCAPITAL INDIA RESEARCH
ATUL LTD. INITIATING COVERAGE
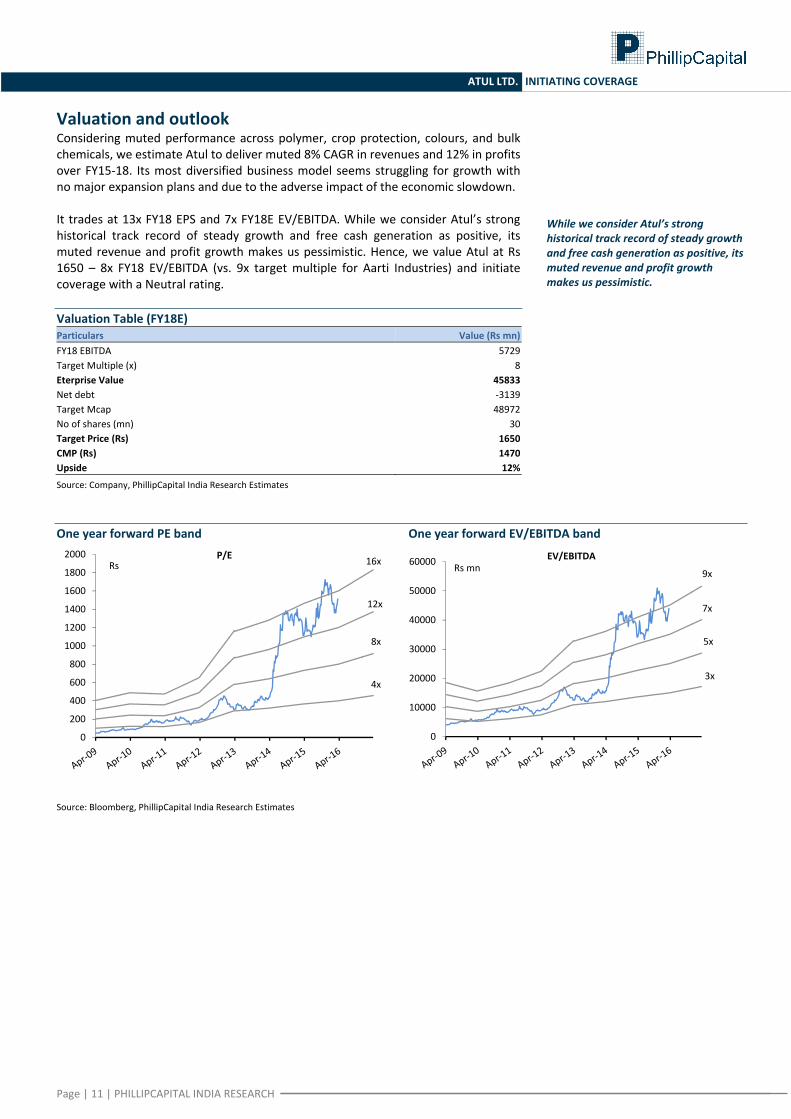
Valuation and outlook Considering muted performance across polymer, crop protection, colours, and bulk chemicals, we estimate Atul to deliver muted 8% CAGR in revenues and 12% in profits over FY15‐18. Its most diversified business model seems struggling for growth with no major expansion plans and due to the adverse impact of the economic slowdown. It trades at 13x FY18 EPS and 7x FY18E EV/EBITDA. While we consider Atul’s strong historical track record of steady growth and free cash generation as positive, its muted revenue and profit growth makes us pessimistic. Hence, we value Atul at Rs 1650 – 8x FY18 EV/EBITDA (vs. 9x target multiple for Aarti Industries) and initiate coverage with a Neutral rating. Valuation Table (FY18E) Particulars Value (Rs mn)FY18 EBITDA 5729Target Multiple (x) 8Eterprise Value 45833Net debt ‐3139Target Mcap 48972No of shares (mn) 30Target Price (Rs) 1650CMP (Rs) 1470Upside 12%
Source: Company, PhillipCapital India Research Estimates One year forward PE band One year forward EV/EBITDA band
Source: Bloomberg, PhillipCapital India Research Estimates
4x
8x
12x
16x
0
200
400
600
800
1000
1200
1400
1600
1800
2000Rs
P/E
3x
5x
7x
9x
0
10000
20000
30000
40000
50000
60000 Rs mnEV/EBITDA
While we consider Atul’s strong historical track record of steady growth and free cash generation as positive, its muted revenue and profit growth makes us pessimistic.
Page | 12 | PHILLIPCAPITAL INDIA RESEARCH
ATUL LTD. INITIATING COVERAGE
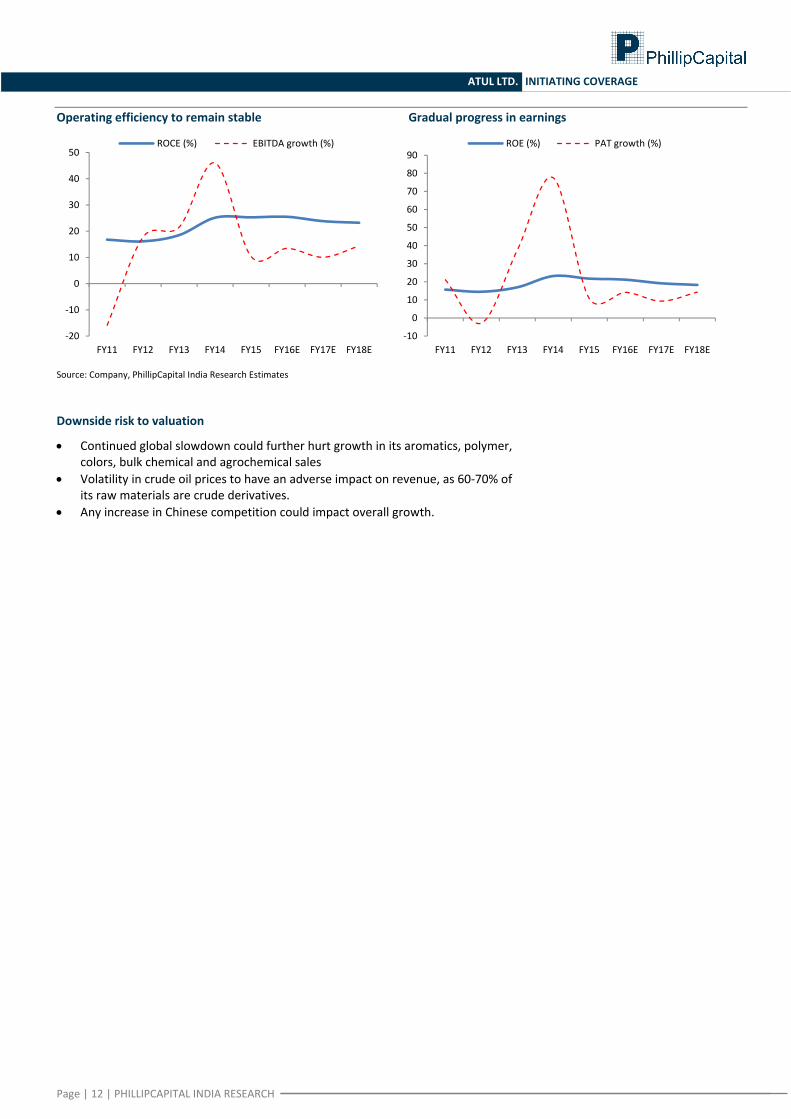
Operating efficiency to remain stable Gradual progress in earnings
Source: Company, PhillipCapital India Research Estimates Downside risk to valuation
• Continued global slowdown could further hurt growth in its aromatics, polymer, colors, bulk chemical and agrochemical sales
• Volatility in crude oil prices to have an adverse impact on revenue, as 60‐70% of its raw materials are crude derivatives.
• Any increase in Chinese competition could impact overall growth.
‐20
‐10
0
10
20
30
40
50
FY11 FY12 FY13 FY14 FY15 FY16E FY17E FY18E
ROCE (%) EBITDA growth (%)
‐10
0
10
20
30
40
50
60
70
80
90
FY11 FY12 FY13 FY14 FY15 FY16E FY17E FY18E
ROE (%) PAT growth (%)
Page | 13 | PHILLIPCAPITAL INDIA RESEARCH
ATUL LTD. INITIATING COVERAGE
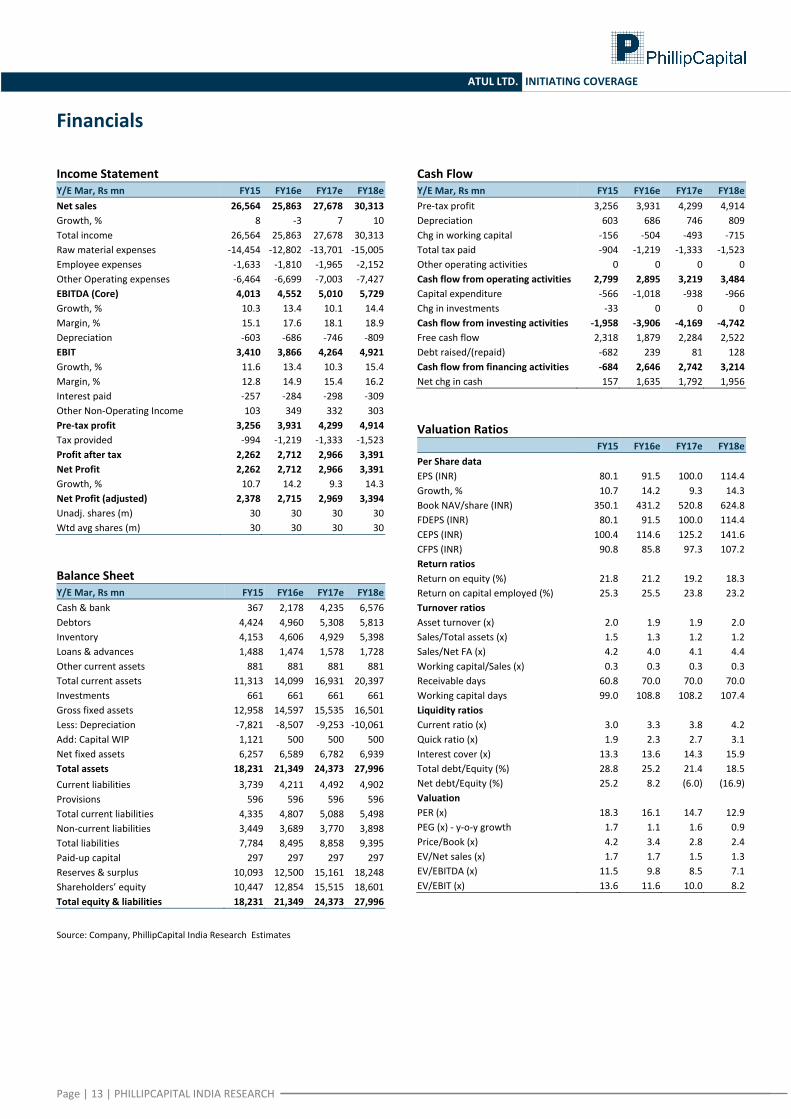
Financials
Income Statement Y/E Mar, Rs mn FY15 FY16e FY17e FY18eNet sales 26,564 25,863 27,678 30,313Growth, % 8 ‐3 7 10Total income 26,564 25,863 27,678 30,313Raw material expenses ‐14,454 ‐12,802 ‐13,701 ‐15,005Employee expenses ‐1,633 ‐1,810 ‐1,965 ‐2,152Other Operating expenses ‐6,464 ‐6,699 ‐7,003 ‐7,427EBITDA (Core) 4,013 4,552 5,010 5,729Growth, % 10.3 13.4 10.1 14.4Margin, % 15.1 17.6 18.1 18.9Depreciation ‐603 ‐686 ‐746 ‐809EBIT 3,410 3,866 4,264 4,921Growth, % 11.6 13.4 10.3 15.4Margin, % 12.8 14.9 15.4 16.2Interest paid ‐257 ‐284 ‐298 ‐309Other Non‐Operating Income 103 349 332 303Pre‐tax profit 3,256 3,931 4,299 4,914Tax provided ‐994 ‐1,219 ‐1,333 ‐1,523Profit after tax 2,262 2,712 2,966 3,391Net Profit 2,262 2,712 2,966 3,391Growth, % 10.7 14.2 9.3 14.3Net Profit (adjusted) 2,378 2,715 2,969 3,394Unadj. shares (m) 30 30 30 30Wtd avg shares (m) 30 30 30 30 Balance Sheet Y/E Mar, Rs mn FY15 FY16e FY17e FY18eCash & bank 367 2,178 4,235 6,576Debtors 4,424 4,960 5,308 5,813Inventory 4,153 4,606 4,929 5,398Loans & advances 1,488 1,474 1,578 1,728Other current assets 881 881 881 881Total current assets 11,313 14,099 16,931 20,397Investments 661 661 661 661Gross fixed assets 12,958 14,597 15,535 16,501Less: Depreciation ‐7,821 ‐8,507 ‐9,253 ‐10,061Add: Capital WIP 1,121 500 500 500Net fixed assets 6,257 6,589 6,782 6,939Total assets 18,231 21,349 24,373 27,996Current liabilities 3,739 4,211 4,492 4,902Provisions 596 596 596 596Total current liabilities 4,335 4,807 5,088 5,498Non‐current liabilities 3,449 3,689 3,770 3,898Total liabilities 7,784 8,495 8,858 9,395Paid‐up capital 297 297 297 297Reserves & surplus 10,093 12,500 15,161 18,248Shareholders’ equity 10,447 12,854 15,515 18,601Total equity & liabilities 18,231 21,349 24,373 27,996 Source: Company, PhillipCapital India Research Estimates
Cash Flow Y/E Mar, Rs mn FY15 FY16e FY17e FY18ePre‐tax profit 3,256 3,931 4,299 4,914Depreciation 603 686 746 809Chg in working capital ‐156 ‐504 ‐493 ‐715Total tax paid ‐904 ‐1,219 ‐1,333 ‐1,523Other operating activities 0 0 0 0Cash flow from operating activities 2,799 2,895 3,219 3,484Capital expenditure ‐566 ‐1,018 ‐938 ‐966Chg in investments ‐33 0 0 0Cash flow from investing activities ‐1,958 ‐3,906 ‐4,169 ‐4,742Free cash flow 2,318 1,879 2,284 2,522Debt raised/(repaid) ‐682 239 81 128Cash flow from financing activities ‐684 2,646 2,742 3,214Net chg in cash 157 1,635 1,792 1,956 Valuation Ratios
FY15 FY16e FY17e FY18ePer Share data EPS (INR) 80.1 91.5 100.0 114.4Growth, % 10.7 14.2 9.3 14.3Book NAV/share (INR) 350.1 431.2 520.8 624.8FDEPS (INR) 80.1 91.5 100.0 114.4CEPS (INR) 100.4 114.6 125.2 141.6CFPS (INR) 90.8 85.8 97.3 107.2Return ratios Return on equity (%) 21.8 21.2 19.2 18.3Return on capital employed (%) 25.3 25.5 23.8 23.2Turnover ratios Asset turnover (x) 2.0 1.9 1.9 2.0Sales/Total assets (x) 1.5 1.3 1.2 1.2Sales/Net FA (x) 4.2 4.0 4.1 4.4Working capital/Sales (x) 0.3 0.3 0.3 0.3Receivable days 60.8 70.0 70.0 70.0Working capital days 99.0 108.8 108.2 107.4Liquidity ratios Current ratio (x) 3.0 3.3 3.8 4.2Quick ratio (x) 1.9 2.3 2.7 3.1Interest cover (x) 13.3 13.6 14.3 15.9Total debt/Equity (%) 28.8 25.2 21.4 18.5Net debt/Equity (%) 25.2 8.2 (6.0) (16.9)Valuation PER (x) 18.3 16.1 14.7 12.9PEG (x) ‐ y‐o‐y growth 1.7 1.1 1.6 0.9Price/Book (x) 4.2 3.4 2.8 2.4EV/Net sales (x) 1.7 1.7 1.5 1.3EV/EBITDA (x) 11.5 9.8 8.5 7.1EV/EBIT (x) 13.6 11.6 10.0 8.2
Page | 14 | PHILLIPCAPITAL INDIA RESEARCH
INITIATING COVERAGE ATUL LTD
Rating Methodology We rate stock on absolute return basis. Our target price for the stocks has an investment horizon of one year. Rating Criteria Definition
BUY >= +15% Target price is equal to or more than 15% of current market price
NEUTRAL ‐15% > to < +15% Target price is less than +15% but more than ‐15%
SELL <= ‐15% Target price is less than or equal to ‐15%.
Contact Information (Regional Member Companies)
SINGAPORE: Phillip Securities Pte Ltd 250 North Bridge Road, #06‐00 Raffles City Tower,
Singapore 179101 Tel : (65) 6533 6001 Fax: (65) 6535 3834
www.phillip.com.sg
MALAYSIA: Phillip Capital Management Sdn Bhd B‐3‐6 Block B Level 3, Megan Avenue II,
No. 12, Jalan Yap Kwan Seng, 50450 Kuala Lumpur Tel (60) 3 2162 8841 Fax (60) 3 2166 5099
www.poems.com.my
HONG KONG: Phillip Securities (HK) Ltd 11/F United Centre 95 Queensway Hong Kong Tel (852) 2277 6600 Fax: (852) 2868 5307
www.phillip.com.hk
JAPAN: Phillip Securities Japan, Ltd 4‐2 Nihonbashi Kabutocho, Chuo‐ku
Tokyo 103‐0026 Tel: (81) 3 3666 2101 Fax: (81) 3 3664 0141
www.phillip.co.jp
INDONESIA: PT Phillip Securities Indonesia ANZ Tower Level 23B, Jl Jend Sudirman Kav 33A,
Jakarta 10220, Indonesia Tel (62) 21 5790 0800 Fax: (62) 21 5790 0809
www.phillip.co.id
CHINA: Phillip Financial Advisory (Shanghai) Co. Ltd. No 550 Yan An East Road, Ocean Tower Unit 2318
Shanghai 200 001 Tel (86) 21 5169 9200 Fax: (86) 21 6351 2940
www.phillip.com.cn
THAILAND: Phillip Securities (Thailand) Public Co. Ltd. 15th Floor, Vorawat Building, 849 Silom Road,
Silom, Bangrak, Bangkok 10500 Thailand Tel (66) 2 2268 0999 Fax: (66) 2 2268 0921
www.phillip.co.th
FRANCE: King & Shaxson Capital Ltd. 3rd Floor, 35 Rue de la Bienfaisance
75008 Paris France Tel (33) 1 4563 3100 Fax : (33) 1 4563 6017
www.kingandshaxson.com
UNITED KINGDOM: King & Shaxson Ltd. 6th Floor, Candlewick House, 120 Cannon Street
London, EC4N 6AS Tel (44) 20 7929 5300 Fax: (44) 20 7283 6835
www.kingandshaxson.com
UNITED STATES: Phillip Futures Inc. 141 W Jackson Blvd Ste 3050
The Chicago Board of Trade Building Chicago, IL 60604 USA
Tel (1) 312 356 9000 Fax: (1) 312 356 9005
AUSTRALIA: PhillipCapital Australia Level 37, 530 Collins Street
Melbourne, Victoria 3000, Australia Tel: (61) 3 9629 8380 Fax: (61) 3 9614 8309
www.phillipcapital.com.au
SRI LANKA: Asha Phillip Securities Limited Level 4, Millennium House, 46/58 Navam Mawatha,
Colombo 2, Sri Lanka Tel: (94) 11 2429 100 Fax: (94) 11 2429 199
www.ashaphillip.net/home.htm
INDIA: PhillipCapital (India) Private Limited No. 1, 18th Floor, Urmi Estate, 95 Ganpatrao Kadam Marg, Lower Parel West, Mumbai 400013
Tel: (9122) 2300 2999 Fax: (9122) 6667 9955 www.phillipcapital.in
Management(91 22) 2483 1919
Kinshuk Bharti Tiwari (Head – Institutional Equity) (91 22) 6667 9946(91 22) 6667 9735
Research Infrastructure & IT Services Strategy
Dhawal Doshi (9122) 6667 9769 Vibhor Singhal (9122) 6667 9949 Naveen Kulkarni, CFA, FRM (9122) 6667 9947Nitesh Sharma, CFA (9122) 6667 9965 Logistics, Transportation & Midcap Anindya Bhowmik (9122) 6667 9764Agri Inputs Vikram Suryavanshi (9122) 6667 9951 TelecomGauri Anand (9122) 6667 9943 Media Naveen Kulkarni, CFA, FRM (9122) 6667 9947Banking, NBFCs Manoj Behera (9122) 6667 9973 Manoj Behera (9122) 6667 9973Manish Agarwalla (9122) 6667 9962 Metals TechnicalsPradeep Agrawal (9122) 6667 9953 Dhawal Doshi (9122) 6667 9769 Subodh Gupta, CMT (9122) 6667 9762Paresh Jain (9122) 6667 9948 Yash Doshi (9122) 6667 9987 Production ManagerConsumer Midcap Ganesh Deorukhkar (9122) 6667 9966Naveen Kulkarni, CFA, FRM (9122) 6667 9947 Amol Rao (9122) 6667 9952 EditorJubil Jain (9122) 6667 9766 Oil & Gas Roshan Sony 98199 72726Cement Sabri Hazarika (9122) 6667 9756 Sr. Manager – Equities SupportVaibhav Agarwal (9122) 6667 9967 Pharma & Speciality Chem Rosie Ferns (9122) 6667 9971Economics Surya Patra (9122) 6667 9768Anjali Verma (9122) 6667 9969 Mehul Sheth (9122) 6667 9996Engineering, Capital Goods Mid‐Caps & Database ManagerJonas Bhutta (9122) 6667 9759 Deepak Agarwal (9122) 6667 9944Hrishikesh Bhagat (9122) 6667 9986Sales & Distribution Ashvin Patil (9122) 6667 9991 Sales Trader Zarine Damania (9122) 6667 9976Shubhangi Agrawal (9122) 6667 9964 Dilesh Doshi (9122) 6667 9747 Kishor Binwal (9122) 6667 9989 Suniil Pandit (9122) 6667 9745Bhavin Shah (9122) 6667 9974 ExecutionAshka Mehta Gulati (9122) 6667 9934 Mayur Shah (9122) 6667 9945
Corporate Communications
Vineet Bhatnagar (Managing Director)
Jignesh Shah (Head – Equity Derivatives)
Automobiles
Page | 15 | PHILLIPCAPITAL INDIA RESEARCH
INITIATING COVERAGE ATUL LTD
Disclosures and Disclaimers PhillipCapital (India) Pvt. Ltd. has three independent equity research groups: Institutional Equities, Institutional Equity Derivatives, and Private Client Group. This report has been prepared by Institutional Equities Group. The views and opinions expressed in this document may, may not match, or may be contrary at times with the views, estimates, rating, and target price of the other equity research groups of PhillipCapital (India) Pvt. Ltd.
This report is issued by PhillipCapital (India) Pvt. Ltd., which is regulated by the SEBI. PhillipCapital (India) Pvt. Ltd. is a subsidiary of Phillip (Mauritius) Pvt. Ltd. References to "PCIPL" in this report shall mean PhillipCapital (India) Pvt. Ltd unless otherwise stated. This report is prepared and distributed by PCIPL for information purposes only, and neither the information contained herein, nor any opinion expressed should be construed or deemed to be construed as solicitation or as offering advice for the purposes of the purchase or sale of any security, investment, or derivatives. The information and opinions contained in the report were considered by PCIPL to be valid when published. The report also contains information provided to PCIPL by third parties. The source of such information will usually be disclosed in the report. Whilst PCIPL has taken all reasonable steps to ensure that this information is correct, PCIPL does not offer any warranty as to the accuracy or completeness of such information. Any person placing reliance on the report to undertake trading does so entirely at his or her own risk and PCIPL does not accept any liability as a result. Securities and Derivatives markets may be subject to rapid and unexpected price movements and past performance is not necessarily an indication of future performance.
This report does not regard the specific investment objectives, financial situation, and the particular needs of any specific person who may receive this report. Investors must undertake independent analysis with their own legal, tax, and financial advisors and reach their own conclusions regarding the appropriateness of investing in any securities or investment strategies discussed or recommended in this report and should understand that statements regarding future prospects may not be realised. Under no circumstances can it be used or considered as an offer to sell or as a solicitation of any offer to buy or sell the securities mentioned within it. The information contained in the research reports may have been taken from trade and statistical services and other sources, which PCIL believe is reliable. PhillipCapital (India) Pvt. Ltd. or any of its group/associate/affiliate companies do not guarantee that such information is accurate or complete and it should not be relied upon as such. Any opinions expressed reflect judgments at this date and are subject to change without notice.
Important: These disclosures and disclaimers must be read in conjunction with the research report of which it forms part. Receipt and use of the research report is subject to all aspects of these disclosures and disclaimers. Additional information about the issuers and securities discussed in this research report is available on request.
Certifications: The research analyst(s) who prepared this research report hereby certifies that the views expressed in this research report accurately reflect the research analyst’s personal views about all of the subject issuers and/or securities, that the analyst(s) have no known conflict of interest and no part of the research analyst’s compensation was, is, or will be, directly or indirectly, related to the specific views or recommendations contained in this research report.
Additional Disclosures of Interest: Unless specifically mentioned in Point No. 9 below: 1. The Research Analyst(s), PCIL, or its associates or relatives of the Research Analyst does not have any financial interest in the company(ies) covered in
this report. 2. The Research Analyst, PCIL or its associates or relatives of the Research Analyst affiliates collectively do not hold more than 1% of the securities of the
company (ies)covered in this report as of the end of the month immediately preceding the distribution of the research report. 3. The Research Analyst, his/her associate, his/her relative, and PCIL, do not have any other material conflict of interest at the time of publication of this
research report. 4. The Research Analyst, PCIL, and its associates have not received compensation for investment banking or merchant banking or brokerage services or for
any other products or services from the company(ies) covered in this report, in the past twelve months. 5. The Research Analyst, PCIL or its associates have not managed or co‐managed in the previous twelve months, a private or public offering of securities for
the company (ies) covered in this report. 6. PCIL or its associates have not received compensation or other benefits from the company(ies) covered in this report or from any third party, in
connection with the research report. 7. The Research Analyst has not served as an Officer, Director, or employee of the company (ies) covered in the Research report. 8. The Research Analyst and PCIL has not been engaged in market making activity for the company(ies) covered in the Research report. 9. Details of PCIL, Research Analyst and its associates pertaining to the companies covered in the Research report: Sr. no. Particulars Yes/No
1 Whether compensation has been received from the company(ies) covered in the Research report in the past 12 months for investment banking transaction by PCIL
No
2 Whether Research Analyst, PCIL or its associates or relatives of the Research Analyst affiliates collectively hold more than 1% of thecompany(ies) covered in the Research report
No
3 Whether compensation has been received by PCIL or its associates from the company(ies) covered in the Research report No4 PCIL or its affiliates have managed or co‐managed in the previous twelve months a private or public offering of securities for the
company(ies) covered in the Research report No
5 Research Analyst, his associate, PCIL or its associates have received compensation for investment banking or merchant banking or brokerage services or for any other products or services from the company(ies) covered in the Research report, in the last twelve months
No
Independence: PhillipCapital (India) Pvt. Ltd. has not had an investment banking relationship with, and has not received any compensation for investment banking services from, the subject issuers in the past twelve (12) months, and PhillipCapital (India) Pvt. Ltd does not anticipate receiving or intend to seek compensation for investment banking services from the subject issuers in the next three (3) months. PhillipCapital (India) Pvt. Ltd is not a market maker in the securities mentioned in this research report, although it, or its affiliates/employees, may have positions in, purchase or sell, or be materially interested in any of the securities covered in the report.
Suitability and Risks: This research report is for informational purposes only and is not tailored to the specific investment objectives, financial situation or particular requirements of any individual recipient hereof. Certain securities may give rise to substantial risks and may not be suitable for certain investors. Each investor must make its own determination as to the appropriateness of any securities referred to in this research report based upon the legal, tax and accounting considerations applicable to such investor and its own investment objectives or strategy, its financial situation and its investing experience. The value of any security may be positively or adversely affected by changes in foreign exchange or interest rates, as well as by other financial, economic, or political factors. Past performance is not necessarily indicative of future performance or results.
Page | 16 | PHILLIPCAPITAL INDIA RESEARCH
INITIATING COVERAGE ATUL LTD
Sources, Completeness and Accuracy: The material herein is based upon information obtained from sources that PCIPL and the research analyst believe to be reliable, but neither PCIPL nor the research analyst represents or guarantees that the information contained herein is accurate or complete and it should not be relied upon as such. Opinions expressed herein are current opinions as of the date appearing on this material, and are subject to change without notice. Furthermore, PCIPL is under no obligation to update or keep the information current. Without limiting any of the foregoing, in no event shall PCIL, any of its affiliates/employees or any third party involved in, or related to computing or compiling the information have any liability for any damages of any kind including but not limited to any direct or consequential loss or damage, however arising, from the use of this document.
Copyright: The copyright in this research report belongs exclusively to PCIPL. All rights are reserved. Any unauthorised use or disclosure is prohibited. No reprinting or reproduction, in whole or in part, is permitted without the PCIPL’s prior consent, except that a recipient may reprint it for internal circulation only and only if it is reprinted in its entirety.
Caution: Risk of loss in trading/investment can be substantial and even more than the amount / margin given by you. The recipient should carefully consider whether trading/investment is appropriate for the recipient in light of the recipient’s experience, objectives, financial resources and other relevant circumstances. PCIPL and any of its employees, directors, associates, group entities, or affiliates shall not be liable for losses, if any, incurred by the recipient. The recipient is further cautioned that trading/investments in financial markets are subject to market risks and are advised to seek trading/investment advice before investing. There is no guarantee/assurance as to returns or profits or capital protection or appreciation. PCIPL and any of its employees, directors, associates, group entities, affiliates are not inducing the recipient for trading/investing in the financial market(s). Trading/Investment decision is the sole responsibility of the recipient.
For U.S. persons only: This research report is a product of PhillipCapital (India) Pvt Ltd., which is the employer of the research analyst(s) who has prepared the research report. The research analyst(s) preparing the research report is/are resident outside the United States (U.S.) and are not associated persons of any U.S.‐regulated broker‐dealer and therefore the analyst(s) is/are not subject to supervision by a U.S. broker‐dealer, and is/are not required to satisfy the regulatory licensing requirements of FINRA or required to otherwise comply with U.S. rules or regulations regarding, among other things, communications with a subject company, public appearances, and trading securities held by a research analyst account.
This report is intended for distribution by PhillipCapital (India) Pvt Ltd. only to "Major Institutional Investors" as defined by Rule 15a‐6(b)(4) of the U.S. Securities and Exchange Act, 1934 (the Exchange Act) and interpretations thereof by the U.S. Securities and Exchange Commission (SEC) in reliance on Rule 15a 6(a)(2). If the recipient of this report is not a Major Institutional Investor as specified above, then it should not act upon this report and return the same to the sender. Further, this report may not be copied, duplicated, and/or transmitted onward to any U.S. person, which is not a Major Institutional Investor.
In reliance on the exemption from registration provided by Rule 15a‐6 of the Exchange Act and interpretations thereof by the SEC in order to conduct certain business with Major Institutional Investors, PhillipCapital (India) Pvt Ltd. has entered into an agreement with a U.S. registered broker‐dealer, Decker & Co, LLC. Transactions in securities discussed in this research report should be effected through Decker & Co, LLC or another U.S. registered broker dealer PhillipCapital (India) Pvt. Ltd. Registered office: No. 1, 18th Floor, Urmi Estate, 95 Ganpatrao Kadam Marg, Lower Parel West, Mumbai 400013