Embed Size (px)
DESCRIPTION
Institute for Supply Management (ISM) Manufacturing Survey. Published by: Institute for Supply Management Frequency: Monthly Period Covered: Prior Month Market Significance: Very High Web Site: http://www.ism.ws Presented by: Jesse Garate Victor M Lorenzo. What is it?. - PowerPoint PPT Presentation
Citation preview
Institute for Supply Management (ISM) Manufacturing Survey
Published by: Institute for Supply Management
Frequency: Monthly
Period Covered: Prior Month
Market Significance: Very High
Web Site: http://www.ism.ws
Presented by: Jesse Garate
Victor M Lorenzo
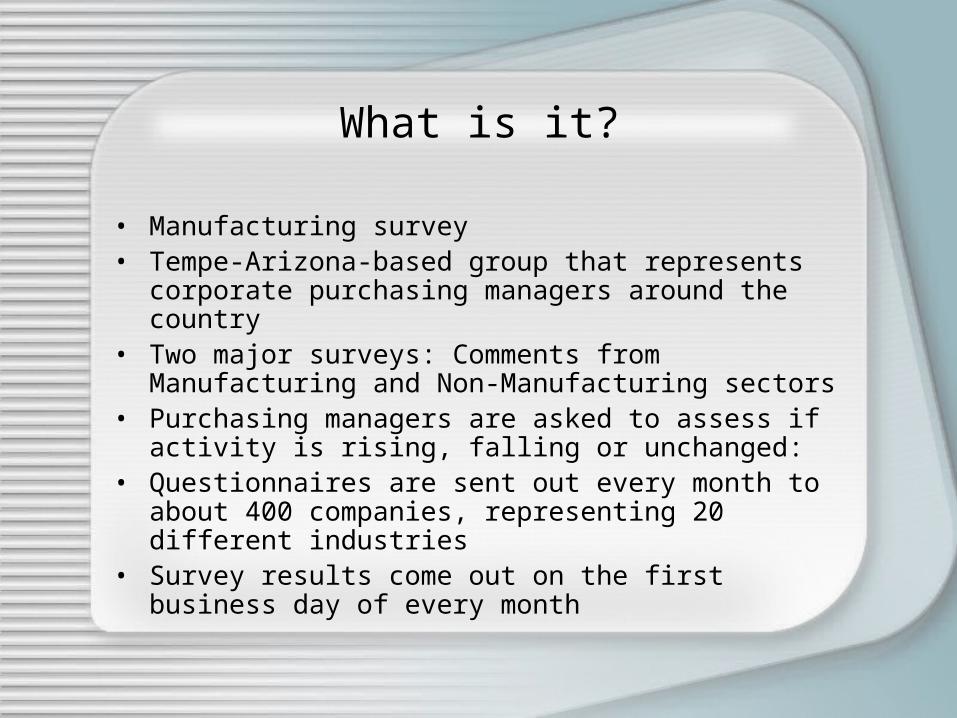
What is it?
• Manufacturing survey• Tempe-Arizona-based group that represents corporate purchasing
managers around the country• Two major surveys: Comments from Manufacturing and Non-
Manufacturing sectors• Purchasing managers are asked to assess if activity is rising,
falling or unchanged: • Questionnaires are sent out every month to about 400 companies,
representing 20 different industries• Survey results come out on the first business day of every month
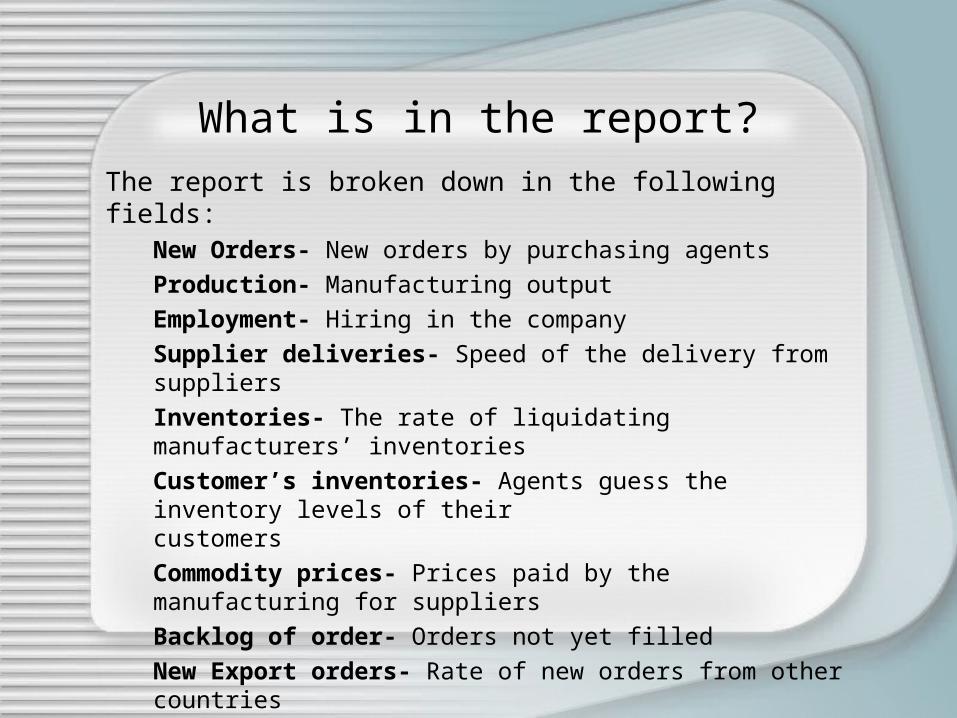
What is in the report?The report is broken down in the following fields:
New Orders- New orders by purchasing agents
Production- Manufacturing output
Employment- Hiring in the company
Supplier deliveries- Speed of the delivery from suppliers
Inventories- The rate of liquidating manufacturers’ inventories
Customer’s inventories- Agents guess the inventory levels of their customers
Commodity prices- Prices paid by the manufacturing for suppliers
Backlog of order- Orders not yet filled
New Export orders- Rate of new orders from other countries
Imports- Material that agents purchased from other countries
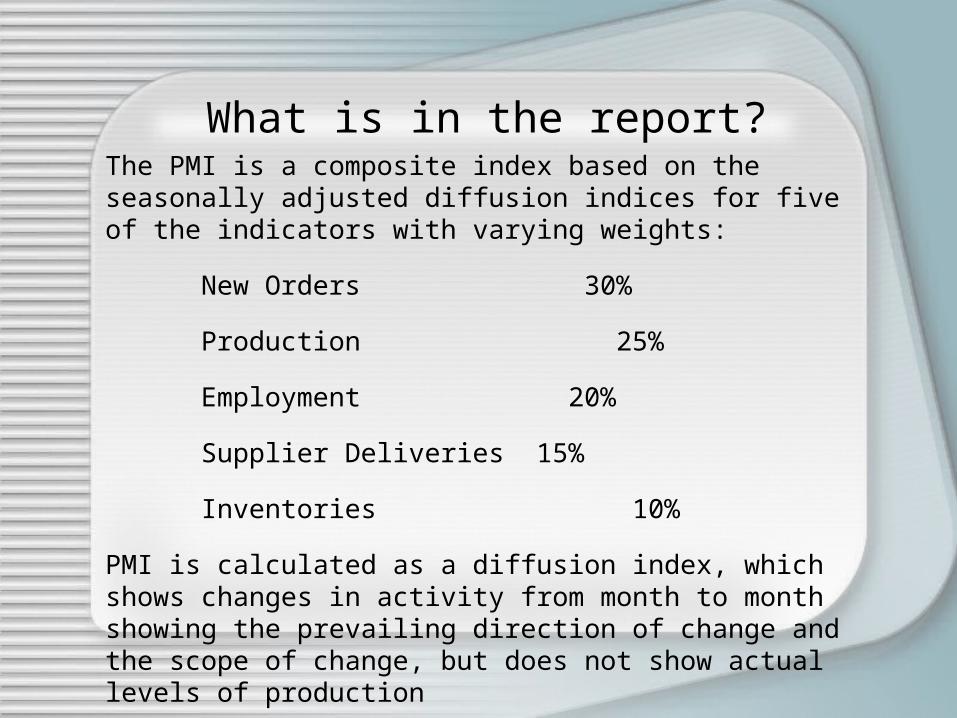
What is in the report?The PMI is a composite index based on the seasonally adjusted diffusion indices for five of the indicators with varying weights:
New Orders 30%
Production 25%
Employment 20%
Supplier Deliveries 15%
Inventories 10%
PMI is calculated as a diffusion index, which shows changes in activity from month to month showing the prevailing direction of change and the scope of change, but does not show actual levels of production
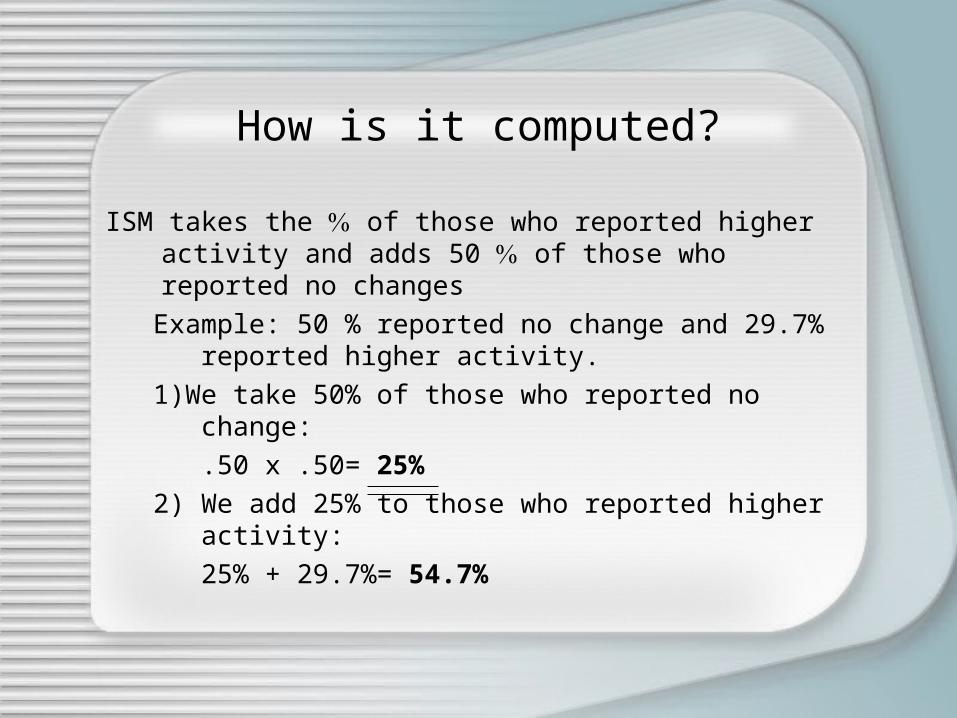
How is it computed?
ISM takes the of those who reported higher activity and adds 50 of those who reported no changes
Example: 50 % reported no change and 29.7% reported higher activity.
1)We take 50% of those who reported no change:
.50 x .50= 25%
2) We add 25% to those who reported higher activity:
25% + 29.7%= 54.7%
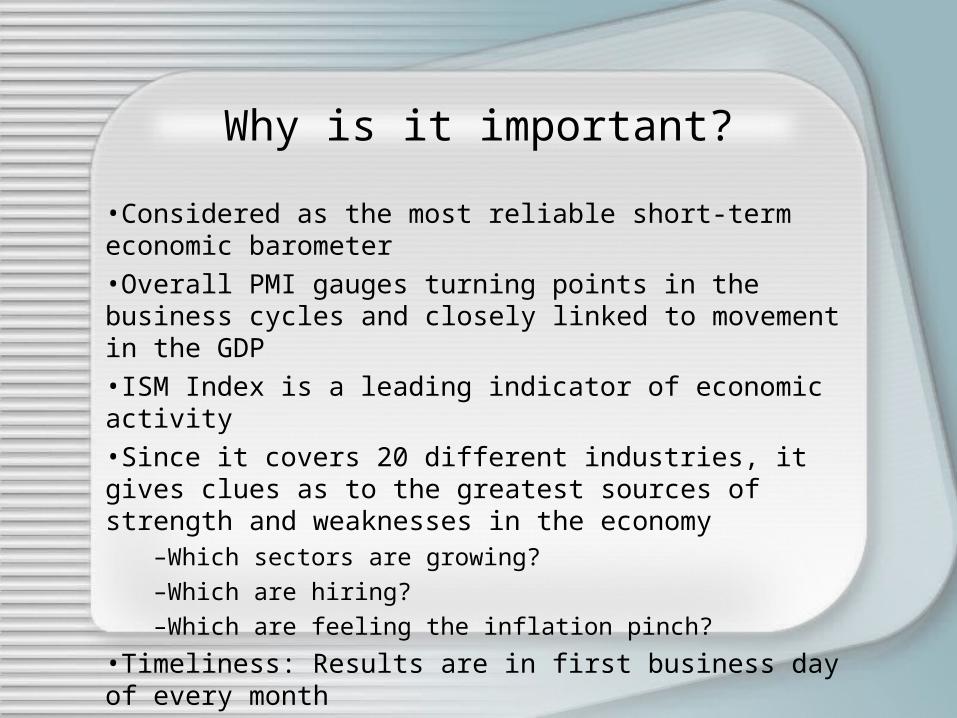
Why is it important?
•Considered as the most reliable short-term economic barometer
•Overall PMI gauges turning points in the business cycles and closely linked to movement in the GDP
•ISM Index is a leading indicator of economic activity
•Since it covers 20 different industries, it gives clues as to the greatest sources of strength and weaknesses in the economy
–Which sectors are growing?
–Which are hiring?
–Which are feeling the inflation pinch?
•Timeliness: Results are in first business day of every month

Keys to interpreting the data
The PMI benchmark that is used to measure economic activity is 50
– Index > 60 (sustained basis 3 to 6 months): Both manufacturing and the economy showing vigorous growth and low unemployment could prompt the FED to increase rates.
– Index > 50 but < 60: Both manufacturing and the economy are expanding
– Index = 50: No change In activity. It is believed to be consistent with real GDP growth of about 2.5%.
– Index < 50 but > 43: Manufacturing activity is contracting, yet the overall economy may still be growing
– Index < 43 (sustained basis 3 to 6 months): Mfg and economy likely to be in recession. Could prompt the FED to lower rates.
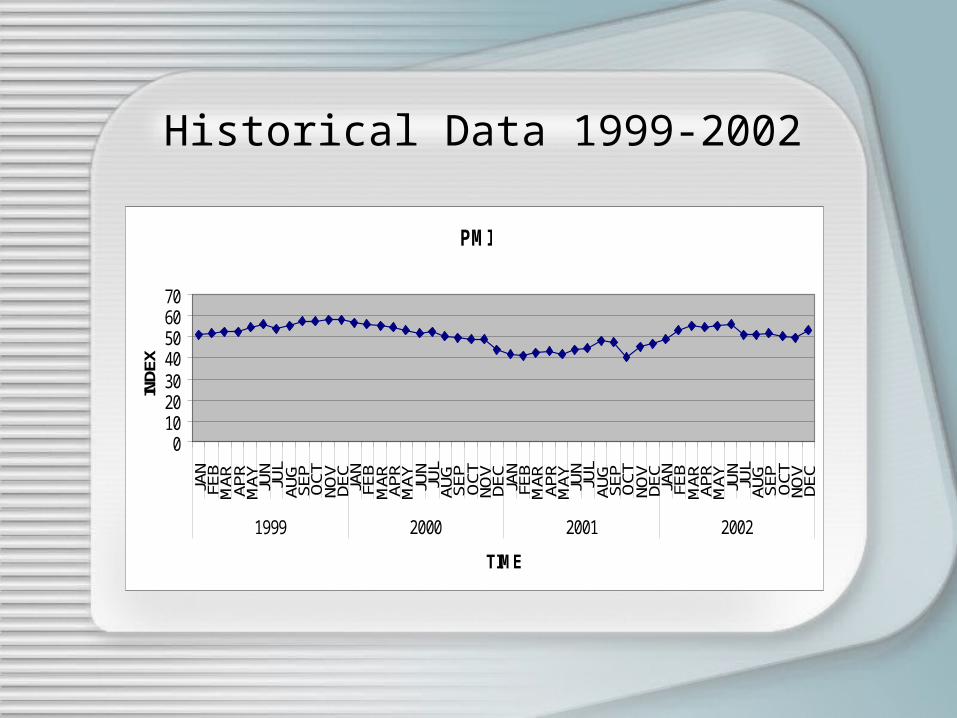
Historical Data 1999-2002
PMI
010203040506070
JAN
FEB
MAR AP
RM
AY JUN
JUL
AUG
SEP
OCT
NOV
DEC
JAN
FEB
MAR AP
RM
AY JUN
JUL
AUG
SEP
OCT
NOV
DEC
JAN
FEB
MAR AP
RM
AY JUN
JUL
AUG
SEP
OCT
NOV
DEC
JAN
FEB
MAR AP
RM
AY JUN
JUL
AUG
SEP
OCT
NOV
DEC
1999 2000 2001 2002
TIME
INDE
X
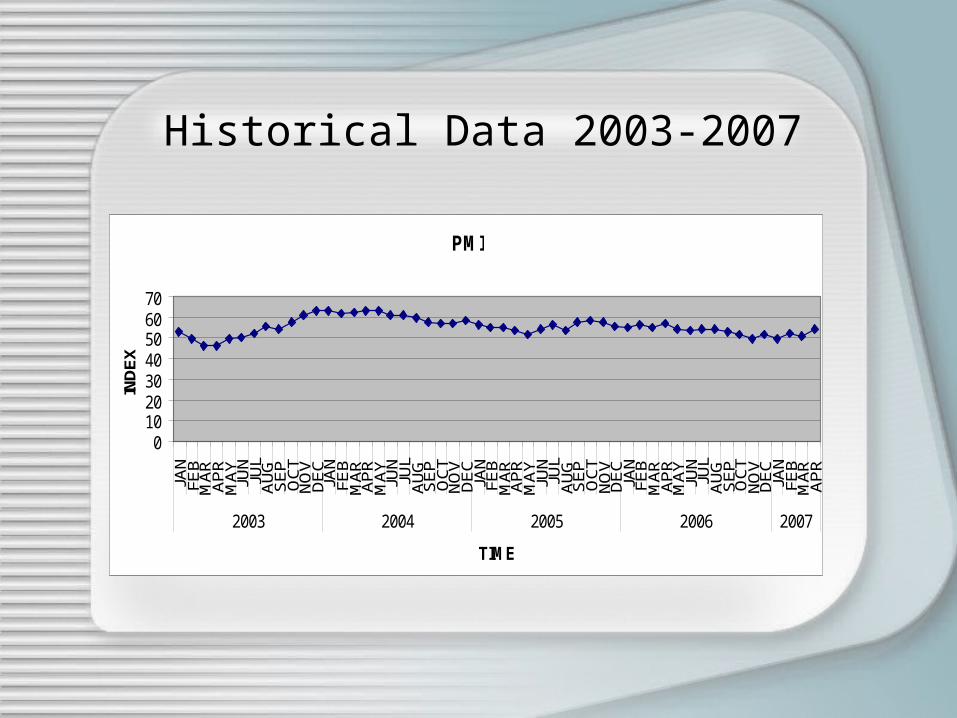
Historical Data 2003-2007
PMI
010203040506070
JAN
FEB
MA
RA
PR
MA
YJU
NJU
LA
UG
SE
PO
CT
NO
VD
EC
JAN
FEB
MA
RA
PR
MA
YJU
NJU
LA
UG
SE
PO
CT
NO
VD
EC
JAN
FEB
MA
RA
PR
MA
YJU
NJU
LA
UG
SE
PO
CT
NO
VD
EC
JAN
FEB
MA
RA
PR
MA
YJU
NJU
LA
UG
SE
PO
CT
NO
VD
EC
JAN
FEB
MA
RA
PR
2003 2004 2005 2006 2007
TIME
IND
EX
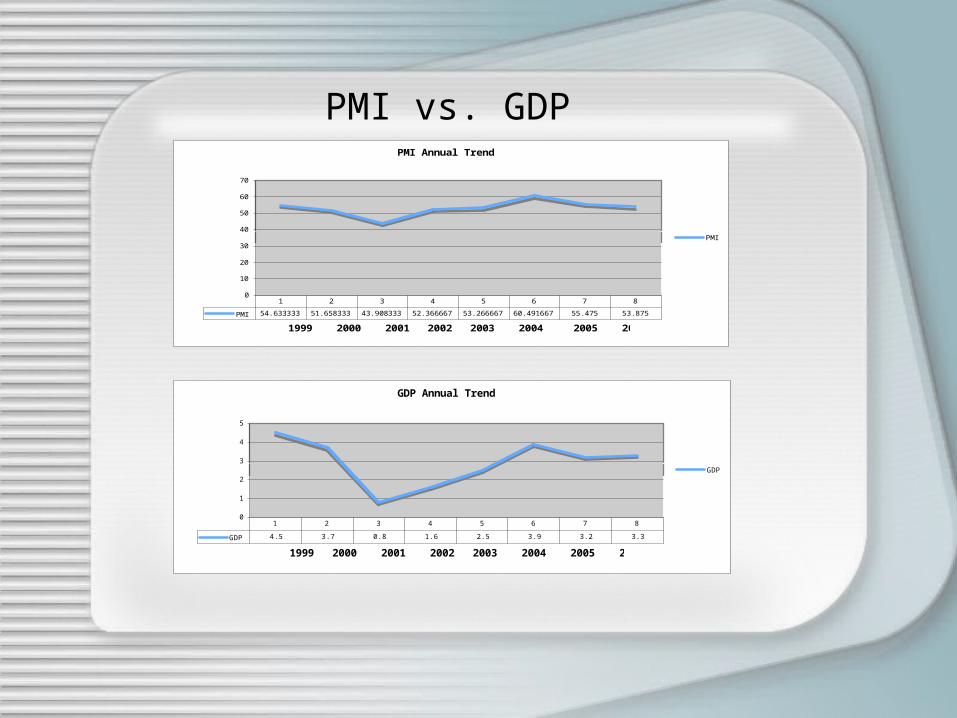
PMI Annual Trend
0
10
20
30
40
50
60
70
1999 2000 2001 2002 2003 2004 2005 2006
Ind
ex
PMI
PMI 54.633333 51.658333 43.908333 52.366667 53.266667 60.491667 55.475 53.875
1 2 3 4 5 6 7 8
GDP Annual Trend
0
1
2
3
4
5
1999 2000 2001 2002 2003 2004 2005 2006
Pe
rce
nta
ge
GDP
GDP 4.5 3.7 0.8 1.6 2.5 3.9 3.2 3.3
1 2 3 4 5 6 7 8
PMI vs. GDP
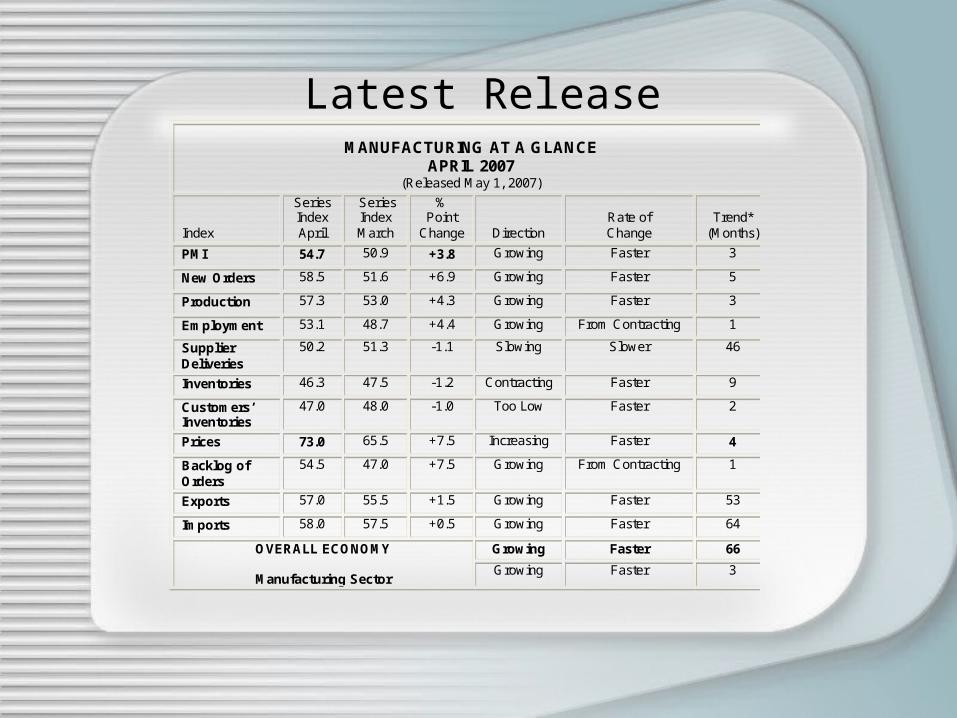
Latest Release
MANUFACTURING AT A GLANCE APRIL 2007
(Released May 1, 2007)
Index
Series Index April
Series Index March
% Point
Change
Direction
Rate of Change
Trend*
(Months)
PMI 54.7 50.9 +3.8 Growing Faster 3
New Orders 58.5 51.6 +6.9 Growing Faster 5
Production 57.3 53.0 +4.3 Growing Faster 3
Employment 53.1 48.7 +4.4 Growing From Contracting 1
Supplier Deliveries
50.2 51.3 -1.1 Slowing Slower 46
Inventories 46.3 47.5 -1.2 Contracting Faster 9
Customers’ Inventories
47.0 48.0 -1.0 Too Low Faster 2
Prices 73.0 65.5 +7.5 Increasing Faster 4
Backlog of Orders
54.5 47.0 +7.5 Growing From Contracting 1
Exports 57.0 55.5 +1.5 Growing Faster 53
Imports 58.0 57.5 +0.5 Growing Faster 64
Growing Faster 66 OVERALL ECONOMY
Manufacturing Sector Growing Faster 3
Data Analysis
Based on the information from this indicator, we conclude:
-The economy is expanding slightly faster
-We foresee the FED to either stay at current interest rate of 5.25 or slightly increase it


![ISM - Institute for Supply Management - [COVID-19]Paper+Coronavirus_Mar... · 2020-05-26 · The Institute for Supply Management® (ISM) Research & Analytics survey on the impact](https://img.dokumen.tips/doc/110x75/5f041b517e708231d40c59f0/ism-institute-for-supply-management-covid-19-papercoronavirusmar-2020-05-26.jpg)