Embed Size (px)
Citation preview
1
INSIDE THE JAVA VIRTUAL MACHINE
Filip HanikCovalent Technologies
August 29, 2007
Memory Management and Troubleshooting
2
Who am I?
[email protected] Committer / ASF memberCo-designed the Comet implementationImplemented NIO connector in 6Responsible for session replication and clusteringBeen involved with ASF since 2001Member, Covalent Technical Team
3
What are we Talking About?
Internals of Java MemorySpoken from a Java developer’s standpointFor other Java developers and system administrators
4
Agenda
Understanding the Java Memory LayoutOut Of Memory Errors
CausesSolution
Garbage Collection BasicsJava Tuning Options – Time ConstraintQuestions and Answers
5
Storing Data in Memory
Java runs as a single processDoes not share memory with other processes
Each process allocates memoryWe call this process heap
Ways to allocate memory in a processC (malloc and free)C++ (new and delete)Java (new and dereference -> Garbage Collection)
6
Storing Data in Memory
JVM manages the process heapIn most casesJNI managed memory would be an exception, and there are others
No shared memory between processesAt least not available through the Java API
JVM creates a Java Heap Part of the process heapConfigured through –Xmx and –Xms settings
7
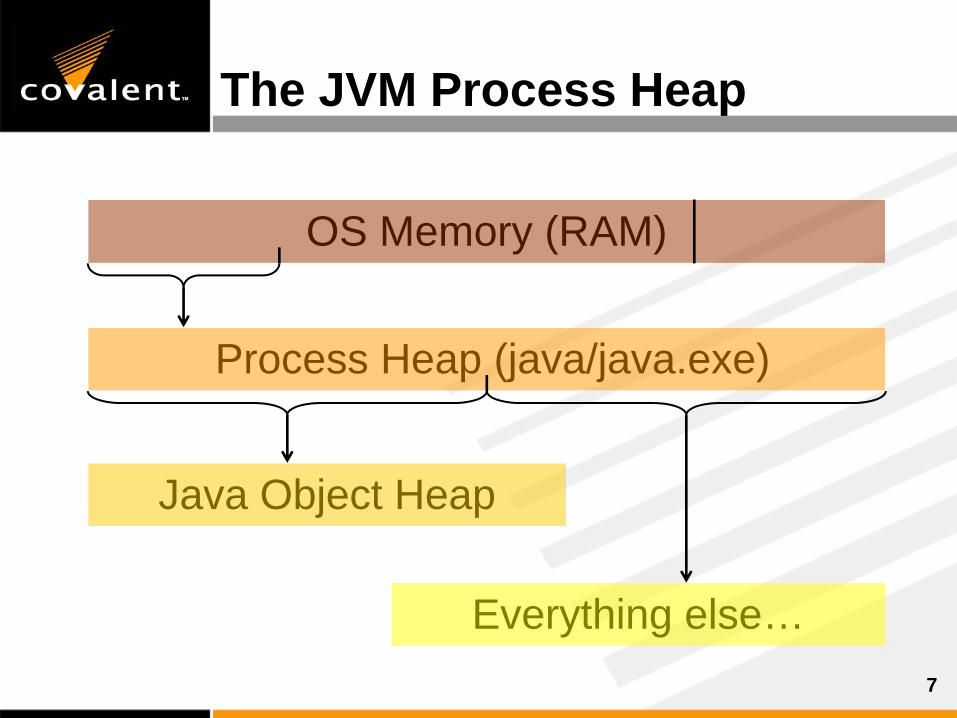
Everything else…
Process Heap (java/java.exe)
OS Memory (RAM)
The JVM Process Heap
Java Object Heap
8
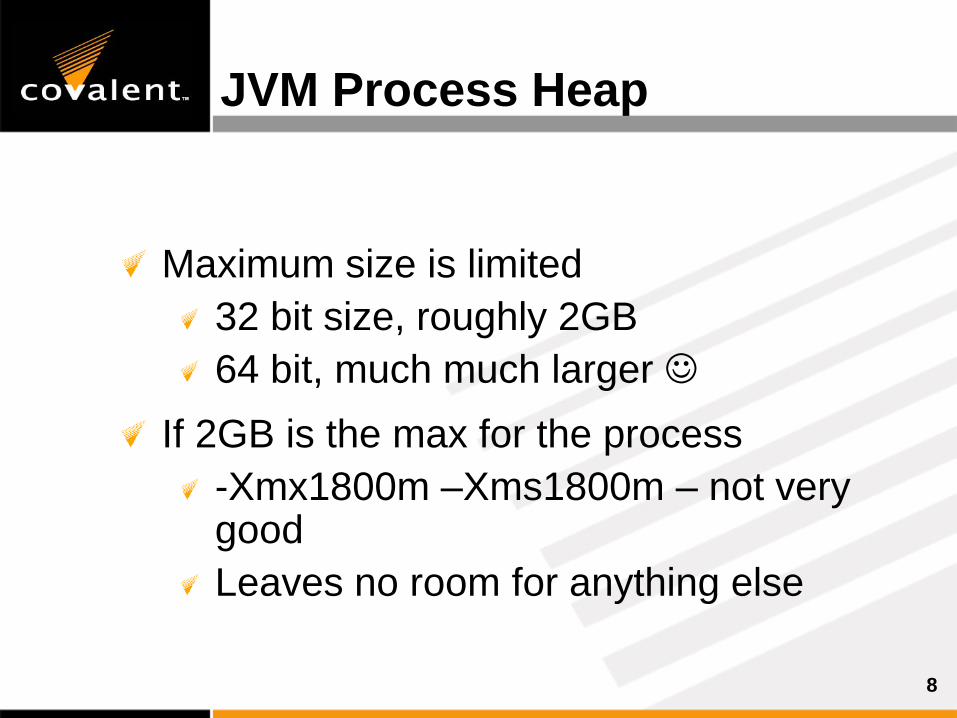
JVM Process Heap
Maximum size is limited32 bit size, roughly 2GB64 bit, much much larger ☺
If 2GB is the max for the process-Xmx1800m –Xms1800m – not very goodLeaves no room for anything else
9
Java Object Heap
Also referred to as Java HeapOften confused with JVM process heap
Stores Java Objects instances of classesand the data the objects contain
PrimitivesReferences
10
Benefits of the Java Heap
Pre-allocate large blocks of memoryAllocation of small amounts of memory is very fastNo need to fish for a free memory segment in RAMNo fragmentationContinuous memory blocks can make a big differenceNullPointerException vs. General Access Fault
NPE runtime errorGAF crash the process
11
Gotcha #1
-Xmx, -Xms and –XmnOnly controls the Java Object HeapOften misunderstood to control the process heap
Confusion leads to incorrect tuningAnd in some cases, the situation worsens
12
Java Object Heap
So how is the Java Heap allocated?-XX:MinHeapFreeRatio=
Default is 40 (40%)When the JVM allocates memory, it allocates enough to get 40% freeHuge chunks, very large defaultNot important when –Xms == -Xmx
-XX:MaxHeapFreeRatio= Default 70%To avoid over allocationTo give back memory not used
As you can see, to provide performance and avoid fragmentation, excessively large blocks are allocated each time
13
Java Object Heap
Object allocation statistics80-98% of newly allocated are extremely short lived (few million instructions)80-98% die before another megabyte has been allocatedTypical programs
Tomcat Core (no webapps)Lots of long lived objectsStill a small memory footprint
14
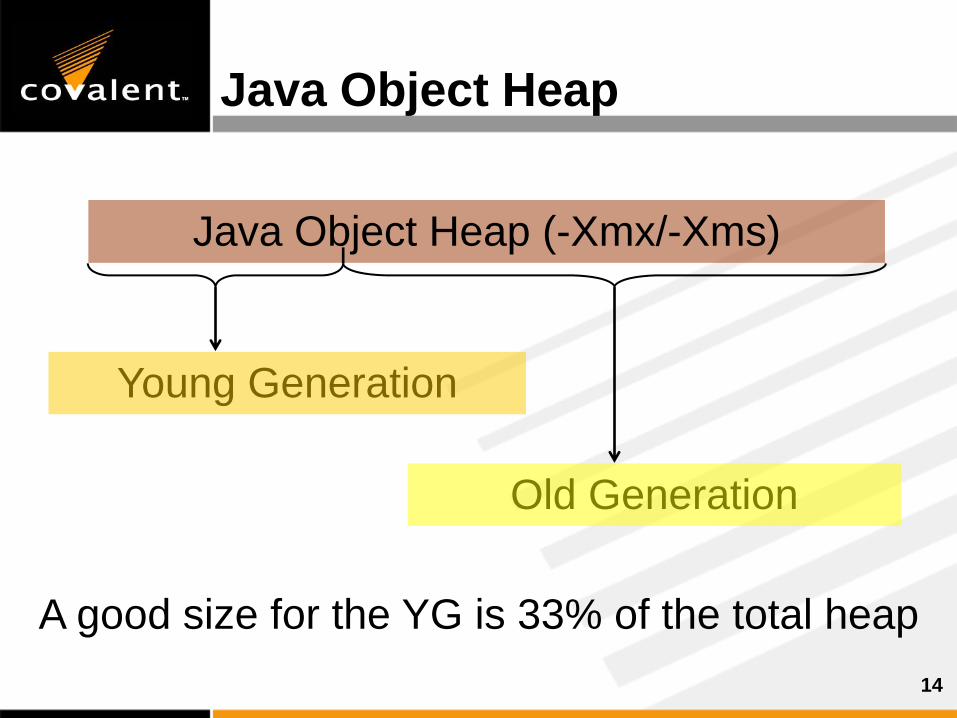
Young Generation
Java Object Heap
Old Generation
Java Object Heap (-Xmx/-Xms)
A good size for the YG is 33% of the total heap
15
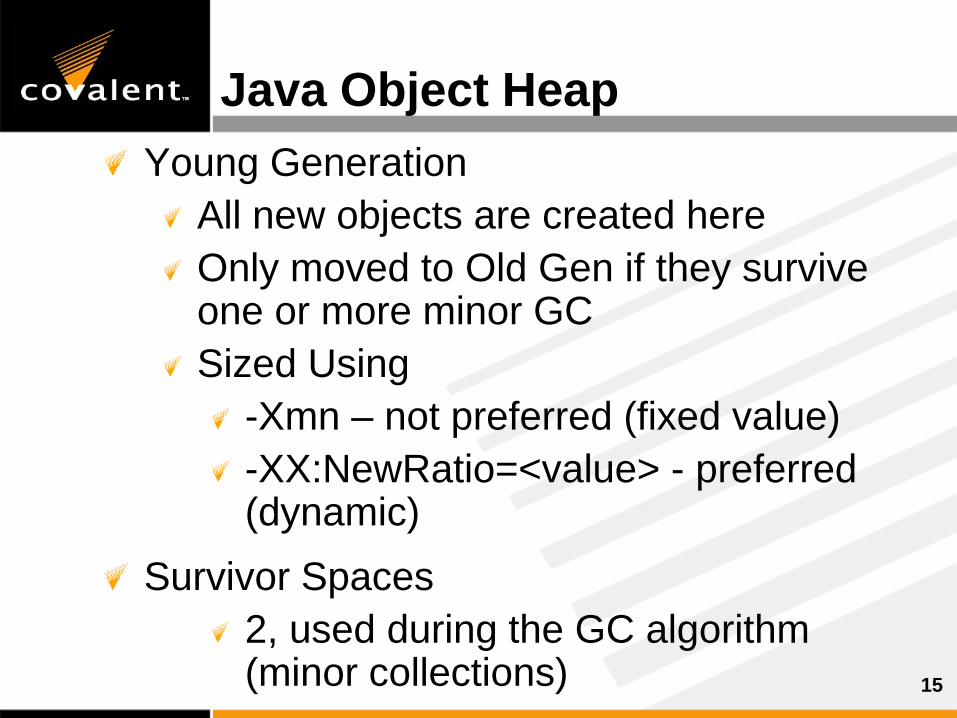
Java Object HeapYoung Generation
All new objects are created hereOnly moved to Old Gen if they survive one or more minor GCSized Using
-Xmn – not preferred (fixed value)-XX:NewRatio=<value> - preferred (dynamic)
Survivor Spaces2, used during the GC algorithm (minor collections)
16
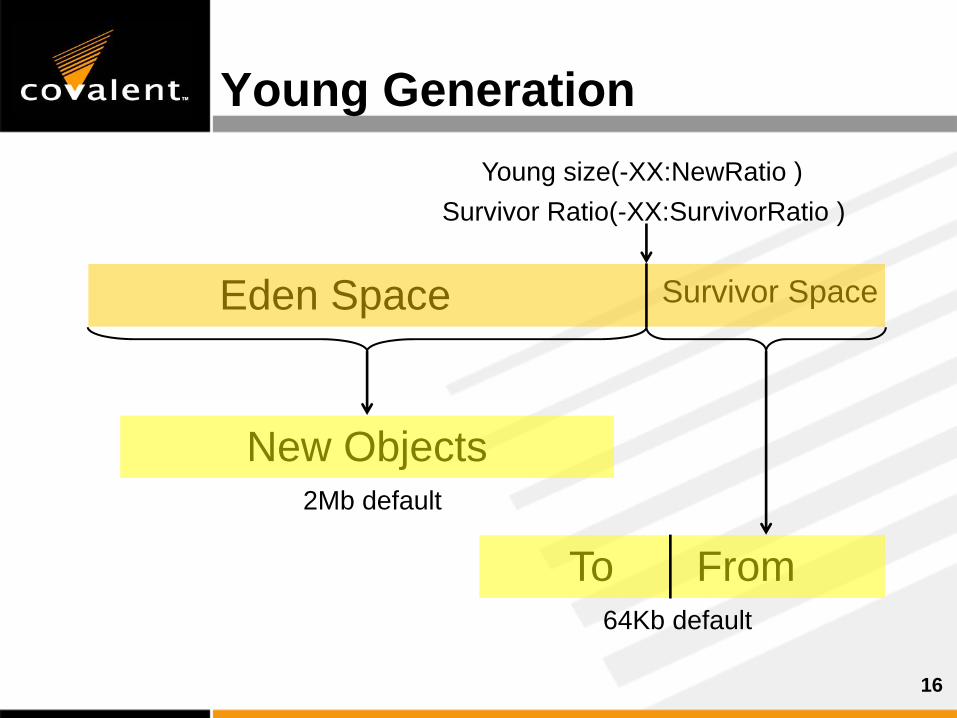
New Objects
Survivor SpaceEden Space
Young Generation
To From
Survivor Ratio(-XX:SurvivorRatio )
2Mb default
64Kb default
Young size(-XX:NewRatio )
17
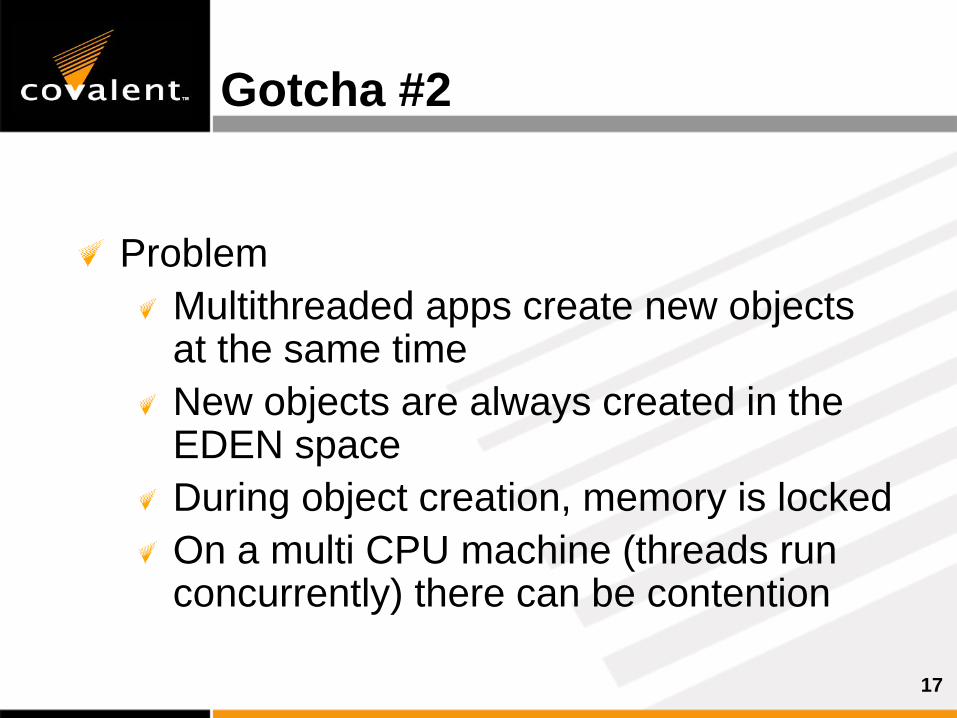
Gotcha #2
ProblemMultithreaded apps create new objects at the same timeNew objects are always created in the EDEN spaceDuring object creation, memory is lockedOn a multi CPU machine (threads run concurrently) there can be contention
18
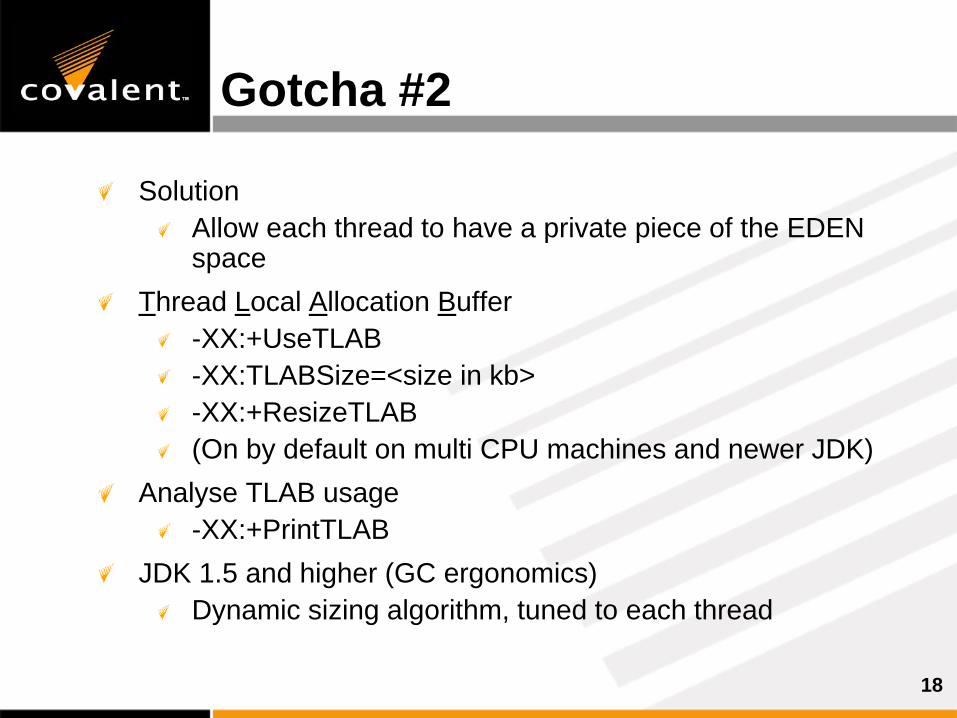
Gotcha #2
SolutionAllow each thread to have a private piece of the EDEN space
Thread Local Allocation Buffer-XX:+UseTLAB-XX:TLABSize=<size in kb>-XX:+ResizeTLAB(On by default on multi CPU machines and newer JDK)
Analyse TLAB usage-XX:+PrintTLAB
JDK 1.5 and higher (GC ergonomics)Dynamic sizing algorithm, tuned to each thread
19
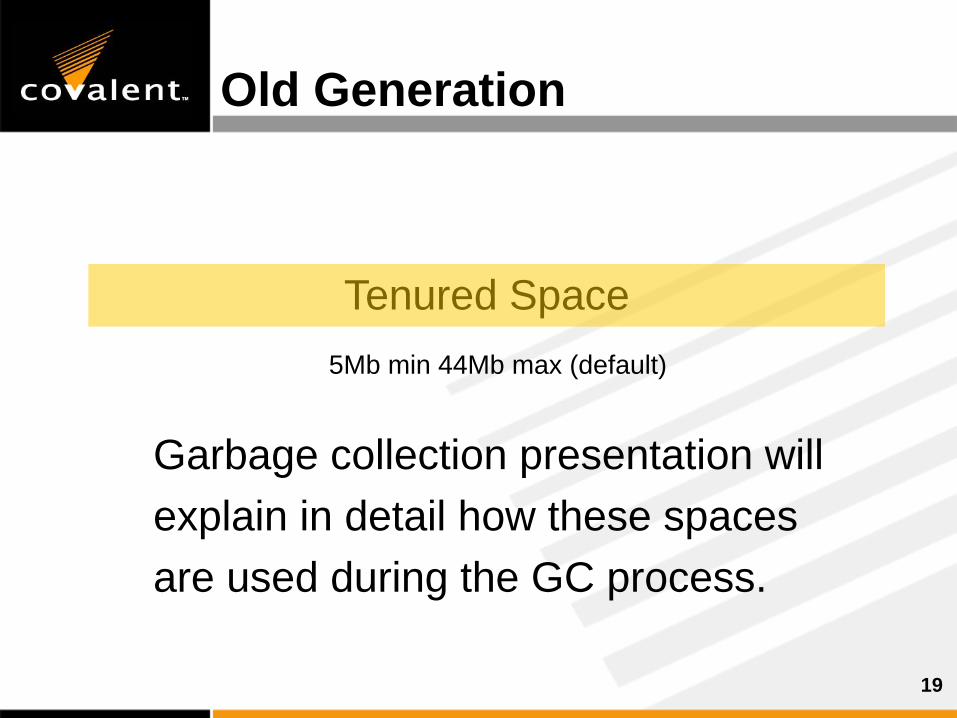
Tenured Space
Old Generation
5Mb min 44Mb max (default)
Garbage collection presentation willexplain in detail how these spaces are used during the GC process.
20
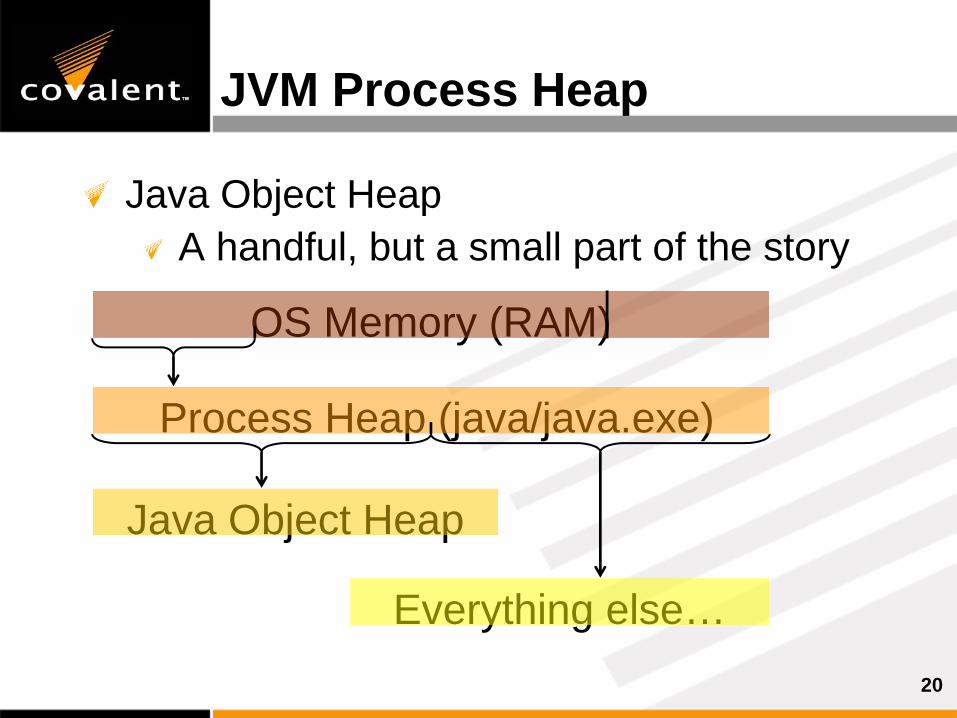
JVM Process Heap
Java Object HeapA handful, but a small part of the story
Everything else…
Process Heap (java/java.exe)
OS Memory (RAM)
Java Object Heap
21
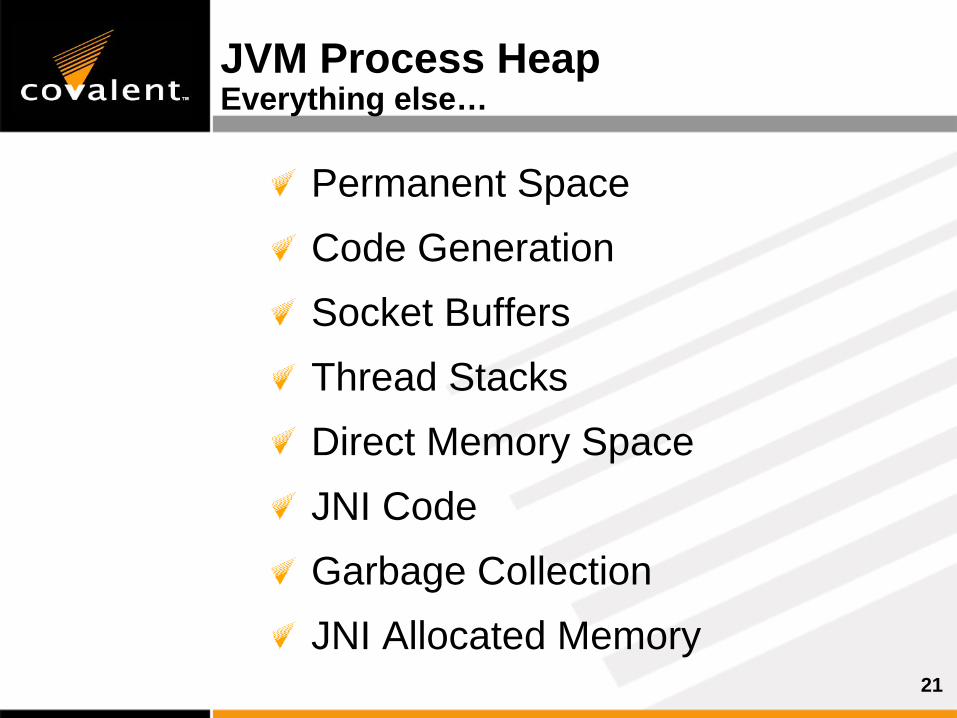
JVM Process HeapEverything else…
Permanent SpaceCode GenerationSocket BuffersThread StacksDirect Memory SpaceJNI CodeGarbage CollectionJNI Allocated Memory
22
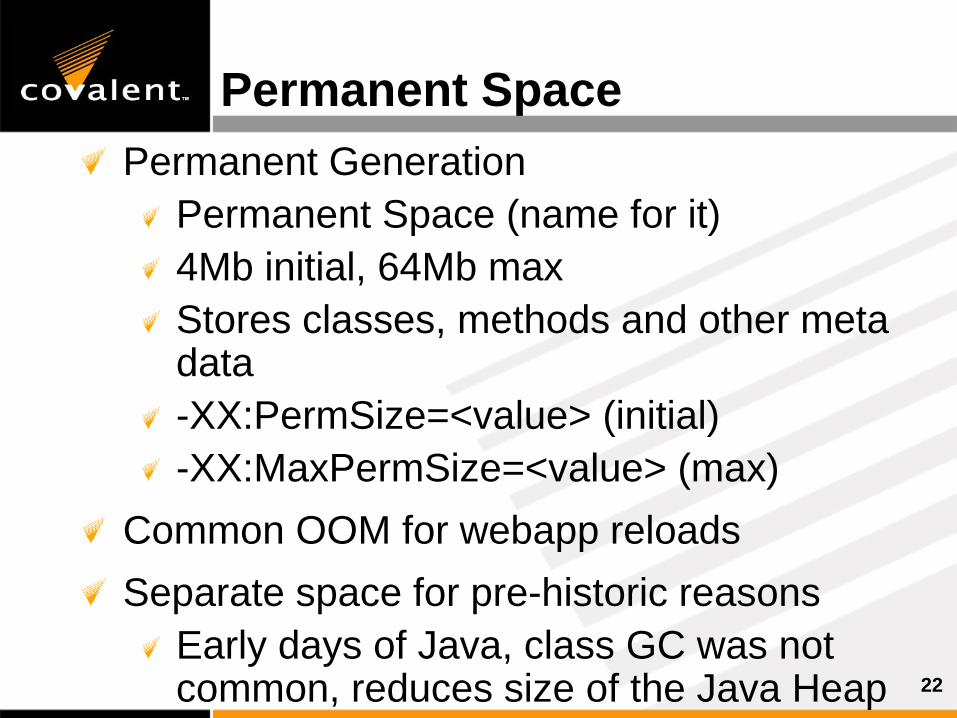
Permanent SpacePermanent Generation
Permanent Space (name for it)4Mb initial, 64Mb maxStores classes, methods and other meta data-XX:PermSize=<value> (initial)-XX:MaxPermSize=<value> (max)
Common OOM for webapp reloadsSeparate space for pre-historic reasons
Early days of Java, class GC was not common, reduces size of the Java Heap
23
Gotcha #3
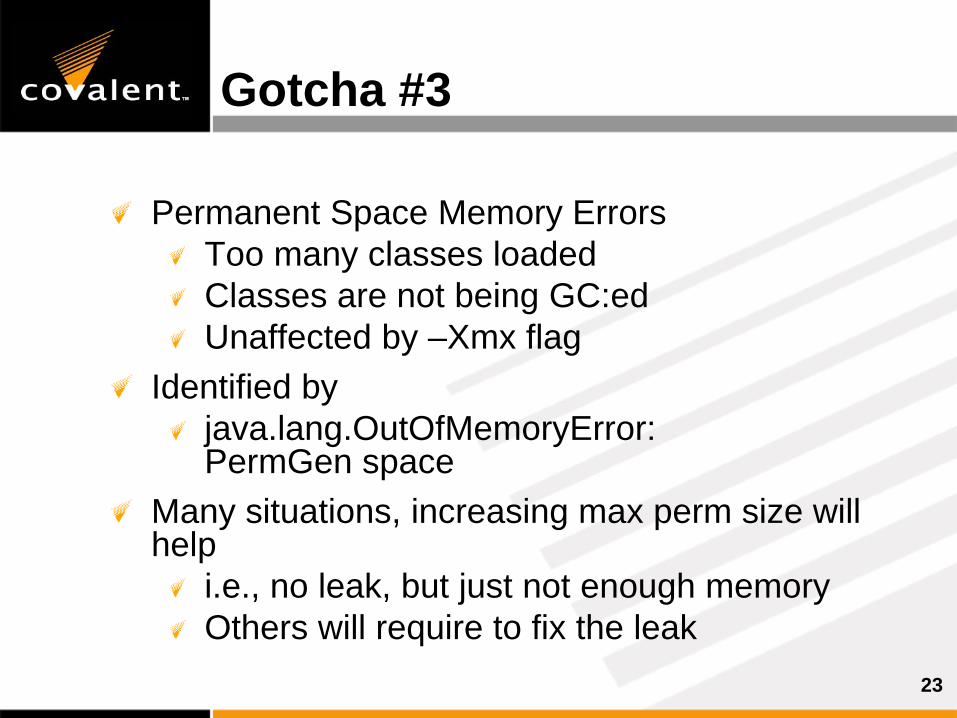
Permanent Space Memory ErrorsToo many classes loadedClasses are not being GC:edUnaffected by –Xmx flag
Identified byjava.lang.OutOfMemoryError: PermGen space
Many situations, increasing max perm size will help
i.e., no leak, but just not enough memoryOthers will require to fix the leak
24
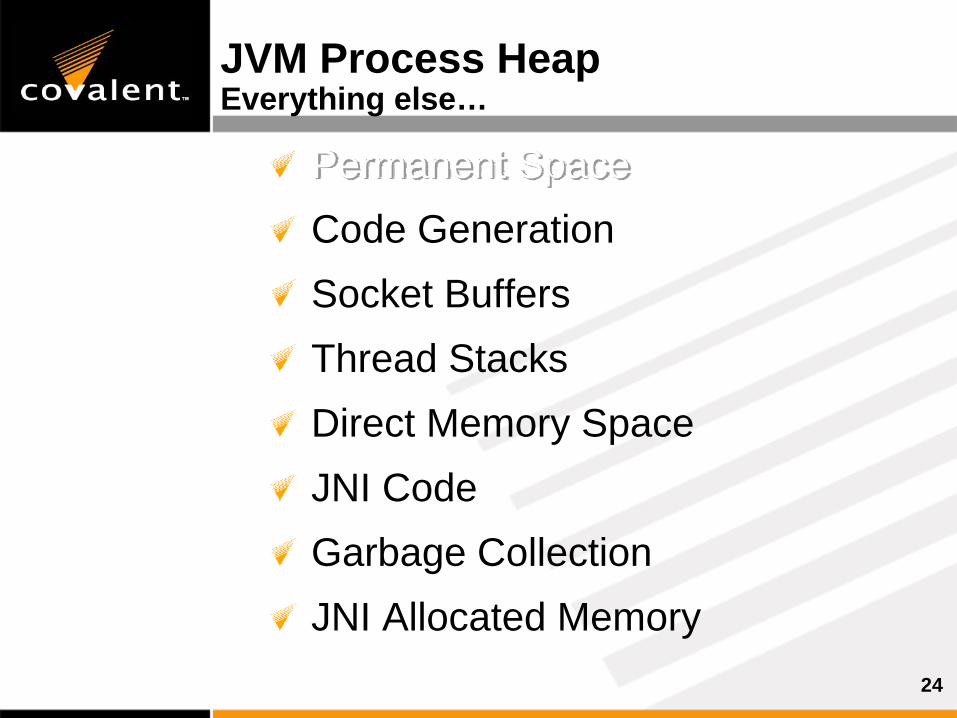
JVM Process HeapEverything else…
Permanent SpaceCode GenerationSocket BuffersThread StacksDirect Memory SpaceJNI CodeGarbage CollectionJNI Allocated Memory
25
Code Generation
Converting byte code into native codeVery rare to cause memory problemsJVM will most likely crash if it doesn’t have enough mem for this operation
Never seen it though

26
JVM Process HeapEverything else…
Permanent SpaceCode GenerationSocket BuffersThread StacksDirect Memory SpaceJNI CodeGarbage CollectionJNI Allocated Memory
27
TCP connections
Each connection contains two buffersReceive buffer ~37kSend buffer ~25k
Configured in Java codeSo might not be exposed through applications configuration
Usually hit other limits than memory before an error happen
IOException: Too many open files (for example)
28
JVM Process HeapEverything else…
Permanent SpaceCode GenerationSocket BuffersThread StacksDirect Memory SpaceJNI CodeGarbage CollectionJNI Allocated Memory
29
Thread Stacks
Each thread has a separate memory space called “thread stack”Configured by –XssDefault value depends on OS/JVMAs number of threads increase, memory usage increases
30
Gotcha #4
java.lang.OutOfMemoryError: unable to create new native threadSolution
Decrease –Xmx and/orDecrease –XssOr, you have a thread leak, fix the program
GotchaIncreasing –Xmx (32bit systems) will leave less room for threads if it is being used, hence the opposite of the solution
Too low –Xss value can cause java.lang.StackOverflowError
31
JVM Process HeapEverything else…
Permanent SpaceCode GenerationSocket BuffersThread stacksDirect Memory SpaceJNI CodeGarbage CollectionJNI Allocated Memory
32
Direct Memory Space
Ability to let Java developers map memory outside the Java Object Heapjava.nio.ByteBuffer.allocateDirectjava.lang.OutOfMemoryError: Direct buffer memoryAdjusted by
-XX:MaxDirectMemorySize=<value>

33
JVM Process HeapEverything else…
Permanent SpaceCode GenerationSocket BuffersThread stacksDirect Memory SpaceJNI CodeGarbage CollectionJNI Allocated Memory
34
JNI
Code needs memory Usually very little
JNI programs also allocate memoryError allocating memory.[NativeMemory.c] (my code)JVM goes berserk or crashes or if the JNI code can handle it gracefully, you’re lucky
Linux way of dealing with mem leakKill the process!
35
JVM Process HeapEverything else…
Permanent SpaceCode GenerationSocket BuffersThread stacksDirect Memory SpaceJNI CodeGarbage CollectionJNI allocated memory
36
Garbage Collection
Also uses memoryThreadsMemory to store GC info
If there isn’t enough memory for GC, then the system will not be functioning at all
37
GC History
First time around 1959 – LISP languageThe idea
automatic memory cleanupEasier to write codeEasier to debug
What it doesMaps memory in memoryThe Java Object Heap is such a map
38
Phases of GC
Lock it downAll objects that are to take part in the GC must be locked, so that they don’t mutate
MarkIterate through all objectsMark the “unreachable” as garbage
SweepRemove all previously marked objectsReclaim memory
39
Early Version of JavaGarbage Collector wasn’t very well tunedOnly one algorithm was availableMark and Sweep entire heap
Takes a very long timeTime spent is dependent on the size of the heapThat is why the “Permanent Space” was invented
And cause un/reloading of classes wasn’t very common either
Also known as “stop-the-world” gcThe entire JVM is locked down
40
Strategies
Stop The WorldIncremental
Time GC with new object creationIf GC runs, suspend new allocation
Concurrent/ParallelAllocation happens at the same time as GCVery complex locking regimesGenerations/Spaces make it easier
CMS stands forConcurrentMarkSweep
41
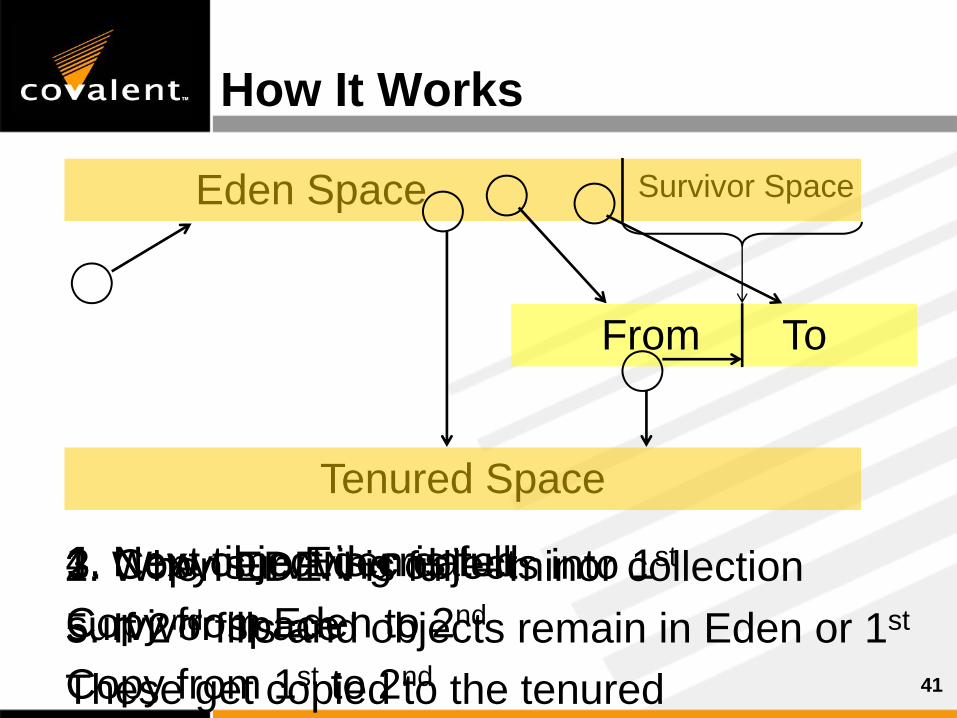
How It Works
Survivor SpaceEden Space
From To
Tenured Space
1. New object is created2. When EDEN is full – minor collection3. Copy surviving objects into 1st
survivor space4. Next time Eden is fullCopy from Eden to 2nd
Copy from 1st to 2nd5. If 2nd fills and objects remain in Eden or 1st
These get copied to the tenured
42
How it Works
One survivor space is always emptyServes as destination for minor collections
Objects get copied to the tenured space when the 2nd survivor space fills upMajor collections occur when the tenured space fills up
Major collections free up Eden and both survivor spaces
43
New and Fancy
Concurrent/Parallel Garbage Collection-XX:+UseParNewGC
Parallel GC in the New(Young) Generation
-XX:+UseConcMarkSweepGC Concurrent in the Old generation
Use these two combinedMulti CPU box can take advantage of this
44
Sun Recommended
GC Settings-XX:+UseConcMarkSweepGC -XX:+CMSIncrementalMode -XX:+CMSIncrementalPacing -XX:CMSIncrementalDutyCycleMin=0 -XX:+CMSIncrementalDutyCycle=10 -XX:+UseParNewGC -XX:+CMSPermGenSweepingEnabled
To analyze what is going on-XX:+PrintGCDetails-XX:+PrintGCTimeStamps-XX:-TraceClassUnloading
45
Minor Notes
-XX:+UseParallelGC <> -XX:+UseParNewGC -XX:ParallelGCThreads=<nr of cpu>
Use with ParallelGC settingIf you have 4 cpus and 1 JVM
Set value to 4If you have 4 cpus and 2 JVM
Set value to 2If you have 4 cpus and 6 JVM
Set value to 2
46
GC Ergonomics
Started with JDK 1.5JVM is self trained and GC strategy adaptsRules/Guidelines can be set using command line options
Max pause time goalThe longest pause time to suspend application
Throughput goalTime spent GC vs. time spent outside GC
Not guaranteed
47
Out Of Memory Errors
There is a seamless way to get info-XX:+HeapDumpOnOutOfMemoryError
No performance impact during runtimeDumping a –Xmx512m heap
Create a 512MB .hprof fileJVM is “dead” during dumpingRestarting JVM during this dump will cause unusable .hprof file
48
Gotcha’s
Major collections don’t run until tenured is fullWhat does that mean?
-Xmx1024mCurrent heap could be 750MB 500MB of “dead” objectsIf VM is idle, could stay like that for a very long timeWasting 500MB of RAM for an idle JVM
49
Monitoring Agents
Monitor memory usageIf system is idle, force a GCCan be done automatically and with remote agentsExample would be:www.yourkit.comAnd script the client to take telemetry readings from an embedded agent
50
Thank You
[email protected] support information contact Covalent
[email protected], [email protected]/444-1935 or 925/974-8800
Question and Answer time!!

51
The Enterprise Open Source Support Company