Embed Size (px)
Citation preview

1

2
3
Innovative composite membranes for advanced applications
Contents
Abstract (6)
Sommario (7)
Abbreviations (10)
Chapter 1: General introduction (13)
1.1 Introduction and objectives (13)
1.2 Fluoropolymers and membrane science (17)
1.3 Polymer functionalization (18)
1.4 Phase inversion and membrane preparation (18)
1.5 Coatings (19)
Chapter 1 References (20)
Chapter 2: Development of PVDF-Graphene Thin Film Composite Membranes for Direct Contact
Membrane Distillation (22)
2.1 Chapter summary (22)
2.2 Introduction (22)
2.3 Results and Discussion (24)
o 2.3.1 PVDF-f Polymer preparation and Characterization (24)
o 2.3.2 PVDF-f polymer characterization (26)
o 2.3.3 Graphene characterization by microscope analysis (27)
o 2.3.4 Membrane fabrication and characterization (28)
o 2.3.5 FT-IR analysis (27)
o 2.3.6 Scanning Electron Microscope (SEM) and
Atomic Force Microscope (AFM) analysis (29)
o 2.3.7 Contact angle analysis (31)
o 2.3.8 Pore size measurement (32)
o 2.3.9 XPS analysis (33)
o 2.3.10 Mechanical Tests (33)

4
o 2.3.11 Direct Contact Membrane Distillation (DCMD) Test (34)
2.4: Experimental (38)
o 2.4.1 Chemicals (38)
o 2.4.2 PVDF-f synthesis (38)
o 2.4.3 PVDF-f characterization (38)
o 2.4.4 CVD-Graphene synthesis (38)
o 2.4.5 Graphene characterization by Optical Microscope (39)
o 2.4.6 Membrane Preparation (40)
2.4.6.1 Pristine PVDF and PVDF-f flat sheet membrane preparation (40)
2.4.6.2 PVDF-f-GM fabrication (40)
o 2.4.7 Membrane characterization (41)
2.4.7.1 SEM analysis (41)
2.4.7.2 XPS analysis (41)
2.4.7.3 Mechanical tests (41)
2.4.7.4 AFM analysis (41)
o 2.4.8 LEP and wettability (42)
o 2.4.9 Water flux through the membrane (42)
o 2.4.10 DCMD experiments (42)
2.5 Chapter conclusions (43)
Chapter 2 References (44)
Chapter 3: Synthesis of polymerizable Acryloyloxyalkyltriethyl ammonium bromide salts surfactants and
their antibacterial activity (46)
3.1 Chapter summary (47)
3.2 Introduction (47)
3.3 Results and discussion (48)
3.4 AATEABs characterization (50)
o 3.4.1 1H and 13C NMR analysis (51)
o 3.4.2 IR analysis (61)
o 3.4.3 Melting point evaluation (62)
o 3.4.4 MS analysis and TIC determination (62)
3.5 Experimental part (63)
o 3.5.1 Chemicals and apparatus ( 63 )
o 3.5.2 Synthesis of Acryloyloxyalkyltriethylammonium bromides (AATEABs) 4a-d (65)
3.5.2.1 First step: synthesis of bromoalkyl acrylate 3a-d by esterification of
bromoalkanols 1a-d with acryloyl chloride 2 (65)
3.5.2.2 Second step: quaternization of ω-bromoalkyl acrylate 3a-d

5
with triethylamine (65)
o 3.5.3 Synthesis of Acryloyloxyalkyltriethylammonium bromides (AATEABs) 4e and 4f (66)
3.5.3.1 First step: Reaction of Et2NH with ω-bromoalkanols 1e and 1f (66)
3.5.3.2 Second step: synthesis of (diethylamino)alkyl acrylate 6e-f by esterification of
2-(diethylamino)alkanols 5e-f with acryloyl chloride 2 (66)
3.5.3.3 Third Step: quaternization of (diethylamino)alkyl acrylate 6e-f
with EtBr (66)
3.6 Chapter conclusions (67)
3.7 Chapter 3 References (68)
Chapter 4: Novel method for the preparation of Thin Film Composite membranes for gas separation and
defect control by protective layer coating (69)
4.1 Chapter summary (69)
4.2 Introduction (70)
4.3 Results and discussion (71)
o 4.3.1 TFC membrane and role of protective layer (71)
o 4.3.2 Estimation of gas transport properties on defective TFC membranes coated with
protective layer (72)
o 4.3.3 Calculation of optimized properties of protective layer by mathematical method (74)
o 4.3.4 Protective layer coated membranes: preparation and gas transport measurement and
bench-scale test (76)
4.4 Experimental part (79)
o 4.4.1 Materials and chemicals (79)
o 4.4.2 Preparation of TFC membranes and Protective layer (80)
o 4.4.3 Module system and module fabrication (80)
o 4.4.4 Gas transport properties measurement (80)
4.5 Chapter conclusions (81)
Chapter 4 References (82)
General conclusions and future perspectives (84)

6
Abstract
Presented thesis work is mainly focused on coatings preparation, their potentiality and applications
in membrane science: from water desalination to antibiofouling membranes, to gas separation. In
fact, coating preparation represents an useful and versatile technique which allows a fine control of
membrane properties and performance such as chemical or physical resistance, durability, etc. One
of major drawbacks is represented by production costs, which can become important in scale-up
operations. Therefore, although several type and methodologies for coating preparation are known
and reported in literature, a lack of cheap, efficient and scale-up adaptable coating methods made
their different preparation methods of particular interest.
The results presented herein, concern the preparation of three different coating methods whose
applications are briefly summarized below:
Chapter 2: Development of PVDF-f-Graphene Thin Film Composite Membrane for Membrane
Distillation
Chapter 2 reports a novel method for TFC membrane fabrication, using graphene layer
coated on chemically-functionalized PVDF. PVDF is hydrophobic polymer whose properties
are well suited for those applications in which hydrophobicity is needed such as Membrane
Distillation. In order to increase adhesion between PVDF and graphene, we co-polymerized
PVDF with a suitable monomer bearing aromatic part, using a procedure which involves 2
steps reaction: introduction of double bonds on polymer backbone by basic treatment
followed by its reaction with monomer through radical reaction. Membranes have been
prepared using functionalized PVDF polymer (PVDF-f) and tested on Direct Contact
Membrane Distillation (DCMD) apparatus at first. Subsequently tests were conducted using
PVDF-f-Graphene composite membrane, using graphene synthetized using Chemical Vapor
Deposition ( CVD) method. Created membranes were analyzed and their chemical, physical
and morphological properties were investigated. Membranes made using PVDF-f polymer
exhibited good flux and salt rejection (up to 99.9 %), whereas graphene association to PVDF-
f membranes leads to lower water flux but higher rejection and durability (up to 99.99 %).
Chapter 3: Synthesis of polymerizable Acriloyloxyalkyltriethyl Ammonium salts surfactants and
their antibacterial activity

7
In chapter 3 a simple and innovative synthetic strategy for Acryloyloxyalkiltriethyl ammonium salts
surfactants (AATEABs) starting from cheap and easily available chemicals is discussed. Herein
reported surfactants can be used as coating for membranes to whom they confer high anti biofouling
properties. Synthetic procedure was first optimized in order to work avoiding prohibitive conditions
such as Inert atmosphere or high temperature and then applied to the synthesis of surfactants
bearing a different alkyl-chain length. Antibacterial activity evaluation, has been done performing
several tests against Gram +\- and yeast strains; results confirmed that AATEABs bearing C11
(AUTEAB) and C12 (ADTEAB) alkyl chain possess highest activity which is remarkable high for ADTEAB.
AATEABs may find applications as polymerizable coatings for watr-treatment membranes
( commercial or not) to be used in Pressure-Driven Membrane Processes or in any other membrane-
based system in which antifouling properties may play an important role.
Chapter 4: Thin Film Composite Membrane fabrication for gas separation: Defect control and
bench-scale demonstration
Fourth chapter of this thesis work, concerns the preparation of TFC membranes to be used
for CO2/N2 separation, on the relationship between TFC membrane material and membrane
properties and the role of the protective layer in determining the amount of defects, which is
a crucial aspect for all the gas separation-related processes. We report a simple and efficient
procedure which can also be applied to for defect controlling during scale-up process and
which is not valid for CO2 separation membranes only. Results demonstrate a correlation
between the properties of protective layer and separation performances: in particular, the
possibility to apply a coating film on commercial membrane permits the creation of
membranes in which the amount of defect is dramatically reduced. Another crucial aspect
discussed in chapter 4 concerns the thickness of protective layer used for defect control: in
fact, whereas the presence of protective layer plays an important role defect-free membrane
creation process, its thickness impacts on separation operation. With our method, the
preparation of membranes with very thin protective layer ( 0.1 μm or below) is possible.
Sommario
Il Lavoro di tesi discusso, è incentrato sui coating: la loro importanza, i metodi preparativi e le

8
potenzialità applicative nel campo delle membrane: dalla dissalazione di acque alla
funzionalizzazione di membrane al fine di marcarne le proprietà antifouling per processi “PDMP”
(Pressure-Driven Membrane Processes) quali RO, UF, MF, all’ approntamento di membrane che
permettano di separare miscele di gas come CO2/N2 . In effetti, l’applicazione di un coating ad una
membrana anche commerciale, rappresenta un metodo molto efficace per conferire ad essa delle
caratteristiche che prima non aveva, come resistenza chimica o meccanica, selettività nei confronti
di una determinata specie o durabilità nei processi a cui la membrana è sottoposta. Tuttavia, questa
tecnologia che solo oggi sta assumendo un importante rilievo che supera il mero ambito accademico,
risente ancora di alcuni problemi e limitazioni come ad esempio la difficoltà nel passare dalla
produzione in laboratorio a quella su larga scala, sia in termini di costi, che in termini di
riproducibilità del processo. Per tali ragioni metodi semplici, economici, scalabili ed innovativi
possono diventare di particolare interesse.I risultati presentati in questo lavoro di tesi, riguardano
tre tipologie differenti di coating finalizzati ad altrettanti campi applicativi, trattati dettagliatamente
nei singoli capitoli e brevemente riassunti di seguito:
Capitolo 2: Sviluppo di membrane ibride PVDF-Grafene per processi di distillazione a membrana
In questo capitolo viene descritto un nuovo ed innovativo metodo per la preparazione di
membrane ibride PVDF-Grafene, in cui un layer del materiale 2D viene applicato come
coating su una membrana non commerciale di PVDF preventivamente modificato. Infatti,
allo scopo di massimizzare l’adesione polimero-grafene mediante il fenomeno del pi-stacking
il PVDF è stato trattato chimicamente. Il processo prevede due stadi: nel primo stadio
vengono introdotti dei doppi legami sulla catena polimerica, mentre nel secondo si ha la loro
polimerizzazione con un opportuno monomero formato da una parte polimerizzabile e da
un’altra aromatica, che interagirà col grafene. Il grafene è invece stato sintetizzato
utilizzando la metodologia del “ Chemical Vapor Deposition” (CVD). Allo scopo di appurare
eventuali differenze, sono state preparate tre diverse membrane utilizzando identiche
condizioni preparative ma polimeri diversi: PVDF non funzionalizzato, PVDF funzionalizzato e
Membrana composita di PVDF funzionalizzato con grafene. Le membrane ottenute sono
inoltre state analizzate con diverse tecniche allo scopo di valutarne la composizione chimica
e le proprietà meccaniche e topologiche.
I risultati hanno dimostrato che le membrane create a partire dal polimero funzionalizzato
esibiscono un bon flusso di vapore ed una alta reiezione salina fino al 99.9%, che aumenta

9
nel caso della membrana composita polimero-grafene insieme alla durabilità della stessa,
sacrificando però parte del flusso di vapore.
Capitolo 3: Sintesi di sali polimerizzabili di Acriloilalcossialchiltrietil ammonio e relativa attività
antibatterica
Nel terzo capitolo viene discussa una nuova procedura per la sintesi di sali di
Alchiloilossialchiltrietilammonio Bromuro (AATEABs), una particolare classe di surfactanti
polimerizzabili ad elevata attività antibatterica, a partire da precursori poco costosi e
facilmente disponibili sul mercato. Tali molecole, presentano una porzione acrilica che si
presta ad essere polimerizzata e che può quindi essere impiegata per la creazione di coating
applicabili a membrane, non necessariamente commerciali, destinate a processi di PDMP
(Pressure-Driven Membrane Processes) come RO, UF, MF, etc. Tali membrane rivestite con
AATEABs, oltre a guadagnare proprietà idrofiliche guadagnano anche marcate attività
antibatteriche ed antifouling. L’attenzione è rivolta da una parte all’approntamento di una
opportuna strategia sintetica ed alla sua ottimizzazione, che permetta di evitare di lavorare
in condizioni proibitive come atmosfera inerte e\o alte temperature, mantenendo rese
sintetiche comunque alte, mentre dall’altra è stata rivolta all’ estensione del processo stesso
a diverse molecole in cui è stata cambiata la lunghezza della porzione alchilica, purtuttavia
appartenenti alla classe AATEABs. L’attività biologica di tali molecole, è stata valutata
attraverso alcuni test effettuati nei confronti di Gram+, Gram- e lieviti ed è risultata essere
particolarmente alta in due delle molecole sintetizzate: gli analoghi con catena alchilica ad
11 (AUTEAB) e 12 (ADTEAB) atomi di carbonio. In particolare, l’analogo AUTEAB rappresenta
la molecola con il miglior compromesso tra costo dei reagenti ed attività biologica, mentre l’
ADTEAB, sebbene più attivo, risulta essere più dispendioso a causa del costo maggiore del
bromo alcol di partenza.
Capitolo 4: Creazione di membrane TFC per la separazione di miscele di CO2/N2 : controllo dei
difetti ed applicazione su larga scala
Il quarto ed ultimo capitolo affronta un’ulteriore possibile applicazione dei coating, in questo
caso per membrane commerciali destinate alla separazione di gas in relazione a due punti
principali: la relazione esistente tra il numero dei difetti e la qualità della separazione della

10
membrana da un lato, la relazione esistente tra lo spessore del coating e la permeanza del
gas attraverso la membrana dall’altro. La creazione di difetti riduce drasticamente le
prestazioni della membrana, ma questi, tuttavia, emergono inevitabilmente specie quando
si tenta di produrre membrane su larga scala. D’altra parte, se il numero di difetti può essere
ridotto aumentando lo spessore del coating, affinché la membrana possa lavorare in
condizioni ottimali sono necessari coating molto sottili allo scopo di evitare il calo di
permeanza. Il metodo proposto, si presta bene alle applicazioni su larga scala in quanto
riduce il numero di difetti, pur permettendo la creazione di coating estremamente sottili ed
omogenei.
Abbreviations list
AATEABs Acryloyloxyalkyltriethylammonium Bromides
NIPS Nonsolvent-Induced Phase
Separation
AFM Atomic Force Microscope
NM Nano Material
AGMD Air-Gap Membrane Distillation
NMR Nuclear Magnetic Resonance
AGMD Air Gap Membrane Distillation
PAN Poly (acrylonitrile)
AIBN Azobisisobutyronitrile
PBM Polymerizable Bicontinuous Microemulsion
ATRP Atom-Transfer Radical Polymerization
PCTFE Poly( Chlorotrifluoroethylene)
AUTEAB Acryloyloxyundecyltriethylammonium bromide
PDMP Pressure-Driven Membrane
Processes
BHT Butylated hydroxytoluene
PDMS Poly( dimethylsiloxane)
CA Contact Angle
PEGMA Poly(Ethylen Glicol) Methacrylate
CTFE Chloro Trifluoroethylene
PES Poly (Ether Sulfone)
CVD Chemical Vapor Deposition
PMMA Poly ( methylmetacrilate)
DCMD Direct Contact Membrane Distillation
PQASs Polymerizable Quaternary Ammonium Salts
DI Deionized Water
PTFE Poly ( Tetrafluoroethylene)
DMF N,N-Dimethylformammide
PVDF Poly( Vinylidene Fluoride)
DTAB Dodecyltriethylammonium Bromide
PVDF-f Functionalized PVDF
ESI-MS Electrospray Ionization Mass Spectrometry
PVDF-f/GM PVDF-f/Graphene TFC
membrane
EtOH Ethanol
PVF Poly ( Vinylfluoride)
FT-IR Fourier Transform- Infrared Spectroscopy
QASs Quaternary Ammonium Salts
GO Graphene Oxide
RAFT Reversible Addition–Fragmentation chain Transfer
GOQDs Graphene Oxide Quantum Dots
RO Reverse Osmosis
HFP Hexafluoro propylene
SEM Scanning Electron Microscope
KOH Potassium Hydroxide
TFC Thin Film Composite
LEP Liquid Entry Pressure
TFE Tetrafluoroethylene

11
LPM Liter Per Minute
UF Ultrafiltration
MBR Membrane Bioreactor
VDF Vinylidene Fluoride
MD Membrane Distillation
VF+F8 Vinyl Fluoride
MeOH Methanol
VMD Vacuum Membrane Distillation
MF Microfiltration
XPS X-ray Photoelectron Spectroscopy
NF Nanofiltration

12

13
Chapter 1: General Introduction
1.1 Introduction and objectives
In last decades, membrane technology has assumed a central role in several separation and
purification related fields, in particular for those concerning separation and purification1-2. This
because operation performed by membranes allow to separate or purificate compounds using low
energy-demand processes, avoiding harmful chemicals and operate in an easy way. Among several
reasons for choosing membrane processes compared to traditional ones, the crucial point is the
possibility to separate compounds which are difficult to separate in other ways or thermally and
chemically sensitive ones. However, on this purpose material play an important role and its
production cost may sometimes represent a drawback. Materials represent the functional part of
membrane systems and their properties are often related to selectivity and separation efficiency
and represent one point on which attention has been focused on. Indeed, the need of tailored
materials production with specific features fit for membrane systems, is actually encouraging
ongoing research on them not only by coating3-5, but also using different polymers, using association
of polymers and nanomaterials in Mixed Matrix Systems or membrane surface functionalization,
perhaps the most common methods nowadays employed and which can be either chemical of
physical3-4, 6-10. This thesis work focuses its attention on coatings and their application in membranes
for different purposes:
In the first part a layer of graphene is applied on a membrane made using functionalized PVDF.
Functionalization is necessary because permits to achieve better compatibility between graphene
layer and polymeric membrane benefiting from pi-stacking phenomena. Chemical functionalization
involves two step-reaction in which creation of double bonds on polymer chain initially occurs,
followed by radical polymerization. Graphene was synthetized using CVD method and fixed on top
surface of membrane made with Functionalized PVDF using laminating machine.In order to evaluate
membrane properties three different membranes have been tested on Direct Contact Membrane
Distillation apparatus: made by Pristine PVDF and Functionalized PVDF (with and without graphene).
Also, in order to comprehend morphological, chemical and mechanical properties other studies
have been done. One of major drawbacks in coating fabrication is due to costs and process scalability which
sometimes borders their use only to lab-scale experimetns. In chapter 3 is reported a novel and innovative
synthetic strategy for the synthesis of a new class of Polymerizable surfactanct with

14
Acryloyloxyalkiltriethylammonium Bromide-like structure (AATEABs), starting from simple and cheap
chemicals on market. Reported strategy was then extended to different analogus molecule, that can be used
as coating for membranes to which they confers hydrophilic behaviour and remarkable antibiofouling activity,
due to the presence of ammonium salt. Coating with AATEABs can be used for those membranes whenever
abovementioned properties are needed such as Reverse Osmosis, Micro and Ultrafiltration, etc.
Antimicrobial activity has been evaluated through biological tests performed on Gram +\- and yeast strains
and resulted to be highest in those analogus bearing C11 and C12 alkyl chain length. An innovative coating
method which allows creation of ultra thin coating on membranes for CO2/N2, is discussed in chapter 4: is
well known that in the case of gas separation membranes, the priority is to reduce as much as possible the
presence of defects which can prejudice the separation process. The difficult which limits their use for scaled-
up systems is that it results really hard to obtain an uniform and extremely thin coating. Our attention is
therefore applied on one hand to defect control and on another hand to the thickness of dense selective
layer. Furthermore, the whole procedure, results to be really simple and easily scalable. Thesis outline is
summarized in Figure 1.1.1

15
Fig
ure
1.1
.1

16
1.2 Fluoropolymers and membrane science
In membrane science, fluoropolymers represent one of election materials because of their outstanding
properties which can be ascribed to C-F bond, its polarizability and its strength. For membrane technologies
fluoropolymers are ideal candidates since they possess very interesting features such as chemical inertness
and stability, mechanical strength and insulating properties. As reported in literature by Ameduri et al11
fluoropolymer are actually employed in several fields, from automotive industries to medical applications.
Table 1.2.1 reports some of most common use of fluoropolymers.
Bin
der
fo
r el
ectr
od
es, s
epar
ato
rs, i
on
-
sele
ctiv
e m
emb
ran
es, g
aske
ts,
mem
bra
ner
ein
form
ents
, film
s fo
r
ph
oto
volt
aics
co
atin
gs f
or
win
d m
ill
bla
des
Pro
cess
su
rfac
es w
afer
car
rier
s tu
bin
g,
valv
es, p
um
ps
and
fit
tin
gs, s
tora
ge t
anks
PFA
, EC
TFE
PC
TE, P
TFE
amo
rph
ou
s FP
PV
DF,
Flu
oro
ion
om
ers
(PFS
A)
,TH
V, E
TFE
ECTF
E,
PTF
E, F
EP P
VF
Am
edu
ri e
t al
201
8 D
OI:
10.
1002
/ch
em.2
0180
2708
ETFE
, PTF
E, P
VD
F P
CTF
E,
PV
F, T
HV
Co
ated
fab
rics
an
d f
ilms
for
bu
ildin
gs/r
oo
fs, f
ron
t/b
acks
ide
film
s fo
r
sola
r ap
plic
atio
ns
Exce
llen
t W
eath
erab
ility
Fla
me
Res
ista
nce
Tra
nsp
aren
cy L
ow
Surf
ace
Ener
gy B
arri
er p
rop
erti
es
Low
co
effi
cien
t o
f Fr
icti
on
Fla
me
Res
ista
nce
Ab
rasi
on
res
ista
nce
An
tist
ick
pro
per
ties
Po
lyo
lefi
n p
roce
ssin
g to
avo
id s
urf
ace
def
ects
an
d f
or
fast
er p
roce
ssin
g.
Ad
dit
ives
fo
r in
ks, c
oat
ings
, lu
bri
can
ts,
anti
-dri
pp
ing
agen
ts
THV
, FK
M P
VD
F, P
TFE
FK
M, P
TFE
FFK
M T
H
Ther
mal
/Wea
ther
Sta
bili
ty L
ow
Surf
ace
Ener
gy C
hem
ical
Res
ista
nce
Co
okw
are
coat
ings
, co
atin
gs o
f m
etal
surf
aces
, po
wd
er c
oat
ings
PTF
E P
VD
F, E
TFE
FEV
E, P
FA
PTF
E, P
CTF
E
Car
dio
vasc
ula
r gr
afts
, hea
rt p
atch
es,
ligam
ent
rep
lace
men
t p
acka
gin
g fi
lms
for
med
ical
pro
du
cts
Low
Su
rfac
e En
ergy
, Sta
bili
ty,
Pu
rity
Exc
elle
nt
Mec
han
ical
Pro
per
ties
Ch
emic
al R
esis
tan
ce
Typ
ica
l use
d
Flu
oro
po
lym
ers
Ch
emic
al R
esis
tan
ce, M
ech
anic
al
Pro
per
ties
,Th
erm
al s
tab
ility
,
cryo
gen
ic P
rop
erti
es
Gas
kets
, ves
sel l
iner
s, p
um
ps,
val
ve a
nd
pip
e lin
ers,
tu
bin
gs, c
oat
ings
, exp
anti
on
join
ts/b
ello
ws,
hea
t ex
chan
ger
PTF
E, P
FA/M
FA, E
TFE,
ECTF
E,
FEP
,FK
M, F
FKM
,TFE
-P
Low
Die
lect
ric
Co
nst
ant
Hig
h
Vo
lum
e/Su
rfac
e R
esis
tivi
ty H
igh
Die
lect
ric
Bre
akd
ow
n V
olt
age
Flam
e R
esis
tan
ce, T
her
mal
stab
ility
Lo
w r
efra
ctiv
e in
dic
es
Wir
e an
d c
able
Insu
lati
on
, co
nn
ecto
rs,
op
tica
l fib
res,
pri
nte
d c
ircu
it b
oar
ds
FEP
, PTF
E, P
FA, M
FA E
TFE,
ECTF
E P
CTF
E am
orp
ho
us
FP
Gen
era
l
Arc
hit
ectu
re/F
ab
ric/
Film
ap
plic
ati
on
s
Po
lym
er a
dd
itiv
es
Sem
ico
nd
uct
or
Ind
ust
ry
Ener
gy
con
vers
ion
/
sto
rag
e
Key
Pro
per
ties
Typ
ica
l use
s
Low
Co
effi
cien
t o
f Fr
icti
on
Go
od
Mec
han
ical
Pro
per
ties
Cry
oge
nic
Pro
per
ties
, Ch
emic
al R
esis
tan
ce
Low
per
mea
tio
n p
rop
erti
es
Seal
s, O
-Rin
gs, h
ose
s in
au
tom
oti
ve p
ow
er
stee
rin
g, t
ran
smis
sio
ns,
an
d
airc
on
dit
ion
ing,
bea
rin
gs, s
enso
rs f
uel
man
agem
ent
syst
ems.
Ch
emic
al R
esis
tan
ce H
igh
Pu
rity
An
tiad
hes
ion
, In
sula
tio
n, b
arri
er
pro
per
ties
Th
erm
al S
tab
ility
Ch
emic
al/t
her
mal
res
ista
nce
ion
-
tran
spo
rtat
ion
hig
h
wea
ther
abili
ty h
igh
tra
nsp
aren
cy
corr
osi
on
res
ista
nce
Ind
ust
ry/
Ap
plic
ati
on
are
a
Ch
emic
al/
pet
roch
emic
al
ind
ust
ry
Elec
tric
al(
elec
tro
nic
ind
ust
ry
Au
tom
oti
ve/a
ircr
aft
ind
ust
ry
Co
ati
ng
s
Med
ica
l
Tab
le 1
.2.1

17
In last years a lot of efforts have been done in order to get new and versatile fluoropolymers with
improved features. Indeed, most of fluoropolymers actually used are synthetized starting from
fluoroalkenes: Figure 1.2.1 report a brief summary of them with respective starting materials:
Among the fluorinated polymers, PVDF, HCTFE, PTFE are perhaps the ones largely used in water
purification technology because of their chemical properties and in gas separation as porous
support layer. Furthermore, their relatively low cost permits the use even for large-scale production
of membranes.
Figure 1.2.1

18
1.3 Polymer functionalization
In membrane preparation, polymer functionalization allows a fine control at very level of the process. Indeed,
functionalization can be done on polymer either before or after the membrane has been prepared. PVDF is
one of most used fluorinated polymer which suits well to functionalization5, 12-14. In literature so many
functionalization works have been done in order to create a material well tailored for specific needs. Some
examples are reported in Table 1.3.1
Functionalization type Used for
Run18 Defluorination/sulphonation
functionalization.
MF
Run23 PEG grafting by Argon-plasma
treatment
Microporous membranes with antifouling properties
Run34
Preparation of PEGMA-PVDF co-polymerization by RAFT-mediated
polymerization
MF
Run45
Grafted PEGMA on ozone-treated
PVDF porous membrane
MF
Run515
PVDF/PMMA-co-PAMPS/silica nanocomposite membranes by RAFT
polymerization
Proton Exchange
Membranes
Run612
Naproxene grafted on PVDF membrane by ATRP polymerization
Realization of molecular-
imprinted polymer
1.4 Phase Inversion and membrane preparation
Polymeric membranes can be prepared in several ways: usually, preparation method is function of final use
since that using the same polymer, different preparation methods may lead to membranes with same
chemical composition and different morphological properties such as membranes with dense selective layer
which is a fundamental requirement in the case of gas separation or porous membrane which suits well in
the case of water purification. In general, separation efficiency is given by a combination of both chemical
Table 1.3.1

19
and morphological properties, so preparation method is extremely important. Nowadays Phase Inversion is
probably the most diffused way to prepare porous membranes, among the different methods16-21 and
includes:
TIPS (Thermally-Induced-Phase-Separation): a technique in which polymeric and homogeneous
solution at high temperature is immersed in a coagulation bath composed by non-solvent.
VIPS (Vapor-Induced-Phase-Separation): dope solution is casted and let to interact with non solvent
vapor which is usually made by water or ethanol for a specific time and under controlled contidions.
VIPS allows the creation of membranes with highly controlled pore size and distribution by
controlling vapor time exposure, relative humidity and temperature.
NIPS (Nonsolvent-Induced-Phase-Separation): The polymer is dissolved in a suitable solvent and the
dope solution casted on a glass plate and immersed in coagulation bath made by non-solvent which
starts to exchange with solvent leading to polymer precipitation, that occurs as long as the process
is complete. NIPS is very useful and powerful tool, tailored for porous membrane fabrication.
1.5 Coatings
In membrane science and related technologies22 23-25, coatings play a fundamental role because of the
possibility to change and tune membrane features according to specific needs, without treat the material or
revise the preparation process26. Coatings are actually used in order to overcome many drawback of physical
and chemical functionalization. This because material properties such as conductivity, mechanical resistance
or selectivity are due to the chemical structure which is changed during functionalization process. Therefore,
when the material is functionalized this often leads to a loss of properties which might sometimes be hard
to restore and consequently to a loss of performance during the operation process. In this compound the use
of coating might avoid abovementioned problems since coating does not alter material properties.
Furthermore, by coating it is possible to add properties, mechanical, chemical or even in terms of selectivity
which are not held by starting material. Moreover, coating allows the use of sensitive materials6 which cannot
be employed in any other way. Also, coating can be applied to any type of membrane for biomedical
applications, gas or liquid separation and for drug delivery systems also7 Recently, Elimelech et al9, reported
an efficient method to fabvricate coated membranes to be used for MD application, in which pore size and
distribution are finely controlled through the coating of highly porous PVDF-HFP electrospun nanofiber with
pure PVDF and membranes exhibit high water flux and good rejection. Also, another interesting example
concerning the use of coating in membrane systems, is discussed by Wessling et al10: a coating made by
hydrogel was applied to hollow fibers and by application of electrical power it was possible to tune the
selectivity of the system. In the last decade, due the huge diffusion of 2D materials and their production with

20
cheaper costs, the possibilities were widely enlarged27-34. Nevertheless, several studies must be done yet in
order to comprehend how to maximize the synergy between plastics and 2D materials.
Chapter 1 references
1. Fontananova, E. D. a. E., Membrane Technology and sustainable growth. Chemical Engineering Research and Design 2004, 82, 1557-1562. 2. Van der Bruggen, B.; Curcio, E.; Drioli, E., Process intensification in the textile industry: the role of membrane technology. J Environ Manage 2004, 73 (3), 267-74. 3. Peng Wang , K. L. T., E.T. Kang , K.G. Neoh Plasma-induced immobilization of poly(ethylene glycol) onto poly(vinylidene fluoride) microporous membrane. Journal of membrane science 2002, 195, 103-114. 4. Yiwang Chen, L. Y., Weihong Yu, E. T. Kang,* and K. G. Neoh, Poly(vinylidene fluoride) with Grafted Poly(ethylene glycol) Side Chains via the RAFT-Mediated Process and Pore Size Control of the Copolymer Membranes. Macromolecules 2003, 36, 9451-9457. 5. Yung Chang, Y.-J. S., Ruoh-Chyu Ruaan, Akon Higuchi ,; Wen-Yih Chen , J.-Y. L., Preparation of poly(vinylidene fluoride) microfiltration membrane with uniform surface-copolymerized poly(ethylene glycol) methacrylate and improvement of blood compatibility. Journal of Membrane Science 2008, 309, 165-174. 6. Ulbricht, M., Advanced functional polymer membranes. Polymer 2006, 47, 2217-2262. 7. Fang, R. H.; Kroll, A. V.; Gao, W.; Zhang, L., Cell Membrane Coating Nanotechnology. Adv Mater 2018, 30 (23), e1706759. 8. Man Jae Han, G. N. B. B., Bumsuk Jung Effect of surface charge on hydrophilically modified poly(vinylidene fluoride)
membrane for microfiltration. Desalination 2011, 270, 76-83. 9. Shaulsky, E.; Nejati, S.; Boo, C.; Perreault, F.; Osuji, C. O.; Elimelech, M., Post-fabrication modification of electrospun nanofiber mats with polymer coating for membrane distillation applications. Journal of Membrane Science 2017, 530, 158-165. 10. Lohaus, T.; de Wit, P.; Kather, M.; Menne, D.; Benes, N. E.; Pich, A.; Wessling, M., Tunable permeability and selectivity: Heatable inorganic porous hollow fiber membrane with a thermo-responsive microgel coating. Journal of Membrane Science 2017, 539, 451-457. 11. Ameduri, B., Fluoropolymers: The Right Material for the Right Applications. Chemistry 2018. 12. Bing, N. C.; Tian, Z.; Zhu, L. P.; Jin, H. Y.; Wang, L. L.; Wang, L. J., Controlled Grafting of S-Naproxen Imprinted Layer on PVDF Microporous Membrane by ATRP. Advanced Materials Research 2010, 148-149, 1026-1030. 13. Liao, Y.; Wang, R.; Fane, A. G., Engineering superhydrophobic surface on poly(vinylidene fluoride) nanofiber membranes for direct contact membrane distillation. Journal of Membrane Science 2013, 440, 77-87. 14. Razmjou, A.; Arifin, E.; Dong, G.; Mansouri, J.; Chen, V., Superhydrophobic modification of TiO2 nanocomposite PVDF membranes for applications in membrane distillation. Journal of Membrane Science 2012, 415-416, 850-863. 15. Ahmadian-Alam, L.; Kheirmand, M.; Mahdavi, H., Preparation, characterization and properties of PVDF-g-PAMPS/PMMA-co-PAMPS/silica nanoparticle as a new proton exchange nanocomposite membrane. Chemical Engineering Journal 2016, 284, 1035-1048. 16. P. Bernardo, E. D., and G. Golemme, Membrane Gas Separation: A Review/State of the Art. Industrial & Engineering Chemistry Research 2009, 48, 4638-4663. 17. P. van de Witte, P. J. D., J.W.A. van den Berg, J. Feijen Phase separtion processes in polymer solutios in relation to membrane formation. Journal of Membrane Science 1996, 117, 1-31.

21
18. Zhaoliang Cui, Naser Tavajohi Hassankiadeh, Suk Young Lee, Jong Myung Lee, Kyung Taek Woo, Aldo Sanguineti, Vincenzo Arcella, Young Moo Lee, Enrico Drioli Poly(vinylidene fluoride) membrane preparation with an environmental diluent via thermally induced phase separation. Journal of Membrane science 2013, 444, 223-36. 19. Z. H. LI, Q. Z. X., P. ZHANG, H. P. ZHANG, Y. P. WU, and T. VAN REE, Porous nanocomposite polymer electrolyte prepared by a non-solvent induced phase separation process. Functional Materials Letters 2008, 1 (2), 139-143. 20. Han-han Lin, Y.-h. T., Tian-yin Liu, Hideto Matsuyama, Xiao-lin Wang, Understanding the thermally induced pha...ion process via a Maxwellâ•fiStefan model. Journal of Membrane Science 2016, 507, 143-153. 21. V.P. Khare, A. R. G., W.B. Krantz Vapor-induced phase separation—effect of the humid air exposure step on membrane morphology Part I. Insights from mathematical modeling. Journal of Membrane Science 2005, 258, 140-156. 22. Shenvi, S. S.; Isloor, A. M.; Ismail, A. F., A review on RO membrane technology: Developments and challenges. Desalination 2015, 368, 10-26. 23. Mehdizadeh, H., Membrane desalination plants from an energy–exergy viewpoint. Desalination 2006, 191 (1-3), 200-209. 24. Deowan, S. A.; Galiano, F.; Hoinkis, J.; Johnson, D.; Altinkaya, S. A.; Gabriele, B.; Hilal, N.; Drioli, E.; Figoli, A., Novel low-fouling membrane bioreactor (MBR) for industrial wastewater treatment. Journal of Membrane Science 2016, 510, 524-532. 25. Galiano, F.; Friha, I.; Deowan, S. A.; Hoinkis, J.; Xiaoyun, Y.; Johnson, D.; Mancuso, R.; Hilal, N.; Gabriele, B.; Sayadi, S.; Figoli, A., Novel low-fouling membranes from lab to pilot application in textile wastewater treatment. J Colloid Interface Sci 2018, 515, 208-220. 26. Figoli, A.; Ursino, C.; Galiano, F.; Di Nicolò, E.; Campanelli, P.; Carnevale, M. C.; Criscuoli, A., Innovative hydrophobic coating of perfluoropolyether (PFPE) on commercial hydrophilic membranes for DCMD application. Journal of Membrane Science 2017, 522, 192-201. 27. Homaeigohar, S.; Elbahri, M., Graphene membranes for water desalination. NPG Asia Materials 2017, 9 (8), e427. 28. Pierleoni, D.; Xia, Z. Y.; Christian, M.; Ligi, S.; Minelli, M.; Morandi, V.; Doghieri, F.; Palermo, V., Graphene-based coatings on polymer films for gas barrier applications. Carbon 2016, 96, 503-512. 29. Liu, G.; Jin, W.; Xu, N., Graphene-based membranes. Chem Soc Rev 2015, 44 (15), 5016-30. 30. Yang, Y.; Zhao, R. Q.; Zhang, T. F.; Zhao, K.; Xiao, P. S.; Ma, Y. F.; Ajayan, P. M.; Shi, G. Q.; Chen, Y. S., Graphene-Based Standalone Solar Energy Converter for Water Desalination and Purification. Acs Nano 2018, 12 (1), 829-835. 31. Intrchom, W.; Roy, S.; Humoud, M. S.; Mitra, S., Immobilization of Graphene Oxide on the Permeate Side of a Membrane Distillation Membrane to Enhance Flux. Membranes (Basel) 2018, 8 (3). 32. Humplik, T.; Lee, J.; O'Hern, S. C.; Fellman, B. A.; Baig, M. A.; Hassan, S. F.; Atieh, M. A.; Rahman, F.; Laoui, T.; Karnik, R.; Wang, E. N., Nanostructured materials for water desalination. Nanotechnology 2011, 22 (29), 292001. 33. Novoselov, K. S.; Fal'ko, V. I.; Colombo, L.; Gellert, P. R.; Schwab, M. G.; Kim, K., A roadmap for graphene. Nature 2012, 490 (7419), 192-200. 34. Hosseini, S. M.; Madaeni, S. S., The Role of Nanomaterials in Water Desalination: Nanocomposite Electrodialysis Ion-Exchange Membranes. 2017, 48, 291-303.

22
Chapter 2
Developement of PVDF-Graphene Thin Film Composite membranes
for Direct Contact Membrane Distillation
2.1 Chapter Summary
A simple and efficient method for the preparation of PVDF-Graphene TFC membranes is herein discussed. In
order to enhance adhesion between polymer and graphene, PVDF has been functionalized (PVDF-f) with
suitable molecule, using a procedure involving two reactions: basic treatment that leads to partial
defluorination and formation of double bonds, followed by radical polymerization with suitable molecule
bearing aromatic ring(s). PVDF-f was used to fabricate membranes which have been tested before
association with Graphene layer, which has been synthetized using CVD method under appropriate
conditions and used as coating on PVDF-f membranes (PVDF-f-GM). All produced membranes were analyzed
in order to deeply investigate chemical and morphological properties, using most common analysis
techniques. All membranes have been tested on Direct Contact Membrane Distillation apparatus with
interesting results: PVDF-f membranes produces a good water flux and excellent salt rejection up to 99.9 %
whereas 2D material effect in the case of PVDF-f-GM, causes a partial reduction in terms of flux on one
hand and enhanced salt rejection up to 99.99 % on the other hand; also, we observed an improved
membrane lasting and mechanical resistance.
2.2 Introduction
Water treatment and water-related issues are nowadays assuming remarkable importance and will become
of fundamental importance in the next future; due to higher clean water demands and population growth,
especially in densely populated countries such as India or China, water treatment technologies are becoming
fundamental matters of discussion which claim particular consideration1-2.Therefore, worldwide demand of
water is met by novel strategies whose purpose is to preserve and recycle wastewater in order to face the
problem. On this purpose, an important role is played by membrane technology which represent a steady
and reliable technique that is actually enforced for different scopes including water treatment because of its
enormous advantages, as well as the possibility to treat municipal and industrial wastewater either3-5. In fact,

23
membrane technology is a common and appreciated way owing to its outstanding properties in terms of
environmental impact, process scalability and flexibility and energy requirements. In the framework of water
shortage and reuse issue, desalination is going to be one of the dominant methods for fresh water production
starting from brackish ground water, wastewater or seawater; this is of remarkable importance since in
nations such as Kwait or Qatar 100% demand of water is fulfilled by desalination techniques based on
membrane technology6. Desalination aims to produce pure water which can be used for humans, for
commercial purpose or on industrial plants in salt removal occurs; actually, thermal distillation, the most
common technique used for desalination, has one biggest disadvantage among all, which is represented by
high energy demands7-10.In water desalination, the biggest achievement is to reach process efficiency as high
as possible, combined with use of sustainable and green energy sources such as solar energy11-12. The purpose
of water desalination, is the production of fresh and clean water through the removal of minerals dissolved
in it. In this framework, membrane processes role is greater day by day and despite thermal distillation is the
oldest used method, its high energy demand represent a bottleneck13. Actually, more than 50% of worldwide
desalination plants use Reverse Osmosis (RO) for fresh water production14-15.RO can be actually considered
leading technology in water desalination processes, but it suffers of important limitations such as harsh
operative conditions and suffers of concentration polarization phenomena14, 16 which decreases its efficiency.
Due to these limitations, other systems like Membrane Distillation (MD) are assuming greater importance in
desalination and water treatment processes owing to their undeniable advantages17-23 in terms of efficiency,
energy consumption and the absence of problems related to the concentration polarization22. Membrane
Distillation, is a particular thermally-driven process in which water vapor passes from hot feed side through a
microporous membrane and subsequently condensates on the cold permeate side. In this kind of processes,
the driving force is represented by the water vapor pressure difference between feed and permeate sides. In
order to maximize the process efficiency, features like material hydrophobicity, insulating properties and
pore-size in the range of microfiltration are essential requirements to prevent membrane wetting without
hinder the vapor passage, achieve good salt rejection and maintain the temperature difference between both
membrane sides24. On this purpose, the lack of fully optimized materials is one of main obstacles which arrests
scale up process: to overcome this drawbacks and design a tailored material with fit properties, several
methods are reported in literature by scientific community: coating membrane with hydrophobic
perfluorinated polymer25, realize a blend of two different materials26, use nanoparticles in association with
polymeric material27 or increase overall porosity degree by particular methods such as electrospinning28. In
last years, the introduction of available nanomaterials (NMs) increased the number of possibilities in terms
of new materials that can be used in MD processes in association with polymers with enormous benefits29-34:
they can be dispersed in polymer matrix, used as coatings, grafted on membrane surface and also be
functionalized for specific needs. On this purpose, graphene is one of most popular NMs and although deeper
investigation is needed to fully understand its properties, it right away exhibited great properties35.Basically,
graphene is a monoatomic thick material entirely made by sp2 carbon atom, whose properties such as

24
mechanical resistance, chemical inertness superconductivity attracted a lot of attention from scientific
community36, which steams from its potentiality to produce ultrathin membranes with tunable pore size and
superior performances in terms of permeability and selectivity37. For instance, Sint et al38created nanopores
on graphene terminated with nitrogen or hydrogen which act as ionic sieves inmolecular dynamic simulations.
In particular, permeation of Li+, K+ and Na+ ions is more favored for nitrogen-doped graphene, while
permeation of anions species like Cl- and Br- is higher in the case of hydrogen-doped graphene. Ions passage
through these membranes can be finely customized acting on both size and shape of nanopores and their
functionalization. Herein we report a method to fabricate PVDF-Graphene (PVDF-f-GM), using graphene layer
synthetized by CVD method as coating for membranes prepared using chemically-modified commercially
available PVDF powder (PVDF-f). Functionalization starts with basic treatment which leads to to a partial
defluorination and introduces double bonds onto polymer backbone, followed by radical co-polymerization
with suitable monomer. Produced membranes have been analyzed in order to investigate their chemical and
morphological properties and several Direct Contact Membrane Distillation tests have been performed on
them.
2.3 Results and Discussions
2.3.1 PVDF-f Polymer preparation and characterization
As shown in Figure 2.3.1.1, PVDF-f was prepared using a procedure involving two step reaction: basic
treatment of commercially available PVDF 6010 polymer powder with KOH in order to create double bonds
onto the polymer chain, followed by their polymerization by radical reaction with suitable ring(s) bearing
monomer.
Figure 2.3.1.1: schematic representation of PVDF functionalization by basic treatment
However, although membranes discussed in this work exhibit interesting properties in terms of water flux
and salt rejection, polymer synthesis is the result of a series of other experiments in which we changed
operative conditions and monomer that are summarized in Table 2.3.1.1 and discussed below.

25
Run PVDF/monomer
Ratio ( wt.)
Monomer
Type
Polymerization
Time (h)
Polymer
Synthesis
Membrane
Fabrication
Flux
Pure Water
(LMH/bar)
Flux
(Salty
Water)
Rejection
( %)
1 1:1 Styrene 15 Yes Yes ≈ 17 ≈12 99.9
2 1:0.5 Styrene 15 Yes Yes ≈6.4 5.8 99.5
3 1:2 Styrene 15 Yes No / / /
4 1:1 Styrene 18 Yes Yes 11.3 2.4 98.6
5 1:2 Styrene 18 Yes No / / /
6 1:1 Styrene 24 Yes No / / /
7 1:0.5 Styrene 24 Yes No / / /
8 1:2 Styrene 24 Yes No / / /
9 1:3 Vinyl
Naphtalene
15 Yes No / / /
10 1:1.5 Vinyl
Naphtalene
15 Yes No / / /
11 1:6 Vinyl
Naphtalene
15 Yes No / / /
Table 2.3.1.1l synthtetic conditions used for polymer synthesis. Reported flux values refer to a test performed using the same DCMD facility, using
crossflow velocity of 1 LPM, 0,5 M NaCl solution and Feed/Permeate temperature of 70/20 °C. In the case of vinyl-naphtalene related run(s) (10-12),
the amount of monomer has been calculated using an equimolar concentration with styrene.
Main efforts were focused on the last functionalization step in which double bonds in PVDF chain are
polymerized with monomer. We tried to change polymerization time and monomer amount and checked if
membrane preparation was possible. We notice that during polymerization both time and monomer
amount play an important role because they lead to a higher or lower functionalization degree and hence to
a final polymer with different solubility in organic solvents: in fact functionalization time allows C-C bond
formation between monomer and PVDF and on the other hand the chain-chain interaction that means a
final higher degree of reticulation. In particular, we observed that polymer with higher degree of
functionalization (Run 5-8) cannot be used for membrane preparation since no one of them exhibits
solubility high enough for common solvents such DMSO, DMFor DMAc and are not suitable for membrane
preparation. Vice versa, decreasing reaction time and monomer amount, both polymer and membranes can

26
be prepared, but membrane exhibit lower flux. Also with monomer changing ( Run 9-11) though polymer
functionalization occurs membranes cannot be prepared. Run1 reports optimized conditions which have
been used for PVDF-f polymer preparation and hence for membrane fabrication.
2.3.2 PVDF-f polymer characterization
Characterization of the new material was accomplished by NMR analyses
Figure 2.3.2.1 a-b show 1H NMR analysis performed on PVDF and PVDF-f powder respectively
Figure 2.3.2.1 a: 1H NMR of Pristine PVDF powder
Figure 2.3.2.1 b: 1H NMR of PVDF-f powder

27
In spectrum b, it is evident the presence of signals between 6.2 and 6.7 ppm, which are typical of aromatic
protons. These signals (absent in spectrum a) are therefore ascribable to the presence of phenyl rings in the
material and confirm the success of the copolymerization process between PVDF and styrene. Tis is further
confirmed by the signals between 1.2 and 2.1 ppm in spectrum b, which are due to the –CHPhCH2- moieties.
2.3.3 Graphene Characterization by optical microscope analysis
In order to estimate the presence of defects and multilayer areas, 2x1 cm2 sample of graphene were analized
after copper oxidation occurs (Figure 2.3.3.1-a) using a procedure described in the experimental part: after
synthesis by CVD method, when graphene is still on the copper foil catalyst, the sample is removed from the
machine and 1 cm2 sample is gently placed on a heating plate at 120 °C for 20 min. This temperature
increment causes copper oxidation, visible because of darker color in the areas not directly covered by the
graphene layer owing to defects, whereas the color does not change for areas beneath graphene layer (not
subjected to oxidation by O2). Another 1 cm2 sample is spin-coated with PMMA before copper removal by Iron
nitrate (III) and Iron Chloride (III) solutions with a procedure deeply described below in the experimental part.
Once dissolution occurs, the sample is placed on silicon wafer (Figure 2.3.3.1-b), PMMA is removed by
dissolution in acetone and sample analyzed using optical microscope.For each sample two shots were taken
at 200x and 1000x magnification (smaller and bigger picture respectively). Analysis show that some defect is
visible only at high magnification degree (Figure 2.3.3.1-a) in correspondence of areas not directly covered by
graphene.
in Figure 2.3.3.1-b, higher magnification picture shows that certain multi-layered areas ( visible as darker blue
spots) exist and the presence of residual PMMA ( visible as very bright light blue area in the bottom part of
image) either.
Figure2.3.3.1-a,b: in Picture 2.3.3.1-a after copper oxidation, optical microsope images show small darker areas which represent oxidized copper not
covered by graphene layer, while Picture 2.3.3.1-b shows graphene sample on silicon wafer: darker areas represent multi layered zone while bright
blue areas indicate residual PMMA polymer.

28
2.3.4 Membrane Fabrication and Characterization
All the membranes were produced by phase inversion using casting thickness of 220 μm, waterbath
composition was 100% water and its temperature was 19-21 °C. Once dried, membrane association with
graphene is made by using laminating machine.
The whole procedure is summarized in Figure 2.3.4.1: during phase 1 the adhesion between graphene and
polymer is enhanced by laminating machine, in phase 2 the catalyst solubilization occurs in order to get the
final membrane (phase 3):
Figure2.3.4.1: three phases in composite membrane fabrication procedure: Lamination process (phase1), catalyst removal (phase 2) and final
membrane (phase 3)
Produced membranes have been characterized by FT-IR, SEM, AFM, XPS and Mechanical test machine.
2.3.5 FT-IR analysis
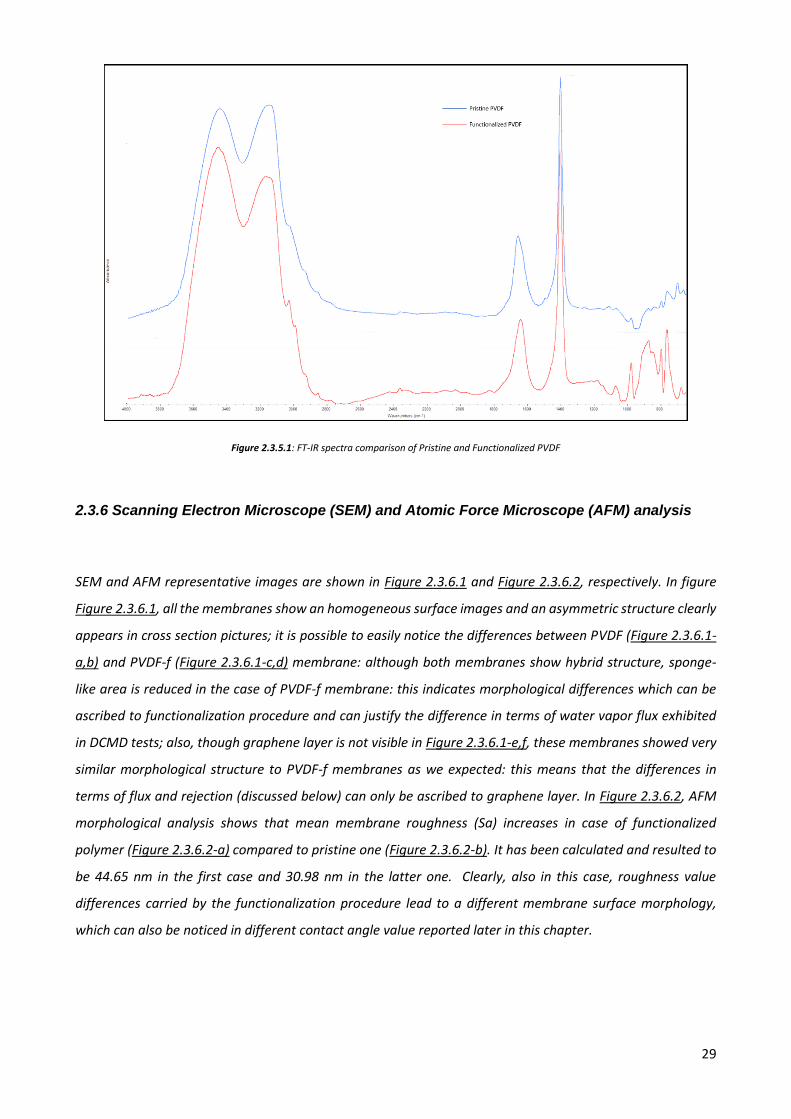
Figure 2.3.5.1 show a comparison between Pristine PVDF and PVDF-f membranes FT-IR analysis. It has been
observed that the presence of phenyl rings in the case of PVDF-f is confirmed by the aromatic out-of-plane C-
H bending in the 700-950 cm-1 region.
29
Figure 2.3.5.1: FT-IR spectra comparison of Pristine and Functionalized PVDF
2.3.6 Scanning Electron Microscope (SEM) and Atomic Force Microscope (AFM) analysis
SEM and AFM representative images are shown in Figure 2.3.6.1 and Figure 2.3.6.2, respectively. In figure
Figure 2.3.6.1, all the membranes show an homogeneous surface images and an asymmetric structure clearly
appears in cross section pictures; it is possible to easily notice the differences between PVDF (Figure 2.3.6.1-
a,b) and PVDF-f (Figure 2.3.6.1-c,d) membrane: although both membranes show hybrid structure, sponge-
like area is reduced in the case of PVDF-f membrane: this indicates morphological differences which can be
ascribed to functionalization procedure and can justify the difference in terms of water vapor flux exhibited
in DCMD tests; also, though graphene layer is not visible in Figure 2.3.6.1-e,f, these membranes showed very
similar morphological structure to PVDF-f membranes as we expected: this means that the differences in
terms of flux and rejection (discussed below) can only be ascribed to graphene layer. In Figure 2.3.6.2, AFM
morphological analysis shows that mean membrane roughness (Sa) increases in case of functionalized
polymer (Figure 2.3.6.2-a) compared to pristine one (Figure 2.3.6.2-b). It has been calculated and resulted to
be 44.65 nm in the first case and 30.98 nm in the latter one. Clearly, also in this case, roughness value
differences carried by the functionalization procedure lead to a different membrane surface morphology,
which can also be noticed in different contact angle value reported later in this chapter.

30
Figure 2.3.6.1 a-f: representative SEM images of top side and cross section of pristine PVDF membrane (a,b), membrane prepared with
functionalized pvdf (c,d), and PVDF-graphene composite membrane (e, f).
Figure 2.3.6.2 a,b: representative AFM images of membranes prepared using pristine PVDF (a) and PVDF-f polymer (b)

31
2.3.7 Contact Angle analysis
In Figure 2.3.7.1 a-e,top (a,c,e) and bottom(b,d) side contact angles for pristine (a,b), PVDF-f ( c, d) and PVDF-
f-GM (e) are reported. Two main considerations must be done about CA results, the first of which concerns
the slight increase of values of functionalized PVDF compared to pristine one, as expected, the second is about
the increment in CA value in bottom sides compared to top ones. In conclusion, low contact angle for PVDF-
graphene composite membrane is reported: according to literature, observed CA values for Graphene may
greatly change because they are in relation with material properties, number of layers, presence of metal
catalyst, environmental air exposure time, etc39-41: for instance, it has been observed how graphene CA has
the tendency to become greater when subject to contact with air, probably owing to its capacity to interact
with small hydrocarbons as well as big difference in CA values have been found comparing graphene samples
made using different catalyst. Comparing Pristine PVDF and PVDF-f membranes, an increase in CA values of
the PVDF-f has been observed. This agrees both with functionalization procedure and with AFM analysis that
indicates different morphological properties in terms of mean roughness. In the case of graphene, precise
contact angle value is still debated question researchers are struggling with and it needs to be investigated
more deeply. Furthermore, it must be noticed that CA is a measurement whose value takes into account not
only chemical structure and hence hydrophilicity or hydrophobicity, but also morphological parameters such
as roughness and hence the presence of cavities on the membrane surface will surely affect its value. In AFM
analysis, enhanced mean roughness value of PVDF-f compared to Pristine PVDF membranes can be one of
causes which justify the difference in CA values.
32
Figure2.3.7.1 a-e: CA value for membranes prepared using pristine PVDF (a,b), PVDF-f (c,d) and PVDF-f-GM (e)
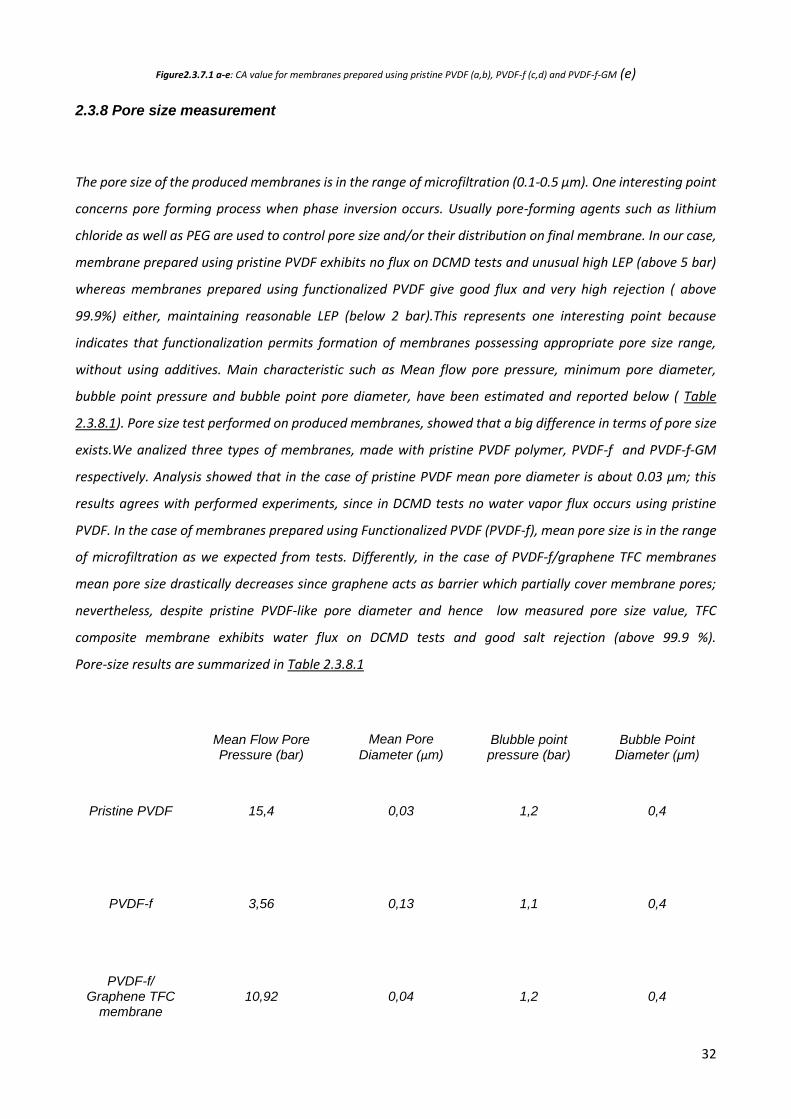
2.3.8 Pore size measurement
The pore size of the produced membranes is in the range of microfiltration (0.1-0.5 μm). One interesting point
concerns pore forming process when phase inversion occurs. Usually pore-forming agents such as lithium
chloride as well as PEG are used to control pore size and/or their distribution on final membrane. In our case,
membrane prepared using pristine PVDF exhibits no flux on DCMD tests and unusual high LEP (above 5 bar)
whereas membranes prepared using functionalized PVDF give good flux and very high rejection ( above
99.9%) either, maintaining reasonable LEP (below 2 bar).This represents one interesting point because
indicates that functionalization permits formation of membranes possessing appropriate pore size range,
without using additives. Main characteristic such as Mean flow pore pressure, minimum pore diameter,
bubble point pressure and bubble point pore diameter, have been estimated and reported below ( Table
2.3.8.1). Pore size test performed on produced membranes, showed that a big difference in terms of pore size
exists.We analized three types of membranes, made with pristine PVDF polymer, PVDF-f and PVDF-f-GM
respectively. Analysis showed that in the case of pristine PVDF mean pore diameter is about 0.03 μm; this
results agrees with performed experiments, since in DCMD tests no water vapor flux occurs using pristine
PVDF. In the case of membranes prepared using Functionalized PVDF (PVDF-f), mean pore size is in the range
of microfiltration as we expected from tests. Differently, in the case of PVDF-f/graphene TFC membranes
mean pore size drastically decreases since graphene acts as barrier which partially cover membrane pores;
nevertheless, despite pristine PVDF-like pore diameter and hence low measured pore size value, TFC
composite membrane exhibits water flux on DCMD tests and good salt rejection (above 99.9 %).
Pore-size results are summarized in Table 2.3.8.1
Mean Flow Pore Pressure (bar)
Mean Pore
Diameter (μm) Blubble point pressure (bar)
Bubble Point Diameter (μm)
Pristine PVDF 15,4 0,03 1,2 0,4
PVDF-f 3,56 0,13 1,1 0,4
PVDF-f/ Graphene TFC
membrane 10,92 0,04 1,2 0,4

33
Table 2.3.8.1: Pore size measurement for membranes prepared using pristine PVDF, PVDF-f and PVDF-f-GM
2.3.9 XPS analysis
XPS analysis shown in Figure 2.3.9.1, report a comparison of C1s,O1s and F1s peaks for both pristine PVDF
and PVDF-f membranes. In case of F1s spectra signals are comparable, whereas O1s signal intensity is lower
in PVDF-f than pristine one. Very interesting is C1s spectra in which PVDF CF2 peak is visible at 290 eV, and
two different peaks are shown at 284 and 285 eV, regarding styrene and CH2 PVDF peaks respectively. In
this case, the presence of three peaks in C1s spectra, indicates that functionalization occurs and aromatic
groups were successfully linked to the polymer.
1400 1200 1000 800 600 400 200 00,0
2,5x10 4
5,0x10 4
7,5x10 4
1,0x10 5
1,3x10 5
1,5x10 5
1,8x10 5
2,0x10 5
300 295 290 285 280 2750,0
2,5x10 3
5,0x10 3
7,5x10 3
1,0x10 4
1,3x10 4
1,5x10 4
1,8x10 4
2,0x10 4
2,3x10 4
2,5x10 4
700 695 690 685 680 675
1x10 4
2x10 4
3x10 4
4x10 4
5x10 4
6x10 4
7x10 4
8x10 4
9x10 4
1x10 5
1x10 5
1x10 5
545 540 535 530 5252000
2500
3000
3500
4000
4500
5000
5500
6000
6500
7000
7500
8000
Co
un
t\s
Binding Energy (ev)
Functionalized PVDF Pristine PVDF
Co
un
t\s
Binding Energy (ev)
Functionalized PVDF
Pristine PVDF
C1s
Co
un
t\s
Binding Energy (ev)
Functionalized PVDF
Pristine PVDF
F1s
Co
un
t\s
Binding Energy (ev)
Functionalized PVDF
Pristine PVDF
O1s
Figure 2.3.9.1: XPS analysis perfomed on membranes prepared using PVDF and PVDF-f polymer
2.3.10 Mechanical Tests
Figure 2.3.10.1 reports mechanical tests performed on Pristine PVDF PVDF-f and PVDF-f-GM TFC membranes
in order to evaluate their mechanical properties in terms of Young Module (E mod), tensile stress at break
(Rm) and elongation stress at break (ε-Break) .Chemical functionalization somehow leads to a reduction in
Emod, Rm and ε-Break values in PVDF-f membranes. However, when graphene is employed young module
rises up as well as tensile stress at break and composite membrane properties are closer to pristine polymer.
These composite membrane properties enhancement compared to PVDF-f membrane ones can be ascribed
to graphene effect on young module and tensile stress at break. Different speech applies to elongation at

34
break parameter, whose values indicates that: a) functionalization procedure causes elasticity loss and b)
even though 2D material is applied, the final membrane elasticity remains far less than pristine polymer.
EMod (N/mm2) Rm (N/mm2) ε-Break (%)
Pristine PVDF 208.0 12.9 140.8 SD 25.2 2.9 2.9
PVDF-f 143.3 3.7 98.8
SD 3.1 0.3 25.7
PVDF-f-GM 76.0 2.9 60.7 SD 12.6 0.1 0.9
Figure 2.3.10.1: Mechanical tests performed on Pristine PVDF, PVDF-f and PVDF-f-Gm
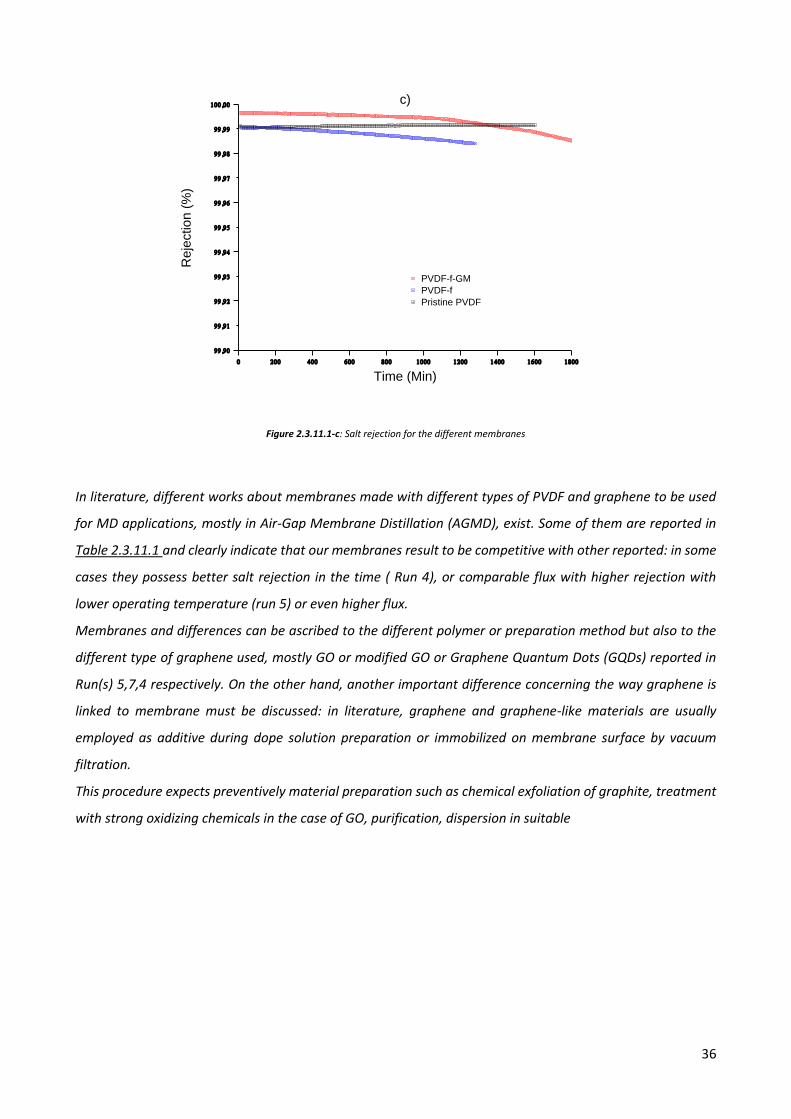
2.3.11 Direct Contact Membrane Distillation (DCMD) Tests
In order to compare the properties of membranes fabricated using above described procedure, we tested
pristine PVDF, PVDF-f and PVDF-f-GM membranes on the same Membrane Distillation apparatus with same
operative conditions described in the experimental part. We noticed that in the case of membranes
prepared using pristine PVDF polymer without pore forming agents the vapor flux across the membrane is
absolutely absent, whereas PVDF-f membranes possess a certain degree of porosity perhaps owing to the
functionalization treatment. However, in the case of PVDF-f membranes salt rejection remains high up to
99.9 %. In the case of PVDF-f-GM, the effect of graphene is particularly evident in terms of salt rejection
which rises up to 99.99%, at the expense of vapor flux whose decrement can probably be ascribed to the
“ barrier effect” operated by graphene layer.
Figure 2.3.11.1-a,b,c report tests performed on membranes both with pure water ( a), salty water (b) and
rejection comparison for different membranes (c), using conditions in detail described in experimental part.

35
30 40 50
0
5
10
15
20
Pristine PVDF
Functionalized PVDF
PVDF-Graphene membrane
Flu
x (
LM
H)
T
a)
Figure 2.3.11.1-a: DCMD test performed using pure water
30 35 40 45 50
0
10
20
Flu
x (
LM
H)
T
Pristine PVDF
Functionalized PVDF
PVDF-Graphene membrane
b)
Figure 2.3.11.1-b: DCMD test performed using salty water
36
0 200 400 600 800 1000 1200 1400 1600 1800
99,90
99,91
99,92
99,93
99,94
99,95
99,96
99,97
99,98
99,99
100,00
Reje
ction (
%)
Time (Min)
PVDF-f-GM
PVDF-f
Pristine PVDF
c)
Figure 2.3.11.1-c: Salt rejection for the different membranes
In literature, different works about membranes made with different types of PVDF and graphene to be used
for MD applications, mostly in Air-Gap Membrane Distillation (AGMD), exist. Some of them are reported in
Table 2.3.11.1 and clearly indicate that our membranes result to be competitive with other reported: in some
cases they possess better salt rejection in the time ( Run 4), or comparable flux with higher rejection with
lower operating temperature (run 5) or even higher flux.
Membranes and differences can be ascribed to the different polymer or preparation method but also to the
different type of graphene used, mostly GO or modified GO or Graphene Quantum Dots (GQDs) reported in
Run(s) 5,7,4 respectively. On the other hand, another important difference concerning the way graphene is
linked to membrane must be discussed: in literature, graphene and graphene-like materials are usually
employed as additive during dope solution preparation or immobilized on membrane surface by vacuum
filtration.
This procedure expects preventively material preparation such as chemical exfoliation of graphite, treatment
with strong oxidizing chemicals in the case of GO, purification, dispersion in suitable

37
Table 2.3.11.1: literature work comparison. Run142,Run243,Run344,Run431,Run530, Run645, Run746

38
2.4 Experimental
2.4.1 Chemicals
PVDF 6010 (Solef, Solvay), KOH (Daejung, 1 Kg flakes, 93% purity ), AIBN (Junsei,1 Kg, purity ≥ 98 %), Styrene
(Sigma Aldrich, 1 lt, purity 99.9 %) and DMF (Sigma Aldrich, purity ≥ 99.8 % ) have been used without further
purification. For graphene synthesis, 15 micron thickness copper catalyst(Welcos, 99.9%), Nitrogen (Air Korea
99.999%), Argon (Air Korea 99.999%), Methane (Air Korea 99.999%), Hydrogen (Air Korea 99.999%) have
been employed.
2.4.2 PVDF-f synthesis
The PVDF functionalization (PVDF-f) was realized on the base of one procedure present in literature47, which
involves two reactions: the first step corresponds to a basic treatment with KOH to induce the formation of
double bonds in the polymeric backbone by HF elimination, while the second step is a radical copolymerization
of the double bonds with styrene, as shown in Figure 2.3.1.1. Briefly, PVDF 6010 (40 g) were suspended in a
KOH solution (40 g in 719.6 g of deionized water) containing absolute EtOH (0.4 g) under nitrogen atmosphere.
The suspension was stirred at 60 °C for 10 min, and then a solution of PVDF (38 g) in DMF (0.456 l) was slowly
added in portions, followed by styrene (38 gr) and AIBN (0.623 g). The resulting mixture was stirred at 70 °C
for 15 h.
After cooling, the polymeric material was precipitated with 2.5-3 fold excess of MeOH, then filtered, washed
with DI water, and dried under vacuum at 50 °C overnight in order to obtain dry PVDF powder.
Polymerization step was carried out using conditions described in Table 2.3.1.1.
2.4.3 PVDF-f characterization
PVDF-f was characterized by NMR and FT-IR spectroscopies. 1H and spectra were taken on a 600 MHz
spectrometer (VNMRS 600 MHz) in DMF-d7 as the solvent, while the FT-IR spectrum was registered on a
Thermo-scientific Nicolet 6700 FTIR instrument. All spectra showed the presence of the aromatic styrene rings,
thus confirming the functionalization.
2.4.4 CVD-Graphene synthesis
Graphene was synthetized by CVD method, using the operative conditions summarized in Figure 2. For this
purpose, high purity reagents were used: ≥ 99.999 % purity argon, hydrogen and methane and 15 micron
copper catalyst.

39
Figure 2: Synthetic conditions used for graphene synthesis by CVD method
Phase 1: 30 min, Ar flux =500 sccm, P= 1.5 Torr, T to 750 °C
• Phase 2: 20 min, H2 flux = 40 sccm, P = 1.5 Torr
• Phase 3: 25 min, H2 flux = 40 sccm, P = 1.5 Torr, T = from 750 to 1020 °C
• Phase 4: 120 min, H2 flux = 40 sccm, P = 1.5 Torr (Copper annealing phase)
• Phase 5: 30 min, H2 flux = 120 sccm, CH4 flux= 5 sccm P = 4.5 Torr (Graphene growth)
• Phase 6: 120-180 min, H2 flux = 40 sccm, P = 1.5 Torr, T = from 1020 to RT
2.4.5 Graphene characterization by Optical Microscope
In order to evaluate graphene defects, the prepared samples were analyzed by optical microscopy.
Once the procedure is completed and graphene is still on the copper foil catalyst, the sample is removed from
the machine and 1 cm2 sample was gently placed on a heating plate at 120 °C for 20 min. This leads to
oxidation of copper, which assumes a darker color in the areas not directly covered by the graphene layer
owing to defects, whereas the color does not change for areas beneath graphene layer (not subjected to
oxidation). Eventually. in order to evaluate presence of multilayer areas not visible unless copper removal
occours, another 1 cm2 sample was transferred on Si wafer using wet-transfer method: at first this sample
was spin-coated with PMMAand placed on heating plate at 120 °C to ease adhesion between graphene and
PMMA. Subsequently the catalyst was solubilized using the procedure involving iron nitrate and iron chloride
0 min; 25°C
30 min; 750 °C
50 min; 750 °C
75 min; 1005 °C
195 min; 1005 °C
225 min; 1005 °C
405 min; 25 °C
0
200
400
600
800
1000
1200
0 50 100 150 200 250 300 350 400 450
TEM
PER
ATU
RE
(°C
)
TIME (min)

40
solutions below described. Now the PMMA-graphene sample is placed on SiO2 wafer and then on a heating
plate again at 120 °C for 20 min in order to heat PMMA and ease wafer-graphene adhesion. The sample is
now plunged into a solvent able to solubilize PMMA (we used acetone), air dried, before being observed using
optical microscope
2.4.6 Membrane preparation
As it is known, usually pore forming agents are used to control pores size and their distribution as well. We
noticed that preparing flat sheet membranes using Pristine PVDF without any additives addiction, these
membranes exhibit low porosity degree and no water vapor flux on MD tests, whereas functionalization leads
to the formation of microporous membrane without any of above-mentioned pore forming agents is
employed.
2.4.6.1 Pristine PVDF and PVDF-f flat sheet membrane preparation
Flat-sheet membranes have been produced by NIPS (Nonsolvent Induced Phase Separation) technique. Dope
solution was prepared using about 18% wt. polymer concentration in DMF. After stirring the solution for 12h
at 60°C, the dope solution was cast on a glass support by using a casting machine (with a casting knife
thickness of 220 μm) and immersed in DI water bath at a temperature of about 20°C.Once phase inversion
process was completed, the membrane was first washed in ethanol bath and subsequently in the hexane bath
to remove the last traces of the solvent and dried.
2.4.6.2 PVDF-f-GM fabrication
Laminating machine (Laminatoer K-Lami customized) have been used to ease adhesion between graphene
and PVDF membranes (PVDF-f or Pristine PVDF) (step 1). Once process was completed, copper was still
attached to graphene ad it was solubilized, using an iron chloride (III) and Iron nitrate (III) solutions as etchant
(step 2). Then, the membrane was washed several times with water and air dried overnight (step 3). The
laminating process steps are summarized in Figure 2.4.2.1.

41
Figure 2.4..2.1 :PVDF-f-GM preparation: At first PVDF-f and graphene adhesion is enhanced by laminating machine (step 1), followed by catalyst chemical etching with iron nitrate and iron chloride etchant solutions (step 2) in order to obtain final composite membrane (step 3)
2.4.7 Membrane Characterization
2.4.7.1 SEM analysis
Membrane morphology has been evaluated by SEM analysis using Nova Nano SEM instrument. Samples
were preventively frozen with liquid nitrogen and cutted using a sharp small blade.
Cross-section and top surface of the produced membranes were analyzed.
2.4.7.2 XPS analysis
XPS analysis have been performed with particular attention on carbon, fluorine and oxygen atoms, in order
to check the nature of bonds formed by these atoms, using a Thermo-scientific theta probe basic system.
2.4.7.3 Mechanical tests
In order to check the mechanical properties of the membranes, Young module, max strain and max stress
have been evaluated using UTM- Shimadzu, AGS-J facility.
2.4.7.4 AFM Analysis
Surface roughness and morphology of membranes were estimated by mean of Atomic Force Microscope
(AFM) analysis, using XE-100 machine.
PVDF-f/ Graphene TFC membrane
Graphene layer Copper foil layer
FeCl3 solution FeNO
3 solution
PVDF-f membrane
Step 2: use of iron chloride and iron nitrate solution as
etchant in order to solubilize copper catalyst
Step3: Final PVDF-f- GM after drying
process is complete
Step 1: adhesion enhancement by
lamination process

42
2.4.8 LEP and wettability
Membrane wettability is one crucial aspects in Membrane Distillation (MD) process since it can affect its
performances, in terms of rejection and thence in terms of long-term stability. In water desalination through
MD processes, highly hydrophobic materials such as PTFE or PVDF and possessing high LEP are usually
employed. LEP (liquid entry pressure) for a hydrophobic, dry membrane, is the pressure that must be applied
so that the liquid penetrates through it. This is a fundamental parameter to consider in order to evaluate
membrane efficiency, since it is comprehensive of several other factors such as hydrophobicity, geometry,
pore size and distribution, surface free energy and nature of solution as well. As reported in literature, LEP
can be calculated by the following equation:
LEP= (-4Bσ cosϴ)/r_max (1)
Where B is geometry-related factor (B=1 for cylindrical pores), σ is solution surface-tension, ϴ is contact angle
and r_max is the largest pore diameter.
2.4.9 Water flux through the membrane
Flux through membrane ( J ) is proportional to the vapor pressure difference between both side of membrane
and can be expressed as:
𝐽 = 𝐶𝑚 (𝑃𝑓𝑚 − 𝑃𝑝𝑚) (2)
Where Pfm and Ppm are vapor pressure in feed and permeate side respectively and Cm is membrane distillation
coefficient, determined on predominant transport mechanism (mass transport or Knudsen diffusion)
2.4.10 DCMD experiments
Experiments were carried out using classical configuration of lab-scale DCMD facility already described in
literature47 Briefly, main part of system is made by two tanks (feed and permeate) which can be heated or

43
chilled selectively. One membrane-containing Teflon cell in which crossflow velocities can ben regulated
separately for feed and permeate side, represent functional part of entire machine.
Flux across membrane is function of difference of water vapor pressure between feed and permeate side, the
membrane surface (area) and can be easily estimated using weight increase of permeate solution in the time.
Salt rejection has been calculated using following equation:
𝑅𝑠 = (1- Cf/C
p)*100 (3)
Where Cf and Cp represent salt concentrations in feed and permeate side respectively.
Flux has been calculated using the equation below:
𝐹 =𝑚
𝜌𝑤S t (4)
where m is the difference of permeate weight in the time, ρw is the water density and S is the membrane
surface area.
2.5 Chapter Conclusions
The large diffusion of nanomaterials in last years brought a lot of exploitable benefits and many possibility.
In membrane science NMs use is still subjected to their production cost that can sometimes limitate their use.
On the other hand, their association with polymeric materials is usually done by dispersion of NMs in polymer
matrix before membrane fabrication. In this chapter a novel approach to use graphene layer as coating for a
specific desalination process has been realized. The synthesis of NMs is simple and done by CVD method and
its interaction with polymer is maximized by previous polymer modification with suitable molecules bearing
aromatic rings. Results showed that in the case of pristine PVDF the membrane pore size is to small for a
working membrane in this kind of process. PVDF-f membranes, on the other hand, work well in terms of flux
and rejection either. Graphene coating application, has different effects instead: it causes a flux reduction
probably because it acts as barrier; beside that it enhances the salt rejection which rises up to 99.99% and
confers good mechanical properties to the membrane, which also exhibits longer lasting during the tests.

44
Chapter 2 references
1. Pendergast, M. M.; Hoek, E. M. V., A review of water treatment membrane nanotechnologies. Energy & Environmental Science 2011, 4 (6), 1946. 2. Jayashree Dhote, S. I. a. A. C., REVIEW ON WASTEWATER TREATMENT TECHNOLOGIES. International Journal of Engineering Research & Technology (IJERT) 2012, 1 (5). 3. Deowan, S. A.; Galiano, F.; Hoinkis, J.; Johnson, D.; Altinkaya, S. A.; Gabriele, B.; Hilal, N.; Drioli, E.; Figoli, A., Novel low-fouling membrane bioreactor (MBR) for industrial wastewater treatment. Journal of Membrane Science 2016, 510, 524-532. 4. Galiano, F.; Friha, I.; Deowan, S. A.; Hoinkis, J.; Xiaoyun, Y.; Johnson, D.; Mancuso, R.; Hilal, N.; Gabriele, B.; Sayadi, S.; Figoli, A., Novel low-fouling membranes from lab to pilot application in textile wastewater treatment. J Colloid Interface Sci 2018, 515, 208-220. 5. Quintana, J. B.; Weiss, S.; Reemtsma, T., Pathways and metabolites of microbial degradation of selected acidic pharmaceutical and their occurrence in municipal wastewater treated by a membrane bioreactor. Water Res 2005, 39 (12), 2654-64. 6. Mehdizadeh, H., Membrane desalination plants from an energy–exergy viewpoint. Desalination 2006, 191 (1-3), 200-209. 7. Ali, A.; Tufa, R. A.; Macedonio, F.; Curcio, E.; Drioli, E., Membrane technology in renewable-energy-driven desalination. Renewable and Sustainable Energy Reviews 2018, 81, 1-21. 8. Abdullah, N.; Rahman, M. A.; Dzarfan Othman, M. H.; Jaafar, J.; Ismail, A. F., Membranes and Membrane Processes. 2018, 45-70. 9. Macedonio, F.; Drioli, E., Pressure-driven membrane operations and membrane distillation technology integration for water purification. Desalination 2008, 223 (1-3), 396-409. 10. Daufin, G.; Escudier, J. P.; Carrère, H.; Bérot, S.; Fillaudeau, L.; Decloux, M., Recent and Emerging Applications of Membrane Processes in the Food and Dairy Industry. Food and Bioproducts Processing 2001, 79 (2), 89-102. 11. Mohammed Rasool wtaishat, F. B., Desalination by solar powered membrane distillation systems. Desalination 2013, 308, 186-197. 12. Pandey, P. K.; Upadhyay, R., Desalination of Brackish Water using Solar Energy. Int J Renew Energy R 2016, 6 (2), 350-354. 13. Goh, P. S.; Ismail, A. F.; Hilal, N., Nano-enabled membranes technology: Sustainable and revolutionary solutions for membrane desalination? Desalination 2016, 380, 100-104. 14. Su, X.; Li, W.; Palazzolo, A.; Ahmed, S., Concentration polarization and permeate flux variation in a vibration enhanced reverse osmosis membrane module. Desalination 2018, 433, 75-88. 15. Shenvi, S. S.; Isloor, A. M.; Ismail, A. F., A review on RO membrane technology: Developments and challenges. Desalination 2015, 368, 10-26. 16. Jang, E.-S.; Mickols, W.; Sujanani, R.; Helenic, A.; Dilenschneider, T. J.; Kamcev, J.; Paul, D. R.; Freeman, B. D., Influence of Concentration Polarization and Thermodynamic Non-ideality on Salt Transport in Reverse Osmosis Membranes. Journal of Membrane Science 2018. 17. Janajreh, I.; Hashaikeh, R.; Hussain, M. N., Evaluation of Thermal Efficiency of Membrane Distillation under Conductive Layer Integration. Energy Procedia 2017, 105, 4935-4942. 18. Curcio, E.; Drioli, E., Membrane Distillation and Related Operations—A Review. Separation & Purification Reviews 2005, 34 (1), 35-86. 19. Deshmukh, A.; Boo, C.; Karanikola, V.; Lin, S.; Straub, A. P.; Tong, T.; Warsinger, D. M.; Elimelech, M., Membrane distillation at the water-energy nexus: limits, opportunities, and challenges. Energy & Environmental Science 2018, 11 (5), 1177-1196. 20. Gonzalez, D.; Amigo, J.; Suarez, F., Membrane distillation: Perspectives for sustainable and improved desalination. Renew. Sust. Energ. Rev. 2017, 80, 238-259. 21. Alobaidani, S.; Curcio, E.; Macedonio, F.; Diprofio, G.; Alhinai, H.; Drioli, E., Potential of membrane distillation in seawater desalination: Thermal efficiency, sensitivity study and cost estimation. Journal of Membrane Science 2008, 323 (1), 85-98. 22. Pangarkar, B. L.; Sane, M. G.; Guddad, M., Reverse Osmosis and Membrane Distillation for Desalination of Groundwater: A Review. ISRN Materials Science 2011, 2011, 1-9.

45
23. Deshmukh, A.; Elimelech, M., Understanding the impact of membrane properties and transport phenomena on the energetic performance of membrane distillation desalination. Journal of Membrane Science 2017, 539, 458-474. 24. Criscuoli, A.; Carnevale, M. C., Desalination by vacuum membrane distillation: The role of cleaning on the permeate conductivity. Desalination 2015, 365, 213-219. 25. Figoli, A.; Ursino, C.; Galiano, F.; Di Nicolò, E.; Campanelli, P.; Carnevale, M. C.; Criscuoli, A., Innovative hydrophobic coating of perfluoropolyether (PFPE) on commercial hydrophilic membranes for DCMD application. Journal of Membrane Science 2017, 522, 192-201. 26. Li, L.; Hou, J. W.; Ye, Y.; Mansouri, J.; Chen, V., Composite PVA/PVDF pervaporation membrane for concentrated brine desalination: Salt rejection, membrane fouling and defect control. Desalination 2017, 422, 49-58. 27. Razmjou, A.; Arifin, E.; Dong, G.; Mansouri, J.; Chen, V., Superhydrophobic modification of TiO2 nanocomposite PVDF membranes for applications in membrane distillation. Journal of Membrane Science 2012, 415-416, 850-863. 28. Dong, Z.-Q.; Ma, X.-h.; Xu, Z.-L.; You, W.-T.; Li, F.-b., Superhydrophobic PVDF–PTFE electrospun nanofibrous membranes for desalination by vacuum membrane distillation. Desalination 2014, 347, 175-183. 29. Hou, D.; Lin, D.; Ding, C.; Wang, D.; Wang, J., Fabrication and characterization of electrospun superhydrophobic PVDF-HFP/SiNPs hybrid membrane for membrane distillation. Separation and Purification Technology 2017, 189, 82-89. 30. Leaper, S.; Abdel-Karim, A.; Faki, B.; Luque-Alled, J. M.; Alberto, M.; Vijayaraghavan, A.; Holmes, S. M.; Szekely, G.; Badawy, M. I.; Shokri, N.; Gorgojo, P., Flux-enhanced PVDF mixed matrix membranes incorporating APTS-functionalized graphene oxide for membrane distillation. Journal of Membrane Science 2018, 554, 309-323. 31. Jafari, A.; Kebria, M. R. S.; Rahimpour, A.; Bakeri, G., Graphene quantum dots modified polyvinylidenefluride (PVDF) nanofibrous membranes with enhanced performance for air Gap membrane distillation. Chemical Engineering and Processing - Process Intensification 2018, 126, 222-231. 32. Intrchom, W.; Roy, S.; Humoud, M. S.; Mitra, S., Immobilization of Graphene Oxide on the Permeate Side of a Membrane Distillation Membrane to Enhance Flux. Membranes (Basel) 2018, 8 (3). 33. Ko, C.-C.; Ali, A.; Drioli, E.; Tung, K.-L.; Chen, C.-H.; Chen, Y.-R.; Macedonio, F., Performance of ceramic membrane in vacuum membrane distillation and in vacuum membrane crystallization. Desalination 2018, 440, 48-58. 34. Yang, F.; Efome, J. E.; Rana, D.; Matsuura, T.; Lan, C., Metal-Organic Frameworks Supported on Nanofiber for Desalination by Direct Contact Membrane Distillation. ACS Appl Mater Interfaces 2018, 10 (13), 11251-11260. 35. Novoselov, K. S.; Fal'ko, V. I.; Colombo, L.; Gellert, P. R.; Schwab, M. G.; Kim, K., A roadmap for graphene. Nature 2012, 490 (7419), 192-200. 36. Geim, A. K., Graphene: Status and Prospects. Science 2009, 80 (324), 1530-1534. 37. Humplik, T.; Lee, J.; O'Hern, S. C.; Fellman, B. A.; Baig, M. A.; Hassan, S. F.; Atieh, M. A.; Rahman, F.; Laoui, T.; Karnik, R.; Wang, E. N., Nanostructured materials for water desalination. Nanotechnology 2011, 22 (29), 292001. 38. K. Sint, B. W., P. Kral, Selective Ion Passage through Functionalized Graphene. Journal of American Chemical Society 2008, 130, 16448-16449. 39. Li, Z.; Wang, Y.; Kozbial, A.; Shenoy, G.; Zhou, F.; McGinley, R.; Ireland, P.; Morganstein, B.; Kunkel, A.; Surwade, S. P.; Li, L.; Liu, H., Effect of airborne contaminants on the wettability of supported graphene and graphite. Nat Mater 2013, 12 (10), 925-31. 40. Hong, G.; Han, Y.; Schutzius, T. M.; Wang, Y.; Pan, Y.; Hu, M.; Jie, J.; Sharma, C. S.; Muller, U.; Poulikakos, D., On the Mechanism of Hydrophilicity of Graphene. Nano Lett 2016, 16 (7), 4447-53. 41. Taherian, F.; Marcon, V.; van der Vegt, N. F.; Leroy, F., What is the contact angle of water on graphene? Langmuir 2013, 29 (5), 1457-65. 42. Deyin Hou, H. F., Qinliang Jiang , Jun Wanga, Xiaohui Zhang, Preparation and characterization of PVDF flat-sheet membranes for direct contact membrane distillation. Separation & Purification Technology 2014, 135, 211-222. 43. J. Phattaranawik , R. J., A.G. Fane Effect of pore size distribution and air flux on mass transport in direct contact membrane distillation. Journal of Membrane Science 2003, 215, 75-85.

46
44. Chunsheng Feng, B. S., Guomin Li, Yonglie Wu, Preliminary research on microporous membrane from F2.4 for membrane distillation. Separation & Purification Technology 2004, 39, 221-228. 45. Yonglie Wu, Y. K., Xiao Lin, Weihong Liu and Jiping Xu, Surface-modified hydrophilic membranes in membrane distillation. Journal of Membrane Science 1992, 72, 189-196. 46. Zahirifar, J.; Karimi-Sabet, J.; Moosavian, S. M. A.; Hadi, A.; Khadiv-Parsi, P., Fabrication of a novel octadecylamine functionalized graphene oxide/PVDF dual-layer flat sheet membrane for desalination via air gap membrane distillation. Desalination 2018, 428, 227-239. 47. Liu, J.; Shen, X.; Zhao, Y.; Chen, L., Acryloylmorpholine-Grafted PVDF Membrane with Improved Protein Fouling Resistance. Industrial & Engineering Chemistry Research 2013, 52 (51), 18392-18400.

47
Chapter 3
Synthesis of polymerizable Acryloyloxyalkyltriethylammonium
salts surfactants and their antibacterial activity
Chapter based on the article titled: “ Synthesis and Antibacterial Activity of Polymerizable
Acrylkoyloxyalkiltriethyl Ammonium Salts”
(Raffaella Mancuso, Roberta Amuso, Biagio Armentano, Giuseppe Grasso, Vittoria Rago, Anna Rita
Cappello, Francesco Galiano, Alberto Figoli, Giorgio De Luca, Jan Hoinkis and Bartolo Gabriele,
ChemPlusChem 2017)
3.1 Chapter Summary
Herein, we report a novel and efficient synthetic scheme for the synthesis of polymerizable quaternary
ammonium salts (PQASs), an important class of surfactants owing great antibacterial properties. PQASs and
more precisely “Acryloyloxyalkyltriethylammonium bromides” (AATEABs) may be used as coating for
membranes ( commercial or not) used in wastewater treatment, when antibiofouling and antibacterial
properties are required. Synthetic strategy we advance, involves a series of two-steps reaction which starts
from commercially and easily available substrate and which is totally realized under air, avoiding inert
conditions such as nitrogen atmosphere and purification by column. Biological tests performed on Gram+\-
and yeast strains, revealed that antibacterial activity is higher in AATEABs bearing alkyl chain of 11 and 12
atoms.
3.2 Introduction
QAAs are a particular class of salts which are well known to own remarkable antimicrobial activity, that have
extensively used for long time as disinfectant and antiseptics1-2. In particular, they have been used as additive
in textile industries for several productions or as polymerizable co-monomers able to prevent textile washing-
away3-6. In consideration of QAS antibacterial activity, several studies have been done in order to develop
polymeric materials starting from quaternary ammonium salts or finalized to their post-functionalization7-

48
15.In this contest, the work herein reported is of particular relevance in the framework of membrane with
antifouling feature development, already reported in literature16, in which commercial polyethersulfone (PES)
membranes were functionalized by coating with antimicrobial film, which properties make the membrane
able to prevent growth of microorganism and hence increase membrane lifetime; on that purpose a particular
PQAS, acryloyloxyalkyltriethylammonium bromide (AUTEAB), has been used as co-monomer in an in-situ
radical polymerization of PBM ( Polymerizable Bicontinuous Microemulsion) containing AUTEAB as co
monomer. Tests performed on membrane bioreactors (MBR) confirmed its activity and promotion as possible
candidate for large scale operation. In this chapter, a novel and efficient strategy for synthesis of
acryloyloxyalkyltriethylammonium bromide salts (AATEABs) with 6, 9, 11 and 12 carbon alkyl chain is reported
discussed: AATEABs synthetic strategy has been optimized and conducted under air, avoiding inert
atmosphere and purification of crude product. Our strategy results thus particularly appropriate and suitable
for any scale-up process and industrial application. In order to evaluate AATEABs antimicrobial activity,
several test have been conducted on Gram+\- bacterias and yeast strains.
3.3 Results and discussion
Basically, our synthetic strategy for the synthesis of AATEABs is based on two step reaction which consists in
an esterification of readily available ω-bromoalkanol with acryloyl chloride in presence of molecular sieves,
followed by quaternization step with triethylamine. The whole synthetic process is summarized in Scheme
3.3.1.
Scheme 3.3.1: Acryloyloxyalkyltriethylammonium bromides (AATEABs, 4a-d) synthetic scheme, starting from bromoalkanols 1a-d, easily available on
the market.

49
Initially, the work has been focused on the optimization of both esterification and quaternization step in order
to avoid the use of prohibitive and costly conditions such as inert atmosphere, time and use of expensive
chemicals for the purification of crude product 3. The final optimized conditions which lead to the synthesis
of crude product 3, expect the use of CH3CN as solvent, 1:1 molar ratio of Acryloyl chloride 2 with respect to
bromoalkanol 1, using a small amount of BHT ( dibuthylhydroxytoluene) as radical scavenger, in the presence
of 3Å molecular sieves powder at 90 °C for 24 hours. The intermediate 3 obtained from first step, was used
without purification by chromatographic or any other methods for the next step which consists in
quaternization by reaction of 3 with triethylamine, using a 1.1:1 molar ratio with respect bromoalkanol 1,
using CHCl3 at 60 °C for 72 hours. The product 4a-d, were obtained with a good purity >96% by 1H NMR
analysis and high yield over two steps ( 61-75% basing on bromoalkanols 1a-d), by precipitation and washing
operationusing diethyl ether. In order to extend the procedure to other AATEABs analogues with shorter alkyl
chain, we tried to extend the procedure to the synthesis of 4e-f, as summarized in Scheme 3.3.2.
Scheme 3.3.2: Generalization procedure for the synthesis of AATEABs analogues 4e-f, starting from 2-bromoethanol 1e and 2-bromopropanol 1f.
However, the synthetic strategy for 4e-f required a change of synthetic strategy since they cannot be obtained
with high yield and satisfactory purity using the same condition used in the case of 4a-d. To prepare the4e-f
derivates, we adopted the strategy summarized in Scheme 3.3.2 which involves three steps reaction: reaction
of bromoethanol 1e or bromopropanol 1f with high excess of diethylamine to give 2-(dimethylamino)ethanol
and 3-(diethylamino)propanol 5e and 5f respectively, followed by their esterification with acryloylchloride 2
to give 2-(diethylamino)ethylacrylate 6e and 3-(diethylamino)propylacrylate 6f; quaternization of 6e-f with
low molar amount of Ethylbromide to afford 4e-f represents the final step. In this case the low molar amount
of EtBr is important because it eases purification process. The evaluation of antimicrobial activity of AATEABs

50
4a-f has been done by tests against two Gram positive strains ( Staphylococcus aureus and Streptococcus
pyogenes), three Gram negative strains ( Escherichia coli, Klebisiella pneumoniae and Pseudomonas
aeruginosa) and two yeast strains (Saccharomyces cervisae and Candida albicans). Among all AATEABs tested,
4a,b (C11 and C12 alkyl chain respectively) exhibited the highest activity against Gram positive bacteria and
yeast strains, with a 4b/4a activity ratio of 4/1 (inhibition resulted to be 40-50% at 128 μg ml-1 in the case of
4a and 50-60% at 32 μg ml-1 in the case of 4b), whereas activity against Gram negative strains resulted to be
significantly reduced (30-40% at 512 μg ml-1 for 4a and 40-50% at 256 μg ml-1 for 4b). Besides, 4d (C6 alkyl
chain) exhibited activity only against Gram positive strains, resulting therefore inactive against
Saccharmomyces Cervisae and Candida albicans, despite the use of high concentration. Contrariwise, product
4c ( C9 alkyl chain) exhibited remarkable activity agains Candida albicans, a type of yeast strain ( 40% at 128
μg ml-1) without exhibiting any activity against Gram positive or negative. AATEABs with shorter alkyl chain
4e-f (C2 and C3 respectively) resulted to be totally inactive against any bacterial or yeast strains. Comparison
term for AATEABs activity, is the use of non-polymerizable quaternary ammonium salt: DTAB
( Dodecyltrimethylammonium bromide) with Kirby-Bauer method17.Briefly, Bacteria or yeast strain on which
AATEABs were tested, can be grouped into three main categories, based on size of diffusion zones diameter:
Resistant, intermediate and sensitive. DTAB activity resulted to be comparable to AATEABs 4a,b (C11 and C12
respectively): against Gram positive strains, But it is higher in the case of Gram negative strains. Different
speech must be done concerning the activity against yeast strains: in general, DTAB and 4b ( C12 chain) have
comparable activity, while 4a resulted to be less active than 4b and DTAB.
3.4 AATEABs Characterization
Characterization of AATEABs was accomplished by NMR, Mass spectroscopy, Melting point and IR analysis

51
3.4.1 1H and 13C NMR analysis
Figure 3.4.1.11H NMR Spectra for Acryloyloxyundecyltriethylammonium bromide (4a):(300 MHz, CDCl3): δ = 6.39 [distorted dd, J = 17.3, 1.5, 1 H, OC(O)CH=CHH], 6.12 (distorted dd, J = 17.3, 10.3, 1 H, OC(O)CH=CHH),
5.84 [distorted dd, J = 10.4, 1.6, 1 H, OC(O)CH=CHH], 4.14 [t, J = 6.7, 2 H, C(O)OCH2], 3.51 [q, J = 7.1, 6 H, 3 N(CH2CH3)3], 3.34-3.22 [m, 2 H, NCH2(CH2)10O], 1.79-1.59 [m, 4 H, NCH2CH2(CH2)7CH2CH2O], 1.48-1.15 [m, 23 H, 14 H of
NCH2CH2(CH2)7CH2CH2O + 9 H of N(CH2CH3)3]; 13C NMR (75 MHz, CDCl3): δ = 166.4, 130.5, 128.7, 64.7, 57.5, 53.5, 29.37, 29.34, 29.32, 29.15, 29.13, 28.6, 26.5, 25.9, 22.1, 8.1
Figure 3.4.1.213C NMR Spectra for Acryloyloxyundecyltriethylammonium bromide (4a): (75 MHz, CDCl3): δ = 166.4, 130.5, 128.7, 64.7, 57.5, 53.5, 29.37, 29.34, 29.32, 29.15, 29.13, 28.6, 26.5, 25.9, 22.1, 8.1

52
Figure 3.4.1.3 1H NMR Spectra for Acryloyloxydodecyltriethylammonium bromide (4b): (300 MHz, CDCl3): δ = 6.39 [distorted dd, J = 17.3, 1.5, 1 H, OC(O)CH=CHH], 6.12 [distorted dd, J = 7.4, 10.4, 1 H, OC(O)CH=CHH], 5.83 [distorted
dd, J = 10.4, 1.6, 1 H, OC(O)CH=CHH], 4.14 [t, J = 6.8, 2 H, C(O)OCH2], 3.50 [q, J = 6.9, 6 H, 3 N(CH2CH3)3], 3.34-3.22 [m, 2 H, NCH2(CH2)11O], 1.77-1.60 [m, 4 H, NCH2CH2(CH2)8CH2CH2O], 1.48-1.15 [m, 25 H, 16 H of NCH2CH2(CH2)8CH2CH2O +
9 H of N(CH2CH3)3]
Figure 3.4.1.4 13C NMR Spectra for Acryloyloxydodecyltriethylammonium bromide (4b): (75 MHz, CDCl3): δ =166.4, 130.5, 128.6, 64.7, 57.5, 53.5, 29.43, 29.38, 29.25, 29.19,29.16, 29.04, 28.6, 26.5, 25.9, 22.1, 8.1

53
Figure 3.4.1.5 1H NMR Spectra for Acryloyloxynonyltriethylammonium bromide (4c): (300 MHz, CDCl3): δ = 6.39 [distorted dd, J = 17.3, 1.5, 1 H, OC(O)CH=CHH], 6.12 (distorted dd, J = 17.3, 10.3, 1 H, OC(O)CH=CHH], 5.84 [distorted dd, J = 10.4, 2.0, 1
H, OC(O)CH=CHH], 4.14 [t, J = 6.7, 2 H, C(O)OCH2], 3.50 [q, J =7.3, 6 H, 3 N(CH2CH3)3], 3.34-3.24 [m, 2 H, NCH2(CH2)8O], 1.78-1.60 [m, 4 H, NCH2CH2(CH2)5CH2CH2O], 1.49-1.24 [m, 19 H, 10 H of NCH2CH2(CH2)5CH2CH2O + 9 H of N(CH2CH3)3]
Figure 3.4.1.6 13C NMR Spectra for Acryloyloxynonyltriethylammonium bromide (4c): (75 MHz, CDCl3): δ =166.3, 130.6, 128.6, 64.6, 57.4, 53.5, 29.2,
29.0, 28.99, 28,5, 26.4, 25.8, 22.0, 8.1

54
Figure 3.4.1.7 1H NMR Spectra for Acryloyloxyhexyltriethylammonium bromide (4d): (300 MHz, CDCl3) δ
= 6.40 [distorted dd, J = 17.3, 1.5, 1 H, OC(O)CH=CHH], 6.12 (distorted dd, J = 17.3, 10.3, 1 H, OC(O)CH=CHH], 5.85 [distorted dd, J = 10.4, 1.4, 1 H, OC(O)CH=CHH], 4.15 [t, J = 6.5, 2 H, C(O)OCH2], 3.51 [q, J = 7.3, 6 H, 3 N(CH2CH3)3],
3.40-3.28 [m, 2 H, NCH2(CH2)5O], 1.83-1.64 [m, 4 H, NCH2CH2(CH2)2CH2CH2O], 1.54-1.31 [m, 13 H, 4 H of NCH2CH2(CH2)2CH2CH2O + 9 H of N(CH2CH3)3]
Figure 3.4.1.8 13C NMR Spectra for Acryloyloxyhexyltriethylammonium bromide (4d): (75 MHz, CDCl3): δ = 166.3, 130.8, 128.4, 64.1, 57.4, 53.5, 28.4,
26.1, 25.5, 22.0, 8.1

55
Figure 3.4.1.9 1H NMR Spectra for Acryloyloxyethyltriethylammonium bromide (4e) (300 MHz, CDCl3): δ = 6.46 [distorted dd, J = 17.2, 1.2, 1 H,
OC(O)CH=CHH], 6.12 [distorted dd, J = 17.2, 10.4, 1 H, OC(O)CH=CHH], 5.96 [distorted dd, J = 10.4, 1.2, 1 H, OC(O)CH=CHH], 4.80-4.59 (m, 2 H, C(O)OCH2), 4.01-3.86 (m, 2 H, NCH2), 3.76-3.48 [m, 6 H, 3 NCH2], 1.60-1.31 [m, 9 H,
N(CH2CH3)2];
Figure 3.4.1.10 13C NMR Spectra for Acryloyloxyethyltriethylammonium bromide (4e) (75 MHz, CDCl3): δ =165.2, 132.9, 127.1, 57.7, 56.0, 54.5, 8.2

56
Figure 3.4.1.11 1H NMR Spectra for Acryloyloxypropyltriethylammonium bromide (4f) (300 MHz, CDCl3): δ = 6.25 [d dist, J = 17.1, 1 H,
OC(O)CH=CHH], 5.95 [distorted dd, J = 17.1, 10.4, 1 H, OC(O)CH=CHH], 5.73 [distorted d, J = 10.4, 1 H, OC(O)CH=CHH], 4.26-4.02 (m, 2 H, C(O)OCH2), 3.52-3.23 [m,
6 H, 3 NCH2], 3.20-2.96 (m, 2 H, NCH2), 2.24-1.95 (m, 2 H, C(O)OCH2CH2CH2N), 1.42-1.09 [m, 9 H, N(CH2CH3)3]
Figure 3.4.1.12 13C NMR Spectra for Acryloyloxypropyltriethylammonium bromide (4f) (75 MHz, CDCl3): δ =166.0, 132.0, 128.0, 61.2, 54.8, 53.9,
22.3, 8.3

57
Figure 3.4.1.13 1H NMR Spectra for 2-Dimethylamino ethanol (5e) (300 MHz,
CDCl3): δ = 3.74 (s, br, 1 H, OH), 3.56 (t, J = 5.5, 2 H, HOCH2), 2.63-2.52 [m, 6 H, 3 NCH2], 1.04 [t, J = 7.1, 6 H, N(CH2CH3)2]
Figure 3.4.1.14 13C NMR Spectra for 2-Dimethylamino ethanol (5e) (75 MHz, CDCl3): δ = 58.4, 54.4, 46.8, 11.81

58
Figure 3.4.1.15 1H NMR Spectra for 3-Diethylamino propan-1-ol (5f) (300 MHz, CDCl3): δ = 4.81 (s, br, 1 H, OH), 3.79 (t, J = 5.4, 2 H, HOCH2), 2.65 (t, J
= 5.4, 2 H, NCH2), 2.53 [q, J = 7.1, 4 H, 2 NCH2], 1.74-1.63 (m, 2 H, HOCH2CH2CH2N), 1.06 [t, J = 7.1, 6 H, N(CH2CH3)2]
Figure 3.4.1.16 13C NMR Spectra for 3-Diethylamino propan-1-ol (5f) (75 MHz, CDCl3): δ =64.6, 53.8, 46.9, 27.8, 11.6

59
Figure 3.4.1.17 1H NMR Spectra for (2-Diethylamino)ethyl acrylate (6e) (300 MHz, CDCl3): δ =6.42 [distorted dd, J = 17.3, 1.4, 1 H, OC(O)CH=CHH],
6.14 [distorted dd, J = 17.3, 10.4, 1 H, OC(O)CH=CHH], 5.90 [distorted dd, J = 10.4, 1.4, 1 H, OC(O)CH=CHH], 4.51 (t, J = 5.6, 2 H, C(O)OCH2), 3.18 (t,
J = 5.6, 2 H, NCH2), 3.02 [q, J = 7.3, 4 H, 2 NCH2], 1.04 [t, J = 14.0, 6 H, N(CH2CH3)2]
Figure 3.4.1.18 13C NMR Spectra for 3-Diethylamino propan-1-ol (6e) (75 MHz, CDCl3): δ = 165.6,
131.8, 127.8, 59.9, 49.4, 46.9, 9.5

60
Figure 3.4.1.19 1H NMR Spectra for (3-Diethylamino)propyl acrylate (6f) (300 MHz, CDCl3): δ = 6.40 [distorted dd, J = 17.3, 1.5, 1 H, OC(O)CH=CHH],
6.12 [distorted dd, J = 17.3, 10.4, 1 H, OC(O)CH=CHH], 5.83 [distorted dd, J = 10.4, 1.5, 1 H, OC(O)CH=CHH], 4.21 (t, J = 6.4, 2 H, C(O)OCH2), 2.71-2.58 [m, 6 H, 3 NCH2], 1.97-1.84 (m, 2 H, C(O)OCH2CH2CH2N), 1.09 [t, J =7.2, 6 H, N(CH2CH3)2]
Figure 3.4.1.20 13C NMR Spectra for (3-Diethylamino)propyl acrylate (6f) (75 MHz, CDCl3): δ = 166.2, 130.7, 128.4, 62.8, 49.1, 46.8, 25.7, 11.1

61
3.4.2 IR analysis
Acryloyloxyundecyltriethylammonium bromide (4a)
o IR (KBr): ν = 3432 (s, br), 2978 (w), 2929 (m), 2853 (m), 1721 (s), 1631 (w), 1477 (m), 1456
(w), 1408 (m), 1296 (m), 1204 (s), 1028 (w), 986 (m), 811 (m) cm–1;
Acryloyloxydodecyltriethylammonium bromide (4b)
o IR (KBr): ν = 3429 (s, br), 2926 (m), 2854 (m), 1721 (s), 1635 (w),1466 (w), 1408 (m), 1234 (w),
1193 (m), 1059 (w), 986 (w), 812 (w) cm–1
Acryloyloxynonyltriethylammonium bromide (4c)
o IR (KBr): ν = 3421 (s, br), 2930 (w), 2856 (s), 1719 (s), 1634 (m), 1408 (m), 1275 (m), 1197 (m), 1059
(m), 986 (w), 885 (w) cm–1
Acryloyloxyhexyltriethylammonium bromide (4d)
o IR (Film): ν = 3435 (s, br), 2947 (m), 2864 (w), 1712 (s), 1636 (m), 1488 (m), 1409 (m), 1386 (m), 1296
(m), 1207 (w), 1060 (m), 1009 (m), 772 (w) cm–1
Acryloyloxyethyltriethylammonium bromide (4e)
o IR (Film): ν = 3426 (m, br), 2980 (m), 2652 (m), 1727 (s), 1636 (m), 1510 (w), 1463 (m), 1410 (m), 1267
(s), 1190 (s), 1063 (m), 986 (m), 856 (w) cm–1
Acryloyloxypropyltriethylammonium bromide (4f)
o IR (Film): ν = 3426 (s, br), 2987 (w), 1714 (m), 1636 (m), 1488 (w), 1412 (m), 1299 (m), 1207 (m), 1065
(s), 986 (w) cm–1
2-Dimethylamino ethanol (5e)
o IR (Film): ν = 3419 (s), 2975 (w), 2850 (w), 1644 (m), 1470 (w), 1387 (w), 1197 (w),1038 (m), 623 (m)
cm–1
3-Diethylamino propan-1-ol (5f)
o IR ( Film): ν = 3380 (s, br), 2971 (s), 2876 (m), 2824 (m), 1654 (m), 1470 (m), 1384 (m), 1294 (w), 1196
(w), 1060 (m), 937 (w), 771 (w, br) cm–1
(2-Diethylamino)ethyl acrylate (6e)
o IR (film): ν = 3424 (s), 2979 (m, br), 1726 (s), 1636 (m), 1568 (w),1353 (w), 1269 (m), 1191 (m), 987 (w),
810 (w) cm–1

62
(3-Diethylamino)propyl acrylate (6f)
o IR ( Film): ν = 3424 (s, br), 2971 (m), 2799 (w), 2659 (w), 1724 (s), 1637 (s), 1473 (m), 1409 (s), 1296 (s),
1198 (s), 1061 (w), 986 (m), 819 (w) cm–1
3.4.3 Melting point evaluation
Acryloyloxyundecyltriethylammonium bromide (4a): Colorless solid, mp = 40-41°C
Acryloyloxydodecyltriethylammonium bromide (4b): Colorless solid, mp = 65-67 °C
Acryloyloxynonyltriethylammonium bromide (4c): Colorless solid, mp = 28-29 °C
Acryloyloxyhexyltriethylammonium bromide (4d): Colorless gummy low-melting solid
Acryloyloxyethyltriethylammonium bromide (4e): Yellow oil
Acryloyloxypropyltriethylammonium bromide (4f): Brown oil
2-Dimethylamino ethanol (5e): Yellowish oil
3-Diethylamino propan-1-ol (5f): Yellowish oil
(2-Diethylamino)ethyl acrylate (6e): Yellow oil
(3-Diethylamino)propyl acrylate (6f): Brown oil
3.4.4 MS analysis and TIC determination
Acryloyloxyundecyltriethylammonium bromide (4a):
o MS (ESI+, direct infusion): m/z = 326.31
o Anal. calcd for C20H39BrNO2 (405.43): C, 59.25; H, 9.70; Br, 19.71; N, 3.45; found C, 59.28; H,
9.68; Br, 19.72; N, 3.48
Acryloyloxydodecyltriethylammonium bromide (4b):
o MS (ESI+, direct infusion): 340.32
o Anal. calcd for C21H41BrNO2 (419.46): C, 60.13; H, 9.85; Br, 19.05; N, 3.34; found C, 60.15; H,
9.89; Br, 19.08; N, 3.31
Acryloyloxynonyltriethylammonium bromide (4c):
o MS (ESI+, direct infusion): 298.27
o Anal. calcd for C18H35BrNO2 (377.38): C, 57.29; H, 9.35; Br, 21.17; N, 3.71; found C, 57.32; H,
9.33; Br, 21.20; N, 3.70
Acryloyloxyhexyltriethylammonium bromide (4d):
o MS (ESI+, direct infusion): 256.23

63
o Anal. calcd for C15H30BrNO2 (336.31): C, 53.57; H, 8.99; Br, 23.76; N, 4.16; found C, 53.55; H,
8.97; Br, 23.79; N, 4.13.
Acryloyloxyethyltriethylammonium bromide (4e):
o MS (ESI+, direct infusion): 200.17
o Anal. calcd for C11H22BrNO2 (280.20): C, 47.15; H, 7.91; Br, 28.52; N, 5.00; found C, 47.17; H,
7.89; Br, 28.50; N, 5.01
Acryloyloxypropyltriethylammonium bromide (4f):
o MS (ESI+, direct infusion): 214.18
o Anal. calcd for C12H23BrNO2 (293.22): C, 49.15; H, 7.91; Br, 27.25; N, 4.78; found C, 49.13; H,
7.88; Br, 27.27; N, 4.80.
2-Dimethylamino ethanol (5e):
o GC-MS: 117 (1) [M+], 115 (11), 100 (7), 87 (7), 86 (100), 73 (7), 72 (7), 59 (5), 58 (40), 56 (4),
44 (12), 43 (8), 42 (5)
o Anal. calcd for C4H11NO (89.14): C, 53.90; H, 12.44; N, 15.71; found C, 53.93; H, 12.41; N,
15.74
3-Diethylamino propan-1-ol (5f):
o GC-MS: 131 (16) [M+], 116 (5), 87 (7), 86 (100), 72 (43), 58 (29), 56 (7), 44 (8), 42 (9)
o Anal. calcd for C7H17NO (131.22): C, 64.07; H, 13.06; N, 10.67; found C, 64.05; H, 13.03; N,
10.69
(2-Diethylamino)ethyl acrylate (6e):
o GC-MS: 171 (1) [M+], 100 (4), 99 (21), 87 (7), 86 (100), 58 (16), 56 (5), 55 (12), 44 (3), 42 (4)
o Anal. calcd for C9H17NO2 (171.24): C, 63.13; H, 10.01; N, 8.18; found C, 63.10; H, 10.02; N,
8.16.
(3-Diethylamino)propyl acrylate (6f):
o GC-MS: 185 (12) [M+], 170 (12), 113 (26), 98 (4), 87 (9), 86 (100), 85 (7), 72 (19), 58 (17), 56
(7), 55 (22), 44 (5), 42 (8), 41 (5);
o Anal. calcd for C10H19NO2 (185.26): C, 64.83; H, 10.34; N, 7.56; found C, 64.81; H, 10.32; N,
7.53.
3.5 Experimental part
3.5.1 Chemicals and apparatus
CH3CN (purity ≥99.9%) was purchased from Hypersolv and was distilled over 4Å molecular sieves which have
been previously activated. CH3Cl (purity 99.0-99.4 %) was purchased from Sigma-Aldrich and was freshly
distilled over activated 4Å sieves before use. Et2O (purity ≥ 99.9%) stabilized with BHT
( Diisobuthylhydroxytoluene, 1 ppm) as stabilizer, was purchased from Sigma-Aldrich and used without
64
further purification. EtOH ( purity 99.8 %) was purchased from Panreac and used without further purification.
Cyclohexane ( purity ≥ 99.8 %) was purchased from Panrec and used as it was.
6-Bromo-1-Hexanol (purity > 95%), 9-bromo-1-nonanol (purity > 95%), 11-bromo-1-undecanol (purity > 98%),
12-bromo-1-dodecanol (purity > 98%) and 2-bromoethanol ( purity ≥ 95 %), were purchased from TCI Europe
and used without further purification. 3-Bromo-1-propanol was purchased from Fluorochem (purity 97%) and
used as received. BHT (purity 99%) was purchase from Fluka and used as received. Acryloyl chloride (stabilized
with 400 ppm phenothiazine; purity 97%), triethylamine (purity 99%), diethylamine (purity 98%), ethyl
bromide (purity 98%), and hydroquinone (purity 99%) were purchased from Sigma–Aldrich and used as
received. NaHCO3 (purity 98–100%) was purchased from Panreac and used as received. Na2SO4 (purity
99.2%) was purchased from Analar and used without purification. Molecular sieves 4Å (pellets, 1.6 mm
diameter) were purchased from Sigma–Aldrich and activated by oven at 3008 °C for 4 h. Molecular sieves 3Å
(powder) were purchased from Alfa Aesar and activated in an oven at 3008C for 4 h.
All reactions were analyzed by TLC on silica gel 60F254 (Merck) and by GLC by using a Shimadzu GC-2010 gas
chromatograph and capillary columns with polymethylsilicone +5% phenylsilicone (HP-5) as the stationary
phase. Evaporation refers to the removal of solvent under reduced pressure. Melting points are uncorrected.
1H NMR and 13C NMR spectra were recorded at 258C with a Bruker DPX Avance 300 Spectrometer in CDCl3
solutions at 300 and 75 MHz, respectively, with Me4Si as internal standard. Chemical shifts (d) and coupling
constants (J) are given in ppm and in Hz, respectively. IR spectra were taken with a JASCO FT-IR 4200
spectrometer. Mass spectra were obtained by using a Shimadzu QP2010 GC-MS apparatus at 70 eV ionization
voltage and by electrospray ionization mass spectrometry (ESI-MS) by using an Agilent 6540 UHD accurate-
mass Q-TOF spectrometer equipped with a Dual AJS ESI source working in positive mode. N2 was employed
as the desolvation gas at 3008C and a flow rate of 8 Lmin1. The nebulizer was set to 45 psig. The Sheat gas
temperature was set at 4008C and a flow of 12 Lmin1. A potential of 3.5 kV was used on the capillary for
positive ion mode. The fragmentor was set to 175 V. MS spectra were recorded in the 150–1000 m/z range.
The HPLC system was an Agilent 1260 Infinity. A reversed-phase C18 column (ZORBAX Extended-C18 2.150
mm, 1.8 mm) with a Phenomenex C18 security guard column (4 mm x 3 mm) were used. The flow-rate was
0.4 mLmin1 and the column temperature was set to 30°C. The eluents were formic acid/water (0.1:99.9, v/v;
phase A) and formic acid/acetonitrile (0.1:99.9, v/v; phase B). The following gradient was employed: 0–10
min, linear gradient from 5% to 95% B; 10–15 min, washing and reconditioning of the column to 5% B.
Injection volume was 10 mL. The eluate was monitored through MS TIC. Microanalyses were conducted using
a Thermo-Fischer Elemental Analyzer Flash 2000.

65
3.5.2 Synthesis of Acryloyloxyalkyltriethylammonium bromides ( AATEABs) 4a-d
3.5.2.1 First step: Synthesis of bromoalkyl acrylate 3a-d by esterification of bromoalkanols
1a-d with acryloyl chloride 2
BHT ( 13.9 10-3 g, 6.3·10-5 mol, for 1a; 2.6 10-3 g, 12·10-3mol, for 1b; 3.7 g, 17·10-3 mmol, for 1c; 3.8·10-3 g,
17·10-3mol for 1d), followed by acryloyl chloride (dropwise; 1.62·10-3 L, 1.80 g, 19.9·10-3 mol, for 1a; 310·10-3
L, 344·10-3g, 3.8·10-3 mol, for 1b; 430·10-3 L, 480·10-3 g, 5.3·10-3 mol, for 1c; 450·10-3 L, 500·10-3 g, 5.5·10-3 mol,
for 1d), and activated sieves 3Å (10 g for 1a, 1.9 g for 1b, 2.7 g for 1c, 2.8 g for 1d) were added to a stirred
solution of the ω-bromoalkan-1-ol (11-bromo-1-undecanol 1a: 5.0 g, 19.9·10-3 mol; 12-bromo-1-dodecanol
1b: 1.0 g, 3.8·10-3 mol; 9-bromo-1-nonanol 1c: 1.1 g, 5.3·10-3 mol; 6-bromo-1-hexanol 1d: 1.0 g, 5.5·10-3 mol)
in anhydrous CH3CN (100·10-3 L for 1a; 19.1·10-3 L for 1b; 26.6·10-3 L for 1c; 27.7·10-3 L for 1d), which was
maintained at room temperature in a Schlenk flask. The flask was sealed, and the mixture maintained under
stirring for 24 hours at 90 °C. After cooling down, in order to remove molecular sieves the mixture was filtered
and subsequently the solvent was evaporated. The intermediate products 3a–d thus obtained were allowed
to react in the next step as such without purification.
3.5.2.2 Second step: quaternization of ω-bromoalkyl acrylate 3a-d with triethylamine
Triethylamine (3.06·10-3 L, 2.22 g, 21.9·10-3 mol, for 3a; 580·10-3 L, 423·10-3 g, 4.18·10-3 mol, for 3b; 810·10-3
L, 590·10-3 g, 5.83·10-3 mol, for 3c; 840·10-3 L, 613·10-3 g, 6.05·10-3 mol, for 3d) was added dropwise to a
solution of the intermediate ω-bromoalkyl acrylate 3 derived from the first step in anhydrous CHCl3 (9.6·10-3
L for 3a; 2.0·10-3 L for 3b; 2.6·10-3 L for 3c; 2.7·10-3 L for 3d), at room temperature in a Schlenk flask. The flask
was sealed, and the mixture stirred at 60 °C for 72 h. After cooling down, Et2O (75·10-3 L for 3a; 15·10-3 L for
3b; 20·10-3 L for 3c and 3d) was added dropwise to the solution which was maintained under stirring for 10
min. Formation of white precipitate occurs, followed by its filtration and further washing process with diethyl
ether, to give the pure acryloxyalkyltriethylammonium bromide (AATEAB):
acryloyloxyundecyltriethylammonium bromide (AUTEAB, 4a) was a colorless solid (m.p.= 40–41 °C; yield: 5.10
g, 63% based on starting 1a); acryloyloxydodecyltriethylammonium bromide (4b) was a colorless solid (m.p.=
65–67 °C; yield: 1.11 g, 70% based on starting 1b); acryloyloxynonyltriethylammonium bromide (4c) was a
colorless solid (m.p.= 25–26 °C; yield: 1.22 g, 61% based on starting 1c); acryloyloxyhexyltriethylammonium
bromide (4d) was a colorless gummy lowmelting solid (yield: 1.39 g, 751% based on starting 1d).

66
3.5.3 Synthesis of Acryloyloxyalkyltriethylammonium bromides (AATEABs) 4e
and 4f
3.5.2.1 First step: Reaction of Et2NH with ω-bromoalkanols 1e and 1f
Et2NH (4.1·10-3 L, 2.91 g, 39.8·10-3 mol for 1e; 7.4·10-3 L, 5.25 g, 71.6·10-3 mol, for 1f) was added dropwise to
a solution of 2-bromoethanol 1e (1.0 g, 8.0·10-3 mol) or 3-bromo-1-propanol 1f (2.0 g, 14.4·10-3 mol) in EtOH
(14.5·10-3 L for 1e; 26.0·10-3 L for 1f), which was maintained under nitrogen with stirring. The reaction mixture
was heated at 60 °C for 6 h. After cooling down, CH2Cl2 (30·10-3 L for 1e; 54·10-3 L for 1f) was added, and the
mixture was washed with a 5% w/w solution of NaHCO3 (310·10-3 L for 1e; 320·10-3 L for 1f) followed by water
(5·10-3 L for 1e; 10·10-3 L for 1f). The phases were separated, and the organic phase dried over Na2SO4. After
filtration and elimination of the solvent by distillation at atmospheric pressure, the products were obtained
as yellowish oils [2-(dimethylamino)ethanol 5e: 688·10-3 g, 96%; 3-(dimethylamino)propanol 5f: 1.85 g, 98%].
3.5.3.2 Second step: Synthesis of (diethylamino)alkyl acrylate 6e-f by esterification of 2-
(diethylamino)alkanols 5e-f with acryloyl chloride 2
Acryloyl chloride 2 (626·10-6 L, 697·10-3 g, 7.7·10-3mol for 5e; 1.15·10-3 L, 1.28 g, 14.1·10-3 mol for 5f) was
added dropwise to a solution of the 2-(diethylamino)alkanols [2-(diethylamino)ethanol 5e: 688·10-3 g, 7.7
·10-3 mol; 3-(diethylamino)propanol 5f: 1.85 g, 14.1·10-3 mol] in anhydrous CH3CN (7.7·10-3 L for 5e; 14.1·10-3
L for 5f) at 0 °C under nitrogen with stirring. The solution was maintained at 0 °C for 2 h and then stirred for
15 h at room temperature. The reaction mixture was then treated with a 5% w/w NaHCO3 solution (50·10-3 L
for 5e; 90·10-3 L for 5f) and finally extracted with CH2Cl2 (710·10-3 L for 5e; 720·10-3 L for 5f). After phase
separation, the organic layer was dried over Na2SO4. After filtration and elimination of the solvent by
distillation at atmospheric pressure, the products were obtained as yellowish oils [(2-diethylamino)ethyl
acrylate 6e: 750·10-3 g, 57%; (3-diethylamino)propyl acrylate 6f: 1.6 g, 61%)].
3.5.3
.3 Third step: Quaternization of (diethylamino)alkyl acrylate 6e-f with EtBr
The 2-(diethylamino)alkyl acrylate (6e: 750·10-3 g, 4.38·10-3 mol; 6f: 1.6 g, 8.64·10-3 mol) was allowed to react
with pure EtBr (2.2·10-4 L, 318·10-3 g, 2.92·10-3 mol, for 6e; 0.43·10-3 L, 628·10-3 g, 5.76·10-3 mol, for 6f) in the
presence of hydroquinone (1·10-3 g, 9.11·10-3 mol, for 6e; 2·10-3 g, 1.8·10-5 mol, for 6f) at 50 °C for 15 h. The

67
crude product was purified after several washings under stirring with cyclohexane (10 x (15·10-3 L)) followed
by drying under vacuum for 24–30 h. The products appear as tarry yellow oils
(acryloyloxyethyltriethylammonium bromide 4e: 650·10-3 g, yield 53%; acryloyloxypropyltriethylammonium
bromide 4f: 1.1 g, 43%).
3.6 Chapter conclusions
An efficient, simple and cheap approach for the synthesis of an important class of Polymerizable Quaternary
Ammonium Salts (PQAS), precisely Acryloyloxyalkyltriethylammonium bromides (AATEABs) is in here
discussed. AATEABs obtained bear variable alkyl chain and represent useful and efficient starting materials
which can be used by themselves or as polymerizable coating on commercial membranes to whom AATEABs
confer remarkable antibiofouling activity. Also, our synthetic approach can be easily applied either to lab or
large scale productions of membranes for water treatment. Optimized conditions in this procedure, allow to
work under air, avoiding harsh conditions and chromatographic purification and starting from chemicals
which are cheap and easily available on market. AATEABs 4a-d with longer alkyl chain ( C6, C9, C11, C12)
synthesis consists in two steps reaction: Esterification of commercially available ω-bromoalkan-1-ols 1a-d
with acryloyl chloride 2 in the presence of 3Å molecular sieves powder, followed by quaternization reaction
of (bromoalkyl)acrylate intermediate 3 with triethylamine. Anyhow, this synthetic strategy revealed to be not
successful for the synthesis of AATEABs 4e-f bearing shorter alkyl chain ( C2, C3 respectively) for whose
synthesis approach needed to be partially changed. Newly AATEABs 4e-f were obtained using a sequence of
three steps reaction: Reaction of bromoalkan-1-ols with diethylamine, followed by estherification with
acryloyl chloride 2 and quaternization with EtBr. In order to evaluate antimicrobial activity, AATEABs 4a-f
have been tested against Gram positive, Gram negative and yeast strains. Among AATEABs 4a-f, 4a (C11 alkyl
chain) and 4b (C12 alkyl chain) possess highest antibacterial activity against bacteria and yeast strains, except
for Pseudomonas aeruginosa. Analogous speech can be done for 4c ( C9 alkyl chain) against Saccharomyces
cervisiae and Candida albicans. AATEABs 4b and 4a resulted to be the most active derivate, especially against
Staphylococcus aureus and Streptococcus pyogenes. In particular, 4b acrivity is approximately four times
higher than 4a, with a MIC value of 64μg mL-1.Finally, we can conclude that AATEABs obtained with novel,
cheap and easily scalable approach, represent an important class of polymerizable molecules which can be
used in several fields, such as biomedical, textile or water treatment. In particular, these molecules fits well
for those applications in which an antibiofouling features are needed.

68
Chapter 3 references
1. Russel, G. M. a. A. D., Antiseptics and Disinfectants: Activity, Action, and Resistance. Clinical Microbiology Reviews 1999, 12 (1), 147-179. 2. Tischer, M.; Pradel, G.; Ohlsen, K.; Holzgrabe, U., Quaternary ammonium salts and their antimicrobial potential: targets or nonspecific interactions? ChemMedChem 2012, 7 (1), 22-31. 3. Simoncic, B.; Tomsic, B., Structures of Novel Antimicrobial Agents for Textiles - A Review. Textile Research Journal 2010, 80 (16), 1721-1737. 4. Bhowmick, S.; Mohanty, S.; Koul, V., Fabrication of transparent quaternized PVA/silver nanocomposite hydrogel and its evaluation as an antimicrobial patch for wound care systems. J Mater Sci Mater Med 2016, 27 (11), 160. 5. Morais, D. S.; Guedes, R. M.; Lopes, M. A., Antimicrobial Approaches for Textiles: From Research to Market. Materials (Basel) 2016, 9 (6). 6. Shahid-ul-Islam, S.-u.-I.; Butola, B. S.; Mohammad, F., Silver nanomaterials as future colorants and potential antimicrobial agents for natural and synthetic textile materials. Rsc Adv 2016, 6 (50), 44232-44247. 7. Yao, C.; Li, X.; Neoh, K. G.; Shi, Z.; Kang, E. T., Surface modification and antibacterial activity of electrospun polyurethane fibrous membranes with quaternary ammonium moieties. Journal of Membrane Science 2008, 320 (1-2), 259-267. 8. Yao, C.; Li, X.-s.; Neoh, K. G.; Shi, Z.-l.; Kang, E. T., Antibacterial poly(D,L-lactide) (PDLLA) fibrous membranes modified with quaternary ammonium moieties. Chinese Journal of Polymer Science 2010, 28 (4), 581-588. 9. Yagci, M. B.; Bolca, S.; Heuts, J. P. A.; Ming, W.; de With, G., Self-stratifying antimicrobial polyurethane coatings. Progress in Organic Coatings 2011, 72 (3), 305-314. 10. Siedenbiedel, F.; Tiller, J. C., Antimicrobial Polymers in Solution and on Surfaces: Overview and Functional Principles. Polymers 2012, 4 (1), 46-71. 11. Xue, Y.; Xiao, H.; Zhang, Y., Antimicrobial polymeric materials with quaternary ammonium and phosphonium salts. Int J Mol Sci 2015, 16 (2), 3626-55. 12. Santos, M. R. E.; Fonseca, A. C.; Mendonca, P. V.; Branco, R.; Serra, A. C.; Morais, P. V.; Coelho, J. F. J., Recent Developments in Antimicrobial Polymers: A Review. Materials (Basel) 2016, 9 (7). 13. Muñoz-Bonilla, A.; Cerrada, M. L.; Fernández-García, M., CHAPTER 1. Introduction to Antimicrobial Polymeric Materials. 2013, 1-21. 14. Muñoz-Bonilla, A.; Fernández-García, M., Polymeric materials with antimicrobial activity. Progress in Polymer Science 2012, 37 (2), 281-339. 15. Sherrington, D. J. a. D. C., Novel polymerizable mono- and divalent quaternary ammonium cationic surfactants: I. Synthesis, structural characterization and homopolymerization. Polymer 1996, 37 (8), 1453-1462. 16. Galiano, F.; Figoli, A.; Deowan, S. A.; Johnson, D.; Altinkaya, S. A.; Veltri, L.; De Luca, G.; Mancuso, R.; Hilal, N.; Gabriele, B.; Hoinkis, J., A step forward to a more efficient wastewater treatment by membrane surface modification via polymerizable bicontinuous microemulsion. Journal of Membrane Science 2015, 482, 103-114. 17. A. W. Bauer, W. M. M. K., J. C. Sherris and M. Turck, Antibiotic suceptibility testing by a standardized disk method. The American Journal of Clinical Pathology 1966, 45 (4).

69
Chapter 4
Novel method for the preparation of Thin Film Composite
membranes for gas separation and defects control by protective
layer coating
Chapter based on the article tiled: “ Defect control for Large-Scale Thin-Film Composite membrane and its
Bench-Scale demonstration”
(Myung Jin Yoo, Jun yeok Lee, Seung Yeon Yoo, Jee Yeon Oh, Jong Min Roh, Giuseppe Grasso, Jung Hyun Lee,
Da Hun Lee, Woong Jin Oh, Jeong-Gu Yeo, Hoon Cho, Ho Bum Park, Journal of Membrane Science 2018)
4.1 Chapter Summary
Membrane technology for gas separation, started diffusion in In late ‘70s. Mainly, research efforts have been
focused on production of suitable materials, in particular with regard to one critical point for carbon dioxide
separation processes which is represented by the trade-off between selectivity and permeability, nowadays
known as “ Robeson upper bound”.In membrane technologies and in particular in TFC membranes, material
and membrane properties are different and separate aspects, but their relation plays a fundamental role
which must be taken into account in order to understand how the membrane work and eventually change
material. Actually, among the studies made on membrane processes and different type of technologies for
different purposes, few materials and TFC membrane l for CO2/N2 separation have been successfully
commercialized since the difficult to prepare very thin selective layer, essential condition for optimal
separation because selective layer thickness affects CO2 permeance.However, another problem is represented
by defects presence, in particular for large scale production. In fact, creation of defect-free membrane is very
hard to achieve, but defects presence can alter gas transport properties.In this chapter effect of defects is
theoretically analyzed and a novel method for TFC membrane preparation which can also be applied for
large scale production is presented.

70
4.2 Introduction
Nowadays several technologies for CO2 capture from mixed gas are known, such as adsorption or absorption1-
5, loop-cycle combustion6-8, membranes9-11 or Gas hydrates and cryogenic distillation12-17. Despite the large
amount of technologies, due to low demands in terms of energy, lower cost production and their simplicity
and and performances, membrane11 are actually considered the most attractive and promising method which
is supplanting the absorption technology, widely used for more than 60 years. Although in literature there is
a large amount of studies concerning several materials and respective CO2 separation properties, they are
mainly focused on thick film membranes or single gas membranes or lab-scale membranes18-23. Indeed, when
scale-up process is needed, in addiction to thin layer, membrane design plays a key role and must be
considered. Main issues are therefore represented by the difference between lab and industrial scale
membranes, in particular for data reliability, because producing several square meter membrane is different
from making few square centimeters sample. However, ultimate challenge for membrane research is
represented by the application at industrial level, which is often neglected by academia but that is equally
important. In fact in literature, not many work concerning industrial scale application of working membranes
have been done24-25, probably because of difficulties concerning the defect control and preparation of defect-
free membranes in large scale. One of most challenging goals for CO2 separation technology is the
competitiveness with absorption methods; on this purpose, exceptional high permeance level is required and
hence thickness must be reduced avoiding defects. In 2016, Roussanly et al. investigated membrane
properties in postcombustion CO2 capture in coal-fired plants and estimated that considering Robenson upper
bound limit, selective layer thickness should be maintained under 0.1 micron, in order to be competitive with
absorbtion technology. Optimal results can be achieved iwith a thickness lower than 50 nm26, but if we
consider that lower thickness may also lead to a higher defect ratio, we understand why membrane
performances estimation is usually calculated using theoretical approaches26-28. In order to control defects
during membrane fabrication process, one way is the insertion of Polydimethylsiloxane (PDMS) gutter layer
on porous support, immediately beneath the dense selective layer: although this method has been widely
used, it is not compatible with high permeance CO2 separation systems. In fact, in 2015 Kattula et al. found
that introduction of gutter layer in Thin Film Composite membranes, might significantly reduce permeance
and selective either. They estimated that in order to prevent selectivity decrease, the relative permeability of
gutter layer to the selective layer should ben 5-10 or higher29. Permeance for PDMS gutter layer has been
measured and reported to be between 2000 and 6000 GPU, not sufficient for high permeance membranes
considering model study9, 30-34 reported. 1 GPU is 10−6 cm3(STP)/cm2 s cmHg and preparation of PDMS gutter
layer is a tricky procedure which expect a pre-soaking step followed by crosslink process. Alternatively,
71
another method consists on creation of protective layer which can help to prevent defects during membrane
fabrication and hence to avoid selectivity decrease; moreover, protective-layer method can also be applied to
large scale module fabrication. Though its use is well known in literature, protective layer effect has never
been used to study its impact on membrane performances. This chapter reports a theoretical approach
finalized to comprehend the impact of protective layer on the defect control and hence on membrane
performance. In particular, selective layer leads to a great reduction of defects amount with only slight
decrease of selectivity; coverage ratio can be controlled basing on layer thickness and this method can be
applied to both lab-scale and bench-scale CO2/N2 separation membrane module system, in which protective
layer method can find one possible application.
4.3 Results and discussion
4.3.1 TFC membrane and role of protective layer
Controlling defects during membrane preparation process, plays a fundamental role and can hardly affect
membrane performances in terms of selectivity and permeability. In fact, small number and tiny defects are
enough to compromise membrane separation process. There are several way in which defects can be
generated and different causes can lead to their formation: environmental such as micro dust and low
instrumentation accuracy, but also the preparation process, material type and structural configuration of
membrane can generate imperfections. Usually, TFC preparation approach for industrial membranes consists
in a substrate whose role is to provide mechanical strength, beneath selective layer which represents the real
“ barrer” in which separation occurs. In order to maximize efficiency, TFC membranes combine a low mass
transport resistance possessed by porous substrate with a thin selective layer, but sometimes large pore size
and highly porous substrate for reduced mass transport resistance can generate defects in selective layer, in
particular for thinnest one, because of selective layer penetration into porous matrix as reported in Figure
4.3.1.1 a

72
Figure 4.3.1.1 Representation of TFC membrane without protective layer (a), with protective layer (b), gas transport and defect-containing
membrane (c), effect of protective layer coating on defective membrane (d) and layers resistance in a TFC membrane
In industrial scale, sometimes gutter layer is used and placed between porous and selective layer, however
the best option remains the the protective layer, as meant in Figure 4.3.1.1 b. Defects can affect mass
transport in membrane process and confer a neglectable mass transport resistance and lead to a selectivity
loss, as showed in picture Figure 4.3.1.1 c. Selective layer, causes increase in mass transport resistance on one
hand, and on the other hand enhances selectivity lost because of defects, as showed in picture Figure 4.3.1.1d
4.3.2 Estimation of gas transport properties on defective TFC membranes
coated with protective layer.
Through the use of selective layer, it is possible to maintain membrane selectivity even for those membranes
containing defects: however, due to this approach a permeance loss may occur because protective layer may
also offer resistance in TFC membranes and decrease membrane permeance. It is possible to estimate
protective layer properties depending on defects ratio and material properties: a deeper investigation and
systematic study in order to comprehend how protective layer works, is therefore important. We tried to
mathematically estimate the effect and protective layer effectiveness in a TFC membrane with some defects,
using a resistance model which helped us to have one idea about transport properties. Henis and Tripodi
proposed a mathematical approach which explains the transport in TFC membranes35, used as starting point

73
for more complicated and improved models used in literature36-41. The model we used, takes into account
porosity, pore penetration, thickness and permeability of each layer. Transport areas can be divided in
different areas, as showed in Figure 4.3.1.1 e:
• Protective layer
• Selective layer
• Defective layer filled with protective layer
• Substrate
We must do also consider that:
Protective layer is homogeneous and non-porous
Selective layer is homogeneous, non porous, excluding defective areas
No pressure lost in region 3 ( region 2 and 3 have same pressure)
No pore penetration into substrate matrix
The depth of defective area in region 3 is the same as thickness of selective layer
Based on these assumptions, resistance can be expressed as:
𝑅1 = 𝑙1
𝑃1𝐴 (2)
𝑅2 = 𝑙2
𝑃2𝐴(1−𝜀) (3)
𝑅3 = 𝑙2
𝑃1𝐴𝜀 (4)
𝑅4 = 𝑙4
𝑃4𝐴 (5)
where Ri ,li , and Pi are the resistance, thickness, and permeability of each region (i ), respectively. A is the
membrane area and 𝜀 is the defect ratio. The total resistance ( RT ) and membrane permeance ( JT ) can be
expressed as:
𝑅𝑇 = 𝑅1 +1
1
𝑅2+
1
𝑅3
+ 𝑅4 (6)

74
𝐽
𝐽𝑇=
1
𝐽1+
1
𝐽2+𝐽3+
1
𝐽4 (7)
𝐽𝑇 =1
𝑙1𝑃1
+1
𝑃2(1−𝜀)𝑙2
+𝑃1𝜀𝑙2
+1
𝐽4
(8)
where Ji is the permeance of each region (i). Thus, it is possible to calculate the permeance of a defective
membrane coated by protective layer, using the protective layer thickness (l1), protective layer permeability
(P1), selective layer thickness (l2), selective layer permeability (P2), defect ratio (ε), and substrate permeance
(J4).
4.3.3 Calculation of optimized properties of protective layer, by mathematical
method.
For theoretical membrane performance calculations, we used abovementioned equations and our material in
order to elucidate the effect of protective layer on defective membrane as correlation with defect ratio. CO2
permeability of selective layer was set at 110 barrer (1 barrer = 10−10 cm3 (STP) cm/cm2 s cmHg), CO2/N2
selectivity of selecrive layer was fixed at 72.6, thickness was 90 nm and substrate permeance was fixed at
130k GPU for CO2 and 150k GPU for N2. In Figure 4.3.3.1a, differences depending on protective layer existence
as function of defect ratio are reported ( CO2 permeability: 3900 barrer, thickness: 0.1 micron): then
protective layer does not exist, we observe decrease of selectivity from a 10-4% defect ratio; in 0.01% of defect
ratio, we lost over 50 % of selectivity, but in membrane with same defect ratio, selectivity rises up to 90 % if
we use protective layer. This data indicates that selective layer is very helpful in recovering membrane
properties subsequently to defects creation. Theoretically, coverage operated by protective layer can be
enhanced when resistance of protective layer increases; as discussed before, choosing proper protective layer
material is fundamental in order to maximize separation performance, since protective layer has its own
permeability, its own selectivity and offers its own resistance to mass transport: this is summarized in Figure
4.3.3.1b-d which shows effect of overall performances based on selective layer properties.
In particular, Figure 4.3.3.1b shows that permeability is fundamental feature for a selective layer, but when
defect ratio increases, protective layer with lower permeance is preferred. Figure 4.3.3.1c shows that
membrane with 5000 barrer protective layer on a selective layer with 0.015% defect ratio maintain a
selectivity of 90 %, while 0.15 % defect ratio can be covered by 500 barrer protective layer for the same
selectivity. Figure 4.3.3.1d shows effects of protective layer selectivity on membrane overall selectivity and
indicates the importance of properly design selective layer.
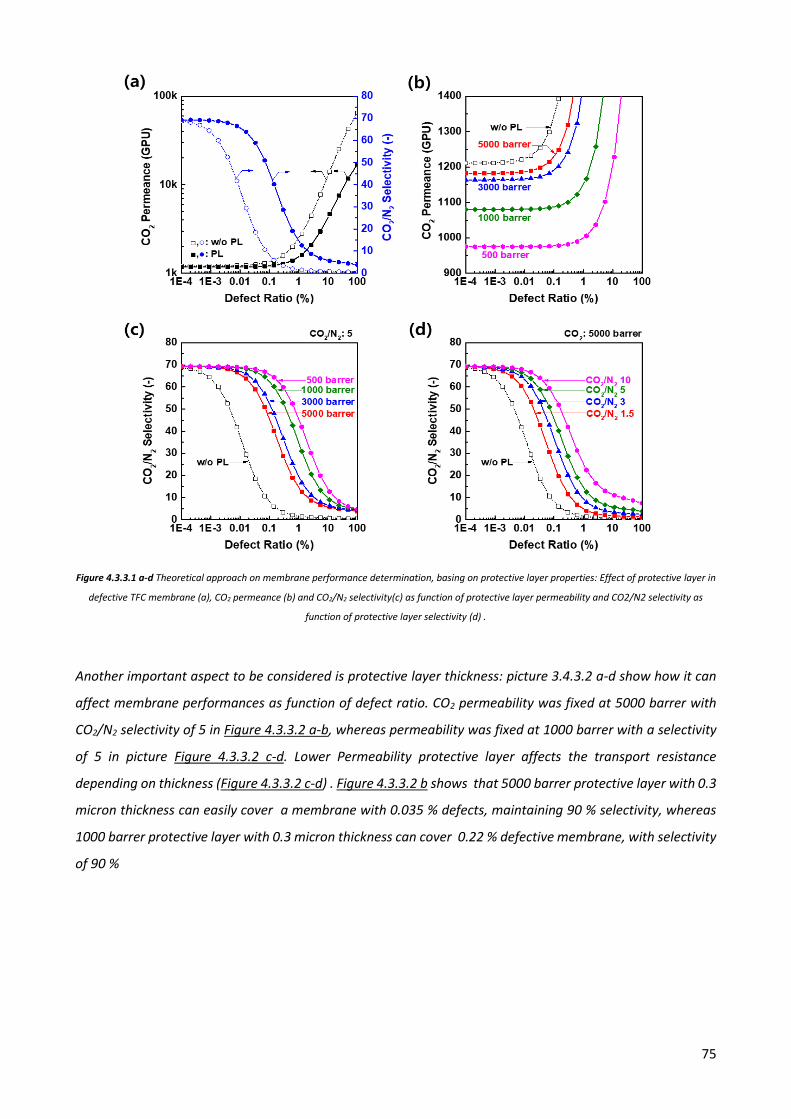
75
Figure 4.3.3.1 a-d Theoretical approach on membrane performance determination, basing on protective layer properties: Effect of protective layer in
defective TFC membrane (a), CO2 permeance (b) and CO2/N2 selectivity(c) as function of protective layer permeability and CO2/N2 selectivity as
function of protective layer selectivity (d) .
Another important aspect to be considered is protective layer thickness: picture 3.4.3.2 a-d show how it can
affect membrane performances as function of defect ratio. CO2 permeability was fixed at 5000 barrer with
CO2/N2 selectivity of 5 in Figure 4.3.3.2 a-b, whereas permeability was fixed at 1000 barrer with a selectivity
of 5 in picture Figure 4.3.3.2 c-d. Lower Permeability protective layer affects the transport resistance
depending on thickness (Figure 4.3.3.2 c-d) . Figure 4.3.3.2 b shows that 5000 barrer protective layer with 0.3
micron thickness can easily cover a membrane with 0.035 % defects, maintaining 90 % selectivity, whereas
1000 barrer protective layer with 0.3 micron thickness can cover 0.22 % defective membrane, with selectivity
of 90 %

76
Figure 4.3.3.2 a-d membrane performances depending on protective layer properties. (a,c) CO2 permeance as function of protective layer
thickness : CO2 5000 barrer (a), CO2 1000 barrer (c). CO2/N2 selectivity as function of layer thickness (b, d). CO2 5000 barrer and CO2/N2 5 (b), CO2
1000 barrer and CO2/N2 5 (d)
It clearly appears how the protective layer is deeply related to membrane performance. Protective layer
thickness and properties must thus carefully determined according to defect ratio, in order to maximize its
effectiveness and avoid performance loss.
4.3.4 Protective layer coated membranes: preparation and gas transport
measurement and bench-scale tests.
Preparation and gas transport test have been performed on produced membranes, in order to check reliability
of layer coating effectiveness on defective membranes. In Figure 4.3.4.1a-d SEM images of pristine porous

77
and coated membranes are reported. When selective layer is applied on porous substrate (a), defect
formation may occurs (b) and can easily solved by coating with protective layer (c). Cross section image (d)
show that 60 nm protective layer thickness was realized, while selective layer is only 90 nm.
Figure4.3.4.1a-d Representative SEM images of prepared membrane: coating-free pristine support (a), selective layer application and defect
formation (b), protective layer coating helps to recover membrane properties ( c) and cross section of produced membranes confirms that coating
occurs (d )
For our membranes, gas transport properties are summarized in Figure 4.3.4.2a-b. For measurement, feed
pressure was fixed to 2 bar and permeate side was exposed to ambient air. Mixed gas conditions were used
(14 mol. % of CO2 and 86 mol. % of N2), CO2 permeance was about 1200 GPU with a selectivity of 51.5 at
stage cut of 0.2%. The stage cut is fundamental in order to define gas transport properties under mixed gas
conditions: it is defined as fraction of permeate flow rate compared to the feed flow rate, due to the
polarization in concentration; mixed gas transport properties come close to pure gas transport properties as
the stage cut decreased to suppress concentration polarization. Figure 4.3.4.2 also show that CO2 permeance
level depends on stage cut ,whereas N2 remains almost unchanged; this indicates that selectivity, higher at
low stage cut, can be ascribed to higher CO2 permeance. In Figure 4.3.4.2 b a comparison between
experimental data and model calculation is reported. Dot lines represent theoretical gas transport properties
without coating layer, whereas full lines represents theoretical gas transport properties for those membranes
coated by protective layer.

78
Figure 4.3.4.2 Coated membranes gas transport properties (a), Defect ratio estimation comparing transport properties with resistance model
calculation (b)
22x34 cm membranes were also prepared using this method and used for plate-and-frame module fabrication,
in which the feed gas flows across the membranes within module and permeate gas was designed to be
divided into different parts in order to minimize pressure trop across feed and permeate side. Two membranes
are placed on each frame (one per side) whose area is around 1080 cm2, in which 2 cm of glue are applied.
Figure 4.3.4.3a-b reports the performance of a single frame membrane module as function of permeate
pressure (a) and feed flow rate (b) ; as the permeate pressure drops, CO2 purity increases because the partial
pressure gradient across membrane is increased. In our case, when permeate pressure decreases to 0.03 bar
the CO2 purity rises up to 81% with a 35% increase in CO2 recovery. We also measured gas purity and recovery
as function of feed flow rate, maintaining permeate pressure fixed at 0.2 bar (figure 3.4.4.3 b): purity was
66 % and CO2 recovery 38 % when feed flow rate was maintained at 0.2 Nm3/h; the CO2 purity was 58% with
a CO2 recovery of 60% when the feed flow rate was 0.1 Nm3/h. In bench-scale and lab scale comparision, we
observed that permeance for pure CO2 lab scale was about 1230 GPU, while for single frame module was
about 958 GPU. Furthermore, observed selectivity was 53.9 in the case of lab scale experiments and 56.4 for
single frame module; these differences can be ascribed to different selective layer thickness, ascribable to
coating device efficiency and properties.
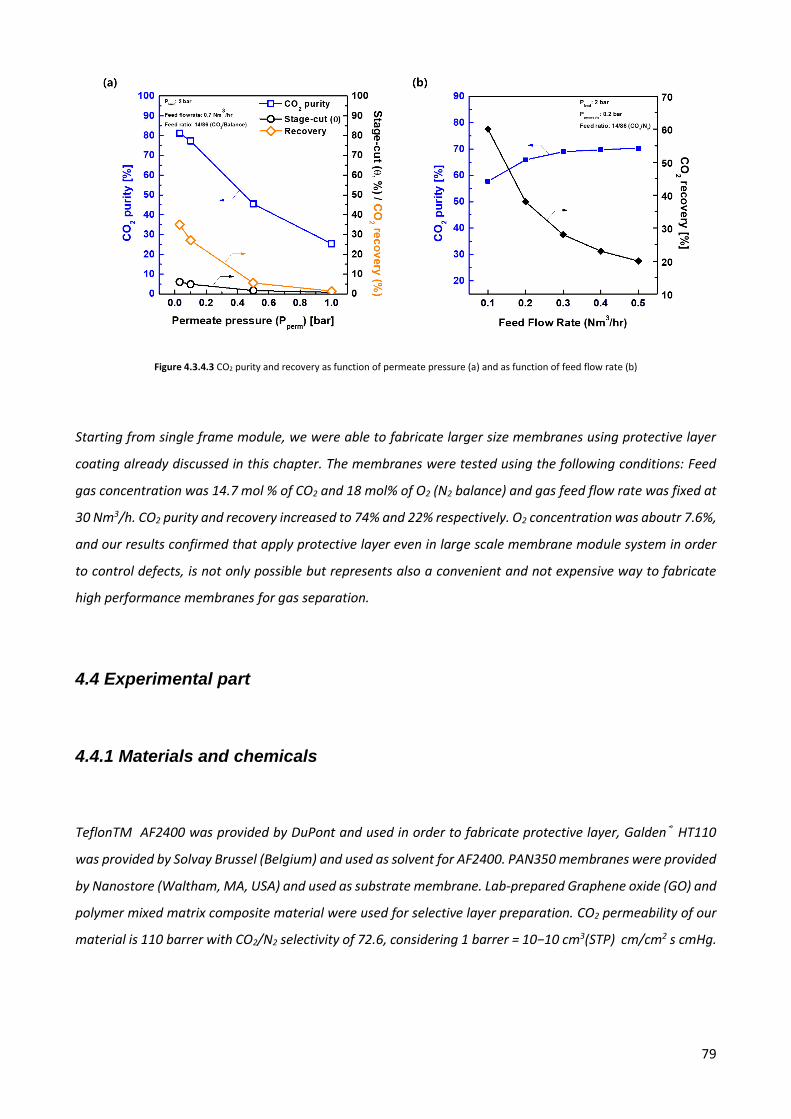
79
Figure 4.3.4.3 CO2 purity and recovery as function of permeate pressure (a) and as function of feed flow rate (b)
Starting from single frame module, we were able to fabricate larger size membranes using protective layer
coating already discussed in this chapter. The membranes were tested using the following conditions: Feed
gas concentration was 14.7 mol % of CO2 and 18 mol% of O2 (N2 balance) and gas feed flow rate was fixed at
30 Nm3/h. CO2 purity and recovery increased to 74% and 22% respectively. O2 concentration was aboutr 7.6%,
and our results confirmed that apply protective layer even in large scale membrane module system in order
to control defects, is not only possible but represents also a convenient and not expensive way to fabricate
high performance membranes for gas separation.
4.4 Experimental part
4.4.1 Materials and chemicals
TeflonTM AF2400 was provided by DuPont and used in order to fabricate protective layer, Galden® HT110
was provided by Solvay Brussel (Belgium) and used as solvent for AF2400. PAN350 membranes were provided
by Nanostore (Waltham, MA, USA) and used as substrate membrane. Lab-prepared Graphene oxide (GO) and
polymer mixed matrix composite material were used for selective layer preparation. CO2 permeability of our
material is 110 barrer with CO2/N2 selectivity of 72.6, considering 1 barrer = 10−10 cm3(STP) cm/cm2 s cmHg.

80
4.4.2 Preparation of TFC membranes and protective layer.
In the case of AF2400 protective layer, an AF2600/ HT110 solution has been prepared using 0.1 wt % of
AF2600, stirred at 80 °C for 12 hours. Subsequently solution was casted onto PAN-350 previously coated with
selective layer using automatic bar coating machine and dried in vacuum oven in order to remove residual
solvent. 7x7 cm membrane sample was prepared for lab scale test and 22x34 cm sample for large scale
application test.
4.4.3 Module system and Module fabrication
For large scale tests, plate-and-frame modules were used. Each membrane was 18x30 cm and each frame
was designed. For the lab test, module consisted of two membranes whose area was 1080 cm2 , while for
bench scale test 21 membranes for each module were used. In our experiments five membrane modules
( 56.700 cm2 area) were connected in parallel.
4.4.3 Gas transport properties measurement.
Lab scale membrane with an effective area of 6.25 cm2 was tested with an in line high pressure stainless steel
membrane holder produced by Merk Millipore ( MA, USA) using a mixed gas of 14 mol% CO2 and 86 mol %
N2 and 2 bar feed pressure. Permeate side was exposed to ambient air and transport properties were
measured at 25 °C. For lab scale experiments, membrane holder design expects countercurrent flow between
feed and permeate. Gas Transport properties were measured under different stage cuts between 0.2 and
50 % using an Agilent 7890 GC system and two agilent AMD2000 gas flowmeters. Mixed gas permeances
were calculated by following equation (1) :
𝑄𝐴 = (273.15
273.15+𝑇) . (
1
𝑝2∙𝑥2𝑎− 𝑝1∙𝑥1𝐴 ) ∙ (
𝑑𝑉
𝑑𝑇∙ 𝑥1𝐴) ∙
𝑃𝑎𝑡𝑚
76∙
1
𝐴∙ 106 (1)
where QA is the gas permeance of gas A (GPU), T is the temperature (Celsius), p1 is the permeate pressure
(atm), p2 is the feed pressure (atm), x1A is the mole fraction of gas A in the permeate stream, x2A is the mole
fraction of gas A in the feed stream, dV/dT is the volumetric displacement rate in the permeate stream (cm3/s),
Patm is the atmospheric pressure (atm) and A is the effective membrane area (cm2). No sweeping gas was used

81
in our experiments. Retentate flow was controlled by needle valvle and measured using Agilent ADM2000 gas
flowmeter. The permeate stream composition was analyzed by an Agilent 7980 GC system, while Agilent ADM
2000 universal gas flowmeter was used to measure permeate gas stream. Single-frame membrane module
was also tested using feed flow rates between 0.1 and 0.5 Nm3/h, 2 bar feed pressure and 0.2 bar permeate
pressure. On this purpose, permeate side was connected to Ulvac DTC-41 vacuum pump and its pressure
controlled by DK-Lok needle valve, placed between membrane permeate side and pump. Membrane module
was also tested using different permeate pressure, from 0.03 and 1 bar with fixed feed flow rate of 0.7 Nm3/h
and 2 bar pressure. Same composition ( 14 mol. % CO2 and 86 mol. % N2) was used for single membrane
module tests, while for bench-scale tests real combustion gas composition of 14.7 mol. % CO2, 18 mol. % O2
and balanced N2 under a feed flow rate of 30 Nm3/hr with a feed pressure of 2 bar (abs.) and a permeate
pressure of up to 0.01 bar has been used.
4.5 Chapter conclusions
Defect control is an essential issue concerning all the membranes to be used in gas separation. In this chapter,
we introduced a novel, practical and simple approach which allow us to control defect by application of
protective layer without great loss of membrane performance. Our method is also supported by mathematical
approach which can also be applied to all kind of membranes. Moreover, we demonstrated the possibility to
extend our approach to large scale membrane production as well. Membrane efficiency can greatly improved
by defect controlling using ultrathin thickness. Membrane with thin selective layer (below 100 nm) can be
prepared in large scale without significant decrease of performance, using a protective layer.Our method can
easily find application not only for CO2 capture systems but also for every other type of membrane in which
defects represent a crucial aspect.

82
Chapter 4 references
1. Bhown, A. S.; Freeman, B. C., Analysis and status of post-combustion carbon dioxide capture technologies. Environ Sci Technol 2011, 45 (20), 8624-32. 2. Plaza, M. G.; Pevida, C.; Arenillas, A.; Rubiera, F.; Pis, J. J., CO2 capture by adsorption with nitrogen enriched carbons. Fuel 2007, 86 (14), 2204-2212. 3. Chaffee, A. L.; Knowles, G. P.; Liang, Z.; Zhang, J.; Xiao, P.; Webley, P. A., CO2 capture by adsorption: Materials and process development. International Journal of Greenhouse Gas Control 2007, 1 (1), 11-18. 4. Wang, M.; Lawal, A.; Stephenson, P.; Sidders, J.; Ramshaw, C., Post-combustion CO2 capture with chemical absorption: A state-of-the-art review. Chemical Engineering Research and Design 2011, 89 (9), 1609-1624. 5. Yu, C.-H.; Huang, C.-H.; Tan, C.-S., A Review of CO2 Capture by Absorption and Adsorption. Aerosol and Air Quality Research 2012, 12 (5), 745-769. 6. Hossain, M. M.; de Lasa, H. I., Chemical-looping combustion (CLC) for inherent for CO2 separations—a review. Chem Eng Sci 2008, 63 (18), 4433-4451. 7. Anders Lyngfelt, B. L., Tobias Mattisson, A fluidized-bed combustion process with inherent CO2 separation; application of chemical-looping combustion. Chem Eng Sci 2001, 56, 3101-3113. 8. Tobias Mattisson, A. L., Paul Cho, The use of Iron oxide as an oxygen carrier in chemical-looping combustion of methane with inherent separation of CO2. Fuel 2001, 80, 1953-1962. 9. Fu, Q.; Halim, A.; Kim, J.; Scofield, J. M. P.; Gurr, P. A.; Kentish, S. E.; Qiao, G. G., Highly permeable membrane materials for CO2 capture. Journal of Materials Chemistry A 2013, 1 (44), 13769. 10. Budd, P. M.; McKeown, N. B., Highly permeable polymers for gas separation membranes. Polymer Chemistry 2010, 1 (1), 63. 11. Brunetti, A.; Scura, F.; Barbieri, G.; Drioli, E., Membrane technologies for CO2 separation. Journal of Membrane Science 2010, 359 (1-2), 115-125. 12. Linga, P.; Kumar, R.; Englezos, P., The clathrate hydrate process for post and pre-combustion capture of carbon dioxide. J Hazard Mater 2007, 149 (3), 625-9. 13. Duc, N. H.; Chauvy, F.; Herri, J.-M., CO2 capture by hydrate crystallization – A potential solution for gas emission of steelmaking industry. Energ Convers Manage 2007, 48 (4), 1313-1322. 14. Ricaurte, M.; Dicharry, C.; Renaud, X.; Torré, J.-P., Combination of surfactants and organic compounds for boosting CO2 separation from natural gas by clathrate hydrate formation. Fuel 2014, 122, 206-217. 15. Tuinier, M. J.; van Sint Annaland, M.; Kramer, G. J.; Kuipers, J. A. M., CryogenicCO2 capture using dynamically operated packed beds. Chem Eng Sci 2010, 65 (1), 114-119. 16. Xu, G.; Liang, F.; Yang, Y.; Hu, Y.; Zhang, K.; Liu, W., An Improved CO2 Separation and Purification System Based on Cryogenic Separation and Distillation Theory. Energies 2014, 7 (5), 3484-3502. 17. Russell L. McGalliard, W. L., Hazel Crest METHOD FOR CRYOGENIC SEPARATION OF CARBON OOXDE FROM HYDROCARBONS. 1980. 18. Zhu, X.; Hua, Y.; Tian, C.; Abney, C. W.; Zhang, P.; Jin, T.; Liu, G.; Browning, K. L.; Sacci, R. L.; Veith, G. M.; Zhou, H. C.; Jin, W.; Dai, S., Accelerating Membrane-based CO2 Separation by Soluble Nanoporous Polymer Networks Produced by Mechanochemical Oxidative Coupling. Angew Chem Int Ed Engl 2018, 57 (11), 2816-2821. 19. Sanders, D. F.; Smith, Z. P.; Guo, R.; Robeson, L. M.; McGrath, J. E.; Paul, D. R.; Freeman, B. D., Energy-efficient polymeric gas separation membranes for a sustainable future: A review. Polymer 2013, 54 (18), 4729-4761. 20. Moghadam, F.; Kamio, E.; Matsuyama, H., High CO 2 separation performance of amino acid ionic liquid-based double network ion gel membranes in low CO 2 concentration gas mixtures under humid conditions. Journal of Membrane Science 2017, 525, 290-297. 21. Car, A.; Stropnik, C.; Yave, W.; Peinemann, K.-V., Pebax®/polyethylene glycol blend thin film composite membranes for CO2 separation: Performance with mixed gases. Separation and Purification Technology 2008, 62 (1), 110-117.
83
22. Vinoba, M.; Bhagiyalakshmi, M.; Alqaheem, Y.; Alomair, A. A.; Pérez, A.; Rana, M. S., Recent progress of fillers in mixed matrix membranes for CO 2 separation: A review. Separation and Purification Technology 2017, 188, 431-450. 23. Tomé, L. C.; Gouveia, A. S. L.; Ab Ranii, M. A.; Lickiss, P. D.; Welton, T.; Marrucho, I. M., Study on Gas Permeation and CO2 Separation through Ionic Liquid-Based Membranes with Siloxane-Functionalized Cations. Industrial & Engineering Chemistry Research 2017, 56 (8), 2229-2239. 24. Hägg, M. B.; Lindbråthen, A.; He, X.; Nodeland, S. G.; Cantero, T., Pilot Demonstration-reporting on CO2 Capture from a Cement Plant Using Hollow Fiber Process. Energy Procedia 2017, 114, 6150-6165. 25. Merkel, T. C.; Wei, X.; He, Z.; White, L. S.; Wijmans, J. G.; Baker, R. W., Selective Exhaust Gas Recycle with Membranes for CO2 Capture from Natural Gas Combined Cycle Power Plants. Industrial & Engineering Chemistry Research 2012, 52 (3), 1150-1159. 26. Roussanaly, S.; Anantharaman, R.; Lindqvist, K.; Zhai, H.; Rubin, E., Membrane properties required for post-combustion CO 2 capture at coal-fired power plants. Journal of Membrane Science 2016, 511, 250-264. 27. Merkel, T. C.; Lin, H.; Wei, X.; Baker, R., Power plant post-combustion carbon dioxide capture: An opportunity for membranes. Journal of Membrane Science 2010, 359 (1-2), 126-139. 28. Wang, Y.; Zhao, L.; Otto, A.; Robinius, M.; Stolten, D., A Review of Post-combustion CO2 Capture Technologies from Coal-fired Power Plants. Energy Procedia 2017, 114, 650-665. 29. Kattula, M.; Ponnuru, K.; Zhu, L.; Jia, W.; Lin, H.; Furlani, E. P., Designing ultrathin film composite membranes: the impact of a gutter layer. Sci Rep 2015, 5, 15016. 30. Fu, Q.; Wong, E. H. H.; Kim, J.; Scofield, J. M. P.; Gurr, P. A.; Kentish, S. E.; Qiao, G. G., The effect of soft nanoparticles morphologies on thin film composite membrane performance. J. Mater. Chem. A 2014, 2 (42), 17751-17756. 31. Li, P.; Chen, H. Z.; Chung, T.-S., The effects of substrate characteristics and pre-wetting agents on PAN–PDMS composite hollow fiber membranes for CO2/N2 and O2/N2 separation. Journal of Membrane Science 2013, 434, 18-25. 32. Li, P.; Wang, Z.; Li, W.; Liu, Y.; Wang, J.; Wang, S., High-performance multilayer composite membranes with mussel-inspired polydopamine as a versatile molecular bridge for CO2 separation. ACS Appl Mater Interfaces 2015, 7 (28), 15481-93. 33. Halim, A.; Fu, Q.; Yong, Q.; Gurr, P. A.; Kentish, S. E.; Qiao, G. G., Soft polymeric nanoparticle additives for next generation gas separation membranes. Journal of Materials Chemistry A 2014, 2 (14), 4999. 34. Liang, C. Z.; Chung, T. S., Ultrahigh Flux Composite Hollow Fiber Membrane via Highly Crosslinked PDMS for Recovery of Hydrocarbons: Propane and Propene. Macromol Rapid Commun 2018, 39 (5). 35. TRIPODI, J. M. S. H. a. M. K., COMPOSITE HOLLOW FIBER MEMBRANES FOR GAS SEPARATION: THE RESISTANCE MODEL APPROACH. Journal of Membrane Science 1981, 8, 233-246. 36. K. Kimmerle, T. H. a. H. S., Analysis of gas permeation through composite membranes. Journal of Membrane Science 1991, 61, 1-17. 37. S.K. Karode, S. S. K., Analysis of transport through thin film composite membranes using an improved Wheatstone bridge resistance model. Journal of Membrane Science 1997, 127, 131-140. 38. I. PINNAU, J. G. W., I. BLUME, T. KURODA and K.-V. PEINEMANN, GAS PERMEATION THROUGH COMPOSITE MEMBRANES. Journal of Membrane Science 1988, 37, 81-88. 39. S.K. Karode, V. S. P., S.S. Kulkarni, An improved model incorporating constriction resistance in transport through thin film composite membranes. Journal of Membrane Science 1996, 114, 157-170. 40. Gaohong He, X. H., Renxian Xu, Baolin Zhu, An improved resistance model for gas permeation in composite membranes. Journal of Membrane Science 1996, 118, 1-7. 41. Ashworth, A. J., Relation between gas permselectivity and permeability in a bilayer composite membrane. Journal of Membrane Science 1992, 71, 169-173.

84
General Conclusions and future perspectives
In the last decade, enhancement in life standards, growth of population especially in highly industrialized
areas, lowering resources amount new needs and demands require to be fulfilled, mostly about those
aspects concerning mankind fundamental needs such as water purification, environmental caring or food
industry. Membrane technology represents one of election ways to carry those expectations out because of
its outstanding features, raised up since their first introduction into the world market in the last century, in
which synthetic polymers demonstrated their capability and great potential. In this stack, material tailoring
probably represents one of most appealing and fascinating issue owing great potential in terms of material
design. The creation of materials which perfectly fit to specific needs can be done in several ways; one of
most promising is represented by the use of coating, main theme in this thesis work : the coating offers
several customization chances overcoming one big problem which often occurs, represented by the loss of
original properties. In chapters 2,3,4 three different application on that purpose are reported:
Chapter 2
In chapter 2 the creation of PVDF-graphene Thin Film Composite membrane has been realized by
coating hydrophobic polymer with graphene layer. In order to enhance adhesion between polymer
and graphene, first step was to functionalize the polymer by chemical treatment, using a synthetic
approach consisting into two phases: Basic treatment which introduces polymerizable double bonds
onto polymer chain, followed by radical co-polymerization with suitable monomer containing
aromatic ring and polymerizable bond either, in order to ease the adhesion between the polymer and
graphene layer. On functionalized polymer, powder and membranes either, spectroscopic and
morphological analysis were performed in order to investigate composition and properties, before
association with graphene. All the analysis confirmed that:
o Co-polymerization occurs and polymer was functionalized
o The average pore size is in the range of microfiltration
Graphene was synthetized using Chemical Vapor Deposition (CVD) method, a technique in which a
metal (usually Cu or Ni) in the presence of hydrocarbon like methane or ethylene, at high
temperatures (above 1000 °C) catalyzes the break of C-H bonds and formation of C-C bonds. In order
to estimate graphene defects and eventually check multilayer areas, samples have been analyzed
using optical microscope before the PVDF-f-GM creation. Composite membrane fabrication was

85
achieved by coating with freshly synthetized graphene layer using laminating machine, followed by
catalyst removal process using suitable iron salts solutions. All membranes were prepared without
using additives or pore forming agents such as PEG, PVP, LiCl and tested. Results showed that if no
pore forming agents are used, membranes prepared using pristine PVDF possess low pore size and
therefore can’t work properly in DCMD operation in which MF-range pore size is required. On the
other hand, functionalization leads to formation of membranes with correct pore size which fit well
for MD processes. Three different membranes were tested: pristine PVDF, PVDF-f which has good
water flux and high salt rejection ( up to 99.9) and PVDF-f-GM in which the presence of graphene
causes decrement in water flux but better rejection and better durability.
Chapter 3
In Chapter 3 is reported an efficient and practical approach for the synthesis of a particular
polymerizable surfactant class with high antimicrobial and antifouling activity: AATEABs, a class of
molecule formed by three main parts: polymerizable part, alkyl chain called “linker” (with variable
length) and final ammonium salt part which confers the antibacterial activity as know in literature.
Our synthetic approach expects 2 step process: esterification reaction between bromo-alcohol and
acryloyl chloride, followed by quaternization reaction with triethylamine which leads to formation of
AATEABs with chain length of C6, C9, C11 and C12. Since the biological activity can change depending
on alkyl chain length, the synthetic approach was extended to other AATEABs bearing C2 and C3 alkyl
chain length, using a reaction scheme which was partially revised, consisting in three steps: reaction
of bromoalkanols with Et2NH, followed by esterification with acryloyl chloride and finally
quaternization with EtBr. In a second moment, we focused our attention on process optimization,
which allows to fabricate AATEABs avoiding the use of prohibitive conditions, working under air and
starting from cheap and easily available chemicals. Furthermore, AATEABs were obtained with high
degree of purity and yield. AATEABs biological activity was tested against Gram+/- and yeast-strains
and resulted to be particularly high for AATEABs bearing C11 (AUTEAB) and C12 (ADTEAB) chain
length. AATEABs resulted therefore to be promising candidates as polymerizable coating materials
for commercial membranes, which can be used whenever antifouling properties are needed. The
proposed synthetic approach is simple and efficient and can easily be applied to large scale operations
as well.
Chapter 4
In chapter 4, our attention was focused on the creation and of TFC membranes and the possibility to
86
control their defects by coating, to be used for CO2/N2 separation. It is well known that one common
problem to commercialize functional and efficient CO2/N2 separation membrane, is related to presence
of defect which can increase as long as coating thickness decreases. However thin selective layer is
fundamental in order to get best separation performance since thin selective layer means higher CO2
permeance. In this work we analyzed the relation between number of defects and transportation
properties and introduce a novel method which permits preparation of TFC membrane for gas
separation with low amount of defects, very important in order to achieve optimal gas separation. This
can be reached by protective layer whose thickness plays a primary role in process effectiveness and
that can be demonstrated by mathematical approach. It is confirmed that thinner selective layer greatly
enhances separation performances for every kind of membrane.The method discussed in chapter 4, was
applied to creation of membrane modules tested in a pilot test facility and resulted to be really effective
in the case of extremely thin coating, even under 100 nm.
Indeed, due membrane excellent and outstanding properties and new outcoming materials, membrane
technology-based operations, from their inception to last years. are becoming one of most dominant
technologies used either for single operation like fruit juice or water treatment, up to the advanced ones like
gasses storage and their separation for space technology. Yet, one of most advanced although partially
unexplored use of membranes is represented by their association to nanomaterials (NMs). In fact, though
novel NMs are everyday freshly created, a lot of knowledges and investigations are still needed in order to
achieve the best interaction between plastics and nanomaterials, one problems which sometimes represent
a limitation on their application. Therefore, the potential of NMs nowadays probably represents one of most
appealing topic of study and research which needs to be developed more.