Embed Size (px)
Citation preview

Chapter 9
Opportunity Areasfor Innovation
Inno
© 2
Chapter Contents
China 161
Challenges China Faces 161
vation, E
015 Elsevi
A Large and Widening Gap
Between the Rich and
the Poor 161
Aging Population 163
Urbanization 163
Pressures to Transform the
Manufacturing Sector 164
ntrepreneurship, and the Economy in the US, Ch
er Inc. All rights reserved.
Energy Problem 165
Environmental Pollution 166
Addressing Unmet Needs
in China 166
India 171
Addressing Unmet Needs 173
The United States 174
References 179
Most discussions on innovation around the world have focused on improving
efficiency and productivity in business in order to stay ahead of competition.
However, there are a large number societal problems that need to be addressed
through innovation, such as a large and widening gap between the rich and the
poor; population growth, aging population, and associated healthcare needs;
energy, water, and housing shortages; global climate changes; air and water pol-
lution; and illiteracy and the need for improving the quality of education.
Promotion of innovation, beyond what occurs naturally anyway, therefore,
needs to be driven by these major problems that a nation faces and needs to be
built upon resources and capabilities specifically available in the country, tak-
ing into account their level of development and maturity. This chapter discusses
various difficulties unique to the local contexts of China, India, and the United
States and reviews the approaches being taken to address these problems.
CHINA
Challenges China Faces
A Large and Widening Gap Between the Rich and the Poor
China’s GDP, as discussed earlier, is now the second largest in the world, sec-
ond only to that of the United States. But China’s GDP per capita is just about
ina, and India
161

162 PART I Innovation
$6000 in 2012, ranking 84th in the world (China Economic Net, 2013). China,
therefore, is still a low-income country. More seriously, China has big inequal-
ities between eastern and western China and between urban and rural areas
(China Economic Net, 2013). Although incomes have greatly increased since
China “opened up” to the West, the income gap between the developed regions,
mainly in the east, and undeveloped regions, mainly in the west, continues to
widen. For example, by the end of 2005, per capita annual disposable income
of urban residents in Shanghai reached ¥18,645, while the per capita annual dis-
posable income of urban residence in Xinjiang in the west was only ¥7990. So,
the income of an urban residence in eastern China was about 2.3 times that of
their counterparts in western China. In the same time frame, per capita net
income of rural residents near Shanghai was ¥8248, while the per capita net
income of rural residents in Guizhou in western China was only ¥1877, a ratio
of about 4.4.
Furthermore, the income gap between the urban and the rural areas is grow-
ing. In 1978, the ratio of income between urban and rural areas was about 2.4,
and it increased to 3.2 in 2005 and to 3.3 in 2006 (“The Rural Economy in
2007,” Social Sciences Academic Press). These ratios are almost twice that
of those in most countries, which is around 1.5, according to the World Bank
(Ping, 2007).
China’s income inequality is a fairly very serious issue. According to the UN
Human Development Report in 2004, the Gini coefficient, which measures sta-
tistical dispersion in income distribution, reached 0.45–0.53 in China. This was
significantly higher than the Gini coefficients in most developed nations, such
as the United States, France, Japan, Britain, Germany, and South Korea, where
it ranges between 0.3 and 0.4, which is considered to be a reasonable range.
China exceeded that warning line. At the same time, China has a large number
of poor people. In 2011, the Chinese government, in its efforts to alleviate pov-
erty, decided to use the 2010 per capita rural net income of ¥2300 as the new
national standard for defining the poverty line. This was a 92% improvement
over the definition of poverty in 2009, which was ¥1196. According to this
new 2011 standard, China’s rural population considered to be in poverty
increased from about 126.9 M to 128 M, accounting for roughly 13.4% of
the rural population (Chinanews.com, 2012). Based on 2005 purchasing power
parity (PPP), this new Chinese standard for defining poverty is $1.8 per capita
per day, which is close to the median of low- and middle-income countries
(Dr. Chen Shaohua, World Bank Development Economic Research Department,
Chinese Economic Net, 2013). If one were to use this definition of the poverty
line, as opposed to the 2011 Chinese government standard, then there are about
254 M Chinese people in poverty, instead of the 128 M claimed by the Chinese
government (Chinanews.com, 2011). Historically, in most countries across the
globe, large income disparities coupled with large populations in poverty have
been a source of social unrest and political instability and upheaval.

Opportunity Areas for Innovation Chapter 9 163
Aging Population
In the twenty-first century, a large number of countries will be facing the chal-
lenges of an aging population, and China undoubtedly is one of them, as shown
in Table 9.1. In 2008, the number of people of age 60 or over in China was about
160 M, accounting for 12% of the total population, getting up to 14.3% in 2012,
and exceeding 200 M in 2013. It is estimated that this number will be more than
400,000 M by 2034 (China Securities Journal, 2013). China’s aging population
of 60 and over also contributed to a very large percentage of the aging popula-
tion in the world, at 21.7%, and of Asia, at 40.1% (Ping, 2013).
Urbanization
After 1990, China began to accelerate its rate of urbanization. This rate, which
from 1953 to 1990 had been only 7%, increased in the following 20 years, from
1990 to 2010, to 23% (Table 9.2). In spite of this rapid increase in urbanization,
this rate in China was slower than that of most countries in the world. For
example, as shown in Table 9.3, in 2008, China’s urbanization rate was
45.7%, which was lower than that of all countries except India, and was about
half of that of the United Kingdom.
TABLE 9.1 China’s Aging Population (2008–2012)
2008 2009 2010 2011 2012
Old ages 60 or over 60(million)
159.89 167.14 177.65 184.99 193.90
Percentage to totalpopulation (%)
12.0 12.5 13.3 13.7 14.3
Sources: Chinese Civil Affairs Statistics Yearbook 2013.
TABLE 9.2 Rate of Urbanization in China
1953 1964 1982 1990 2000 2005a 2008a 2010
Rate ofurbanization(%)
13.26 18.30 20.91 26.44 36.22 42.99 45.68 49.68
aChina Development Report 2009.Sources: Six National Population Census.

TABLE 9.3 Rate of Urbanization in Main Countries in the World
1970 1980 1990 2000 2008
World 36.0 39.1 43.0 46.7 49.9
Developed countries
The United States 73.6 73.7 75.3 – 81.7
Japan 53.2 59.6 63.1 65.2 66.5
The United Kingdom – 87.9 88.7 89.4 89.9
Germany 72.3 72.8 73.1 73.1 73.6
BRIC
China – 19.4 26.4 36.2 45.7
Russia 62.5 69.8 73.4 73.4 72.8
India 19.8 23.1 25.5 27.7 29.5
Brazil 55.8 67.4 74.8 81.2 85.6
Others
South Korea 40.7 56.7 73.8 79.6 81.5
Malaysia 33.5 42.0 49.8 62.0 70.4
Mexico 59.0 66.3 71.4 74.7 77.2
Sources: China Finance Yearbook 2010.
164 PART I Innovation
Pressures to Transform the Manufacturing Sector
In recent years, the labels of “Made in China” have been seen all around the
world, giving a strong indication of the rapid rise of the manufacturing sector
in China. In 2008, Chinese manufacturing exports reached $1.37 T, accountingfor 11.3% of worldwide manufacturing exports, and ranked number one among
all countries. In 2010, China’s manufacturing output was about $1.955 T, whichrepresented 19.8% of global manufacturing output, and exceeded the US
manufacturing share, of 19.4%.
According to the United Nations Industrial Development Organization,
from 2000 to 2005, the average annual value added by China’s manufacturing
industry was 10.74%, which is not only higher than the average world growth
rate of manufacturing (3.38%) but also higher than the growth rate of
manufacturing in developing countries (6.74%). Although the ratio of China’s
value-added through manufacturing compared to that from the rest of the world
gradually increased, Chinese manufacturing value-added per capita was very

Opportunity Areas for Innovation Chapter 9 165
low. Based on year 2000 constant price, Chinese manufacturing value-added
per capita was $303, which is only 32% of the world average level. In 2005,
Chinese manufacturing value per capita reached $480, accounting for 46%
of the world average level, and in 2010, it was $820 and at 78% of the world
average level. Compared to developed countries, China’s value-added
per capita fell behind greatly. In 2010, it was only 14.8% of that of the United
States ($5522), 17.6% of Germany ($4667), and 10% of Japan ($7994;Wenke, 2013).
In addition, Chinese manufacturing industry had less competition compared
to that in other countries. For example, in 2009, China’s R&D accounted for
1.52% of GDP, whereas the average level for OECD members was 2.29%.
The contribution rate of science and technology to GDP in China was
20–30% lower than that in developed countries, and the rate for commerciali-
zation advancements in science and technology was 50–60% lower than that
in developed countries (China Economic Information Net, 2010). Among the
top 500 enterprises in the manufacturing sector in the world, the United States
had a share of 45.6%, which accounted for 49% of the total market value, while
China’s share (including Hong Kong) was only 1.2%, accounting for only 0.7%
of value (Yulun, 2010).
Energy Problem
Rapid economic development in China has been accompanied by greatly
increased energy consumption. The structure of energy consumption from energy
produced in various forms—coal, crude oil, natural gas, and hydropower—from
1980 to 2011 is shown in Fig. 9.1. In 1980, energy consumption was 6.03 hundred
million tons of standard coal equivalent (SCE) and increased almost 5� to 3.48 B
tons of SCE in 2011. With regard to the consumption structure, consumption per-
centage of coal fluctuated around 70%; for crude oil, it ranged from 17% to 21%;
and for natural gas and hydropower in 2011, it was 5% and 8%, respectively.
From these data, it is clear that growth in China is heavily dependent on energy
produced from coal. In spite of the huge energy consumption in China, energy
efficiency was much lower than that in the United States. Energy efficiency in
China was 0.86 in 2000 and by 2008 increased 74% to 1.5, compared to the
energy efficiency in the United States of 4.21 in 2008, which was about 2.8�that of China (Table 9.4).
Also, newer sources of energy developed relatively slowly in China and con-
tributed only a small percentage to the overall energy usage. As shown in
Table 9.5, the lowest contribution of new energy in China was 7.2% in 2000
and the highest was 9% in 2007, showing that there is no serious pursuit of
newer energy in China. In comparison, that percentage in the US new energy
was 21.41% in 2008, 2� that of China.

Total energy consumption coal Crude oil natural gas hydro-power
Year
10,0
00 to
ns o
f SC
E
00
10
20
30
40
%
50
60
70
80
90
50,000
100,000
150,000
200,000
250,000
300,000
350,000
400,000
1980
1985
1990
1995
2000
2001
2002
2003
2004
2005
2006
2007
2008
2009
2010 20
11
FIGURE 9.1 China’s energy consumption and its structure (1980–2011).
166 PART I Innovation
Environmental Pollution
In recent years, China has faced increasingly serious environmental pollution.
For example, in the winter of 2013, most cities in China often had very severe
smog. In terms of the particulate matter index, PM-2.5, for the air in Harbin, for
more than half of winter 2013, this index exceeded 200 μg/m3; for one-third of
the winter, it was in the range of 100–200 μg/m3; and the index was under
100 μg/m3 for only a few days. Air quality in the major cities of China is shown
in Table 9.6. The worst offending city was Lanzhou with its PM-10 index of
138 μg/m3. The city with the best index was Lhasa, Tibet, with its PM-10 index
of 40 μg/m3. Of the 31 cities listed, in 10 cities, PM-10 indices are at or exceed
100 μg/m3, and only 8 cities have this index below 80 μg/m3.
By comparison, air quality in the United States is shown in Table 9.7, where
particulates (PM-10) had a tendency to gradually decrease from 86.5 μg/m3 in
2001 to 68.5 μg/m3 in 2007. By contrast, in 2011, only three cities in China
(Lhasa, Kunming, and Haikou) were able to achieve the PM-10 standard
attained in the United States in 2007.
Addressing Unmet Needs in China
Given the above challenges faced by China, there are many unmet needs that
must be addressed:
First, domestic consumption in China will keep increasing. This will be
driven by income inequality, aging population, and increasing basic needs, such

TABLE 9.4 Output Value of Consumed Energy
Year
GDP in
China
(billion
yuan)
GDP in the
United States
(billion dollar)
Chinese Energy
Consumption
(10 K tons of SCE)
US Energy
Consumption
(Btu�1015)
Chinese Energy
Efficiency
($/kg SCE)
US Energy
Efficiency
($/kg SCE)
2000 9921.46 9817 138,553 98.98 0.86 2.9
2001 10,965.52 – 143,199 96.33 0.93 0
2002 12,033.27 10,470 151,797 97.86 0.96 3.13
2003 13,582.28 10,961 174,990 98.21 0.94 3.27
2004 15,987.83 11,686 203,227 100.35 0.95 3.41
2005 18,321.74 12,422 224,682 100.48 1 3.62
2006 21,192.35 13,178 246,270 99.88 1.08 3.86
2007 25,630.56 13,808 265,583 101.55 1.28 3.98
2008 30,067 14,265 285,000 99.3 1.5 4.21
Sources: Using data from China Statistics Yearbook 2009, China Energy Yearbook 2009, and US Statistical Abstract 2010 and foreign exchange rate from 2000 to 2008published by the People’s Bank of China.
Opportu
nity
Areas
forInnovatio
nChapter
9167

TABLE 9.5 New Energy Percentages in the United States and China
Year China
The United States
New EnergyPercentage
Ratio of Renewable Energy to NewEnergy
2000 7.2 19.75 44.33
2001 8.2 18.57 39.85
2002 8.1 19.79 42.02
2003 7.3 20.03 43.71
2004 7.7 20.56 43.19
2005 7.9 20.92 43.99
2006 8.2 21.21 45.52
2007 9 21.34 44.56
2008 7.2 21.41 46.39
Sources: Zhijie Gao, Yukun Cao, 2012. Analysis of the Potential Development of Biomass EnergyIndustry in Heilongjiang Province under Carbon Economy. China Forestry Press, February, pp. 62–63.
TABLE 9.6 Ambient Air Quality in Major Cities in mg/m3 (2011)
City
Particulate
Matters (PM-10) Sulfur Dioxide Nitrogen Dioxide
Beijing 0.113 0.028 0.056
Tianjin 0.093 0.042 0.038
Shijiazhuang 0.099 0.052 0.041
Taiyuan 0.084 0.064 0.023
Hohhot 0.076 0.054 0.039
Shenyang 0.096 0.059 0.033
Changchun 0.091 0.026 0.043
Harbin 0.099 0.041 0.046
Shanghai 0.080 0.029 0.051
Nanjing 0.097 0.034 0.049
Hangzhou 0.093 0.039 0.058
Continued
168 PART I Innovation

TABLE 9.6 Ambient Air Quality in Major Cities in mg/m3 (2011)—Cont’d
City
Particulate
Matters (PM-10) Sulfur Dioxide Nitrogen Dioxide
Hefei 0.113 0.022 0.025
Fuzhou 0.069 0.009 0.032
Nanchang 0.088 0.056 0.038
Jinan 0.104 0.051 0.036
Zhengzhou 0.103 0.051 0.047
Wuhan 0.100 0.039 0.056
Changsha 0.083 0.040 0.047
Guangzhou 0.069 0.028 0.049
Nanning 0.073 0.026 0.033
Haikou 0.041 0.008 0.016
Chongqing 0.093 0.038 0.031
Chengdu 0.100 0.031 0.051
Guiyang 0.079 0.049 0.030
Kunming 0.065 0.037 0.044
Lhasa 0.040 0.009 0.023
Xi’an 0.118 0.042 0.041
Lanzhou 0.138 0.048 0.042
Xining 0.105 0.043 0.026
Yinchuan 0.095 0.038 0.030
Urumqi 0.132 0.079 0.068
Sources: China Statistics Yearbook 2012.
Opportunity Areas for Innovation Chapter 9 169
as food, daily supplies, education, medical services and facilities, community
care, and in-home services for the elderly. Innovation will, therefore, be neces-
sary in order to lower cost or to provide better products and services. For
example, online shopping has already grown very rapidly in China. Taobao,
the biggest platform for online shopping, is an example of one such company,
whose online transactions broke the ¥35 B barrier on November 11, 2013,
although its volume was only ¥19.1 B in 2012 (http://net.chinabyte.com/494/
12772494.shtml). This will provide a big boost to innovation in the Internet
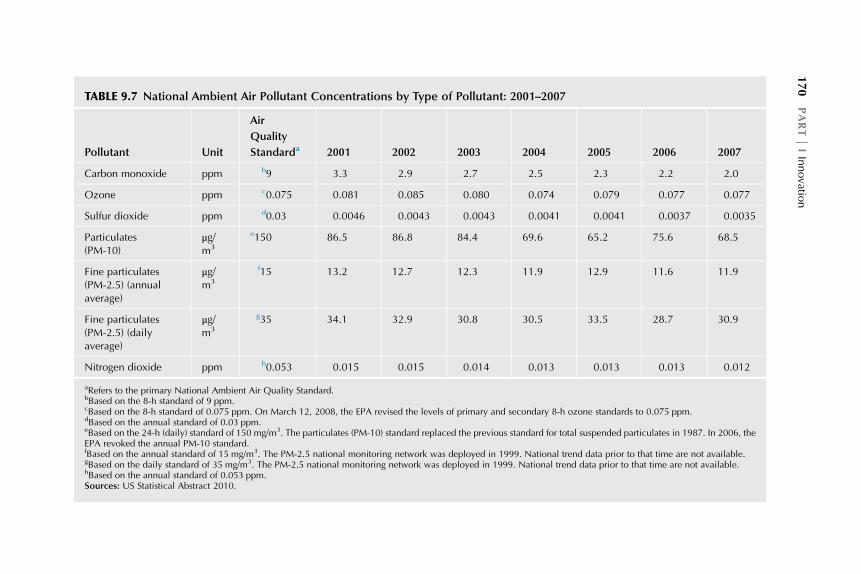
TABLE 9.7 National Ambient Air Pollutant Concentrations by Type of Pollutant: 2001–2007
Pollutant Unit
Air
Quality
Standarda 2001 2002 2003 2004 2005 2006 2007
Carbon monoxide ppm b9 3.3 2.9 2.7 2.5 2.3 2.2 2.0
Ozone ppm c0.075 0.081 0.085 0.080 0.074 0.079 0.077 0.077
Sulfur dioxide ppm d0.03 0.0046 0.0043 0.0043 0.0041 0.0041 0.0037 0.0035
Particulates(PM-10)
μg/m3
e150 86.5 86.8 84.4 69.6 65.2 75.6 68.5
Fine particulates(PM-2.5) (annualaverage)
μg/m3
f15 13.2 12.7 12.3 11.9 12.9 11.6 11.9
Fine particulates(PM-2.5) (dailyaverage)
μg/m3
g35 34.1 32.9 30.8 30.5 33.5 28.7 30.9
Nitrogen dioxide ppm h0.053 0.015 0.015 0.014 0.013 0.013 0.013 0.012
aRefers to the primary National Ambient Air Quality Standard.bBased on the 8-h standard of 9 ppm.cBased on the 8-h standard of 0.075 ppm. On March 12, 2008, the EPA revised the levels of primary and secondary 8-h ozone standards to 0.075 ppm.dBased on the annual standard of 0.03 ppm.eBased on the 24-h (daily) standard of 150 mg/m3. The particulates (PM-10) standard replaced the previous standard for total suspended particulates in 1987. In 2006, theEPA revoked the annual PM-10 standard.fBased on the annual standard of 15 mg/m3. The PM-2.5 national monitoring network was deployed in 1999. National trend data prior to that time are not available.gBased on the daily standard of 35 mg/m3. The PM-2.5 national monitoring network was deployed in 1999. National trend data prior to that time are not available.hBased on the annual standard of 0.053 ppm.Sources: US Statistical Abstract 2010.
170
PART
IInnovatio
n

Opportunity Areas for Innovation Chapter 9 171
finance and logistics industries. Similarly, services for the elderly also need to
benefit from developments in Internet information video technologies, for
example. Also, with increasing urbanization, innovation will be necessary to
address issues created by pressures on housing and physical infrastructure.
Second, China will need to develop its own high-technology sector to
replace the old, stagnating, and dying traditional industry sectors, which may
be consumers of energy and materials, with low productivity and cost effi-
ciency. Newer industries that are attracting a lot of attention in China, hence
providing plenty of opportunities for innovation, are aircraft and aviation equip-
ment, satellite and space applications, high-speed rail transportation, shipbuild-
ing and marine engineering, robots and intelligent manufacturing equipment,
and other advanced manufacturing sectors. China will need to transition from
an emphasis on “Made in China” to “Created in China.”
Third, there is increased emphasis on newer sources of energy. China’s
“Renewable Energy Development ‘Twelfth Five-Year Plan’” points out that,
by 2015, renewable energy, including hydropower, nuclear energy, wind
energy, solar energy, biomass energy, and geothermal energy, will produce
460 M tons of SCE. Energy demand in China in 2020 is estimated to be 5 B
tons of SCE, with 15% of this need being addressed by new energy sources.
Also, the Chinese plan for automobiles states in the “Energy Saving and
New Energy Automobile Industry Development Plan (2012–2020),” that, by
2020, China will produce 2 M pure electric and plug-in hybrid vehicles
(Daily Economy News, 2013). Both of these areas provide opportunities for
innovation in China.
Lastly, environmental protection is starting to gain increasing attention.
With the recent onslaught of bad news on the environmental front, such as
heavy smog, contaminated water, and industrial air and water pollution, increas-
ing attention is being paid to multipollutant control and comprehensive recy-
cling and disposal of solid waste. This also provides opportunities to
innovate and develop products, services, and business models for air and water
purification and more efficient energy consumption.
INDIA
Although economic development has been taking place at an increasingly fast
pace, nearly half the world’s population lives in acute poverty. Worldwide, over
4 B people form the “bottom of the economic pyramid” (BoP), a term coined to
represent those earning less than $2 per day ($1500 per person/year in local pur-chasing power; office of the advisor to the Prime Minister, 2011).
India is an extreme “dual” economy. On one extreme, its recent economic
growth has made it the world’s third-largest economy in PPP terms, and its
nuclear and space power and prominence in certain key economic sectors such
as biotechnology, pharmaceuticals, automotive components, information technol-
ogy (IT), software, and IT-enabled services are being recognized the world over.

172 PART I Innovation
At the opposite extreme, India is still a low-income, mainly rural, agrarian, and
subsistence economy with an average per capita income of $1492 in 2012
(IMF ranking 139 among 182 countries), high illiteracy rates, and about a quarter
of its population living below the national poverty line. The formal sector of the
Indian economy employs only 11% of the workforce; the remaining 89% of the
workforce is employed by the informal sector (Dutz and Dahlman, 2007).
Persistent poverty and unmet needs of the informal sector and the poor
remain a huge challenge for India. The implications are limited access to basic
services such as food, water, housing, health, and education to a large percent-
age of the population and spatial differences in growth. Big divides exist—
between the west and the south on the one hand with the majority of new invest-
ments and the north and east on the other hand with relatively few; between
urban areas where growth has taken off and the rural hinterlands that have stag-
nated, with a deep agrarian crisis affecting many regions; and last but not least
the cultural gap between the treatment of men and that of women. These
inequalities are manifesting themselves in the form of rural suicides, regular
conflicts, protests, and unrest. With the global economic downturn, such discon-
tent is also spreading to the urban areas, which have profited from the boom to
date, as lower-skilled workers, very often women, are laid off as contracts end,
when technology companies run out or when companies shut down due to a
decrease in business volume with the United States and the West, in general.
In addition to the regional, social, and economic inequalities, there are dis-
parities in the provision of basic amenities. Scientific Advisory Council to the
Prime Minister (2010) in its report has highlighted the challenges in providing
water, energy, and food as follows:
Because of the vagaries of the monsoon, the nature of the hydrological cycle and
the physiographical and geological attributes of the country the only replenish-
able water availability is finite and subject to unpredictable variability. Scientific
analysis suggests that India’s current water usage is already close to annual avail-
ability, and that this could lead to serious shortfalls over the next two decades.
Furthermore, the physical and ecological integrity of India’s water resource sys-
tem is seriously jeopardized by rapid industrial and population growth. . ..
Energy shortage is a chronic and serious problem in many parts of the country.
Uncertainties in the availability and pricing of oil resources, increasingly serious
concerns with climate change, difficult ecological and human displacement prob-
lems with large dams, and a host of other similar considerations have made it
essential for us to take a more integrated view of energy problems. . .food security
is associated with problems of water and energy resources that we have indicated
above. A second green revolution is now needed. . ..
To sum up, in addition to the social and cultural problems alluded to earlier, the
pressing economic challenges faced by India are energy and environment, food
and nutrition, water and sanitation, habitat, affordable healthcare, skill building
and employment, universal access to education, equity and social justice, and

Opportunity Areas for Innovation Chapter 9 173
national security—internal and external (Ministry of Science and Technology,
2013 and a Scientific Advisory Council to Prime Minister, 2010).
Addressing Unmet Needs
Several innovative approaches have been proposed and applied by different
communities and individuals to tackle these challenges.
The traditional top-down approach advocates provision of solutions to the
poor by the government, nonprofit organizations, or business (Gupta, 2013).
The celebrated bottom of the pyramid (BoP) approach on the other hand posits
that over 4 B people, in India, China, and elsewhere, who live on less than $2 aday, present a market opportunity of $5 T in PPP (Prahalad, 2012). Prahalad
(2012) argued that the BoP market is also a new source of radical innovation
offering exciting opportunities for the creation of new products and business
models by facilitating awareness, access, affordability, and availability.
Prahalad and Mashelkar (2010) called this model the Gandhian innovation
model, a frugal innovation model that overcomes lack of resources in such mar-
kets by developing strategies to create new products with few resources and sell
them cheaply to more people or in other words a model that purports “more
from less for more.”
While the success of frugal innovation or Gandhian innovation model in a
resource-scarce economy like India has its own merits, treating the poor merely
as a sink of corporate goods and services will not work if there is a lack of appre-
ciation of fundamental differences in the psychological, physical, and economic
realities of the poor (Karnani, 2009). For example, if the BoP products and solu-
tions assume that poorer people are doomed to live with pollution and unequal
access to basic amenities such as water, sanitation, and power, the efforts may
be counterproductive (Chattejee, 2009). Companies selling andmarketing prod-
ucts that require no water, for instance, maybe perceived as “opportunistic” and
disconnected from the larger issues of the society (Chattejee, 2009). Therefore,
overemphasis of the role of private enterprise in such initiatives sometimes
dilutes the legal, regulatory, and social roles of state in protecting the vulnerable
poor (Karnani, 2009). e-Choupal, a widely acclaimed BoP IT initiative in agri-
cultural markets in rural India created by ITC, a large private corporation, is an
illustration of such a kind.
Varman et al. (2012) in their case study of e-Choupal found that the initiative
excludes the socioeconomically underprivileged or subaltern groups that it
claimed to serve and makes the relatively wealthy or privileged more active
and entrepreneurial. This was because the public policy framework is unable to
provide guidance for reducing the gulf between poverty alleviation and private
gains inherent in the BoP initiative. Kurian et al. (2008) came up with a similar
conclusion when they studied the impact of Akshaya kiosks public/private
sector collaboration that aimed for rural development through access to infor-
mation and computer literacy and financial viability through a sustainable

174 PART I Innovation
business model. They found that these kiosks were used mostly by middle-class
students and aspiring professionals, not by those who needed basic educational
or e-governance services.
However, community-led enterprises have been successful in contributing to
both local economic development and social development. In these enterprises,
community acts corporately as both entrepreneur and enterprise in pursuit of
the common good models of enterprise-led poverty alleviation (Peredo and
Chrisman in Somerville and McElwee, 2011). Amul, Shri Mahila Griha Udyog
Lijjat Papad, and Gram Mooligai Limited (GMCL) are examples of successful
community-led enterprises in India that have helped in both social upliftment
and economic upliftment of several poor people. Amul story or the white
revolution as it is called in India transformed India into the largest producer of
milk, significantly contributing to the country’s growth trajectory (Office of
Advisor to the Prime Minister, 2011). For a community-led enterprise to be
successful, social capital and trust are required. There are instances where this
model has not worked because of gaps between the common man, government,
and the elite arising from the lack of social capital and trust (Lundahl, 2010).
An alternative approach for inclusive development is the grassroots innova-
tion model. The Honey Bee Network is an example of this model. This network
recognizes that poor people are not at the bottom of the knowledge, ethical, or
innovation pyramids and that building upon grassroots innovations that emanate
from this part of the pyramid can serve as a fundamental building block for soci-
etal transformation (Gupta, 2013). The network not only scouts and documents
such innovations but also supports them through incubation, microventure cap-
ital, and building partnerships between formal and informal sciences. The net-
work believes that by doing so, enterprise-led development can be achieved in a
dignified and a mutually respectful manner.
India’s challenges are so complex and diverse that the above models are not
foolproof. While they are successful in certain circumstances, they have also
failed in several cases. To make any innovation model effective, policy checks
through which the promises of inclusivity are facilitated, monitored, and imple-
mented are required.
Innovation in India has to play a role not only in finding affordable, quality
services and products for people at the BoP but also in creating mechanisms and
platforms to scale grassroots innovations to generate sustainable livelihood
and employment. Challenges such as lack of housing, healthcare, and education
will require innovations in processes, service delivery, design thinking, and
human capital involving multiple stakeholders as well as stronger institutional
infrastructure.
THE UNITED STATES
The United States faces some of the same problems as China, and to some extent
as India, although to different degrees: (1) a large and widening gap between the

Opportunity Areas for Innovation Chapter 9 175
rich and the poor, (2) an aging population, (3) resuscitation and growth of the
declining manufacturing sector, (4) energy self-dependence, and (5) environ-
mental pollution. Declining standards of education and the absence of a coor-
dinated science and technology policy seem to be other problems that are
significant challenges for the United States. However, the degree and severity
of some of these challenges in emergingmarkets of China and India are far more
daunting than those in a highly industrialized, modern economy, such as the
United States. In some cases, given the dynamics, cost structures, and the price
points affordable in emerging markets, innovations created in these emerging
markets might find their way back to the United States, as examples of “reverse
innovation.”
While the United States has depended on the creativity, innovation, and
entrepreneurial spirit of the private sector through most of its young history,
the US government, as discussed earlier, has played a huge role in the past
in advancing science and technology, which in turn has helped establish the
United States as an industrial and economic superpower. Opportunity-driven
innovation in the private sector will always happen in the United States, as evi-
denced by recent history and value created by private enterprise for the US
economy, and will continue to happen in the future—opportunities that create
value for the entrepreneur and for the society. However, very often, what is for-
gotten and “lost in translation” is the contribution made by the US government
in funding the foundational work that later enabled private enterprise to benefit
from it. US government investments usually do not have a short-time horizon
for obtaining a return, usually taking decades to pay off—a much longer cycle
than the 4-year political cycle of presidential and congressional elections, not
infrequently heavily influenced by narrow industry-specific interest groups,
operating as lobbyists and regional “pork-barrel” politics.
In a lot of ways, we are still reaping the benefits of US government invest-
ments made from the 1940s through the 1980s. Investments in research and
development and innovation in the defense sector have certainly continued
as they should. However, there is also a need for a coordinated US science
and technology policy that encourages and supports research and development,
invention, and innovation in other areas such as the ones mentioned below. This
will also help spur investments by the private sector, as it did in the past, and will
go a long way towards reestablishing US competitiveness in the future.
From an innovation and entrepreneurship perspective, therefore, we focus
on those areas that provide the most fertile ground for new growth in the United
States in the years to come that could benefit from a coordinated US govern-
ment science and technology policy. Although not intended to be a comprehen-
sive and all-encompassing list, we believe some of these areas are as follows:
1. Healthcare, telemedicine, biotechnology, and biomedical instrumentation
This is the largest sector of the US economy at about $1.7 T, and a verylarge number of players are involved in the value chain and the ecosystem

176 PART I Innovation
for this sector. Also, as discussed earlier, among the three countries dis-
cussed in detail in this book, the United States has the fastest aging pop-
ulation who are now living longer. This sector affords a large
opportunity for innovation and entrepreneurship.
2. Pharmaceuticals, biomolecular systems, and bioinformatics
For some of the same reasons discussed above, this is another signifi-
cant area for innovation and entrepreneurship. A much improved under-
standing of the human DNA and the functional and physical mapping of
the human genes made possible by the Human Genome Project now
enables discovery and development of new disease-specific pharmaceuti-
cals and means for fighting new drug-resistant microbes.
3. Brain and neuroscience
This appears to be the “last frontier” in understanding our own com-
plexity as to who we are as human beings. What the Human Genome Pro-
ject has done for understanding the human DNA, there is now a similar
opportunity to understand the most complicated part of the human anatomy
that defines us, who we are and why we are the way we are; to better under-
stand human behavior and the link between feeling and being, thought and
emotions, and the human “hardware and software”; and even potentially to
understand what consciousness is.
4. Robotics, industrial automation, and increased focus on the manufacturing
sector
This has been a field that has been attracting a lot of attention in the last
decade or two. With capabilities enabled by the progression along Moore’s
law, in the computing, storage, and communicating capabilities of semi-
conductor photonic chips, as well as in instrumentation, using control and
feedback systems, highly functioning robots are very close to being realized
for performing tasks that humans may rather not perform. The applications
of these robots in dangerous tasks, as well as in the manufacturing sector
for industrial automation, could further enhance productivity.
5. Nanotechnology-based new materials, devices, and technologies
Advances in semiconductor technology have progressed alongMoore’s
law over the last 50 plus years but may now be asymptotically reaching
limits dictated by the laws of physics, limiting further scaling. However,
this has driven research for materials and technologies on the nanometer
scales. New materials have been discovered with very unique physical,
chemical, or electrical properties that could further lead to entirely new
types of materials devices and technologies. This is another area that is ripe
for future innovation and entrepreneurship.
6. Energy, alternative energy, clean energy, utilities, and the energy physical
infrastructure
The US population today is approaching 350 M, and energy usage per
person has been increasing over time. With such significant demands on

Opportunity Areas for Innovation Chapter 9 177
energy usage, there is a need for new sources of energy—both traditional
and new. Among the traditional sources, there is a need to further explore
oil and gas, coal and shale, and cleaner forms of traditional energy, such as
nuclear. Given the challenges of pollution and fossil fuel-driven global
warming, there are opportunities to explore and develop newer and cleaner
forms of energy—solar, wind, geothermal, and others. Along with sources
of energy, for both mobile usage and fixed usage, the transmission and dis-
tribution network, and the energy grid in the United States, is aging and
provides further opportunities for innovation and entrepreneurship.
7. Transportation infrastructure: roadways, high-speed rail, waterways, air
traffic, and airports
Most of Europe and Japan have had advanced, high-speed mass trans-
portation railroad networks for several decades, and now, one of the most
advanced, very high-speed rail networks is being built in China. This is an
opportunity that has not been pursued in the United States in the past, due
to the availability of an advanced road network and interstate highway sys-
tem. Over the years, this was complemented by one of the world’s most
extensive and busiest air transportation networks. In the earlier years of
its history, commerce and transportation in the United States were enabled
by waterways and later an extensive rail network around and after the Civil
War. Although these have been superseded by highway and air transpor-
tation infrastructures, investments in most of these areas for the most part
are also somewhat dated. All of these areas provide opportunities for
investments and innovation.
8. Information infrastructure: big data, big data analytics, fraud prevention,
and cybersecurity
The Internet and social media enabled by both advances in mobile wire-
less and fixed wire-line cable and optical networks close to infinite capac-
ity, and increasingly smart endpoint devices, have driven an information
explosion with an exponentially increasing number of bits and bytes and
streams of ones and zeros floating around through space in the form of
radio waves and through cables carrying both private information and non-
private information. The “genie is out of the bottle” here and no reversal is
expected in this trend. On the contrary, with content rapidly transitioning
from pure data to data consisting of voice, audio, video, and now also high-
definition (HD) and ultra-HD video, and in the future, potentially, 3D
video, and the fundamental human need to connect with others, further
continuation of the exponential rise in data is a foregone conclusion. This
making information infrastructure—the information superhighway and
broadband access—available to all strata of society has to be a priority.
Data that describe users and their habits and patterns are being collected
in the form of “metadata” and used by companies for marketing and com-
mercial purposes—these are big data—and defining algorithms to discern

178 PART I Innovation
patterns within those data for commercial use is termed big data analytics.
Along with the availability of these massive amounts of data comes the
need for privacy protection, fraud prevention, and, in general, maintaining
security of the data. All fall within the general category of cybersecurity
and at a corporate or national level become significant priorities, to prevent
corporate or national espionage and to prevent cyberterrorism, which could
potentially bring a nation’s day-to-day activities to a standstill, since most
commerce now depends so heavily on the information infrastructure. This
area, just as it has in the recent past, will continue to be an area that will be
driven by innovation and entrepreneurship.
9. The space program
The benefits accrued to the United States and the US economy—both
psychological and physical—from the clarion call to “put man on the
moon” are well known. The nation rallied and unified behind this vision,
and when the mission was accomplished, the nation’s psyche soared, filled
with a sense of pride and accomplishment. Apart from these psychological
benefits, the advances in technology needed to achieve that and funded by
NASA flowed through the rest of the economy—new materials and tech-
nologies and devices that could be used in broader commercial applica-
tions. The work of NASA that followed and later of JPL to guide
missions to other planets has yielded other dividends as well, along with
increasing our knowledge of the universe we inhabit, and also laid the
groundwork for potential commercial human travel to the moon and
beyond. New private corporations are now pursuing commercial human
travel with more advanced propulsion systems and transport vehicles, in
another display of American innovation and entrepreneurship. Successes
in these endeavors will encourage further investments in these areas.
10. Education infrastructure: schools, colleges, and universities
All of the areas discussed above are highly technology-driven and
hence require advanced education in sciences, technology, engineering,
and mathematics—the “hard skills,” along with a good education in the
social sciences to help develop the “soft skills” that are needed for com-
prehension and communication of complex concepts, as well as leadership
and teamwork in large organizations, which typically is how complex pro-
jects get worked.
As discussed before, while these were areas of strengths for the United
States until about the 1980s, there has been a gradual but perceptible and
measurable decline in the interest in pursuing these areas and hence in
these faculties, among the younger generations in the United States. This
starts all the way from early education in the schools, which are the feeder
systems for colleges and universities. While the US population has
increased to 350 M with an accompanying increase in the population of
young people, and the number of colleges and universities has also

Opportunity Areas for Innovation Chapter 9 179
substantially increased over the same period, US students are not faring
well in standardized tests in relation to their counterparts elsewhere, espe-
cially in other developed countries.
This has not been helped by the ever-widening income gap, a decline in
the quality and rigor of education, rising costs of education, increasing debt
burden for students who choose to pursue college and university education,
and more importantly a cultural shift that seems to undervalue education in
relation to other pursuits, such as sports and athletics and entertainment, as
well as a regression in large parts of the country to a politicoreligious end of
the spectrum that runs counter to well-known and well-established science.
A common refrain by those who are in politics to address this problem has
been as follows: we will allow an influx, an “insourcing,” of skilled immi-
grants to come to the United States and be our future scientists and engineers
and be our inventors and innovators. These are some of the same folks who
do not bemoan the transition of the United States from a manufacturing
economy to a service economy. While some of this is needed, and indeed
necessary, to attract the best and brightest to come and devote their energies
and talents to the United States, this cannot be a substitute for training those
who are born and brought up in the United States.
The need for not onlymore investment but also more efficient use of the
investments being made in this area, as well as innovative and creative
ways to improve the quality and delivery of education, will be needed
to reverse the downward trend in this area.
In summary, most discussions on innovation around the world have focused on
improving efficiency and productivity in business in order to stay ahead of com-
petition. However, there are a large number societal problems that need to be
addressed through innovation, such as a large and widening gap between the
rich and the poor; population growth, aging population, and associated health-
care needs; energy, water, and housing shortages; global climate changes; air
and water pollution; and illiteracy and the need for improving the quality of
education.
Promotion of innovation, beyond what occurs naturally anyway, therefore,
needs to be driven by these major problems that a nation faces and needs to be
built upon resources and capabilities specifically available in the country, tak-
ing into account their level of development and maturity. We discussed various
difficulties unique to the local contexts of China, India, and the United States
and reviewed the approaches being taken to address these problems.
REFERENCES
Chattejee, S., 2009, August. Selling to the Poor – Reflection, Critique and Dialogue. Retrieved
July 8, 2013, from:http://warrington.ufl.edu/graduate/academics/pdb/docs/proposals/2009_
SuparnaChatterjee.pdf.

180 PART I Innovation
China Economic Information Net, 2010. http://www.cei.gov.cn/default.aspx?tab¼159 (accessed
18.10.10.).
China Economic Net, 2013. http://www.ce.cn/ (accessed 22.08.13.).
China Securities Journal, 2013. http://www.cs.com.cn/ (accessed 28.12.13.).
Chinanews Net, 2011. http://www.chinanews.com/ (accessed 15.04.11.).
Chinanews Net, 2012. http://www.chinanews.com/ (accessed 23.06.12.).
Daily Economy News, 2013. http://www.chinanews.com/ (accessed 31.12.13.).
Dutz and Dahlman,M.A., 2007. The Indian context and enabling environment. In: Dutz, M.A. (Ed.),
Unleashing India’s Innovation – Towards Sustainable and Inclusive Growth. The World Bank,
Washington, DC, pp. 49–82.
Gupta, A., 2013. Tapping the entrepreneurial potential of grassroots innovation. SSIR
11 (3 (Summer)), 18–20 (Sponsored Supplement).
Karnani, A., 2009. Romanticizing the poor. SSIR 7 (1), 38–43.
Kurian, R., et al., 2008. How to use technology to spur development. Issues Sci. Technol.
24 (2 (Winter)), 73.
Lundahl, M., 2010. The failure of community-based entrepreneurship in Haiti. Int. J. Innov.
Regional Dev. 2, 112–127.
Ministry of Science and Technology, 2013. Science, Technology and Innovation Policy 2013.
Government of India, New Delhi.
Office of Advisor to the Prime Minister, 2011. Towards a More Inclusive and Innovative India –
Creating a Roadmap for a Decade of Innovation. Office of Advisor to the Prime Minister,
New Delhi.
Ping, L., 2007. Analysis on income inequality in china and countermeasures to resolve it. Special
Zone Economy 9, 200–201.
Ping, L., 2013. Research on the Effect of Population Aging on Economic Growth in China,
Shandong University doctor degree paper, April, p. 29.
Prahalad, C., 2012. Bottom of the pyramid as a source of breakthrough innovations. J. Prod. Innov.
Manage. 29, 6–12.
Prahalad, Mashelkar, 2010. Innovation’s Holy Grail. Harvard Business Review.
Scientific Advisory Council to the Prime Minister, 2010. India as a Global Leader in Science.
Department of Science and Technology, Government of India, New Delhi.
Somerville and McElwee, 2011. Situating community enterprise: a theoretical exploration. Entrep.
Reg. Dev. 23, 317–330.
Varman, et al., 2012. Conflicts at the bottom of the pyramid: profitability, poverty alleviation, and
neoliberal governmentality. J. Public Pol. Marketing 31 (1), 19–35.
Wenke, C., 2013. Analysis on China manufacturing industry and its international competitiveness.
Foreign Economic Relations & Trade (7), 7–10.
Yulun, L., 2010. A research on China current manufacturing and international comparison. J. North
China Electric Power Univ. (Soc. Sci.) 3, 32–37.