Embed Size (px)
Citation preview
Initial Operation of the CubeSat Ambipolar Thruster
IEPC-2015-243/ISTS-2015-b-243
Presented at Joint Conference of 30th International Symposium on Space Technology and Science,34th International Electric Propulsion Conference and 6th Nano-satellite Symposium
Hyogo-Kobe, JapanJuly 4–10, 2015
J. P. Sheehan�, Timothy A. Collard�, Frans H. Ebersohn�, and Benjamin W. Longmier�
University of Michigan, Ann Arbor, MI, 48109, USA
The development progress of the CubeSat Ambipolar Thruster (CAT) is reported. Mea-surements of the magnetic nozzle field are in good agreement (to within 5%) of designvalues, demonstrating that permanent magnets can be used to generate a magnetic nozzle.CAT was fired using argon as a propellant at 5 – 220 W. Optimal operating conditions,as determined from plume observations, occurred at 15 W with a 10 sccm flow rate. Aprototype additive-manufactured xenon tank is described, designed to utilize xenon’s su-percriticality above 58.4 bar to increase the propellant mass at the cost of little additionaltank pressure. A regulator and choked-flow orifices were paired to determine the pro-pellant feed system elements required to provide the correct pressure and mass flow rateto CAT. Additionally, a low-thrust orbital simulation tool is described which allows rapidorbit change analysis to simulate CAT’s capabilities on orbit.
Nomenclature
Isp = specific impulse
me = electron mass
mi = ion mass
p = background neutral pressure
Pdep = power deposited into the plasma
Te = electron temperature
V coldfl = non-electron-emitting probe floating potential
V emfl = electron-emitting probe floating potential
VCOL = collector plate potential
VIR = ion retarding grid potential
VREP = electron repelling grid potential
VSE = secondary electron suppression grid potential
φp = plasma potential
�Assistant Research Scientist, Aerospace Engineering, and [email protected].�PhD Candidate, Aerospace Engineering, and [email protected].�PhD Candidate, Aerospace Engineering, and [email protected].�Adjunct Professor, Aerospace Engineering, and [email protected].
1Joint Conference of 30th ISTS, 34th IEPC and 6th NSAT, Hyogo-Kobe, Japan
July 4–10, 2015
I. Introduction
Propulsion is one of the most significant technology gaps for CubeSats and, more generally, nanosatellites.Developing propulsion technology for CubeSats is one of the main goals of NASA’s Cube Quest CentennialChallenge.1 CubeSat propulsion is less advanced than other nanosatellite technologies because of the diffi-culties in miniaturizing conventional thruster designs. Monopropellant and bipropellant systems exist or arein development2–5 with thrusts of �1 N and small ΔV capabilities of 10s of m/s. For moderate ΔVs (>100m/s) electric propulsion is needed. A wide variety of electric thrusters are in development, with predictedΔV capabilities up to 300 m/s.6–14 These thrusters will be suitable for station keeping, formation flying,and deorbiting.
There are, however, exciting missions for CubeSats that can only be accomplished with 1000 m/s orgreater ΔV. These mission include deep space exploration requiring earth escape or orbital insertion. Lunarcapture from a trans-lunar trajectory can require between 700 and 1500 m/s, depending on the final lunarorbit.15 Long-lived low altitude orbits require such propulsion to compensate for drag. Meaningful orbitchanges, including inclination changes, can require > 1000 m/s.
The CubeSat Ambipolar Thruster (CAT) is being developed to provide such levels of ΔV to CubeSatsand other nanosatellites and this article describes the development progress made on the prototype thrusterand propellant management system. The thruster has been operated on xenon and argon, with ion energymeasurements identifying two different modes of operation. The first in-orbit demonstration of CAT willbe aboard a 3U CubeSat and the design described here is suitable for that form factor and technologydemonstration mission. The propellant management system has been designed to provide sufficient xenonfor initial on-orbit testing and orbit change demonstrations. Together, the propulsion subsystem consistingof the thruster, propellant tank, propellant feed system, and power processing unit, will fit into 2U of the3U satellite.
II. CubeSat Ambipolar Thruster
CAT is a helicon plasma thruster designed to provide small spacecraft with large ΔV (�1 km/s) for mak-ing significant orbit changes. Helicon plasma thrusters operate by using helicon waves, an electromagneticwave, to efficiently heat electrons which ionize the propellant to a 95% ionization fraction or greater.16–23 Adiverging magnetic nozzle expand the plasma, both ions and electrons, producing a stream of electrons andenergetic (10s of eV) of ions.24,25 Benefits of this design include the high efficiency ionization mechanism ofthe helicon wave, the magnetic field which keeps plasma away from the walls which may reduce erosion, andzero net current so no neutralizing cathode is required.
Table 1: CAT parameters for xenon propellant.
Power 10 - 50 W
Flow Rate 5 - 15 sccm
Isp 400 – 800 s
Efficiency 10% – 40%
Thrust 0.5 – 4 mN
Thrust/Power 50 – 80 mN/kW
Small spacecraft have stringent power limitations due to solar panel size, so CAT was designed to operateon 10 – 50 W. That power heats the electrons and ionizes the propellant via the helicon wave. At the designpoint the propellant flow rate is set to that which can be fully ionized by the input power. The magneticnozzle expands the plasma and facilitates energy transfer from the electron thermal modes to the ion jet,so a higher electron temperature leads to a higher specific impulse (Isp). Inefficiencies come principallyfrom ionization costs, inelastic collisions, and losses to plasma-facing surfaces. Expected thrust can then bedetermined from power, efficiency, and specific impulse. A summary of the range of projected performanceparameters for CAT using xenon propellant is shown in Table 1 but a more complete description of thesecalculations can be found in Ref. 25.
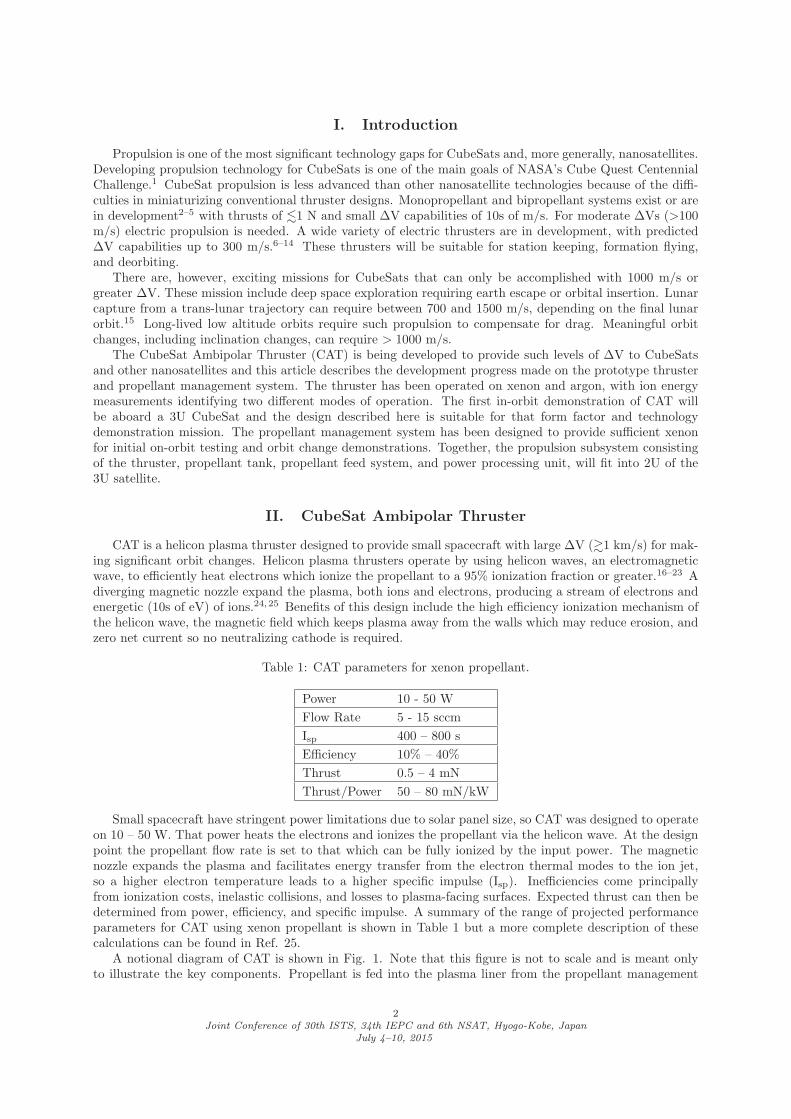
A notional diagram of CAT is shown in Fig. 1. Note that this figure is not to scale and is meant onlyto illustrate the key components. Propellant is fed into the plasma liner from the propellant management
2Joint Conference of 30th ISTS, 34th IEPC and 6th NSAT, Hyogo-Kobe, Japan
July 4–10, 2015
system. It could be xenon, iodine, or some other propellant in gaseous form. The propellant is ionized inthe plasma liner where RF energy is deposited via the helical half-twist helicon antenna.26 On a spacecraftthe RF power would come from an RF power processing unit (PPU) but in these experiments a laboratorypower supply was used. Permanent magnets generate a magnetic nozzle which keeps the plasma away fromthe plasma liner and directs it out of the thruster. The magnetic field has a maximum strength of ∼ 800 Gin the throat and a far-field dipole moment of 12 A/m2. In the expanding region the ions accelerate andgenerating thrust, the physical mechanism of which is explained in greater detail elsewhere.24 Within 40 cmthe field strength decreases to 0.5 G, the strength of Earth’s magnetic field.
SPACECRAFT
PROPELLANT IN
HELICONANTENNA
PLASMALINER
PERMANENTMAGNETS
MAGNETICNOZZLE
FARADAYSHIELD
Figure 1: A schematic diagram of CAT operating, integrated with a 3U CubeSat. Not to scale.
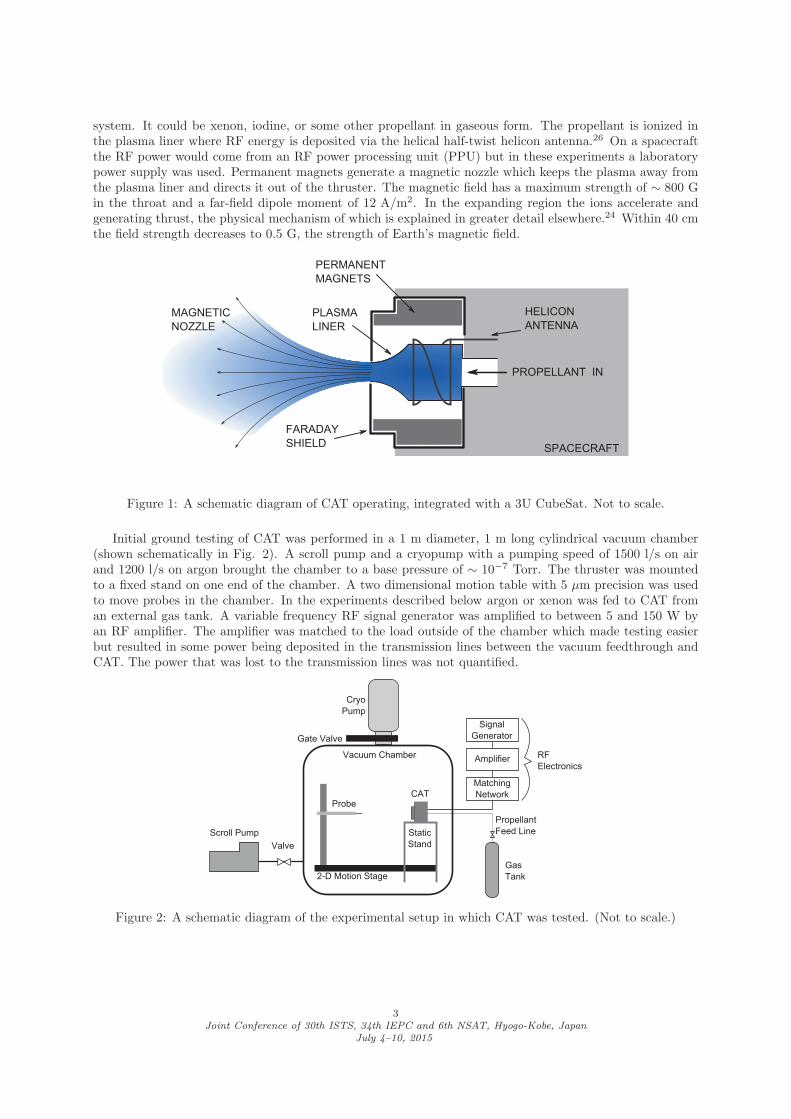
Initial ground testing of CAT was performed in a 1 m diameter, 1 m long cylindrical vacuum chamber(shown schematically in Fig. 2). A scroll pump and a cryopump with a pumping speed of 1500 l/s on airand 1200 l/s on argon brought the chamber to a base pressure of ∼ 10−7 Torr. The thruster was mountedto a fixed stand on one end of the chamber. A two dimensional motion table with 5 μm precision was usedto move probes in the chamber. In the experiments described below argon or xenon was fed to CAT froman external gas tank. A variable frequency RF signal generator was amplified to between 5 and 150 W byan RF amplifier. The amplifier was matched to the load outside of the chamber which made testing easierbut resulted in some power being deposited in the transmission lines between the vacuum feedthrough andCAT. The power that was lost to the transmission lines was not quantified.
Figure 2: A schematic diagram of the experimental setup in which CAT was tested. (Not to scale.)
3Joint Conference of 30th ISTS, 34th IEPC and 6th NSAT, Hyogo-Kobe, Japan
July 4–10, 2015
III. Diagnostics
The plasma discharge of CAT was analyzed with diagnostics including an emissive probe, a retardingpotential analyzer (RPA), a residual gas analyzer (RGA), and a 3-axis magnetometer.
A. Magnetometer
A 3-axis magnetometer with a full scale range of up to 300 kG and a resolution of 0.01 mG was used tomap the magnetic field of CAT prior to implementation of the above diagnostics. The probe tip dimensionswere ∼ 7 x 7 x 15 mm, allowing for mapping resolutions of up to 20 mm. Within this probe 3 independentgaussmeters record values in the 3 cardinal Cartesian directions, allowing for the local magnitude andstreamline direction to be determined.
B. Emissive Probe
A emissive probe was used to measure plasma potential in the CAT plume using the floating potentialin the limit of large emission technique.27,28 A hair-pin loop of 0.125 mm diameter thoriated tungsten wireextending from a dual bore alumina tube was used as a probe tip. Currents ranging from 2.2 – 2.8 Awere used achieve thermionic emission and reach saturation at the plasma potential. Electron temperatureswere estimated from the cold probe floating potential (V cold
fl ) and emitting probe floating potential (V emfl )
assuming a planar probe model and a thin sheath:29
Te =e(V em
fl − V coldfl )
−[ln
(0.61
√2πme
mi
)+ 1.5
] (1)
Corrections were made to the plasma potential measured by the emissive probe using the electron temperatureand the equation below:
φp = V emfl + 1.5Te/e (2)
C. Retarding Potential Analyzer
The ion energy distribution was measured in the CAT plume using a retarding potential analyzer (RPA)which consists of a series of grids and a collector plate which act as a high pass filter for ions.30 The microRPAdeveloped at PEPL to study helicon plasma sources was used for these measurements.31 This RPA consists offour 316 stainless steel grids (floating, electron repelling, ion retarding, and secondary electron suppression)and a nickel collector. Each of the grids as well as the final grid and the collector plate are separated by 0.5mm macor spacers.
The electron repelling and secondary electron grid biases were applied with Instek GPR-30H-10D powersupplies. The voltages of these grids ranged from VREP = (−50,−30) V for the electron repelling gridand VSE = (−80,−48) V for the secondary electron suppression grid.32 The ion retarding and collectorbiases were applied with Keithley 2410 and 2400 sources respectively. The ion retarding voltages wereswept from VIR = (−25, 150) V using a DAQ interface. The collector was biased negatively in the range ofVCOL = (−70,−40) V to insure collection of all ions. A range of biases was used for these measurementsdue to the wide range of operating conditions investigated. Currents at the collector were measured with aKeithley 6485 picoammeter.
Current-voltage traces were smoothed with locally weighted scatterplot smoothing (LOWESS) beforederivatives (−dI/dV ) were taken to determine the ion energy distribution function. A fourth-order centraldifference scheme was used in calculating the derivatives.
IV. Magnetic Field
CAT’s magnetic nozzle was generated by annular neodymium magnets. These were specifically designedand manufactured to create a field that converged to a large magnetic flux of ∼ 800 G at the throat ofthe nozzle and expanded with minimal divergence. The density of a helicon discharge scales linearly withmagnetic field26 so a larger magnetic field results in higher thrust. Peak electron temperatures are expected
4Joint Conference of 30th ISTS, 34th IEPC and 6th NSAT, Hyogo-Kobe, Japan
July 4–10, 2015
to be on the order of 10 eV, based on past helicon experiments.24,33,34 Electrons with 10 eV of energy normalto the magnetic field in the throat would have a Larmor radius of ∼ 0.01 cm, two orders of magnitude smallerthan the throat diameter. The magnetized electrons follow the magnetic field lines and drag the ions withthem via the electric field, exchanging energy and generating the ion beam.24 At some point in the nozzlethe plasma will detach from the magnetic field lines and continue moving away from the thruster, thoughthis process is not well understood.35,36 Detachment is assumed to happen before the point where CAT’smagnetic field strength falls below Earth’s magnetic field strength (0.5 G). If detachment does not take placeby before the plasma reaches Earth’s magnetic field then it will follow Earth’s magnetic field lines. At thepoint of detachment the electron temperature is expected to be reduced to � 1 eV, which results in a Larmorradius of ∼ 10 cm, on the order of the diameter of the magnetic nozzle at that point. Large Larmor radiicompared to the magnetic nozzle size are expected to contribute to detachment.35,37
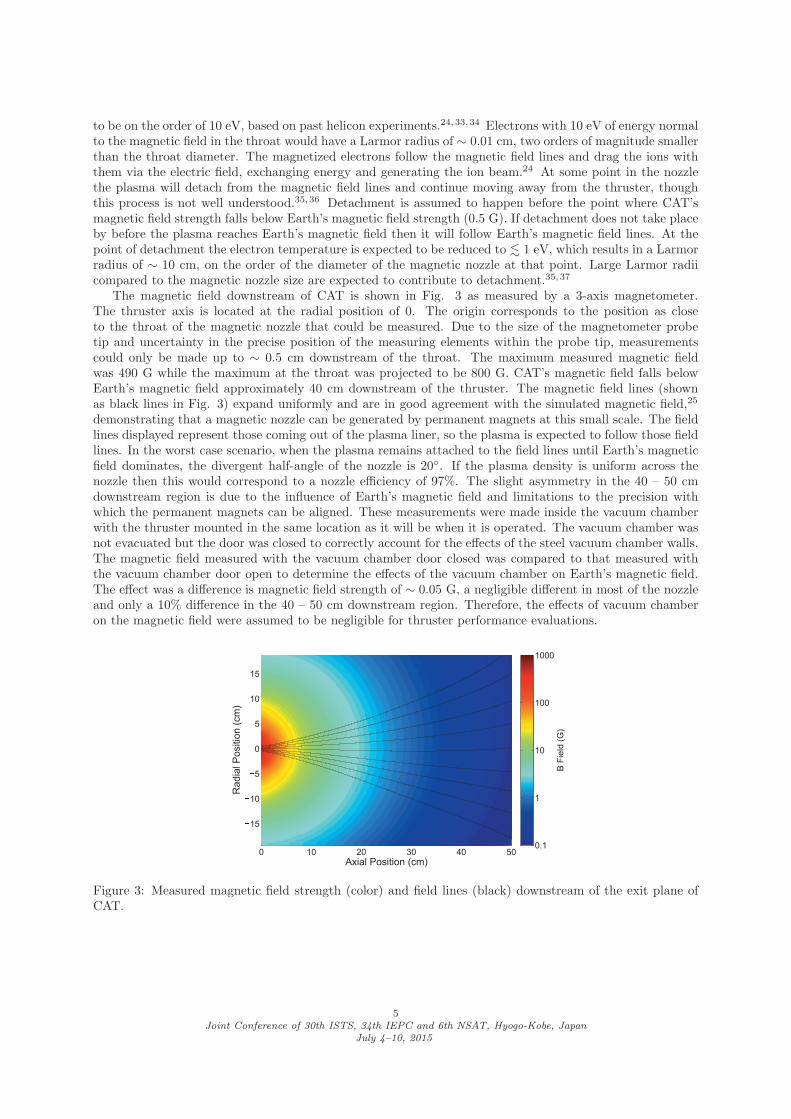
The magnetic field downstream of CAT is shown in Fig. 3 as measured by a 3-axis magnetometer.The thruster axis is located at the radial position of 0. The origin corresponds to the position as closeto the throat of the magnetic nozzle that could be measured. Due to the size of the magnetometer probetip and uncertainty in the precise position of the measuring elements within the probe tip, measurementscould only be made up to ∼ 0.5 cm downstream of the throat. The maximum measured magnetic fieldwas 490 G while the maximum at the throat was projected to be 800 G. CAT’s magnetic field falls belowEarth’s magnetic field approximately 40 cm downstream of the thruster. The magnetic field lines (shownas black lines in Fig. 3) expand uniformly and are in good agreement with the simulated magnetic field,25
demonstrating that a magnetic nozzle can be generated by permanent magnets at this small scale. The fieldlines displayed represent those coming out of the plasma liner, so the plasma is expected to follow those fieldlines. In the worst case scenario, when the plasma remains attached to the field lines until Earth’s magneticfield dominates, the divergent half-angle of the nozzle is 20◦. If the plasma density is uniform across thenozzle then this would correspond to a nozzle efficiency of 97%. The slight asymmetry in the 40 – 50 cmdownstream region is due to the influence of Earth’s magnetic field and limitations to the precision withwhich the permanent magnets can be aligned. These measurements were made inside the vacuum chamberwith the thruster mounted in the same location as it will be when it is operated. The vacuum chamber wasnot evacuated but the door was closed to correctly account for the effects of the steel vacuum chamber walls.The magnetic field measured with the vacuum chamber door closed was compared to that measured withthe vacuum chamber door open to determine the effects of the vacuum chamber on Earth’s magnetic field.The effect was a difference is magnetic field strength of ∼ 0.05 G, a negligible different in most of the nozzleand only a 10% difference in the 40 – 50 cm downstream region. Therefore, the effects of vacuum chamberon the magnetic field were assumed to be negligible for thruster performance evaluations.
Figure 3: Measured magnetic field strength (color) and field lines (black) downstream of the exit plane ofCAT.
5Joint Conference of 30th ISTS, 34th IEPC and 6th NSAT, Hyogo-Kobe, Japan
July 4–10, 2015
V. Operating Conditions
A. Parameter Space Investigation
For these initial test of CAT the power-flow rate parameter space was explored to determine CAT’soperational range with both argon and xenon. The power was varied from 3 to 220 W. The powers reportedfor the various conditions are the powers deposited to the circuit consisting of the antenna and its wire leads.Some fraction of that power was deposited into the plasma (Pdep) but some was lost in the leads. For thisreason we report powers as being less than the deposited value (e.g. < 15 W) to remind the reader of thiscaveat. The volumetric flow rate ranged from 0.2 sccm to 50 sccm.
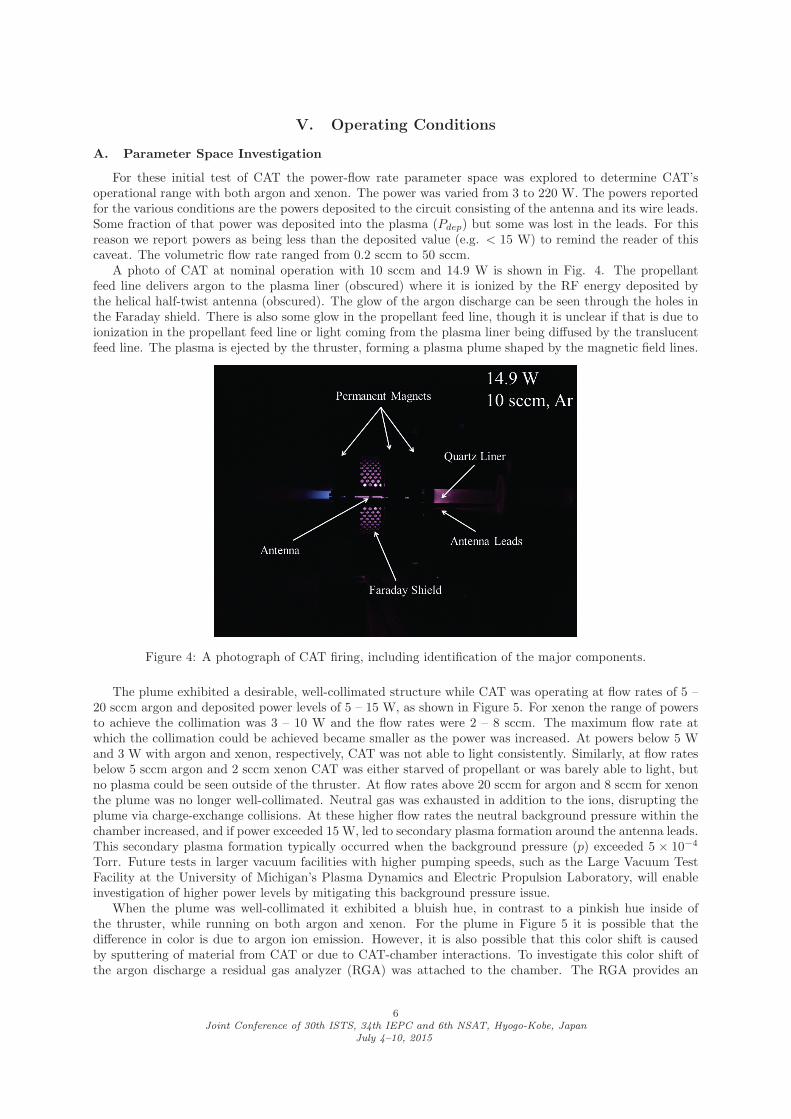
A photo of CAT at nominal operation with 10 sccm and 14.9 W is shown in Fig. 4. The propellantfeed line delivers argon to the plasma liner (obscured) where it is ionized by the RF energy deposited bythe helical half-twist antenna (obscured). The glow of the argon discharge can be seen through the holes inthe Faraday shield. There is also some glow in the propellant feed line, though it is unclear if that is due toionization in the propellant feed line or light coming from the plasma liner being diffused by the translucentfeed line. The plasma is ejected by the thruster, forming a plasma plume shaped by the magnetic field lines.
Figure 4: A photograph of CAT firing, including identification of the major components.
The plume exhibited a desirable, well-collimated structure while CAT was operating at flow rates of 5 –20 sccm argon and deposited power levels of 5 – 15 W, as shown in Figure 5. For xenon the range of powersto achieve the collimation was 3 – 10 W and the flow rates were 2 – 8 sccm. The maximum flow rate atwhich the collimation could be achieved became smaller as the power was increased. At powers below 5 Wand 3 W with argon and xenon, respectively, CAT was not able to light consistently. Similarly, at flow ratesbelow 5 sccm argon and 2 sccm xenon CAT was either starved of propellant or was barely able to light, butno plasma could be seen outside of the thruster. At flow rates above 20 sccm for argon and 8 sccm for xenonthe plume was no longer well-collimated. Neutral gas was exhausted in addition to the ions, disrupting theplume via charge-exchange collisions. At these higher flow rates the neutral background pressure within thechamber increased, and if power exceeded 15 W, led to secondary plasma formation around the antenna leads.This secondary plasma formation typically occurred when the background pressure (p) exceeded 5 × 10⁻⁴
Torr. Future tests in larger vacuum facilities with higher pumping speeds, such as the Large Vacuum TestFacility at the University of Michigan’s Plasma Dynamics and Electric Propulsion Laboratory, will enableinvestigation of higher power levels by mitigating this background pressure issue.
When the plume was well-collimated it exhibited a bluish hue, in contrast to a pinkish hue inside ofthe thruster, while running on both argon and xenon. For the plume in Figure 5 it is possible that thedifference in color is due to argon ion emission. However, it is also possible that this color shift is causedby sputtering of material from CAT or due to CAT-chamber interactions. To investigate this color shift ofthe argon discharge a residual gas analyzer (RGA) was attached to the chamber. The RGA provides an
6Joint Conference of 30th ISTS, 34th IEPC and 6th NSAT, Hyogo-Kobe, Japan
July 4–10, 2015
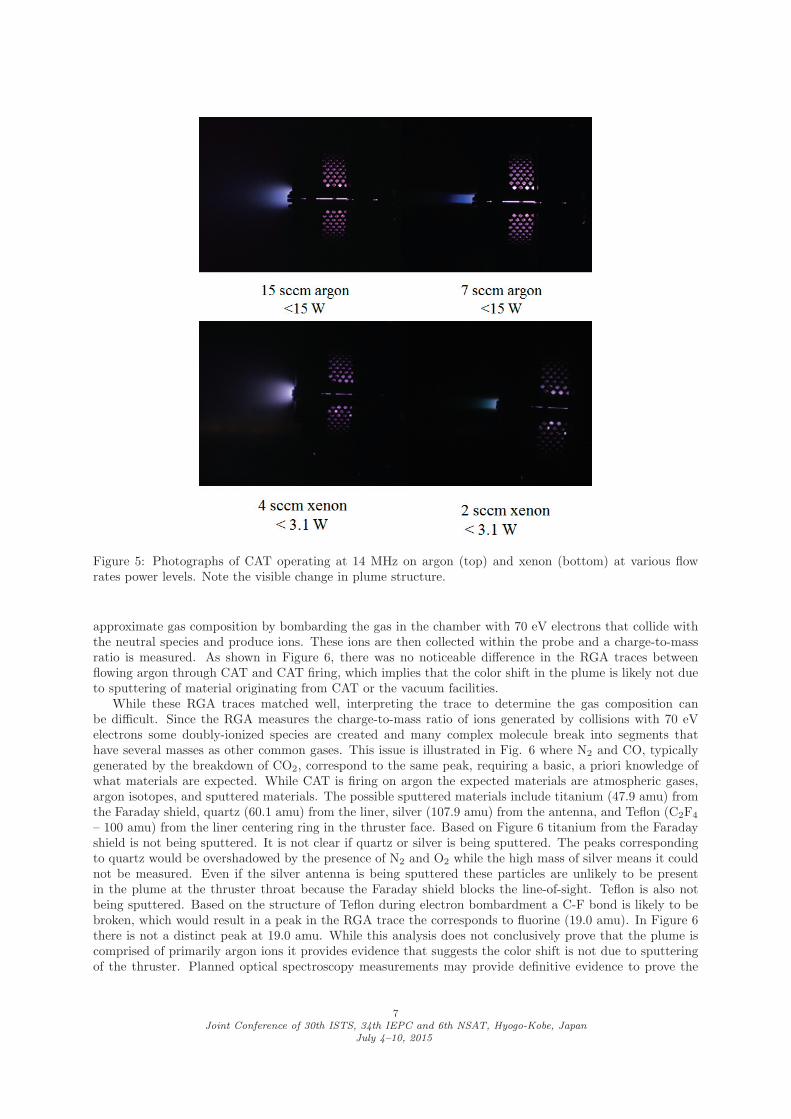
Figure 5: Photographs of CAT operating at 14 MHz on argon (top) and xenon (bottom) at various flowrates power levels. Note the visible change in plume structure.
approximate gas composition by bombarding the gas in the chamber with 70 eV electrons that collide withthe neutral species and produce ions. These ions are then collected within the probe and a charge-to-massratio is measured. As shown in Figure 6, there was no noticeable difference in the RGA traces betweenflowing argon through CAT and CAT firing, which implies that the color shift in the plume is likely not dueto sputtering of material originating from CAT or the vacuum facilities.
While these RGA traces matched well, interpreting the trace to determine the gas composition canbe difficult. Since the RGA measures the charge-to-mass ratio of ions generated by collisions with 70 eVelectrons some doubly-ionized species are created and many complex molecule break into segments thathave several masses as other common gases. This issue is illustrated in Fig. 6 where N2 and CO, typicallygenerated by the breakdown of CO2, correspond to the same peak, requiring a basic, a priori knowledge ofwhat materials are expected. While CAT is firing on argon the expected materials are atmospheric gases,argon isotopes, and sputtered materials. The possible sputtered materials include titanium (47.9 amu) fromthe Faraday shield, quartz (60.1 amu) from the liner, silver (107.9 amu) from the antenna, and Teflon (C2F4
– 100 amu) from the liner centering ring in the thruster face. Based on Figure 6 titanium from the Faradayshield is not being sputtered. It is not clear if quartz or silver is being sputtered. The peaks correspondingto quartz would be overshadowed by the presence of N2 and O2 while the high mass of silver means it couldnot be measured. Even if the silver antenna is being sputtered these particles are unlikely to be presentin the plume at the thruster throat because the Faraday shield blocks the line-of-sight. Teflon is also notbeing sputtered. Based on the structure of Teflon during electron bombardment a C-F bond is likely to bebroken, which would result in a peak in the RGA trace the corresponds to fluorine (19.0 amu). In Figure 6there is not a distinct peak at 19.0 amu. While this analysis does not conclusively prove that the plume iscomprised of primarily argon ions it provides evidence that suggests the color shift is not due to sputteringof the thruster. Planned optical spectroscopy measurements may provide definitive evidence to prove the
7Joint Conference of 30th ISTS, 34th IEPC and 6th NSAT, Hyogo-Kobe, Japan
July 4–10, 2015
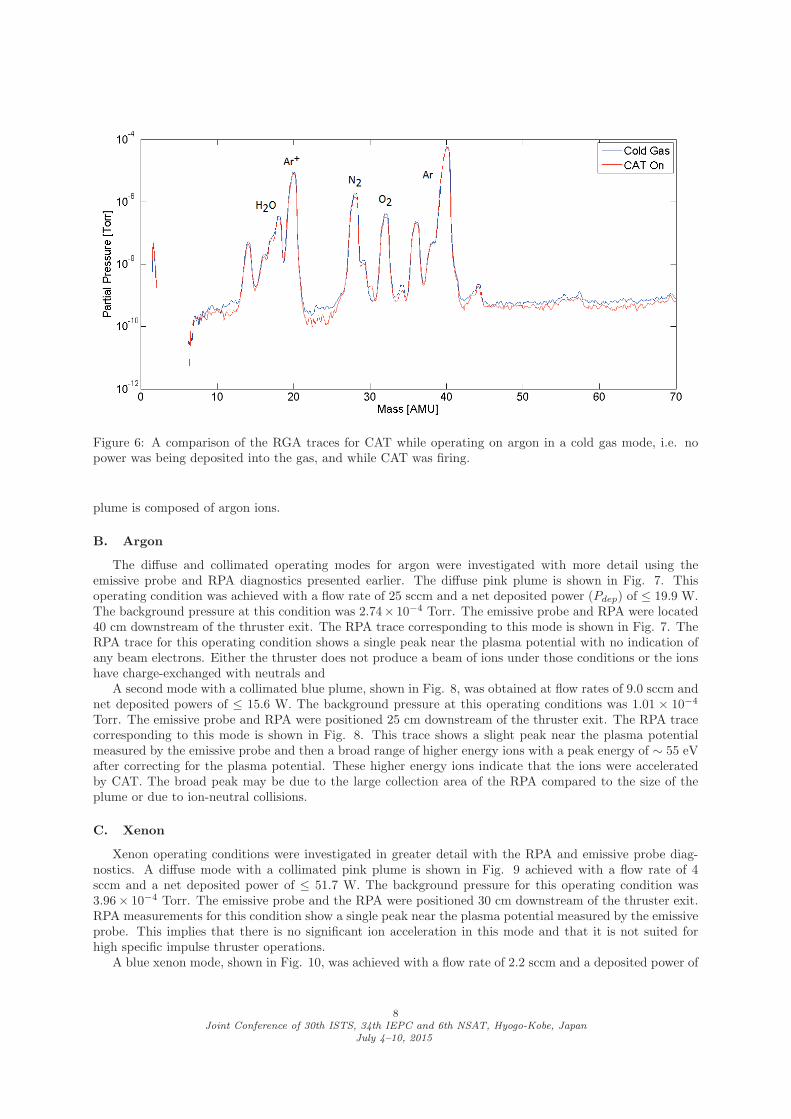
Figure 6: A comparison of the RGA traces for CAT while operating on argon in a cold gas mode, i.e. nopower was being deposited into the gas, and while CAT was firing.
plume is composed of argon ions.
B. Argon
The diffuse and collimated operating modes for argon were investigated with more detail using theemissive probe and RPA diagnostics presented earlier. The diffuse pink plume is shown in Fig. 7. Thisoperating condition was achieved with a flow rate of 25 sccm and a net deposited power (Pdep) of ≤ 19.9 W.The background pressure at this condition was 2.74× 10⁻⁴ Torr. The emissive probe and RPA were located40 cm downstream of the thruster exit. The RPA trace corresponding to this mode is shown in Fig. 7. TheRPA trace for this operating condition shows a single peak near the plasma potential with no indication ofany beam electrons. Either the thruster does not produce a beam of ions under those conditions or the ionshave charge-exchanged with neutrals and
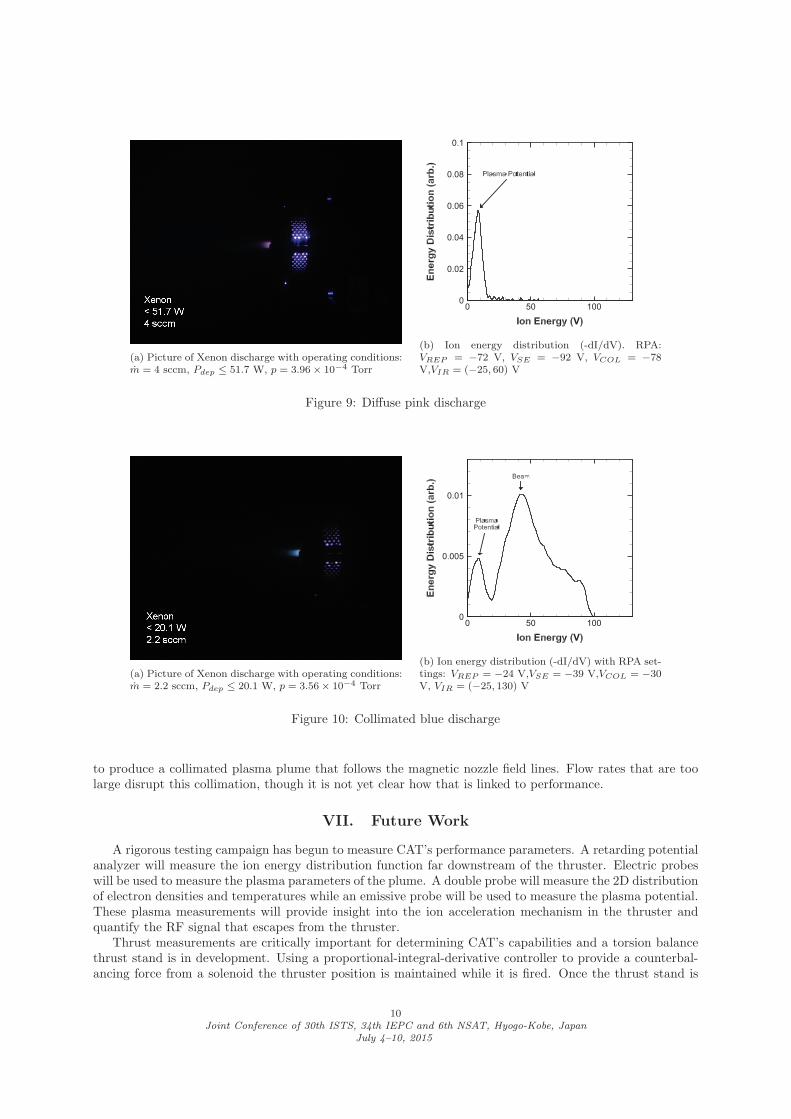
A second mode with a collimated blue plume, shown in Fig. 8, was obtained at flow rates of 9.0 sccm andnet deposited powers of ≤ 15.6 W. The background pressure at this operating conditions was 1.01 × 10⁻⁴
Torr. The emissive probe and RPA were positioned 25 cm downstream of the thruster exit. The RPA tracecorresponding to this mode is shown in Fig. 8. This trace shows a slight peak near the plasma potentialmeasured by the emissive probe and then a broad range of higher energy ions with a peak energy of ∼ 55 eVafter correcting for the plasma potential. These higher energy ions indicate that the ions were acceleratedby CAT. The broad peak may be due to the large collection area of the RPA compared to the size of theplume or due to ion-neutral collisions.
C. Xenon
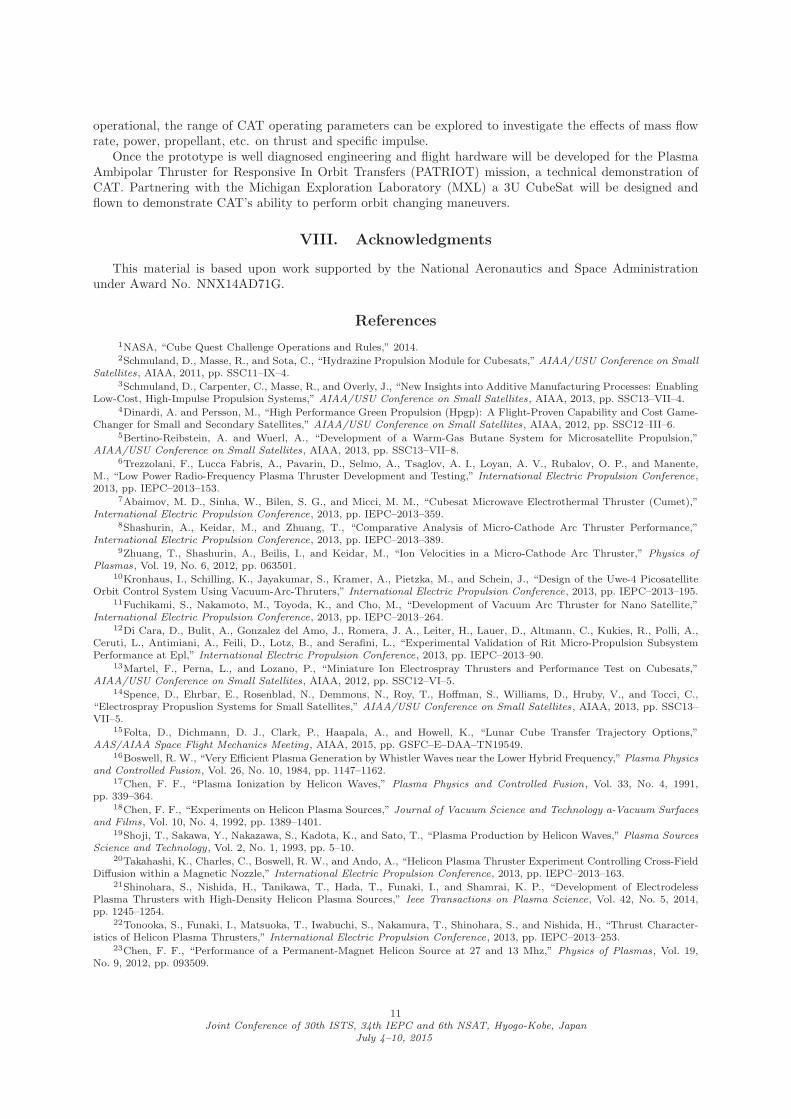
Xenon operating conditions were investigated in greater detail with the RPA and emissive probe diag-nostics. A diffuse mode with a collimated pink plume is shown in Fig. 9 achieved with a flow rate of 4sccm and a net deposited power of ≤ 51.7 W. The background pressure for this operating condition was3.96× 10−4 Torr. The emissive probe and the RPA were positioned 30 cm downstream of the thruster exit.RPA measurements for this condition show a single peak near the plasma potential measured by the emissiveprobe. This implies that there is no significant ion acceleration in this mode and that it is not suited forhigh specific impulse thruster operations.
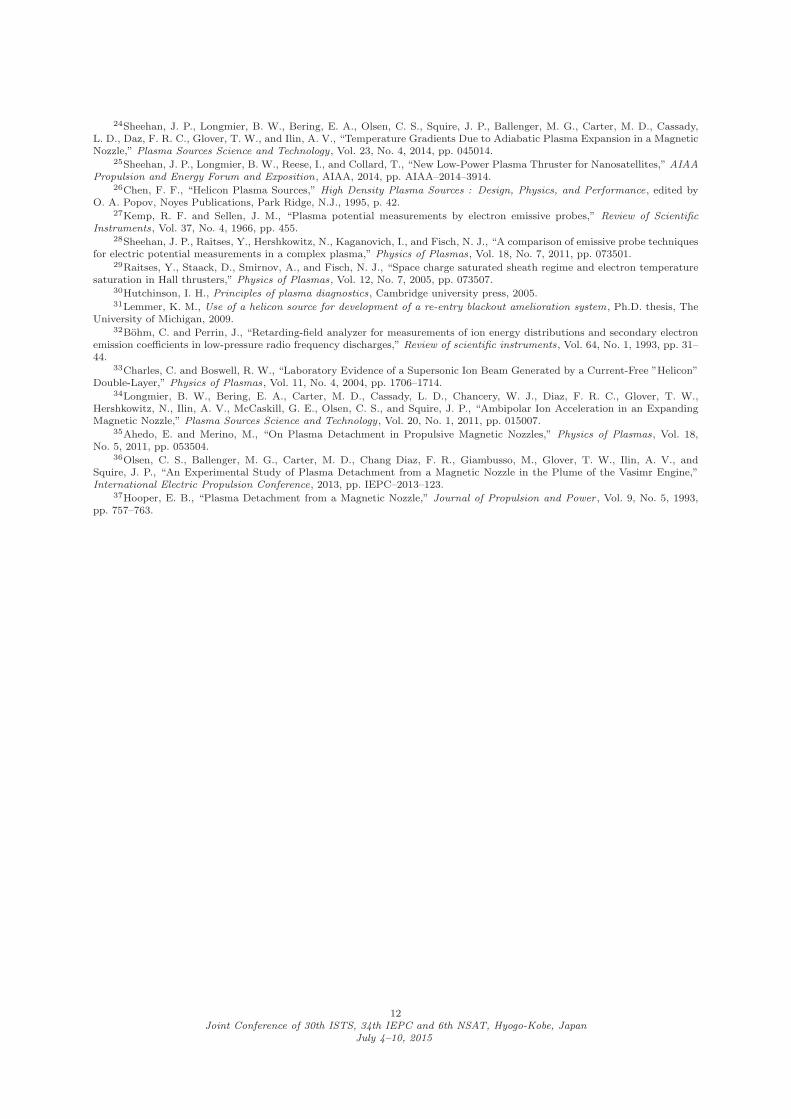
A blue xenon mode, shown in Fig. 10, was achieved with a flow rate of 2.2 sccm and a deposited power of
8Joint Conference of 30th ISTS, 34th IEPC and 6th NSAT, Hyogo-Kobe, Japan
July 4–10, 2015
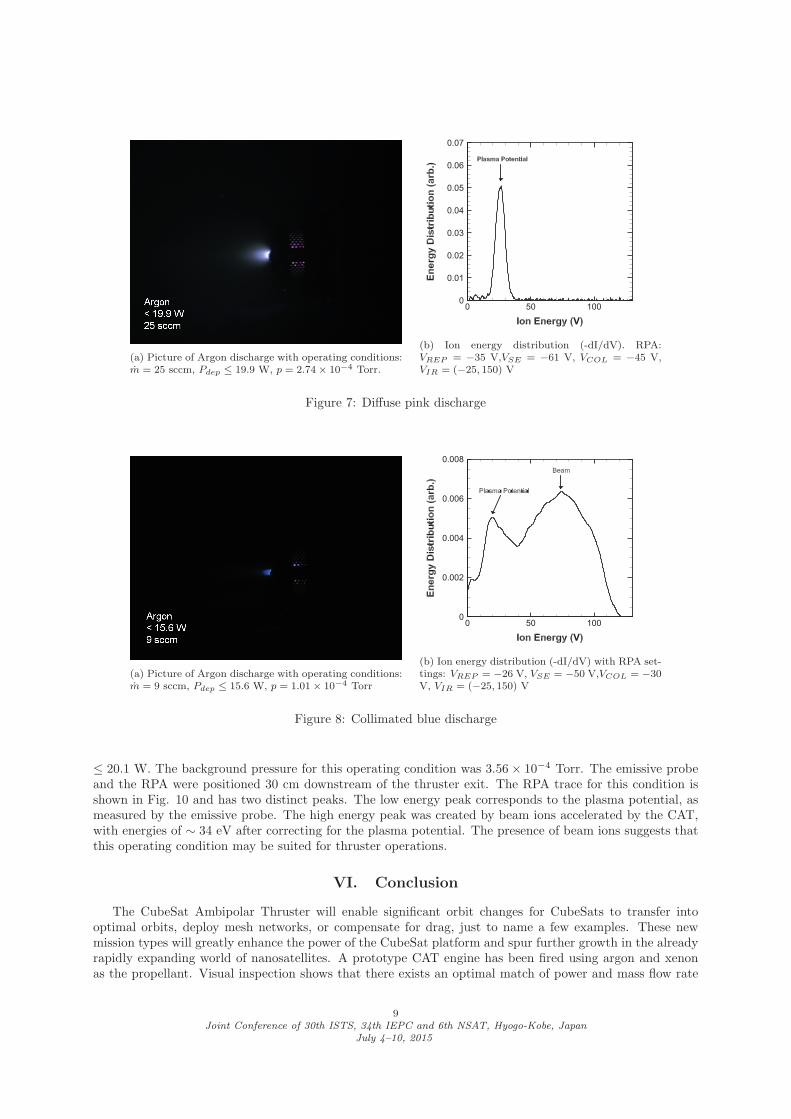
(a) Picture of Argon discharge with operating conditions:m = 25 sccm, Pdep ≤ 19.9 W, p = 2.74× 10⁻⁴ Torr.
0 50 1000
0.01
0.02
0.03
0.04
0.05
0.06
0.07
(b) Ion energy distribution (-dI/dV). RPA:VREP = −35 V,VSE = −61 V, VCOL = −45 V,VIR = (−25, 150) V
Figure 7: Diffuse pink discharge
(a) Picture of Argon discharge with operating conditions:m = 9 sccm, Pdep ≤ 15.6 W, p = 1.01× 10⁻⁴ Torr
0 50 1000
0.002
0.004
0.006
0.008
(b) Ion energy distribution (-dI/dV) with RPA set-tings: VREP = −26 V, VSE = −50 V,VCOL = −30V, VIR = (−25, 150) V
Figure 8: Collimated blue discharge
≤ 20.1 W. The background pressure for this operating condition was 3.56× 10⁻⁴ Torr. The emissive probeand the RPA were positioned 30 cm downstream of the thruster exit. The RPA trace for this condition isshown in Fig. 10 and has two distinct peaks. The low energy peak corresponds to the plasma potential, asmeasured by the emissive probe. The high energy peak was created by beam ions accelerated by the CAT,with energies of ∼ 34 eV after correcting for the plasma potential. The presence of beam ions suggests thatthis operating condition may be suited for thruster operations.
VI. Conclusion
The CubeSat Ambipolar Thruster will enable significant orbit changes for CubeSats to transfer intooptimal orbits, deploy mesh networks, or compensate for drag, just to name a few examples. These newmission types will greatly enhance the power of the CubeSat platform and spur further growth in the alreadyrapidly expanding world of nanosatellites. A prototype CAT engine has been fired using argon and xenonas the propellant. Visual inspection shows that there exists an optimal match of power and mass flow rate
9Joint Conference of 30th ISTS, 34th IEPC and 6th NSAT, Hyogo-Kobe, Japan
July 4–10, 2015
(a) Picture of Xenon discharge with operating conditions:m = 4 sccm, Pdep ≤ 51.7 W, p = 3.96× 10⁻⁴ Torr
0 50 1000
0.02
0.04
0.06
0.08
0.1
(b) Ion energy distribution (-dI/dV). RPA:VREP = −72 V, VSE = −92 V, VCOL = −78V,VIR = (−25, 60) V
Figure 9: Diffuse pink discharge
(a) Picture of Xenon discharge with operating conditions:m = 2.2 sccm, Pdep ≤ 20.1 W, p = 3.56× 10⁻⁴ Torr
0 50 1000
0.005
0.01
(b) Ion energy distribution (-dI/dV) with RPA set-tings: VREP = −24 V,VSE = −39 V,VCOL = −30V, VIR = (−25, 130) V
Figure 10: Collimated blue discharge
to produce a collimated plasma plume that follows the magnetic nozzle field lines. Flow rates that are toolarge disrupt this collimation, though it is not yet clear how that is linked to performance.
VII. Future Work
A rigorous testing campaign has begun to measure CAT’s performance parameters. A retarding potentialanalyzer will measure the ion energy distribution function far downstream of the thruster. Electric probeswill be used to measure the plasma parameters of the plume. A double probe will measure the 2D distributionof electron densities and temperatures while an emissive probe will be used to measure the plasma potential.These plasma measurements will provide insight into the ion acceleration mechanism in the thruster andquantify the RF signal that escapes from the thruster.
Thrust measurements are critically important for determining CAT’s capabilities and a torsion balancethrust stand is in development. Using a proportional-integral-derivative controller to provide a counterbal-ancing force from a solenoid the thruster position is maintained while it is fired. Once the thrust stand is
10Joint Conference of 30th ISTS, 34th IEPC and 6th NSAT, Hyogo-Kobe, Japan
July 4–10, 2015
operational, the range of CAT operating parameters can be explored to investigate the effects of mass flowrate, power, propellant, etc. on thrust and specific impulse.
Once the prototype is well diagnosed engineering and flight hardware will be developed for the PlasmaAmbipolar Thruster for Responsive In Orbit Transfers (PATRIOT) mission, a technical demonstration ofCAT. Partnering with the Michigan Exploration Laboratory (MXL) a 3U CubeSat will be designed andflown to demonstrate CAT’s ability to perform orbit changing maneuvers.
VIII. Acknowledgments
This material is based upon work supported by the National Aeronautics and Space Administrationunder Award No. NNX14AD71G.
References
1NASA, “Cube Quest Challenge Operations and Rules,” 2014.2Schmuland, D., Masse, R., and Sota, C., “Hydrazine Propulsion Module for Cubesats,” AIAA/USU Conference on Small
Satellites, AIAA, 2011, pp. SSC11–IX–4.3Schmuland, D., Carpenter, C., Masse, R., and Overly, J., “New Insights into Additive Manufacturing Processes: Enabling
Low-Cost, High-Impulse Propulsion Systems,” AIAA/USU Conference on Small Satellites, AIAA, 2013, pp. SSC13–VII–4.4Dinardi, A. and Persson, M., “High Performance Green Propulsion (Hpgp): A Flight-Proven Capability and Cost Game-
Changer for Small and Secondary Satellites,” AIAA/USU Conference on Small Satellites, AIAA, 2012, pp. SSC12–III–6.5Bertino-Reibstein, A. and Wuerl, A., “Development of a Warm-Gas Butane System for Microsatellite Propulsion,”
AIAA/USU Conference on Small Satellites, AIAA, 2013, pp. SSC13–VII–8.6Trezzolani, F., Lucca Fabris, A., Pavarin, D., Selmo, A., Tsaglov, A. I., Loyan, A. V., Rubalov, O. P., and Manente,
M., “Low Power Radio-Frequency Plasma Thruster Development and Testing,” International Electric Propulsion Conference,2013, pp. IEPC–2013–153.
7Abaimov, M. D., Sinha, W., Bilen, S. G., and Micci, M. M., “Cubesat Microwave Electrothermal Thruster (Cumet),”International Electric Propulsion Conference, 2013, pp. IEPC–2013–359.
8Shashurin, A., Keidar, M., and Zhuang, T., “Comparative Analysis of Micro-Cathode Arc Thruster Performance,”International Electric Propulsion Conference, 2013, pp. IEPC–2013–389.
9Zhuang, T., Shashurin, A., Beilis, I., and Keidar, M., “Ion Velocities in a Micro-Cathode Arc Thruster,” Physics ofPlasmas, Vol. 19, No. 6, 2012, pp. 063501.
10Kronhaus, I., Schilling, K., Jayakumar, S., Kramer, A., Pietzka, M., and Schein, J., “Design of the Uwe-4 PicosatelliteOrbit Control System Using Vacuum-Arc-Thruters,” International Electric Propulsion Conference, 2013, pp. IEPC–2013–195.
11Fuchikami, S., Nakamoto, M., Toyoda, K., and Cho, M., “Development of Vacuum Arc Thruster for Nano Satellite,”International Electric Propulsion Conference, 2013, pp. IEPC–2013–264.
12Di Cara, D., Bulit, A., Gonzalez del Amo, J., Romera, J. A., Leiter, H., Lauer, D., Altmann, C., Kukies, R., Polli, A.,Ceruti, L., Antimiani, A., Feili, D., Lotz, B., and Serafini, L., “Experimental Validation of Rit Micro-Propulsion SubsystemPerformance at Epl,” International Electric Propulsion Conference, 2013, pp. IEPC–2013–90.
13Martel, F., Perna, L., and Lozano, P., “Miniature Ion Electrospray Thrusters and Performance Test on Cubesats,”AIAA/USU Conference on Small Satellites, AIAA, 2012, pp. SSC12–VI–5.
14Spence, D., Ehrbar, E., Rosenblad, N., Demmons, N., Roy, T., Hoffman, S., Williams, D., Hruby, V., and Tocci, C.,“Electrospray Propuslion Systems for Small Satellites,” AIAA/USU Conference on Small Satellites, AIAA, 2013, pp. SSC13–VII–5.
15Folta, D., Dichmann, D. J., Clark, P., Haapala, A., and Howell, K., “Lunar Cube Transfer Trajectory Options,”AAS/AIAA Space Flight Mechanics Meeting , AIAA, 2015, pp. GSFC–E–DAA–TN19549.
16Boswell, R. W., “Very Efficient Plasma Generation by Whistler Waves near the Lower Hybrid Frequency,” Plasma Physicsand Controlled Fusion, Vol. 26, No. 10, 1984, pp. 1147–1162.
17Chen, F. F., “Plasma Ionization by Helicon Waves,” Plasma Physics and Controlled Fusion, Vol. 33, No. 4, 1991,pp. 339–364.
18Chen, F. F., “Experiments on Helicon Plasma Sources,” Journal of Vacuum Science and Technology a-Vacuum Surfacesand Films, Vol. 10, No. 4, 1992, pp. 1389–1401.
19Shoji, T., Sakawa, Y., Nakazawa, S., Kadota, K., and Sato, T., “Plasma Production by Helicon Waves,” Plasma SourcesScience and Technology , Vol. 2, No. 1, 1993, pp. 5–10.
20Takahashi, K., Charles, C., Boswell, R. W., and Ando, A., “Helicon Plasma Thruster Experiment Controlling Cross-FieldDiffusion within a Magnetic Nozzle,” International Electric Propulsion Conference, 2013, pp. IEPC–2013–163.
21Shinohara, S., Nishida, H., Tanikawa, T., Hada, T., Funaki, I., and Shamrai, K. P., “Development of ElectrodelessPlasma Thrusters with High-Density Helicon Plasma Sources,” Ieee Transactions on Plasma Science, Vol. 42, No. 5, 2014,pp. 1245–1254.
22Tonooka, S., Funaki, I., Matsuoka, T., Iwabuchi, S., Nakamura, T., Shinohara, S., and Nishida, H., “Thrust Character-istics of Helicon Plasma Thrusters,” International Electric Propulsion Conference, 2013, pp. IEPC–2013–253.
23Chen, F. F., “Performance of a Permanent-Magnet Helicon Source at 27 and 13 Mhz,” Physics of Plasmas, Vol. 19,No. 9, 2012, pp. 093509.
11Joint Conference of 30th ISTS, 34th IEPC and 6th NSAT, Hyogo-Kobe, Japan
July 4–10, 2015
24Sheehan, J. P., Longmier, B. W., Bering, E. A., Olsen, C. S., Squire, J. P., Ballenger, M. G., Carter, M. D., Cassady,L. D., Daz, F. R. C., Glover, T. W., and Ilin, A. V., “Temperature Gradients Due to Adiabatic Plasma Expansion in a MagneticNozzle,” Plasma Sources Science and Technology , Vol. 23, No. 4, 2014, pp. 045014.
25Sheehan, J. P., Longmier, B. W., Reese, I., and Collard, T., “New Low-Power Plasma Thruster for Nanosatellites,” AIAAPropulsion and Energy Forum and Exposition, AIAA, 2014, pp. AIAA–2014–3914.
26Chen, F. F., “Helicon Plasma Sources,” High Density Plasma Sources : Design, Physics, and Performance, edited byO. A. Popov, Noyes Publications, Park Ridge, N.J., 1995, p. 42.
27Kemp, R. F. and Sellen, J. M., “Plasma potential measurements by electron emissive probes,” Review of ScientificInstruments, Vol. 37, No. 4, 1966, pp. 455.
28Sheehan, J. P., Raitses, Y., Hershkowitz, N., Kaganovich, I., and Fisch, N. J., “A comparison of emissive probe techniquesfor electric potential measurements in a complex plasma,” Physics of Plasmas, Vol. 18, No. 7, 2011, pp. 073501.
29Raitses, Y., Staack, D., Smirnov, A., and Fisch, N. J., “Space charge saturated sheath regime and electron temperaturesaturation in Hall thrusters,” Physics of Plasmas, Vol. 12, No. 7, 2005, pp. 073507.
30Hutchinson, I. H., Principles of plasma diagnostics, Cambridge university press, 2005.31Lemmer, K. M., Use of a helicon source for development of a re-entry blackout amelioration system, Ph.D. thesis, The
University of Michigan, 2009.32Bohm, C. and Perrin, J., “Retarding-field analyzer for measurements of ion energy distributions and secondary electron
emission coefficients in low-pressure radio frequency discharges,” Review of scientific instruments, Vol. 64, No. 1, 1993, pp. 31–44.
33Charles, C. and Boswell, R. W., “Laboratory Evidence of a Supersonic Ion Beam Generated by a Current-Free ”Helicon”Double-Layer,” Physics of Plasmas, Vol. 11, No. 4, 2004, pp. 1706–1714.
34Longmier, B. W., Bering, E. A., Carter, M. D., Cassady, L. D., Chancery, W. J., Diaz, F. R. C., Glover, T. W.,Hershkowitz, N., Ilin, A. V., McCaskill, G. E., Olsen, C. S., and Squire, J. P., “Ambipolar Ion Acceleration in an ExpandingMagnetic Nozzle,” Plasma Sources Science and Technology , Vol. 20, No. 1, 2011, pp. 015007.
35Ahedo, E. and Merino, M., “On Plasma Detachment in Propulsive Magnetic Nozzles,” Physics of Plasmas, Vol. 18,No. 5, 2011, pp. 053504.
36Olsen, C. S., Ballenger, M. G., Carter, M. D., Chang Diaz, F. R., Giambusso, M., Glover, T. W., Ilin, A. V., andSquire, J. P., “An Experimental Study of Plasma Detachment from a Magnetic Nozzle in the Plume of the Vasimr Engine,”International Electric Propulsion Conference, 2013, pp. IEPC–2013–123.
37Hooper, E. B., “Plasma Detachment from a Magnetic Nozzle,” Journal of Propulsion and Power , Vol. 9, No. 5, 1993,pp. 757–763.
12Joint Conference of 30th ISTS, 34th IEPC and 6th NSAT, Hyogo-Kobe, Japan
July 4–10, 2015