Embed Size (px)
Citation preview
INHIBITION OF CLOSTRIDIUM BOTULINUM IN REDUCED-SODIUM PASTEURIZED PROCESS CHEESE PRODUCTS
CDR Industry Team Research Forum November 10, 2015
1
University of Wisconsin-Madison Kathleen Glass, Food Research Institute
Acknowledgements: Funding DRI Laboratory Staff: Ming Mu, Subash Shrestha, Brandon Wanless, Max Golden
Former staff: Russ McMinn, Lindsey McDonnell
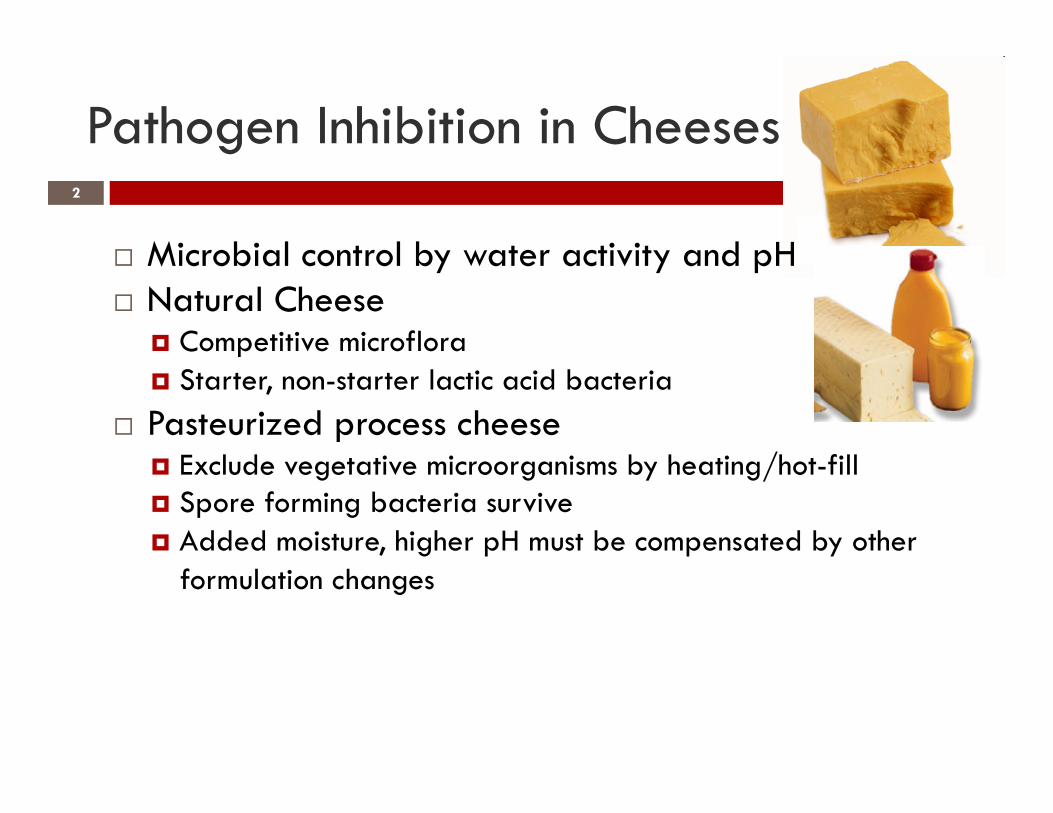
Pathogen Inhibition in Cheeses
! Microbial control by water activity and pH ! Natural Cheese
! Competitive microflora ! Starter, non-starter lactic acid bacteria
! Pasteurized process cheese ! Exclude vegetative microorganisms by heating/hot-fill ! Spore forming bacteria survive ! Added moisture, higher pH must be compensated by other
formulation changes
2
3
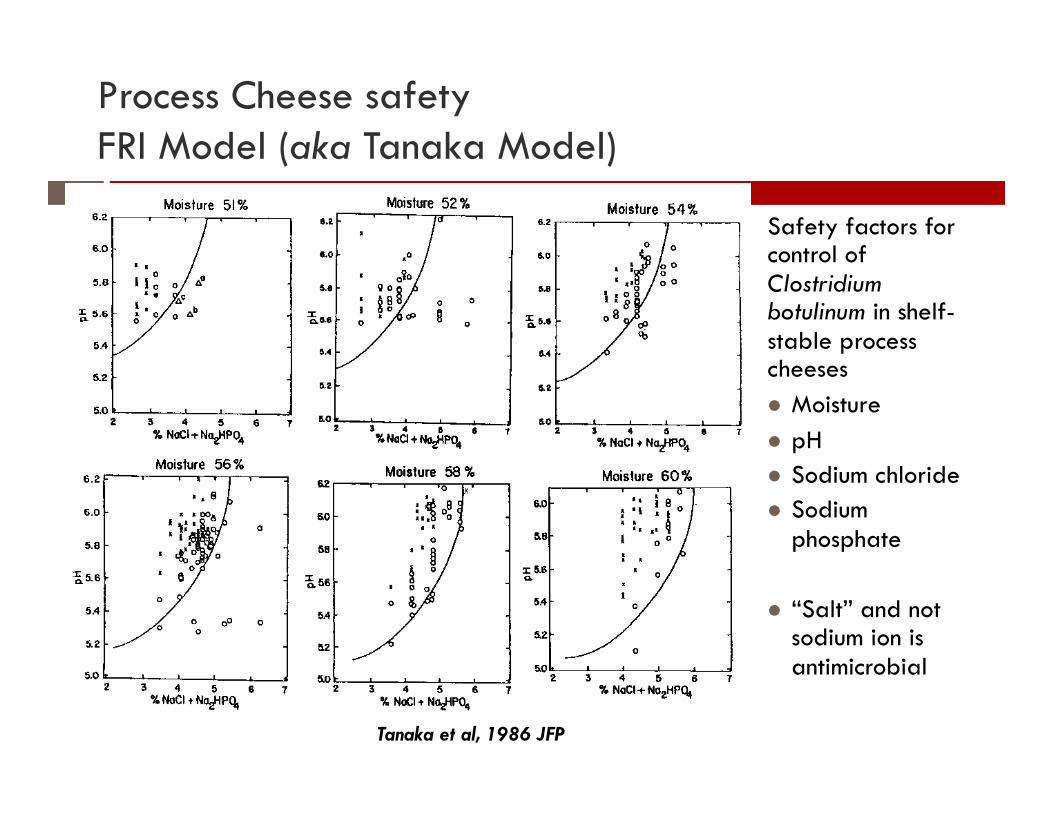
Process Cheese safety FRI Model (aka Tanaka Model)
Safety factors for control of Clostridium botulinum in shelf-stable process cheeses " Moisture " pH " Sodium chloride " Sodium
phosphate
" “Salt” and not sodium ion is antimicrobial
Tanaka et al, 1986 JFP
4
Critical use of the FRI Model
! Applicable to standard-of-identity process cheese spreads (21 CFR 133) ! Full-fat (~18-22% fat) ! >51% Cheddar cheese
# Typically contains 1.2-1.4% lactate
! Disodium phosphate emulsifier ! Sodium-based salts
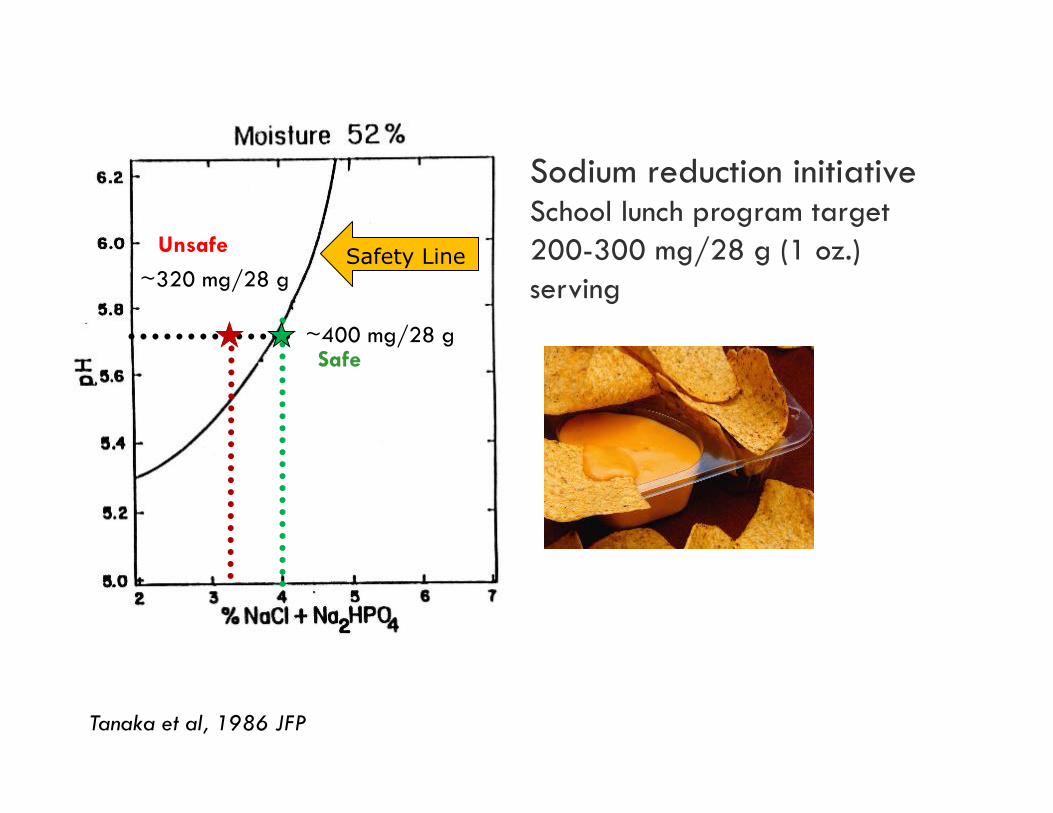
Sodium reduction initiative School lunch program target 200-300 mg/28 g (1 oz.) serving
Unsafe
Tanaka et al, 1986 JFP
~400 mg/28 g
~320 mg/28 g Safety Line
Safe

Other factors affecting safety
Increase safety Decrease safety No effect or Unknown effect
Low water activity High water activity Substituting cheese with other dairy solids
Reduced fat
High fat/high-moisture Substituting milkfat with vegetable fat
Lactate (lactic acid or Na/K lactate)
Removal of lactate or other antimicrobial
Substituting Na-salts with K-salts
Sorbate (sorbic acid or potassium sorbate)
Small diameter, brined vegetable or dried, thin particulates
Nisin
Certain polyphosphates
6
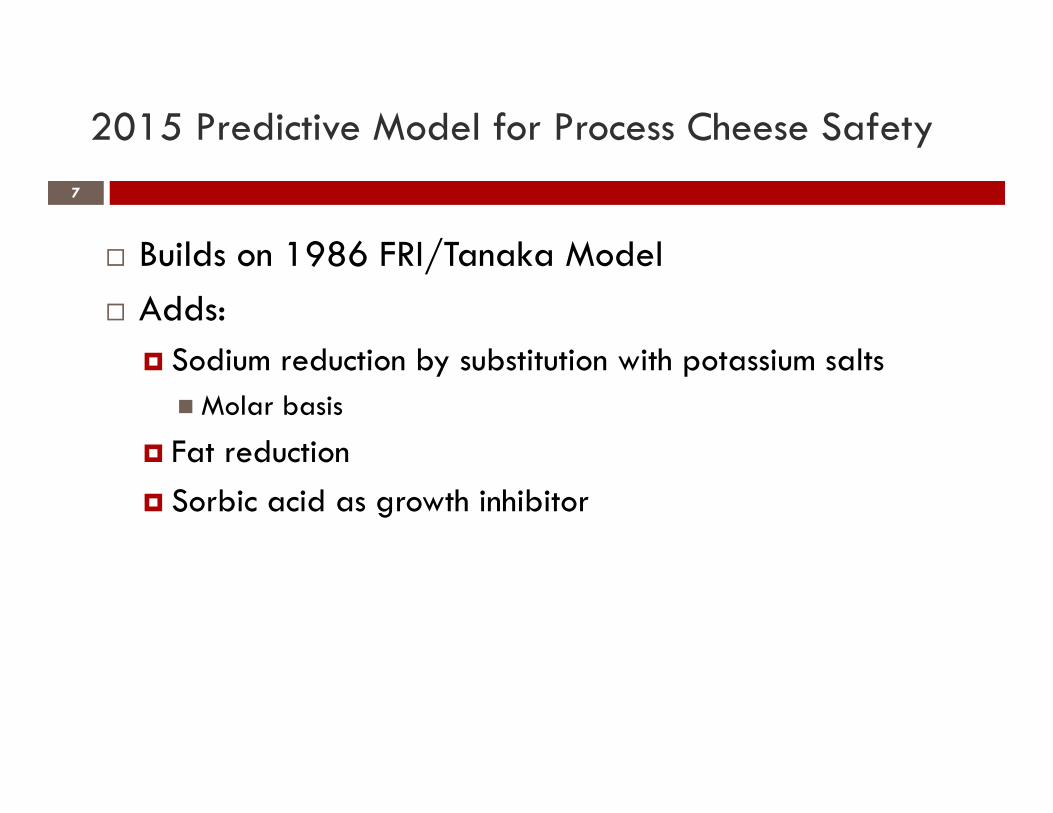
2015 Predictive Model for Process Cheese Safety 7
! Builds on 1986 FRI/Tanaka Model ! Adds:
! Sodium reduction by substitution with potassium salts # Molar basis
! Fat reduction ! Sorbic acid as growth inhibitor
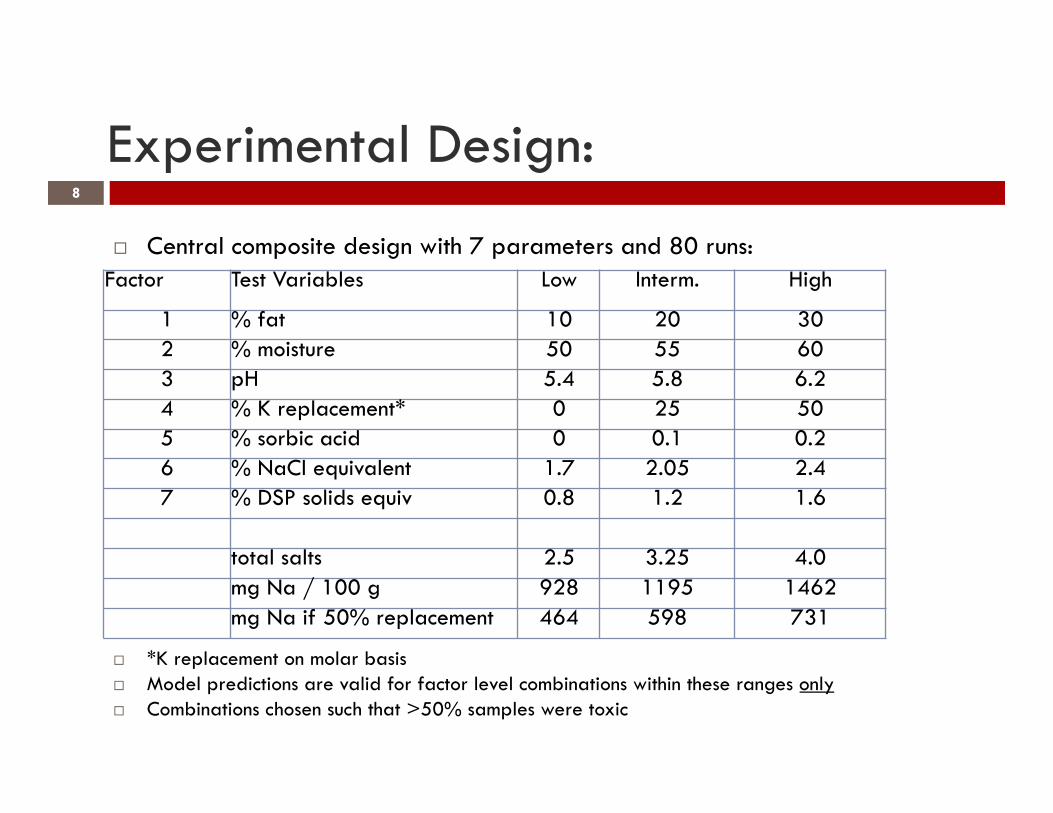
Experimental Design:
! Central composite design with 7 parameters and 80 runs:
! *K replacement on molar basis ! Model predictions are valid for factor level combinations within these ranges only ! Combinations chosen such that >50% samples were toxic
8
Factor Test Variables Low Interm. High
1 % fat 10 20 30 2 % moisture 50 55 60 3 pH 5.4 5.8 6.2 4 % K replacement* 0 25 50 5 % sorbic acid 0 0.1 0.2 6 % NaCl equivalent 1.7 2.05 2.4 7 % DSP solids equiv 0.8 1.2 1.6
total salts 2.5 3.25 4.0 mg Na / 100 g 928 1195 1462 mg Na if 50% replacement 464 598 731
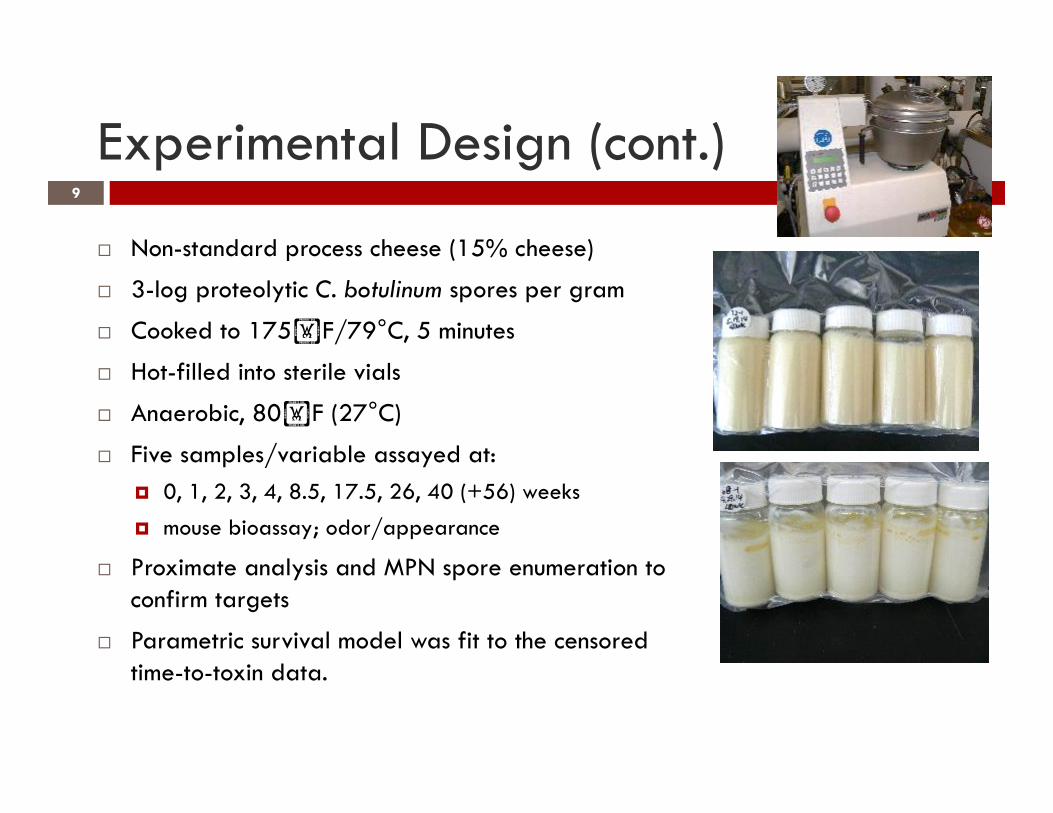
Experimental Design (cont.)
! Non-standard process cheese (15% cheese)
! 3-log proteolytic C. botulinum spores per gram
! Cooked to 175F/79°C, 5 minutes
! Hot-filled into sterile vials
! Anaerobic, 80F (27°C)
! Five samples/variable assayed at: ! 0, 1, 2, 3, 4, 8.5, 17.5, 26, 40 (+56) weeks
! mouse bioassay; odor/appearance
! Proximate analysis and MPN spore enumeration to confirm targets
! Parametric survival model was fit to the censored time-to-toxin data.
9
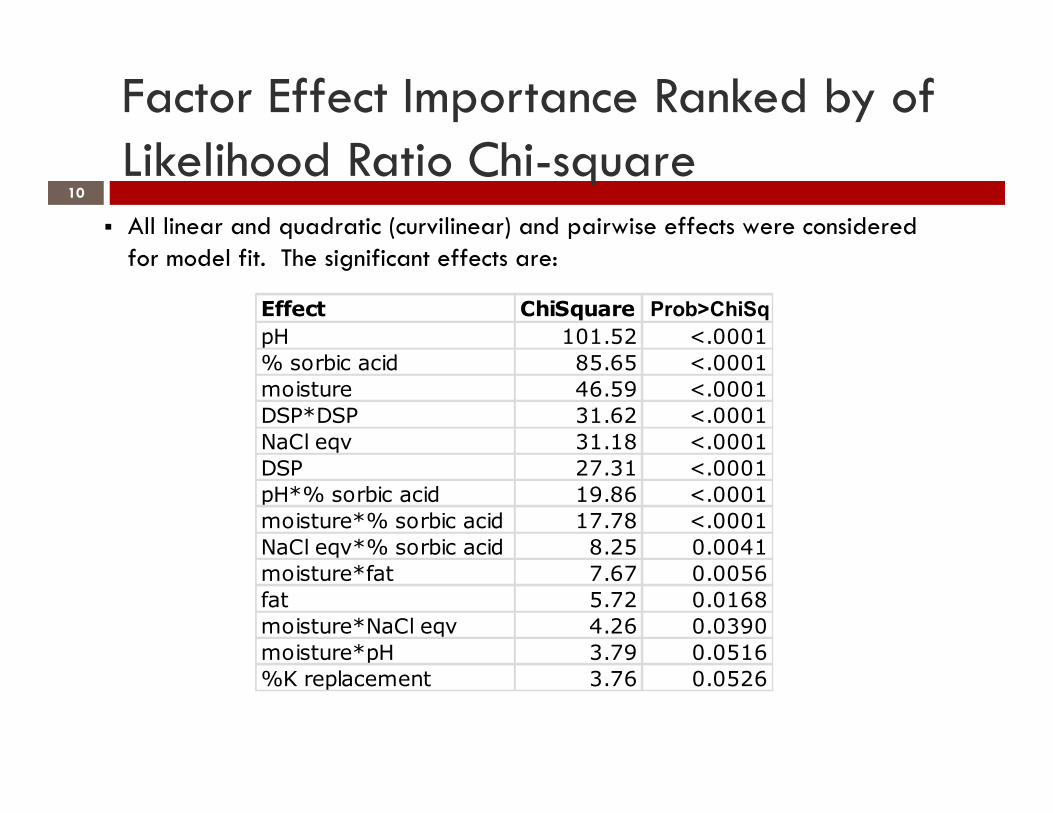
Factor Effect Importance Ranked by of Likelihood Ratio Chi-square
10
$ All linear and quadratic (curvilinear) and pairwise effects were considered for model fit. The significant effects are:
Effect ChiSquare Prob>ChiSqpH 101.52 <.0001% sorbic acid 85.65 <.0001moisture 46.59 <.0001DSP*DSP 31.62 <.0001NaCl eqv 31.18 <.0001DSP 27.31 <.0001pH*% sorbic acid 19.86 <.0001moisture*% sorbic acid 17.78 <.0001NaCl eqv*% sorbic acid 8.25 0.0041moisture*fat 7.67 0.0056fat 5.72 0.0168moisture*NaCl eqv 4.26 0.0390moisture*pH 3.79 0.0516%K replacement 3.76 0.0526
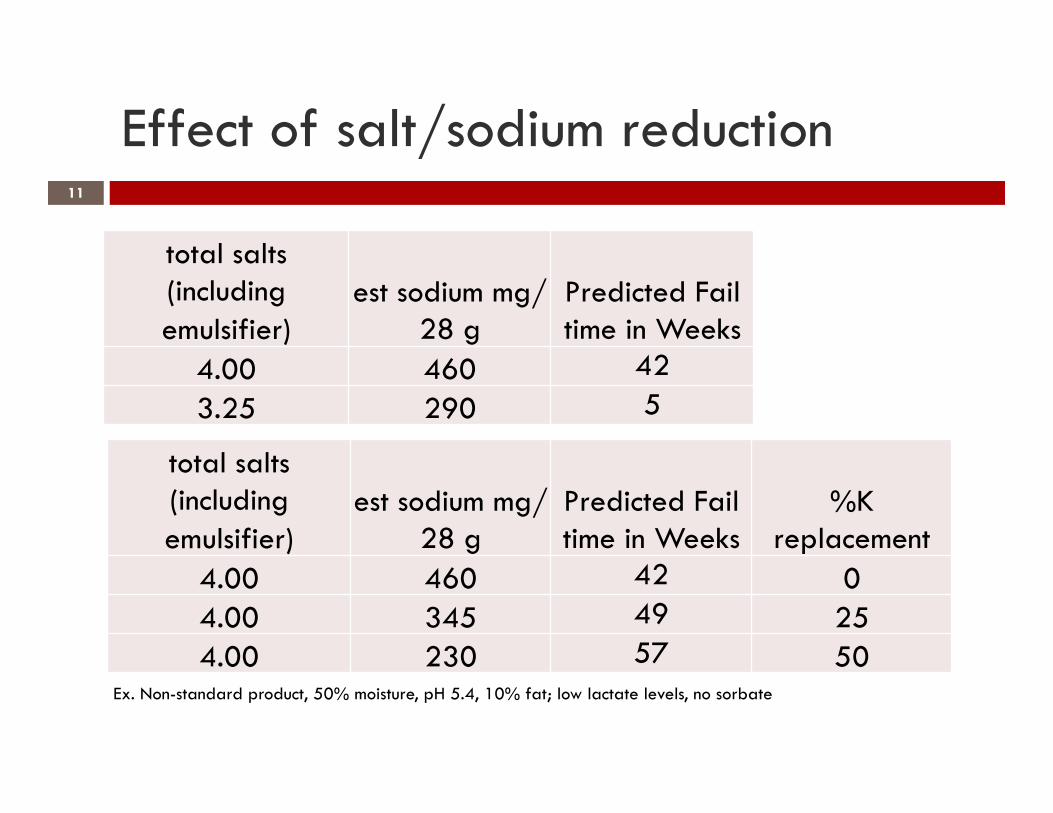
Effect of salt/sodium reduction 11
total salts (including emulsifier)
est sodium mg/28 g
Predicted Fail time in Weeks
4.00 460 42 3.25 290 5
total salts (including emulsifier)
est sodium mg/28 g
Predicted Fail time in Weeks
%K replacement
4.00 460 42 0 4.00 345 49 25 4.00 230 57 50
Ex. Non-standard product, 50% moisture, pH 5.4, 10% fat; low lactate levels, no sorbate
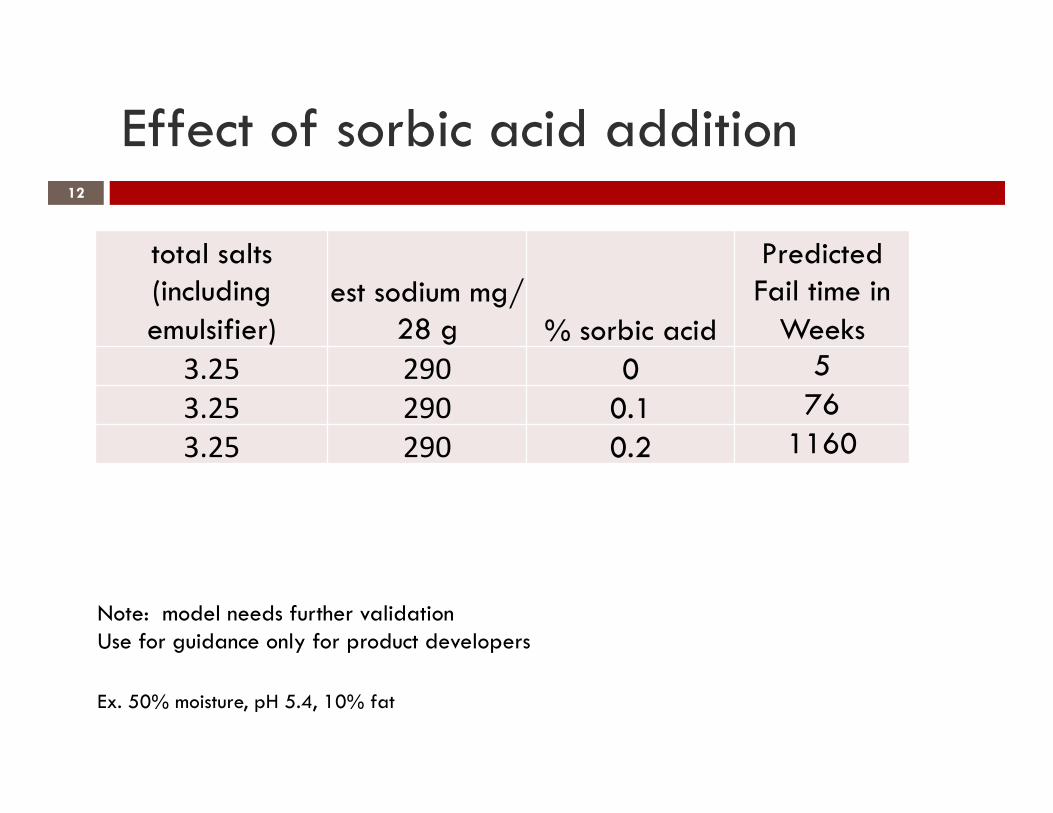
Effect of sorbic acid addition 12
Ex. 50% moisture, pH 5.4, 10% fat
total salts (including emulsifier)
est sodium mg/28 g % sorbic acid
Predicted Fail time in
Weeks 3.25 290 0 5 3.25 290 0.1 76 3.25 290 0.2 1160
Note: model needs further validation Use for guidance only for product developers
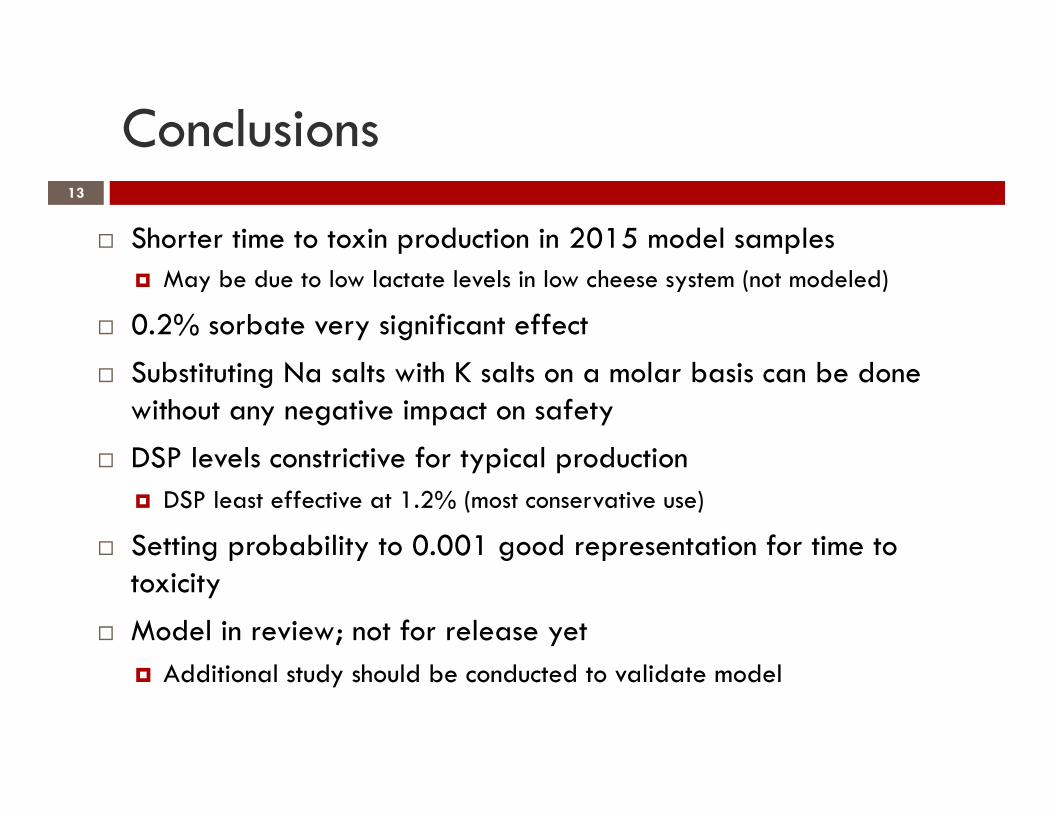
Conclusions
! Shorter time to toxin production in 2015 model samples ! May be due to low lactate levels in low cheese system (not modeled)
! 0.2% sorbate very significant effect
! Substituting Na salts with K salts on a molar basis can be done without any negative impact on safety
! DSP levels constrictive for typical production ! DSP least effective at 1.2% (most conservative use)
! Setting probability to 0.001 good representation for time to toxicity
! Model in review; not for release yet ! Additional study should be conducted to validate model
13
Acknowledgements
! Co-Authors (significant contributions to production, testing and data analysis) ! FRI: Ming Mu ! Kraft Heinz Company: Frank Rossi, Brian LeVine
! Technical assistance ! FRI: Max Golden, Brandon Wanless, Russell McMinn, Subash Shrestha, Lindsey O’Brien, Quinn Huibregtse,
Emily Merry, and Shanna Sticka ! Wisconsin Center for Dairy Research: Juan Romero
! Kraft Heinz Company: Robert Carter
! Food Safety Curves Task Force ! Chair: Nigel Kirtley, Kraft Heinz Company ! Coordinator: David McCoy, Dairy Research Inc.
! This research was funded by contributions by members of the Food Safety Curves Task Force to Dairy Research Inc. and by unrestricted gifts to the Food Research Institute, University of Wisconsin-Madison ! Sponsoring companies included ICL Food Specialties, Kraft Heinz Company, Great Lakes Foods,
Schreiber Foods, Inc., and Land O’Lakes.
14