Embed Size (px)
Citation preview
An Introduction to
Infrared AERIAL PHOTOGRAPH] For many uses, th is new technique is unsurpassed as a too
for immediate and long-range planning in agriculture
SFRARED AERIAL PHOTOGRAPHY is I a relatively recent development for use in the agricultural field. Stereo- scopic coverage taken by means of cor- rect film-and-filter combinations, from various altitudes up to 20,000 feet, provides information that can aid ma- terially in:
Crop yield forecasting Crop vigor determinations Crop deficiency determinations Evaluation of crop response to
Soil typing Soil suitability evaluations Water evaluations, especially in
Irrigation and drainage studies
specific amendments
terms of water-logging
Nitrogen evaluations Other fertilizer evalu '1 t ' 1011s
Disease determinations during early stages of onset
Detecting specific insect infes- tations during early stages of onset
Weed infestation determina- tions
Insecticide-pesticide response evaluations
Seeding and test-plot studies Foreign contamination deter-
minations Certain subsurface determina-
tions Delineating specific, but fewer
and more meaningful areas for soil sampling.
When correctly applied, the in- frared aerial photography technique is probably unsurpassed as an imme- diate and long-range planning tool in agriculture.
Aerial photographs have been used in the field of natural resources for many years. Conventional aerial photography based on panchromatic (black and white) film and a minus blue filter has been used to define old stream-beds, planting irregularities, cropping patterns, and acreage deline- ations, and for timber cruising or es- timating and the measurement of out- croppings ( I ) . These characteristics are more clearly distinguished when the eyes are at 6000 feet above ter- rain than when they are at six feet.
One reason for this is that broader
536 A G R I C U L T U R A L A N D F O O D C H E M I S T R Y
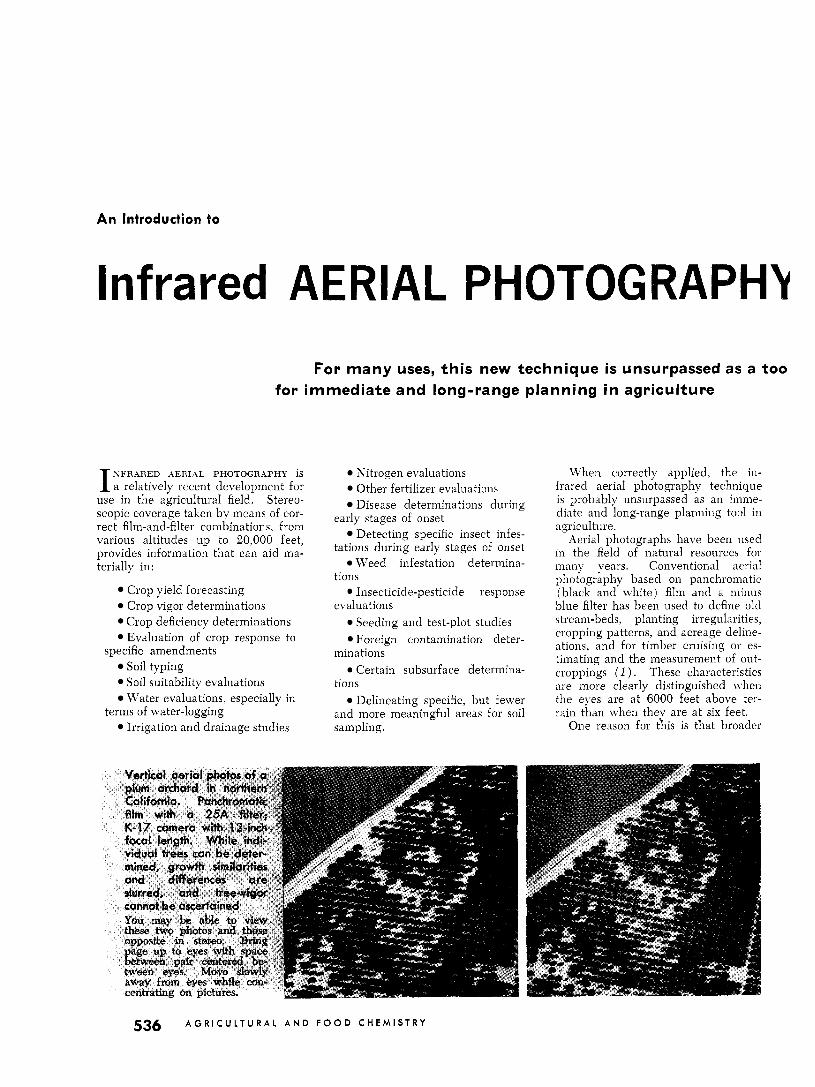
Left: Cessna 182 modified for aerial photography. Below: Equipment used for infrared aerial photography (left to right): View finder, K - 1 7 aerial cam- era in mount, can of aerial film. In front are power supply and intervalometer.
I Agriculture STEVEN CHARTER, Research Consultant, Son Francisco, Calif.
air scope permits the vimver to see and evaluate more similarities and differences at om time. .kid since even the slowest aircraft flies too r‘ipiclly to permit detailed examina- tion of an area, cc’rrect aerial photog- raphy-which can be examined stereo- scopically and at leisure by the photo interlireter-becomes a superior tool for such studies.
However. m‘ixirnum utilitv of pan- clirom,itic or Ektachrome ( color) films is limited by their spectral confines. These films are limited to the visible spectruiii-\vavelengths of about 0.4 to itbout 0.7 microns. Ektachroine (color) ground photography of the visible spectrum has been used effec- tively in the determination of normal gro\\-th, and i n the diagnosis of various mineral deficiencies in plants ( 5 ) .
Infrared radiation is the band of electroinagnetic wavelengths lying be- tween the extreme of the visible spec- trum (about 0.7 microns) and the shortest microwaves (about 1,000 microns). All bodies not at absolute zero in temperature radiate in this range. Infrared radiation is some- times incorrectly called “heat radia- tion” because warm bodies emit the radiation and bodies which absorb radiation are \varmed. However, the radiation itself is not “heat.”
The visible spectrum (0.3-0.7 microns) permits the human eye to differentiate approximately 20,000 v x - iations of color from red to violet, and approximately 2000 variations from black to white. Since the visible spec- trum has a range of approximately 300 millimicrons within which 20,000 var-
iations of color can be determined, the eye can distinguish approximately 70 variations per millimicron. The in- frared range (near, middle, far) from 700 millimicrons to 1 million milliini- crons should therefore, mathemati- cally, permit approximately 70 million variations that theoretically can be read, if correct instruineiitatioll can be made available.
Our present concern is with the part of the near infrared extending roughly from 700 to 1000 millimicrons-hence permitting a mathematical differentia- tion of some 20,000 variations which can be used diagnostically.
.4s techniques and instrumentation develop, it should be possible to move upward on the invisible spectrum. eliminating film entirely.
V O L . 7, NO. a, A U G U S T 1 9 5 9 537
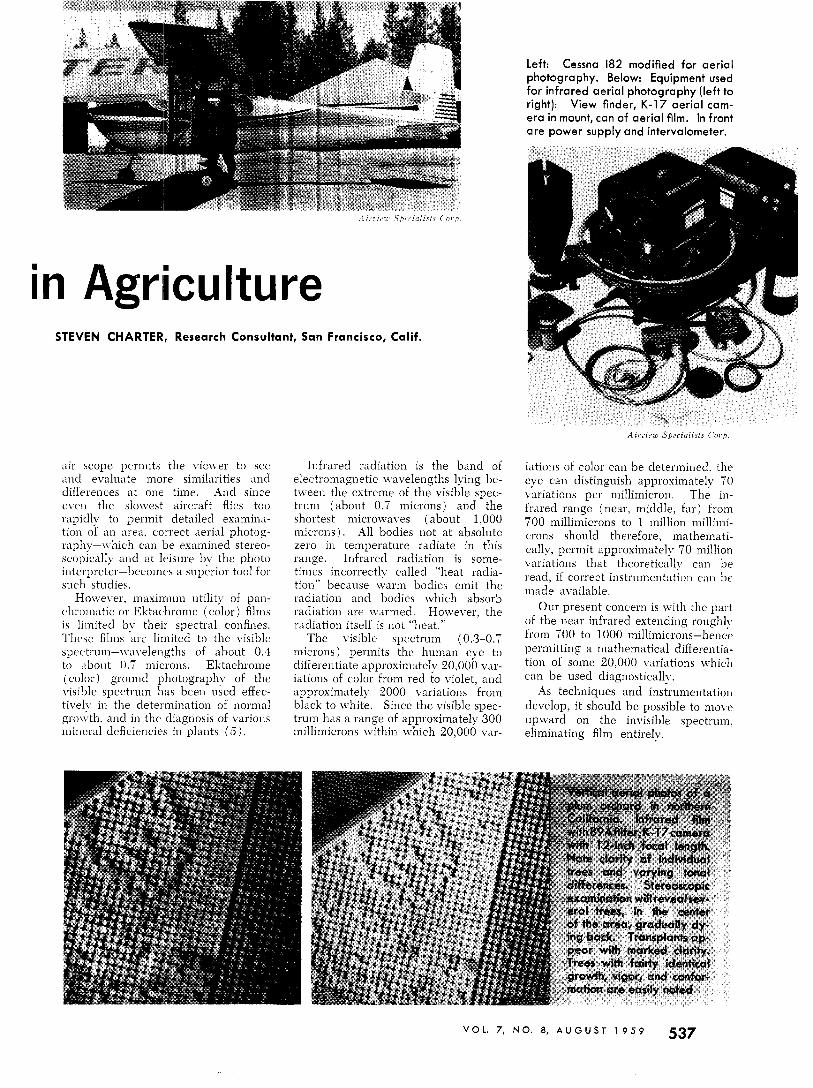
As early as 1890 spectiophotoiiietiic data were published for healthy leaves, showing their high reflectance of green and infrared light, and their strong ab- sorption of blue and red light. In 1947 Eames and hlacDaniels ( 4 ) com- piled a schematic drawing of a cross- section of a healthy leaf showing that certain wavelengths are largely ab- sorbed while others are reflected to a high degree, either by the chloroplasts or by the spongy mesophyll tissue. The blue light and red light of the visible spectrum are largely absorbed by the chloroplasts and used in photo- synthesis. The green is largely re- fleoted by the chloroplasts, with reflec- tivity of approximately 40%. Infrared is unaffected by the chloroplasts, but is highly reflected by the spongy meso- phyll tissue, with reflectivity of about 80%.
Infrared reflectance of healthy vege- tation, as a norm, has been established in a number of instances. Variation from this reflectance norm, in many cases, then becomes diagnostic ( 2 ) .
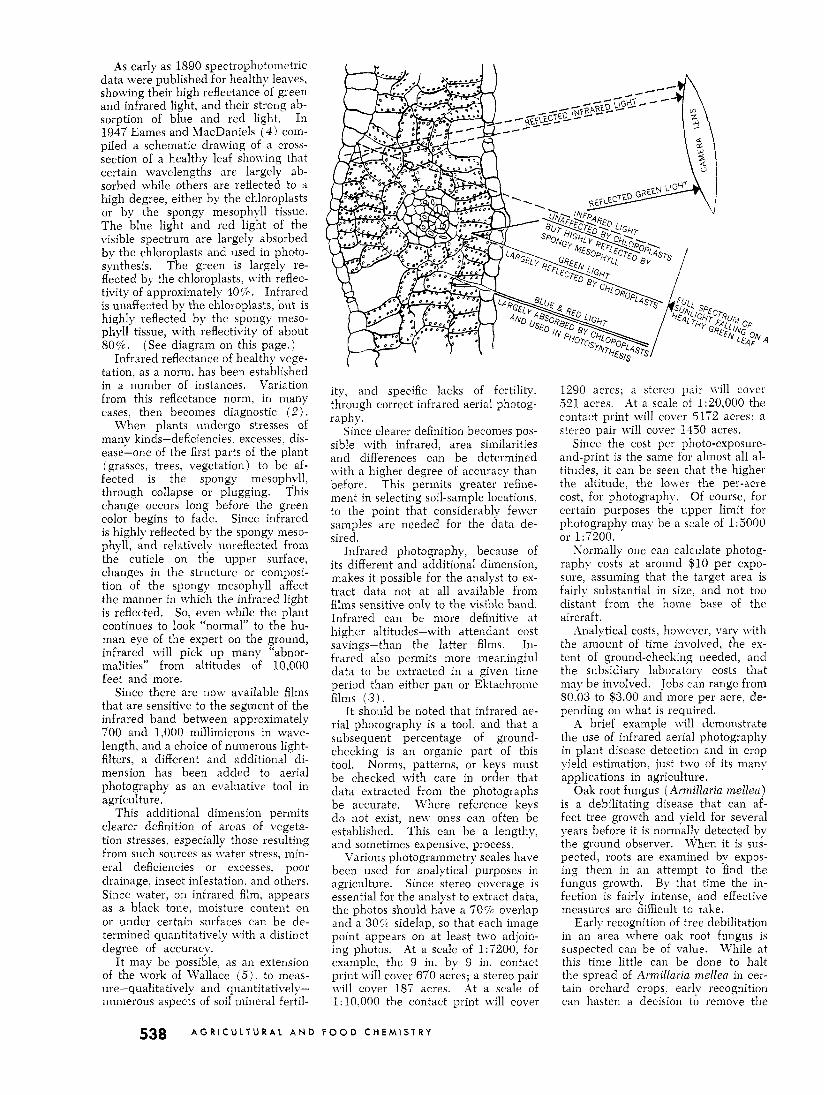
When plants undergo stresses of many kinds-deficiencies, excesses, dis- ease-one of the first parts of the plant (grasses, trees, vegetation) to be af- fected is the spongy mesophyll, through collapse or plugging. This change occurs long before the green color begins to fade. Since infrared is highly reflected by the spongy meso- phyll, and relatively unreflected from the cuticle on the upper surface, changes in the structure or composi- tion of the spongy mesophyll affect the manner in which the infrared light is reflected. So, even while the plant continues to look “normal” to the hu- man eye of the expert on the ground, infrared will pick up many “abnor- malities” from altitudes of 10,000 feet and more.
Since there are now available films that are sensitive to the segment of the infrared band between approximately 700 and 1,000 millimicrons in wave- length, and a choice of numerous light- filters, a different and additional di- mension has been added to aerial photography as an evaluative tool in agriculture.
This additional dimension permits clearer definition of areas of vegeta- tion stresses, especially those resulting from such sources as water stress, min- eral deficiencies or excesses, poor drainage, insect infestation, and others. Since water, on infrared film, appears as a black tone, moisture content on or under certain surfaces can be de- termined quantitatively \vith a distinct degree of accuracy.
It may be possible, as an extension of the work of Wallace ( 5 ) , to meas- ure-qualitatively and quantitatively- numerous aspects of soil mineral fertil-
(See diagram on this page.)
ity, and specific lacks of fertility, through correct infrared aerial photog- raphy.
Since clearer definition becomes pos- sible with infrared, area similarities and differences can be determined with a higher degree of accuracy than before. This permits greater refine- ment in selecting soil-sample locations, to the point that considerably fewer samples are needed for the data de- sired.
Infrared photography, because of its different and additional dimension, makes it possible for the analyst to ex- tract data not at all available from films sensitive onlv to the visible band. Infrared can be more definitive at higher altitudes-with attendant cost savings-than the latter films. In- frared also permits more meaningful data to be extracted in a given time period than either pan or Ektachronie films (3) .
I t should be noted that infrared ae- rial photography is a tool, and that a subsequent percentage of ground- checking is an organic part of this tool. Norms, patterns, or keys must be checked with care in order that data extracted from the photographs be accurate. Where reference keys do not exist, new ones can often be established. This can be a lengthy, and sometimes expensive, process.
Various photogrammetry scales have been used for analytical purposes in agriculture. Since stereo coverage is essential for the analyst to extract data, the photos should have a 707c overlap and a 305 sidelap, so that each image point appears on at least two adjoin- ing photos. At a scale of 1:7200, for example, the 9 in. by 9 in. contact print will cover 670 acres; a stereo pair will cover 187 acres. At a scale of 1: 10,000 the contact print will cover
1290 acres; a stereo p‘iir \rill cover 321 acres. At a scale of 1:20,000 the contact print will cover 5172 acres, a stereo pair will cover 1430 acres.
Since the cost per photo-exposure- and-print is the same for almost all al- titudes, it can be seen that the higher the altitude, the lo\\er the per-acre cost, for photography. Of course, for certain purposes the upper limit for photography may be a scale of 1:3000 or 1:7200.
Sormally one can calculate photog- raphy costs at around $10 per expo- sure, assuming that the target area is fairly substantial in size, and not too distant from the home base of the aircraft.
Anal! tical costs, however, vary with the amount of time involved, the ex- tent of ground-checking needed, and the subsidiary laboratory costs that may be involved. Jobs can range from $0.03 to $3.00 and more per acre, de- pending on what is required.
A brief example will demonstrate the use of infrared aeiial photography in plant disease detection and in crop yield estimation, just two of its many applications in agriculture.
Oak root fungus (Armillaria mellea) is a debilitating disease that can af- fect tree growth and yield for several years before it is normally detected by the ground observer. When it is sus- pected, roots are examined by expos- ing them in an attempt to find the fungus growth. By that time the in- fection is fairly intense, and effective measures are difficult to take.
Early recognition of tree debilitation in an area where oak root fungus is suspected can be of value. While at this time little can be done to halt the spread of Armillaria niellea in cer- tain orchard crops, early recognition can hasten a decision to remove the
538 A G R I C U L T U R A L A N D F O O D C H E M I S T R Y
susceptible crop and to replace it with another that is Armillaria resistant. Such action can, i n the long run, effect economic savings of substantial size.
The area involved in this example is planted to plums, which are not gen- erally resistant to Armillaria mellea. Adjarent areas are in pears, which normally are resistant to Armillaria.
i\’hile preliminary examination of ordinary high-altitude photographs in- dicated an area of suspicion, nothing definitive could have been stated re- garding infestation. Detailed exam- ination of panchromatic films, exposed at lower altitude, was not conclusive, since tree vigor a,nd debilitation could not be defined.
However, detailed examination of infrared films of the area, taken at a scale of 1:5000, did permit tree vigor and debilitation determinations, as well as transplant determinations.
IVhen the evaluation of each tree n.as transferred to a data sheet, the ring formation characteristic of Amil - laria mellea emerged. The trans- plants, representing in number ap- proximately 7% of the unit’s planting capacity, were mainly within the characteristic ring.
Since orchard trees are transplanted to replace non-bearing units, and since the area was in plums which are sus- ceptible to Armdlaria, and since the transplants were of uniform age, Armil- 1ar.iu mellea was immediately sus- pected. Subsequent root examination proved the existence of the infestation.
il’ithout infrared photography tree vigor could not have been determined in this instance, (and meaningful data could not have bcen extracted.
I t may be of interest that one of the general recommeiidations for restrain- ing Armillaria is to lower the pH as far as possible corisistent with the acid- ity-tolerance of existing trees. The p H of the soil samples taken within this Armillarfa area was higher than that of 12 other samples from adjacent areiis.
Can relationships be established be- t\\.een the health of certain crops and pH? If so, can such determinations be made through infrared aerial pho- togrdphy? If the aimver to the first question is yes, the answer to the sec- ond probably would be yes, also. Gross determinations of subsurface p H through infrared aerial photography can be of great value.
The same photographs a i d data sheets used in detecting plant disease can be used for yield forecasting.
From the infrared photographs each tree is evaluated in terms of age and vigor, and the total area in terms of cultural practices. Plums in that part of the country are usu:illy planted 7.5
trees per acre; an acreage determin.1- tion (using any of several methods) from the prints showed that this par- ticular orchard block had 14.4 acres. A tree-space count, again from the prints, showed 1097 trees, for an av- erage of 76 trees per acre. This can- not be considered crowding; the area, then, was in good potential produc- tion.
However, approximately 107~ of the tree spaces were non-productive, giv- ing expectation of a “normal” yield re- duction of 10%.
Further examination of the individ- ual trees on the infrared photographs indicated that 70% of the bearing trees were in full maturity, while 30%~ were either too young or too old for maximum bearing.
Hence, projecting a full yield from the 70% of mature trees, plus an es- timated yield of 75% from the too- young or too-old trees, minus any yield from the 1070 that were not at all productive, the following relationship can be employed:
XY = AB + AC, in percentage, where X is the estimated yield in percentage
for a given crop; Y is the percentage of normal expecta-
tion of a given crop in a given area for a given year. This Y factor must be established through study of avail- able records for the crop under pre- viously recorded conditions, through correlation with photography flown during prior seasons, through ground observations of a sampling of the area, and through other pertinent criteria.
XY, therefore, is the estimated yield of n particular crop, for a given year, at the time of photography. Subse- quent abnormal weather or infestation conditions must be reckoned with be- fore final forecasting, of course.
A is the total area capacity, minus blanks, in percentage;
B is the percentage of trees bearing an estimated 100% capacity;
C is the percentage of trees bearing at a percentage of capacity. Hence, when a normal yield-in
tons, bales, hundredweight-is multi- plied by XY, a yield forecast can be made with a strong measure of ac- curacy.
The same general method can be used in forecasting yields in other orchard crops, cotton, potatoes, range- land, and other crops, by gridding the photographs and considering each grid the equivalent of a tree-space.
The implications of a new tool of- ten are more important than the me- chanics of its use. Heretofore, and even today, agricultural production has been considered the personal pre- s e n e of the farmer and farmer-group. Despite monumental and costly sur- pluses in this country, most of the world still lives in intimacy with hun- ger. Population pressures are such that some 90,000 persons are added onto this planet. daily. Earth’s arable
acres, meanwhile, remain fairly con- stant in number.
I t is about time that a correct in- ventory of our planet’s bearing capac- ity were taken. Infrared aerial pho- tography would be a major tool in such a project.
It has been estimated that for more than 95% of the world’s population, cereal grains are the main source of food energy. Probably more time, ef- fort, and money have been expended in cereal crop research than for any other aspect of agriculture. Yet today in this country and in other parts of the world, heretofore resistant strains of cereals are giving up the ghost and being wiped out by new strains of pathogens to which the hosts are not resistant.
As more than one researcher has pointed out ( 4 ) . if nature can put virulence into pathogens faster than man can put resistance into crop plants, it may soon become necessary to use fungicides on really extensive acreages of basic food crops that are subject io wide-spread disease epidem- ics. In such an event, aerial photog- raph! flown to the proper specifica- tions should be very useful in selecting areas in which fungicides might be most profitably applied.
Water, in this country and indeed all over the world, is becoming an in- creasingly critical problem, and its proper utilization is of concern to ad- vanced planners in the agricultural field. Here again correct aerial pho- tography can be a valuable tool in taking inventory and in preparing rec- ommendations for maximum utiliza- tion.
If we are to use efficiently all that we possess, we must first know the extent of our possessions. Infrared aerial photography can help determine this extent.
Liferatwe Cited
1. Air Photo Interpretation of Land Use in the Central Interior of Brit- ish Columbia, Canada Department of Agriculture, June 1957.
2. Colwell, R. N., “Determining Prev- alence of Certain Cereal Crop Dis- eases by Means of Aerial Photog- raphy,” Hilgardia, University of California. Berkeley (November 1956).
3. Colwell, R . S., and Charter, S., Photogrammetric Engineering 23, No. 3 (June 1957).
4. Eames. Arthur. and MacDaniels Laurence, “An Introduction to Plant Anatomy,” \4cGraw-Hill, New York, 1947.
3. Wallace, T., “The Diagnosis of Min- eral Deficiencies in Plants by Visual Symptoms,” Chemical Publishing Co., S e w York, 19Fj3.
V O L . 7 , NO. 8, A U G U S T 1 9 5 9 539