Embed Size (px)
Citation preview

Informational asymmetry between managers and
investors in the optimal capital structure decision
Matthias Bank∗ Jochen Lawrenz‡
January 2005
JEL classification: G 32, G 13
Keywords: contingent claims valuation, capital structure decisions, incomplete
information, asymmetric information, managerial entrenchment
∗Prof.Dr. Matthias Bank, CFA
Hypo Tirol Chair for Banking & Finance, Finance Department,
University of Innsbruck, Universitatsstraße 15, A-6020 Innsbruck,
Tel.:++43.512.507.7580
Fax.:++43.512.507.2846
email: [email protected]
‡ Mag. Jochen Lawrenz
Hypo Tirol Chair for Banking & Finance, Finance Department,
University of Innsbruck, Universitatsstraße 15, A-6020 Innsbruck,
Tel.:++43.512.507.7582
email: [email protected]
1

Informational asymmetry between managers and investors in
the optimal capital structure decision
Abstract
In this article, we consider the impact of asymmetric information be-
tween managers and investors on the optimal capital structure decision.
This is done within a continuous-time framework, where the relevant state
variable is given by the EBIT value of the firm; an approach taken by
Goldstein et al. (2001), Hackbarth et al. (2003), Dangl & Zechner (2004)
amongst others. Our setup differs in that we assume the EBIT to follow
an Arithmetic Brownian motion, i.e. it can assume negative values. More
importantly, we extend this framework in two directions: (i) We introduce
a separate management claim. (ii) We introduce asymmetric information
between managers and investors by assuming that claimants receive noisy
signals, which they process according to rational expectation principles.
Our results show, that managers always try to avoid debt, and that their
optimal bankruptcy threshold is always lower, than the threshold set by
equity holders. The introduction of asymmetric information changes the
optimality conditions, and consequently the capital structure decision. It
is shown, that the informational asymmetry can substantially lower the op-
timal leverage ratio, even without assuming that managers are entrenched.
JEL classification: G 32, G 13
2

Informational asymmetry between managers and investors in
the optimal capital structure decision
1 Introduction
Since Modigliani & Miller (1958), a large number of publications have con-
tributed to the discussion about the optimal capital structure, which is a cen-
tral topic of corporate finance. One fruitful approach has been provided by the
contingent claims analysis, pioneered by Merton (1974), Black & Cox (1976),
Brennan & Schwartz (1978) and Leland (1994). A recent contribution in this
strand of literature has been provided by Goldstein et al. (2001), who take the
EBIT-value of a firm to be the relevant state variable, upon which contingent
claims can be valued. This kind of modelling has the significant advantage that
it avoids the problem of possible arbitrage opportunities, that were inherent in
earlier models that took the state variable to be the unlevered asset value.
In this article, we take up this approach and extend it in mainly two related
directions. On the one hand, we consider agency problems by introducing man-
agement as a separate claim, while on the other hand we introduce asymmetric
information by assuming that investors only have noisy signals about the state
variable.
Considering agency costs in the optimal capital structure literature is definitely
not new, and dates back at least to Jensen & Meckling (1976). An impor-
tant contribution dealing with agency costs in the contingent claims framework
is due to Leland (1998), who considers stockholder-bondholder conflicts, but
excludes the conflicts between managers and investors.1 However, entrenched
managers, who pursue their own interests, can have a significant influence on
leverage decisions. It is argued, that managers use their discretion to implement
a leverage that is too low compared to equity holders optimum.
By allowing managers to have a separate claim on the underlying cash flow, our
model shows how to reproduce this observations in the contingent claims frame-
work. More concretely, it is shown that the value of the management claim is
monotonically decreasing with increasing debt values. Thus, without any coun-
teracting forces, managers always tend to prefer less debt.2 Furthermore, it
1See Leland (1998), p.1215, fn.42This seems to be confirmed by empirical findings. See. e.g. Berger et al. (1997), Graham
(2000) or de Jong & Veld (2001).
1

is shown, that the endogenously determined bankruptcy thresholds for equity
holders and managers diverge; being significantly lower for the management
claim, which implies that if investors cannot closely monitor, the management
may have an incentive, in the absence of any counteracting forces, to delay
bankruptcy.
The second extension of this contribution is given by the introduction of asym-
metric information between managers and investors. We assume that investors,
i.e. stock and bond holders only receive noisy signals about the EBIT value.
It is further assumed, that investors will rationally process their given infor-
mation, and thus form the best estimate of their observed signals. However,
the fact that equity holders can only rely on estimates about the cash flow
influences the optimality condition for the coupon level and the endogenous
bankruptcy threshold. Not surprisingly, this will impact on the optimal capital
structure decision. It is shown, that the informational asymmetry can account
for a substantially lower leverage ratio.
Literature review
The related literature can be subdivided in broadly two different (but related)
areas: (i) Optimal capital structure models (ii) Models of incomplete informa-
tion and principal-agent conflicts.
Ad (i): Important factors influencing the optimal capital structure decision are
the tax benefits provided by debt issuance on the one hand and the potential
costs of financial distress, namely bankruptcy costs or agency costs on the other
hand. While this has already been noted by Modigliani & Miller (1958), one of
the first papers to make this explicit was Leland (1994). Using the framework
introduced by Merton (1974) and Black & Cox (1976) he shows how optimal
leverage ratios can be derived by considering tax benefits and bankruptcy costs.
His analysis was extended among others by Leland & Toft (1996) who relax the
assumption of infinite life debt, or Leland (1998) to account for asset substi-
tution. However, in these models, the capital structure choice is essentially a
static one, and does not account for the possibility of subsequent debt restruc-
turings.
One of the earliest papers to address dynamic capital structure choices is Kane
et al. (1984, 1985) and notably Fischer et al. (1989), who show that the op-
timal debt ratio of a firm can vary substantially over time. Common to both
approaches - the static and the dynamic one - is the assumption, that the rel-
2

evant state variable is given by the (unlevered) firm value3, which is modelled
in the standard way as Geometric Brownian motion.
More recent contributions to this strand of literature, which avoid this as-
sumption include Goldstein et al. (2001), Dangl & Zechner (2004), Ammann &
Genser (2004), Christensen et al. (2000), and Hackbarth et al. (2003)
It is the paper by Goldstein et al. (2001) that first dispenses with the traditional
assumption of the contingent claims analysis4 to take the unlevered assets as
state variable. For reasons to be explained later, they consider the Earnings
Before Interest and Taxes (EBIT) as the state variable, which still is assumed
to follow a Geometric Brownian motion. Within this setting, they consider the
implications of the option to increase future debt levels. Compared to static
capital structure models this implies that debt values decrease because of the
rising bankruptcy level.
In the same spirit, but with another focus Hackbarth et al. (2003) make use
of the EBIT-assumption to address the question of balancing bank and market
debt in an optimal way.
Ad (ii): Besides the above mentioned papers, there exists a large body of lit-
erature that focuses on the impact of principal-agent conflicts and asymmetric
information on the determination of optimal capital structure.5 Jensen & Meck-
ling (1976) are commonly credited as being the first contribution examining the
impact of self-interested managers on capital structure (or ownership structure).
A very recent paper in this direction is Morellec (2004), who uses a framework
similar to Stulz (1990) and shows that managerial discretion can account for
low leverage ratios.
There is also a large body of literature that deals with issues of asymmetric in-
formation and their impact on the financing choice. Pioneering work in this area
is due to Leland & Pyle (1977), Ross (1977), Myers (1977) or Myers & Majluf
(1984).6 Within the class of models, that deals with asymmetric information,
one has to distinguish further, between which parities the informational asym-
metry exists. The contribution by Myers (1977) and Myers & Majluf (1984)
3More precisely, the Fischer et al. (1989) model assumes the unlevered firm value plus its
leverage potential as the state variable. We will come back to this point in a later section4A notable exception is given by Mella-Barral & Perraudin (1997)5Obviously, no sharp distinction between the two classes can be drawn, since the disad-
vantage of debt financing in the Leland (1994) framework stems from the bankruptcy costs,
which are a form of agency costs.6For reviews, see e.g. Stein (2003) or Harris & Raviv (1991).
3

looks at informational asymmetries between managers, who act in the best in-
terest of existing equity holders, and outside investors. Within this framework,
they conclude, that there is a pecking order of financing choices. New invest-
ments will be financed first with internal resources, then by debt, and finally
with equity. Subsequent work by Brennan & Kraus (1987) tries to find condi-
tions under which this adverse selection problem may be overcome.
Another natural source of asymmetric information is the manager-investor rela-
tionship, because, while managers can be assumed to have in-depth knowledge
of the firm they are running, this may not be the case for its investors. The
capital structure decision, taken by managers, may then serve as a signalling
device to communicate insider information to outside investors. Early models
within this approach are Leland & Pyle (1977), or Ross (1977).
Most models are static in the sense that they consider some random end-of-
period firm or project value over which insiders are better informed than out-
siders. In this paper we are interested in incorporating manager-investor asym-
metric information in the continuous-time framework introduced in the previous
section.
One notable contribution in this direction was recently made by Duffie & Lando
(2001), who essentially extend the model by Leland & Toft (1996) to incorporate
incomplete information on the part of investors. Being mainly concerned with
the implication on credit spreads, they show that credit spreads in structural
models can become non-negative for very short maturities, which remedies an
important critique on structural credit risk models.
Giesecke (2003) builds upon Duffie & Lando (2001) to extend their analysis to
consider not only incomplete information about the asset value but also imper-
fect information about the default barrier.7
A slightly different approach to incomplete information was provided by Cetin
et al. (2003). They argue that in the Duffie & Lando (2001) model the market
receives a noisy version of the asset value, i.e. the asset value plus a noise com-
ponent added. The markets task is to ’filter’ away the noise in the most efficient
way, to obtain the best estimate of the asset value. This is essentially done by
Bayesian updating. In contrast, in the Cetin et al. (2003) model the markets
information set is not a noisy signal, but a reduced set of the information that
is available to managers, i.e. the market has only a coarse partitioning of the
information set generated by the state variable, which is in their setup the firm’s
7See also Giesecke & Goldberg (2004) and Goldberg (2004)
4

cash flows. However, their model remains on an abstract mathematical level
and does not lend itself to direct applications.
The remainder of the paper is organized as follows: Section 2 presents the
general valuation framework, which is applied to the different claims. Section 3
discusses the optimality conditions under complete information, with and with-
out entrenched managers. Section 4 introduces the asymmetric information and
discusses the impact on the capital structure decision. Numerical examples are
shown. Section 5 concludes.
2 The valuation framework
The model set-up is similar to Goldstein et al. (2001) in that we will take the
EBIT value as the state variable. There are mainly two advantages related to
this: On the one hand, it avoids the problem of possible arbitrage opportu-
nities, that were inherent in earlier models that took the state variable to be
the unlevered asset value.8 On the other hand, it allows to treat all claims on
this state variable in a consistent manner. The treatment of the tax claim in
the earlier models was different from the equity and debt claims in that it was
considered an inflow of funds, rather than a reduction in the outflow of funds.9
In contrast to Goldstein et al. (2001) we will not assume the EBIT value to
follow a Geometric Brownian motion, but to follow an Arithmetic Brownian
motion.10 This has the more realistic feature, that cash flows can become neg-
ative, which is by definition not possible with Geometric Brownian motion.
In this section, we give the derivation of the contingent claims analysis11
under complete information, which will serve as the reference case.
As pointed out above, we take the state variable to be the EBIT, denoted by
8It is not possible to assume both the unlevered and the optimally levered assets to be
traded assets, without introducing the possibility of arbitrage. Leland (1994) leaves this issue
unresolved, while Fischer et al. (1989) considered the unlevered asset value plus its optimal
leverage potential as the state variable.9See Goldstein et al. (2001), p.487.
10Ammann & Genser (2004) also use Artithmetic BM, but since they deal with dynamic
capital structure, they run into difficulties due to the loss of the homogeneity property.11Brennan (2003) calls it the certainty equivalent approach to valuation.
5

X, and assume that it follows an arithmetic Brownian motion
dXt = µPdt+ σ dWPt (1)
where µP and σ denote the drift and diffusion parameter which are assumed to
be constant. WP is a standard Wiener process. The superscript P emphasizes
that the drift and the Wiener process are governed by the physical probability
measure P .
In following standard arbitrage-free pricing principles, we further assume that
there exists an equivalent risk-neutral probability measure Q, which ensures the
absence of arbitrage. Under the Q-measure, we denote the EBIT-dynamics by
dXt = µ dt+ σ dWt (2)
where µ = µP − θ σ is now the risk-neutral drift, and W is a Q-Wiener process.
θ denotes the endogenously obtained risk premium.
We can also write down the dynamics of an arbitrary claim (C(X)) on the
payout flow by applying Ito’s formula.
dC(Xt) = C(t)dt+ C(x)dX +1
2C(xx)(dX)2
=(
C(t) + µC(x) +1
2σ2C(xx)
)
dt+ σC(x)dWt (3)
where the subscripts in parentheses indicate the partial derivatives.
The absence of arbitrage opportunities implies that the total risk-neutral ex-
pected return on the claim has to equal the risk-free rate. If we consider general
claims of the form mX + c, i.e. a claim that receives a fixed amount of c and a
fraction m of the EBIT flow, we get the following relationship
rC dt = EQ[dC + (mX + c) dt]
= EQ[(C(t) + µC(x) +1
2σ2C(xx) +mX + c) dt+ σC(x)dWt]
= (C(t) + µC(x) +1
2σ2C(xx) +mX + c) dt (4)
From which we get the partial differential equation that has to be fulfilled by
any claim on the EBIT
C(t) +1
2σ2C(xx) + µC(x) − rC +mX + c = 0 (5)
In the following, we will only consider claims with no stated maturity, so equa-
tion (5) reduces to an ordinary differential equation (ODE)
1
2σ2C(xx) + µC(x) − rC +mX + c = 0 (6)
6

which has the general solution
C(X) = A1 eβ1X +A2 e
β2X +mX + c
r+µm
r2(7)
with A1, A2 being constants that have to be determined by appropriate bound-
ary conditions, and β1, β2 are roots of the quadratic equation Q(β) = 12σ
2β2 +
µβ − r = 0 which are given by
β1 =−µ+
√
µ2 + 2σ2r
σ2β2 =
−µ−√
µ2 + 2σ2r
σ2
Note, that β1 > 0 and β2 < 0.
At first glance, it is tempting to think of the asset value (V ) associated
with the EBIT flow as the discounted expectation over all future cash flows,
i.e. Vt = EQ[∫∞te−r(s−t)Xs ds] =
Xt
r+ µ
r2 . While this is reasonable in the case
when the EBIT flow follows a Geometric Brownian motion12, more caution has
to be applied in the arithmetic case. Here, cash flows can be negative, and at
a sufficiently low EBIT-level it might become optimal to even shut down an
unlevered firm. Therefore, in order to determine the asset value, we have to
take into account the optimal shut down-level, which we denote by XB. If we
consider a claim on the entire payout flow, i.e. m = 1 and c = 0, we derive the
specific solution by determining the constants A1 and A2 of equation (7) by
appropriate boundary conditions. From the fact, that β1 > 0, we immediately
deduce, that A1 = 0 since otherwise the solution diverges. On the other hand,
the claim is worthless at the shut down-level XB, i.e. V (XB) = 0, and so we
find A2 = −(XB
r+ µ
r2 )e−β2XB , which gives
V (X) =(X
r+
µ
r2
)
−(XB
r+
µ
r2
)
eβ2(X−XB) (8)
The first term in the solution coincides with the value of the discounted expec-
tation over all future cash flows (EQ[∫∞te−r(s−t)Xs ds]); however, due to the
possibility of a shut down we cannot pretend to have an claim on all future
cash flows, but only on those that are realized as long as the EBIT value did
not drop under the shut down level XB.
If we denote by τXBthe first time, that the process X hits the level XB
13
we can interpret V (Xt) as EQ[∫ τXBt e−r(s−t)Xs ds], i.e. the expected discounted
12Cash flows cannot become negative, so “it is never optimal to shut-down an unlevered
firm” (Hackbarth et al. (2003), p.7)13More precisely, τXB
= inf(t;Xt ≤ XB), which is a so-called stopping time.
7

cash flows from t until the stopping time τXB.
Note further, that the term eβ2(X−XB) can be interpreted as the present value of
one unit of account conditional on the event, that the process X hits the bound-
ary XB. This can be seen by evaluating the expectation E[e−r τXB ] which turns
out to be14
E[e−rτXB ] = eβ2(X−XB) (9)
2.1 All equity case
Now, while V (X) has to be interpreted as the value of a claim on the entire
cash flow, this is a hypothetical case, since even if we consider a firm that is
entirely financed by equity, we must take into account, that not the whole cash
flow accrues to shareholders, but that a substantial part has to be payed to the
tax authority. So, even in the all equity case, we have two claimants: equity
holders and the government.
Therefore, we introduce τ c as the tax rate applying on the corporate level,
and τd and τk as the investor’s personal tax rate on dividends and coupon
payments respectively. Then, the effective part of the cash flow, that goes to
equity holders is m = (1− τ c)(1− τd), and we abbreviate this to m = (1− τ e)by defining the effective tax rate τ e.
With the same reasoning as above, the general solution for the valuation of the
all equity claim (AE) is AE(X) = A1 eβ1X +A2 e
β2X + (1−τe)Xr
+ (1−τe)µr2 .
To simplify notation, make the following definitions
X ≡ X
r+
µ
r2XB ≡
XB
r+
µ
r2(10)
Again, applying A1 = 0 and AE(XB) = 0, we find
AE(X) = (1− τ e)(
X − XB eβ2(X−XB))
(11)
Clearly, in this case the claim of the government is simply the remaining part
of the entire cash flow. Denoting the government claim in the all equity case
by TAE(X), this is
TAE(X) = τ e(
X − XB eβ2(X−XB))
(12)
14See e.g. Karatzas & Shreve (1998). See Appendix A.1 for more details.
8

2.2 Capital structure and management
In this section, we consider a richer setting. On the one hand, staying in the
tradition of the optimal capital structure literature, we analyze the claims on
the cash flow, where we can distinguish four claimants: equity holders, debt
holders, tax authority and bankruptcy costs.
On the other hand, we introduce the management as a separate party, thus
forming the basis to analyze principal-agent conflicts in the sequel. The claim
that is held by the managers is assumed to consist of a fixed payment as well
as a performance-linked compensation, which is given by a part of the cash
flow. Thus management can be viewed as having both an equity- and a debt-
like claim. Furthermore, we assume that managers derive some non-pecuniary
profits from their position.
External equity claim
To determine the equity claim, the cash flow (X) is reduced by the coupon
payment to investors (k) as well as the fixed compensation payments to the
management, which we denote by κ.15 And after effective taxation, the entire
equity claim receives (1− τ e)(X − k − κ).
Furthermore, the entire equity claim is divided up between external equity hold-
ers and managers. If we denote the fraction of the equity claim that goes to the
management by γ, the claim for external equity holders is (1− τ e)(1− γ)(X −(k+κ)), and the corresponding ODE for the external equity claim (E) is of the
form: 12σ
2E(xx) + µE(x) − rE + (1− τ e)(1− γ)(X − (k + κ)) = 0.
In this section, we will consider the endogenous bankruptcy case, which means
that we assume that equity holders can optimally choose the cash flow level
where they will declare bankruptcy. We will denote this endogenous bankruptcy
threshold by Xb.16
The boundary condition for the equity claim is therefore E(Xb) = 0, i.e. eq-
uity is worthless at the bankruptcy threshold.17 Again, with A1 = 0, we can
15In this context, one should not call X the EBIT, but rather EBITC - earnings before
interest, taxes, and compensation payments. However, with this remark in mind we keep
on calling X the EBIT or simply the ’cash flow’, although this is admittedly not completely
correct.16The determination of Xb is deferred to a later section.17While being a standard assumption, in practice, it can be observed that E(Xb) > 0, espe-
cially for firms declaring bankruptcy under the Chapter 11 provisions of the US bankruptcy
law (see Milgrom & Roberts (1992), p.503). For a detailed analysis of the impact of differ-
9

determine A2 to be −(1− τ e)(1− γ)(
Xb− (k+κ)r
)
e−β2Xb and so the solution for
equity is
E(X) = (1− τ e)(1− γ)(
(
X − (k + κ)
r
)
−(
Xb −(k + κ)
r
)
eβ2(X−Xb))
(13)
where, again, we defined Xb ≡ Xb
r+ µ
r2 .
Debt claim
The debt holders are entitled to the fixed coupon payment (k) as long as the firm
is solvent. So, after accounting for personal taxes, investors receive (1− τ k) k.
Therefore, the ODE for debt is 12σ
2D(xx) +µD(x)− rD+(1− τk)k = 0 and the
particular part of the solution is just (1− τ k)kr.
In the case of bankruptcy, debt holders receive (part of) the remaining firm
value according to their superior priority. More precisely, we assume, that the
bankruptcy value of the firm is divided up between debt holders, tax authority
and bankruptcy costs. Furthermore, we consider the bankruptcy value of the
firm to be the value of an all equity claim on the cash flow at the bankruptcy
level Xb. This is motivated by the fact, that the former debt holders are effec-
tively the new owners of the EBIT-generating machine, and can thus be viewed
as having an all equity claim on this cash flow.18 Clearly, this claim carries the
potential to optimally lever it again, and the new owners may decide to do so.
However, since this touches on questions of reorganization which are not central
to our analysis at the present stage, we will not pursue this issue further on.
Taking the bankruptcy value to be an all equity claim on the cash flow level
Xb, and introducing α as the fraction, that is lost to bankruptcy costs, the
value that is left to be distributed is (1− α)AE(Xb), which is then distributed
between former debt holders and the tax authority.
For the debt claim we get the following boundary condition at the bankruptcy
level: D(Xb) = (1− τ e)(1− α)AE(Xb).
From this, and from the fact that A1 = 0, we can determine A2 to be(
D(Xb)−(1− τk)k
r
)
e−β2Xb , which gives the following solution for the debt claim
D(X) =(
D(Xb)− (1− τk)k
r
)
eβ2(X−Xb) + (1− τk)k
r(14)
ent bankruptcy procedures on the valuation of corporate securities, see Francois & Morellec
(2004).18This is similar to the reasoning by Mello & Parsons (1992), or more recently Morellec
(2004)
10
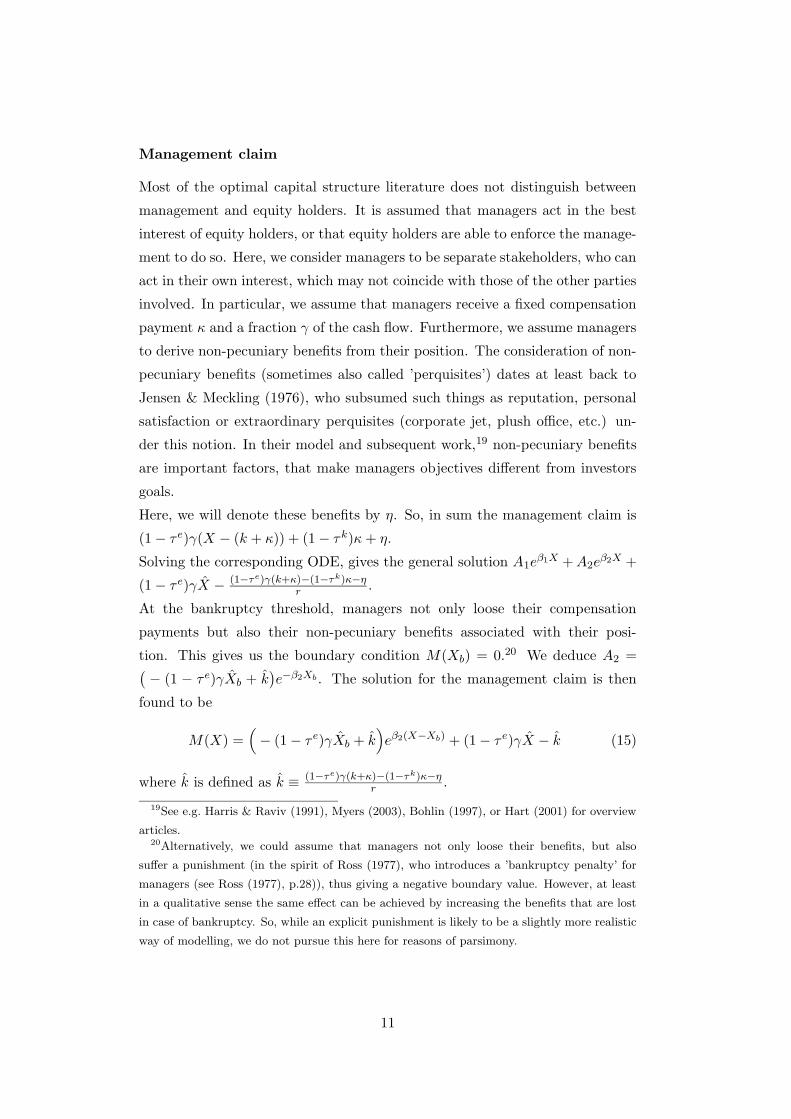
Management claim
Most of the optimal capital structure literature does not distinguish between
management and equity holders. It is assumed that managers act in the best
interest of equity holders, or that equity holders are able to enforce the manage-
ment to do so. Here, we consider managers to be separate stakeholders, who can
act in their own interest, which may not coincide with those of the other parties
involved. In particular, we assume that managers receive a fixed compensation
payment κ and a fraction γ of the cash flow. Furthermore, we assume managers
to derive non-pecuniary benefits from their position. The consideration of non-
pecuniary benefits (sometimes also called ’perquisites’) dates at least back to
Jensen & Meckling (1976), who subsumed such things as reputation, personal
satisfaction or extraordinary perquisites (corporate jet, plush office, etc.) un-
der this notion. In their model and subsequent work,19 non-pecuniary benefits
are important factors, that make managers objectives different from investors
goals.
Here, we will denote these benefits by η. So, in sum the management claim is
(1− τ e)γ(X − (k + κ)) + (1− τ k)κ+ η.
Solving the corresponding ODE, gives the general solution A1eβ1X +A2e
β2X +
(1− τ e)γX − (1−τe)γ(k+κ)−(1−τk)κ−ηr
.
At the bankruptcy threshold, managers not only loose their compensation
payments but also their non-pecuniary benefits associated with their posi-
tion. This gives us the boundary condition M(Xb) = 0.20 We deduce A2 =(
− (1 − τ e)γXb + k)
e−β2Xb . The solution for the management claim is then
found to be
M(X) =(
− (1− τ e)γXb + k)
eβ2(X−Xb) + (1− τ e)γX − k (15)
where k is defined as k ≡ (1−τe)γ(k+κ)−(1−τk)κ−ηr
.
19See e.g. Harris & Raviv (1991), Myers (2003), Bohlin (1997), or Hart (2001) for overview
articles.20Alternatively, we could assume that managers not only loose their benefits, but also
suffer a punishment (in the spirit of Ross (1977), who introduces a ’bankruptcy penalty’ for
managers (see Ross (1977), p.28)), thus giving a negative boundary value. However, at least
in a qualitative sense the same effect can be achieved by increasing the benefits that are lost
in case of bankruptcy. So, while an explicit punishment is likely to be a slightly more realistic
way of modelling, we do not pursue this here for reasons of parsimony.
11

Tax claim
The claim of the government on the EBIT flow consists of three parts. First,
they receive τ e(1−γ)(
X−(k+κ))
from the effective taxation of equity holders.
The second part is the tax income from debt holders which is τ k k, and the third
part is given by the taxation of managers, which have to pay τ eγ(
X−(k+κ))
+
τkκ.
In sum, this provides the tax claim (T ) with τ eX +(τk− τ e)(k+κ) and we get
the following ODE: 12σ
2T(xx) + µT(x) − rT + τ eX + (τk − τ e)(k + κ) = 0
The boundary condition at the bankruptcy threshold according to the same
reasoning as above is T (Xb) = τ e(1 − α)AE(Xb), from which we get A2 =(
T (Xb)− τ eXb − (τk − τ e) (k+κ)r
)
e−β2Xb , and the solution
T (X) =(
T (Xb)− τ eXb − (τk − τ e)(k + κ)
r
)
eβ2(X−Xb) +
τ eX + (τk − τ e)(k + κ)
r(16)
Bankruptcy costs
Finally, we have a fraction of the remaining firm value, that is lost to bankruptcy
costs. This claim vanishes forX À Xb, and is worth αAE(Xb) at the bankruptcy
threshold. The solution to this claim is therefore easily found to be
BC(X) = αAE(Xb)eβ2(X−Xb) (17)
As a consistency check we can sum up the five claims discussed above
(i.e. eqs. (13), (14), (15), (16) and (17)). This sum has to equal the value
of a claim on the entire cash flow (i.e. m = 1) and the non-pecuniary benefits
(η), together with the boundary condition V (Xb) = AE(Xb). Indeed, we get
from both calculations the solution
(
AE(Xb)− Xb −η
r
)
eβ2(X−Xb) +(
X +η
r
)
A detailed summary of the valuation of the various claims can be found in
appendix A.2.
12

3 Capital structure decision under complete infor-
mation
3.1 Optimal bankruptcy threshold
In this section we consider the determination of the optimal bankruptcy thresh-
old of equity holders. The factors influencing their choice are on the one hand,
the fact that the total firm value is maximized by a threshold as low as possi-
ble. On the other hand, the equity value must always be positive and equity
holders won’t accept a situation, where an increase in the cash flow level will
decrease the value of their claim. Therefore, the lowest possible, i.e. the opti-
mal bankruptcy threshold is found by determining the minimum of the equity
value function that is non-negative. This is also known as the smooth-pasting
condition, and ensures that the value of equity is maximized.21
We have to distinguish between the all equity case and the levered equity
case. In the all equity case, the optimality condition is
∂AE(X)
∂X|X=XB
= 0 subject to AE(X) ≥ 0
while for the levered equity case, we have
∂E(X)
∂X|X=Xb
= 0 subject to E(X) ≥ 0
Note the difference in the shut down or bankruptcy level.
Solving the above conditions (i.e. differentiating eqs. (11) and (13), evaluating
at XB and Xb respectively, setting them to zero, and solving for X∗B and X∗
b )
yields for the optimal bankruptcy thresholds22
X∗B =
1
β2− µ
r(18)
X∗b =
1
β2− µ
r+ k + κ (19)
It is immediately obvious that X∗B < X∗
b , which is reasonable from an economic
interpretation. The bankruptcy level in the levered case is always greater than
the shut down level in the all equity case. Note also, that X∗B < 0, which indi-
cates that equity holders are willing to keep the firm going even in the case of
a negative EBIT level, but will choose to shut down the business if the EBIT
is sufficiently negative.
21see e.g. Leland (1994), p.122222See appendix A.3 for details.
13

Another interesting question in this context is where managers would set their
optimal bankruptcy level (Xbm), if they had the corresponding power of deci-
sion. Again, we have to find ∂M(X)∂X|X=Xbm
= 0 and solve for X∗bm, which turns
out to be
X∗bm =
1
β2− µ
r+ k + aκ κ+ aη η (20)
where we have introduced the coefficients
aκ =γ(1− τ e)− (1− τk)
γ(1− τ e)aη = − 1
γ(1− τ e)
While it is obvious that aη < 0, it depends on the actual parameter values
which sign aκ will assume. However, since we assume that τ e > τk, i.e. a tax
advantage to fixed payments, we get aκ < 0.
If we consider for a moment the case where managers do not derive non-
pecuniary benefits (i.e. η = 0), we see that X∗bm is always smaller than X∗
b .
Furthermore, the smaller the equity part of the management compensation,
the lower their X∗bm. Besides the fixed payment (κ), the non-pecuniary ben-
efits (η) also work towards lowering the optimal bankruptcy threshold. In an
extreme setting, with a very small fixed pay, a small equity part and very high
non-pecuniary benefit, we might even get the case, that X∗bm is lower than the
all-equity shut down level X∗B.
This gives us a first interesting result. The mere fact that the management
claim consists of three parts - namely a fixed payment, an equity-like part and
a non-pecuniary benefit - implies a divergence between the goals of external
equity holders and managers concerning the optimal liquidation strategy. Man-
agers would in general choose to file for bankruptcy at a cash flow level that
is too low compared to the optimal threshold for external equity holders, thus
creating a principal-agent problem. In the case of complete information this
might not pose a problem for equity holders, since given their perfect knowl-
edge about the true cash flow level, they can always optimally liquidate the firm.
However, the divergence of optimal liquidation policies already sets the scene
for the principal-agent problems that will occur in the incomplete information
case.
3.2 Optimal coupon without entrenched managers
So far, we have taken the coupon k as being exogenously determined. However,
it is obvious that the coupon level needs to be treated as an endogenous variable
14

that determines the optimal capital structure.
We follow the common view (see e.g. Zwiebel (1996) or Novaes (2003)), that
leverage decisions lie within the field of responsibility of managers.
First, to establish the reference case, we assume that managers act in the best
interest of shareholder, i.e. their objective is to maximize shareholder wealth,
and no agency problem occurs. From this, we will find the optimal coupon level
as the solution to the following maximization problem
maxk
(
D(xt, k,X∗b (k)) + E(xt, k,X
∗b (k))
)
(21)
The coupon level is chosen such that the equity value plus the proceeds from
the debt issue are maximized. The debt and equity values are evaluated at the
current EBIT level xt. Further, they depend on the optimal bankruptcy level
(X∗b (k)) which itself depends on the coupon level k as can be seen from equation
(19). Plugging in the optimal bankruptcy level of external equity holders is
plausible, since in this perfect information case, given any coupon level they
can always choose their corresponding optimal bankruptcy threshold.23
Unfortunately, after plugging in, differentiating equation (21) and setting it to
zero, we cannot explicitly solve for k∗. Therefore, we cannot provide closed-form
solutions for the optimal coupon and must resort to numerical analysis.24
3.3 Optimal coupon with entrenched managers
If managers cannot be forced to implement the equity value-maximizing coupon
level, how would they choose their optimal coupon level? The first-best solution
for managers would be to choose a coupon level that maximizes their claim. In
their optimization problem they have to take account of the fact, that equity
holders can observe the coupon level and adjust their bankruptcy level accord-
ingly. So, in principle the optimal coupon level for management would be found
by k∗ = maxk{M(xt, k,X∗b (k))}. If we compute the derivative ∂M
∂k, we get
∂M(xt, k,X∗b (k))
∂k=γ(1− τ e)
r
(
eβ2(xt−X∗b (k))−1
)
+(
β2κ(1− τk) + η
r
)
eβ2(xt−X∗b (k))
Note, that since 0 ≤ eβ2(xt−Xb) ≤ 1 and β2 < 0, both terms are negative so that
we always have M ′(k) < 0 which means that managers always prefer a coupon
23Note, that otherwise we had to treat Xb in the optimization as a constant, which in turn
would yield a different result.24See appendix A.4 for details.
15

level as low as possible. This result shows that in the absence of any coun-
teracting forces, manager will try to avoid debt.25,26 The driving force of this
result is in the present context the fact that managers loose their compensation
payments in the case of bankruptcy so that they can maximize their claim by
minimizing the probability of default, which means taking on less debt.27
The argument taken to the extreme would mean that managers do not is-
sue any debt at all. In a related framework, Noe & Rebello (1996) show that
the first-best policy for managers is an all-equity financing. But obviously this
is unlikely to happen, because equity holders will impose disciplining mecha-
nisms - i.e. corporate government rules and control mechanisms - on managers
to keep them from deviating from their desired optimal capital structure. The
most convincing disciplining force is probably the threat of loosing their job
through dismissal28 or hostile takeover.29 With the threat of being fired, the
second-best solution for managers is then to implement the coupon level which
is optimal for equity holders.
However, for various reasons this threat will often be mitigated. The different
forms of mitigation are subsumed under the notion of ’managerial entrench-
ment’, which - by following Berger et al. (1997) - may be defined as: “the
extent to which managers fail to experience discipline from the full range of
corporate governance and control mechanism”.30
Various forms of entrenchment have been discussed in the literature: A long
tenure in office, a low sensitivity of the compensation scheme to performance
measures, a weak monitoring (e.g. a small board size, few outside directors,
no major stock holders or weak voting powers of equity holders),31 frictions
25This is in line with empirical results obtained by Jung et al. (1996) Berger et al. (1997),
Graham (2000) and de Jong & Veld (2001).26On the contrary, according to the ’control hypothesis’ (e.g. Jensen (1986)) managers may
choose voluntarily to issue debt because of its credible signal to avoid overinvestment.27Other motives for the avoidance of debt have been put forward, like the protection of
undiversified human capital (Fama (1980)), or the dislike of performance pressures (Jensen
(1986)). Note, that Grossman & Hart (1982) put forward a different reasoning, by which debt
creates an incentive for managers to work more efficiently, and thus to avoid bankruptcy.28Huson et al. (2001) find an increased frequency for forced CEO turnover in the period
from 1971 to 199429Note however, that Novaes (2003) argues that the takeover threat may not be enough
in general to force managers to implement value-maximizing leverage levels, and depends
crucially on the takeover costs.30Berger et al. (1997), p.141131see e.g. Berger et al. (1997), de Jong & Veld (2001)
16

on the market for corporate control32 (e.g. high costs of dismissal), or specific
human capital.33 Given that the managers are entrenched by one or more of
these factors, they can act in their own interest, whereby the extent of the en-
trenchment determines how far they can deviate from equity holders optimum.
Together with the above result, that managers always prefer to avoid debt, the
leverage would ceteris paribus always be lower when managers are entrenched.
As will be shown in a later section, leverage ratios may decline even without
managerial entrenchment (with respect to the leverage decision) if the effects
of asymmetric information are considered.
Before introducing incomplete information, the next section discusses numerical
results in the complete information case.
3.4 Numerical example - Complete information
For illustrative purposes, we present in this section numerical results. Assume
the following base case parameter values: The risk-free interest rate is flat at
5%, i.e. r = 0.05. Corporate taxes are τ c = 0.35, taxes on dividend payments
are τd = 0.2, which gives an effective tax rate of τ e = 0.48. Taxes on coupon
payments are τk = 0.4.34
Empirical evidence (see e.g. Givoly & Hayn (2000)) shows that the cash flow
variability is broadly of the same order of magnitude than its level, so by assum-
ing an initial cash flow level of x0 = 100, we set σ = 100. Further, we assume
a drift of µ = 2.35 Thus, we have µr= 40 and 1
β2= −296.86. In following
Goldstein et al. (2001), we set bankruptcy costs at 5%, i.e. α = 0.05.36
With respect to parameters influencing the management compensation, we
broadly follow results by Core et al. (1999), Core et al. (2003) and Palia (2001)
and set the equity-linked compensation part to γ = 0.02. Given the initial cash
flow level of x0 = 100, we set the fixed pay to κ = 1 and the non-pecuniary
benefits to η = 0.2
32see e.g. Zwiebel (1996)33The incumbent manager disposes special skills by which he can add value to the firm, and
which are lost by his dismissal. See Morellec (2004) for a recent model.34see Goldstein et al. (2001)35Recall, that µ is the drift under the risk-neutral measure Q.36This is also in line with results by Weiss (1990)
17

Bankruptcy thresholds
Looking first at the optimal bankruptcy thresholds, we obtain the following
values: (i) In the all-equity case, the optimal shut-down level is X∗B = −336.86.
(ii) In the levered case, the optimal bankruptcy threshold from the viewpoint of
equity holders is X∗b = −199.11, which turns out to be substantially higher. (iii)
Also not surprisingly, the optimal bankruptcy threshold for the management is
X∗bm = −276.03, which - as discussed in the previous section - is lower than X∗
b .
With respect to the comparative statics, all three thresholds decrease with an
increasing drift value, i.e. :∂X∗
B
∂µ=
∂X∗b
∂µ=
∂X∗bm
∂µ= −1
r− 1
β2
√µ2+2rσ2
< 0
Similarly, an increase in risk also lowers the thresholds:∂X∗
B
∂σ=
∂X∗b
∂σ=
∂X∗bm
∂σ=
− σ√µ2+2rσ2
< 0. However, in these derivatives k has been treated as a constant.
Now, as it is clear from the preceding section, the optimal coupon k∗ itself
depends, amongst other things, on µ and σ. So, in general it is a priori not
clear if the same signs still hold true. Unfortunately, k∗ is not obtainable in
closed-form, so we can only present numerical solutions. In the left panel of
10 20 30 40 50
-1000
-800
-600
-400
-200
50 100 150 200
-600
-500
-400
-300
-200
-100
PSfrag replacements
σ
µXX
Figure 1: Numerical solutions for X∗b (µ, σ) (solid line), X∗
bm(µ, σ) (dotted line),
X∗B(µ, σ) (dashed line)
figure 1, the thresholds are shown for increasing µ-values. It can be seen, that
X∗B is decreasing, which is obvious from the fact that in the all-equity case
there is per definition no coupon payment. On the contrary, for X∗bm and X∗
b ,
the fact that k∗ itself depends on µ and σ changes their behavior. They only
decrease marginally and can even increase for high µ-values. In the right panel,
thresholds are shown as a function of σ. Although we still can observe different
graphs for X∗bm and X∗
b , it does not change the sign, so in this case, increasing
the risk unambiguously lowers the three thresholds.
18

0.1 0.2 0.3 0.4 0.5
100
150
200
250
300
10 20 30 40 50
100
150
200
250
300
10 20 30 40 50
100
150
200
250
300
0.5 0.6 0.7 0.8
100
150
200
250
300
0.150.20.250.30.350.40.45
100
150
200
250
300
0.2 0.4 0.6 0.8 1
100
150
200
250
300
2 4 6 8 10
100
150
200
250
300
50 100 150 200
100
150
200
250
300
0.02 0.04 0.06 0.08 0.1
100
150
200
250
300
PSfrag replacements
σµ
k∗k∗k∗
k∗k∗k∗
k∗k∗k∗
r
τe τk α
γ κ η
1 2 3
4 5 6
7 8 9
Figure 2: Comparative statics for the optimal coupon level k∗.
Optimal coupon
We already made use of the optimal coupon k∗ in the preceding section with-
out having discussed its comparative statics. First, we recall, that the optimal
coupon is also depending on the current level of the cash flow X0. By assuming
an initial value of X0 = 100, we obtain in the base case setting k∗ = 136.75.
Varying the different parameters, we obtain comparative static results as shown
in figure 2. The upper three panels show the influence of the asset value process
parameters and the risk-free rate. The middle three panels show the influence
of the tax benefit/bankruptcy cost trade-off, and the lower three panels show
the influence of the management parameter. Interpretations are more or less
straightforward; with the exception of panel 2 (σ), we see monotonic relation-
ships. We observe significant influences for µ, σ, r and the tax rates,37 while
α, γ and κ do only marginally influence the level of k∗ and being independent
of η.
37Note, that the coupon level depends on the difference between the effective taxation and
the tax on coupon payments. When the difference goes down to zero there is no tax benefit
to debt, and thus no incentive to issue debt.
19

-200 -100 100 200
500
1000
1500
2000
2500
-200 -100 100 200
500
1000
1500
2000
2500
-200 -100 100 200
500
1000
1500
2000
2500
-200 -100 100 200
10
20
30
40
50
-200 -100 100 200
10
20
30
40
50
PSfrag replacements
XXXXX
equitydebttaxes
managementbankruptcy
Figure 3: Claims as functions of X
Claims
Valuing the different claims in the base case setting, we arrive at the following
results at the initial cash flow level X0 = 100:
E(X0) = 1127.56 D(X0) = 1093.55 M(X0) = 33.17
T (X0) = 1809.42 BC(X0) = 5.23 V (X0) = 4068.93
Treating the claims as functions of the cash flow, we get graphs as shown in
figure 3, where the equity, debt and tax claims are shown in the left panel while
the management and bankruptcy claim, which are of a much smaller order of
magnitude, are shown in the right panel. We can observe, that the tax and
equity claim are convex functions of the state variable, with equity smooth
pasting to zero at the boundary X∗b . The debt claim is concave and approaches
(1−τk)kr
as x→∞.
With regard to the management claim we observe that at the base case param-
eter values it is a convex function of the cash flow, meaning that ceteris paribus
an increase in risk raises the value of the claim. If the management claim is
convex or concave depends on the proportion of fixed and variable compensa-
tions, i.e. on the values of γ, κ and η. The left panel of figure 4 shows the
-200 -100 100 200
20
40
60
80
100
120
5 10 15 20 25
0.02
0.04
0.06
0.08
0.1
5 10 15 20 25
0.02
0.04
0.06
0.08
0.1
PSfrag replacements
X
M(X)
κ = 1
κ = 4.8
κ = 10
M′′ > 0
M′′ < 0
κκ
γγ
Figure 4: Management claim
20

management claim in three different value scenarios, giving a convex, nearly
linear and concave function. The right panel discerns parameter constellations
of γ and κ for which the second derivative (M ′′(X0)) is positive or negative,
respectively. The interpretation is straightforward: A high proportion of fixed
compensation payments makes the management claim more debt-like, while a
high proportion of variable payments makes the claim more equity-like. How-
ever, it is interesting to note that the dividing line (i.e. (γ-κ)-values for which
M ′′ = 0) is nearly linear.38
Leverage
Given the numerical results for debt and equity, we can analyze the compara-
tive static results for the leverage.
In our base case setting we arrive at a leverage - defined as L = DD+E
- of
L = 0.4923, i.e. 49.23%.
This is significantly lower than in Leland (1994),39 but it is well in line with
results by Goldstein et al. (2001) for their static model. However, empirical
results show that leverage levels in practice are still lower, being around 30%.40
Goldstein et al. (2001) demonstrate that lower leverage levels can be obtained
when the model is extended to a dynamic capital structure setup, while Morel-
lec (2004) tries to explain low leverage levels through the empire building desire
of managers. As we will argue in a later section, low leverage levels can also be
the result of an informational asymmetry between managers and investors.
Figure 5 shows comparative static results for the leverage.
A higher drift rate increases the debt capacity and thus increases the leverage,
which is more pronounced for lower risk levels. This is also reflected in the
upper middle panel, where an increase in risk lowers the leverage (plotted for
different levels of the bankruptcy cost). The dependence on the risk free rate
is partly ambiguous and depends on the drift rate, but overall for reasonable
interest rate levels, the influence on the leverage is rather small. This is also
partly true for the bankruptcy costs, where only unreasonable high α-values do
significantly change the leverage. The most important influence on the lever-
age level comes from the tax advantage. Either if τ e is decreased to approach
38M ′′′(X0) ≈ 039An important criticism on the Leland (1994) model was that it could explain observed
leverage levels only by assuming unreasonably high bankruptcy costs.40See e.g. Eom et al. (2004)
21

0.2 0.4 0.6 0.8 10.35
0.375
0.4
0.425
0.45
0.475
0.5
0.525
0.2 0.4 0.6 0.8 1
0.2
0.4
0.6
0.8
1
0.2 0.4 0.6 0.8 1
0.2
0.4
0.6
0.8
1
0.1 0.2 0.3 0.4 0.5
0.5
0.6
0.7
0.8
0.9
5 10 15 20
0.45
0.5
0.55
0.6
0.65
0.7
0.75
0.8
50 100 150 200
0.4
0.5
0.6
0.7
0.8
0.9
0.05 0.1 0.15 0.2
0.46
0.48
0.5
0.52
0.54
0.56
0.58
0.6
PSfrag replacements
LLL
LLLL
σ
σ = 50
σ = 50
σ = 100
σ = 100
σ = 200
σ = 200
µ
µ = 0µ = 2µ = 5
r
ττ
τe
τk
α
α = 0.05α = 0.5α = 0.8
γ
κ
κ = 1κ = 20κ = 50
Figure 5: Comparative statics for the optimal leverage L.
τk = 0.4, or if τk increases to the level of τ e = 0.48 the leverage declines rapidly.
The last parameter shown is γ (lower right panel), and it can be seen that higher
γ-values increase the leverage.41 A higher γ means that a higher share of the
cash flow is going to managers. This leaves the external equity holders with
a smaller part of the cash flow, which gives them an incentive to increase the
value of their claim by taking on more debt.42
Calculating the coupon rate as K = k∗
V (X0) , we arrive at 3.36% in our base
case scenario. This is broadly consistent with results by Goldstein et al. (2001)
as well as with empirical results.43
As a further numerical plausibility check we calculate the recovery rate,
which is given by: R =D(X∗
b )
D(X0) . We find R = 0.1293, or 12.93% which is low
compared to empirical findings where recovery ratios for unsecured senior debt
varies around 45%.44 However, as has been noted in the previous section, we
41This is in line with empirical results from Mehran (1992) who finds a positive relationship
between leverage and the management compensation tied to performance.42We do not consider the case when managers own more than 50% of the firm, since other-
wise managers would have the majority of the voting power and would be able to implement
their optimal leverage levels.43See e.g. Eom et al. (2004)44Altman et al. (2003) find a mean recovery rate for senior unsecured bonds of 42.3%.
Acharya et al. (2004) and Renault & Scaillet (2004) find a mean of 41.9% and 46.7% re-
spectively, but also show that recovery rates vary significantly in different industries. They
find mean recovery rates of 27.3% and 24.7% respectively for the Telecom industry, while in
Utilities recoveries are on average around 68%.
22

assumed the asset value at the bankruptcy threshold to be the value of an all
equity claim on the remaining cash flow generator. In fact, this all equity claim
carries the potential to optimally lever it again, and to be more in line with
a ’realistic’ economic scenario, we would have to calculate the recovery rate
as the ratio of a restructured (i.e. optimally levered) claim at the bankruptcy
threshold to the initial debt value. Taking X∗b = −199.11 as the new initial
cash flow level X ′0 we get a new optimal coupon of k′∗ = 33.34 and the value of
the claim on the restructured assets is V ′(X∗b ) = 539.06. Compared to the all
equity claim at 286.44 this is an increase by the factor of 1.88 and thus the re-
covery rate under the assumption of a restructured claim increases to 24.33%.45
While this is still at the lower boundary for empirical recovery rates, the model
produces values within a reasonable order of magnitude.
Another interesting numerical result produced by the model relates to the
one year probability of default (PD). In the given framework, this amounts to
evaluate the probability that a Brownian motion with drift hits the boundaryXb
from above within a one year time horizon. Applying results from first-passage
theory, we arrive at a PD of 0.00261 or 0.261% in our base case setting.46
A last numerical result relates to equity volatility. Given the cash flow
variability which we assumed to be σ = 100 at X0 = 100 we can calculate the
corresponding equity volatility.47 Clearly, this would imply that all variability
in equity prices is uniquely determined by changes in cash flows.
To determine the annual percentage equity standard deviation, we need to
calculate
√Var[E(X1)]
E(X0) with Var[E(X1)] = E0[E(X1)2] − E0[E(X1)]
2. Thereby,
the expectations have to be taken with respect to the probability law of X1,
which is given by the joint distribution of X, i.e. Brownian motion with drift,
and the first-passage time distribution, i.e.
Prob{Xt ∈ dx, inf{Xs; 0 < s ≤ t} ≥ Xb}
In the base case scenario percentage equity standard deviation turns out to be
45More precisely, this value has been derived by assuming that the restructuring can only
take place once, and that the recovery value of the restructured assets are given by an all
equity claim. Therefore, by allowing for multiple restructurings, this would create additional
recovery value. However, the increase is marginal. (With a restructuring at the restructured
bankruptcy threshold the initial recovery rate is 24.89%)46See appendix A.6 for a derivation.47See appendix A.5 for details.
23

61.24% which is high, but still within a reasonable order of magnitude.
We conclude this section on numerical results by pointing out that while
the model produces results that are broadly plausible, the usual caveat applies,
and it is not our prime interest to formulate a model that closely fits empirical
findings. We are well aware that the model as presented so far still lacks a num-
ber of features that are important factors in real-life capital structure decisions.
Most notably, we consider a static setting while the possibility of changing the
capital structure over time is known to have a significant influence.48 Another
limit is given by the fact that the cash flow dynamics are unaffected by either
capital structure decisions or managerial discretion.49
While these are without doubt important factors, we will focus in the next sec-
tion on another factor which is a significant determinant of capital structure
decisions: the informational asymmetry between managers and investors about
the true cash flow level.
4 Capital structure decision under incomplete infor-
mation
In explaining why the irrelevance hypothesis of Modigliani & Miller (1958) does
not hold, the literature has put forward broadly two classes of arguments. The
first class is based upon agency costs, while the second focuses on informational
asymmetries.50 In this section, we will contribute to the second class in that we
broadly follow the approach taken by Duffie & Lando (2001) who assume that
the incomplete information on the part of investors is given by the fact that
they only receive noisy signals about the relevant state variable. In forming
rational estimates investors are faced with the problem of filtering away this
noise. However, in contrast to considering a one-period problem, we provide
a continuous-time formulation that fits the valuation framework introduced in
the previous section. The solution to continuous-time filtering problems based
upon linear Gaussian processes is given by the so-called Kalman-Bucy filter.
The main idea of this section is to assume that investors, i.e. debt holders as
48See e.g. Goldstein et al. (2001) and references therein49See Leland (1998) or Ericsson (2000)50One could also classify the models into explanations based on moral hazard behavior on
the one hand, and adverse selection problems on the other hand. (See Bohlin (1997), p.200)
24

well as equity holders only receive noisy signals on which they have to rely
when making their investment decisions. In particular, owners will have to de-
termine their optimal bankruptcy threshold and their optimal coupon decision
upon cash flow estimates. These estimates are made by applying the results of
Kalman-Bucy filtering.
4.1 Impact on the optimal capital structure decision
To make things concrete, recall that the cash flow dynamics are given by dXt =
µ dt + σ dWt. However, investors only observe noisy signals of Xt. Denoting
the observation at time t by Ot they can be assumed to be of the form
Ot = Xt + δwt
where wt denotes white noise (independent ofWt), and δ is a scaling parameter.
To obtain a tractable stochastic integral representation,51 we introduce Zt =∫ t
0 Os ds and get the observation process
dZt = Xt dt+ δ dVt (22)
where Vt is Brownian motion (independent of Wt).
The general filtering problem is to find the best estimate of the unobservable
system, given the observed signals. In the present model, this means, investors
have to form their best estimate of the cash flow which they cannot observe di-
rectly. Thereby, the notions of ’observations’ and ’best estimate’ need a precise
interpretation. Denoting the estimate of Xt by ξt, saying that ξt is based on
the observations {Zt} means that ξt is Ft-measurable, where Ft is the σ-algebra
generated by {Zs, s ≤ t}. The best estimate is defined to be the optimal mean
square estimate, which satisfies E[|Xt− ξt|2] = inf{E[|Xt−Yt|2];Y ∈ K}, whereK is the set of Ft-measurable functions.
Now, a fundamental result of filtering theory52 establishes that the solution of
the above filtering problem is found by calculating the conditional expectation
E[Xt|Ft]. In the case of linear Gaussian processes, the solution is known as the
Kalman-Bucy filter.
In our context, it can be shown53 that the solution ξt = E[Xt|Ft] of the system
dXt = µ dt+ σ dWt
dZt = Xt dt+ δ dVt
51see Øksendal (2000), p.8052see Øksendal (2000), or Liptser & Shiryaev (2001)53See appendix A.7 for the derivation.
25

satisfies the following stochastic differential equation
dξt = µ dt+ δ−2St (dZt − ξt dt) (23)
where St = E[(Xt − ξt)2] is the mean square error which satisfies
dSt = (σ2 − δ−2S2t ) dt (24)
Obviously, for the initial condition S0 = δσ the solution to (24) is simply
St = δσ (25)
Alternatively, for an initial condition S0 < δσ or S0 > δσ, in both cases St → δσ
as t→∞. So, we will assume that the mean square error started right away in
its ‘steady state’, or - alternatively - that a sufficient amount of time already
elapsed so that (25) can be justified.
Note, that by defining Ut =∫ t
0dZs−ξsds
δ, we can rewrite (23) as
dξt = µ dt+ δ−1St dUt (26)
Thereby, Ut is a standard Wiener process, which is also referred to as innovation
process.54
St provides us with a measure of the (expected) noise that remains after the
observer have formed their best estimates.
In the present context, this informational noise enters the model at two points
(see figure 6).
Xb,ai
t0
xt
t
Xt
Xbm,ai
tx
Figure 6: Informational asymmetry
i. Equity holders-owners will force the firm into bankruptcy when the level
of their cash flow estimate hits their optimal bankruptcy threshold.
54see e.g. Liptser & Shiryaev (2001)
26

ii. At the time of the capital structure decision (t0), equity holders-owners
can determine their desired coupon level only based upon their cash flow
estimates (ξ).
(ad i) Default event under asymmetric information
As shown in figure 6, the first role played by the informational asymmetry in
our model is given by the determination of the default event.
Recall, that in the previous section the default triggering event was defined
by the first time the cash flow process hits the bankruptcy threshold. This is
plausible in the case when equity holders can perfectly observe the actual cash
flow process and force the firm into bankruptcy when they consider this to be
optimal. However, under asymmetric information they are only able to decide
upon bankruptcy based on their estimations about the cash flows. Therefore,
we assume the default triggering event to be the first time when the estimation
process ξt hits a bankruptcy threshold under asymmetric information, denoted
by Xb,ai. For the time being, Xb,ai is undetermined and need not yet be the
optimal choice.55
Now, rational investors should anticipate that, conditional on the default
event having taken place, i.e. the estimate hits the threshold, the true cash flow
can be higher or lower than the estimate. If the true cash flow actually turns
out to be higher, the default is not justified and we assume that the bankruptcy
procedure is stopped and the firm continues to operate as before. On the other
hand, the actual cash flow may turn out to be lower than estimated. This
presupposes that managers have an incentive to keep quiet about the fact that
the true cash flow level already dropped below the bankruptcy threshold, i.e. to
delay bankruptcy filing. Indeed, since the optimal bankruptcy threshold for the
management is always lower than for equity holders, as discussed in the previous
section, they do have this incentive. Ignoring any other factors, and given that
equity holders haven’t yet claimed bankruptcy, managers will delay bankruptcy
filing until the true cash flow hits their optimal bankruptcy threshold (X∗bm,ai).
With respect to the decision about filing for bankruptcy, the informational
asymmetry provides the manager with a form of entrenchment, which they can
exploit for their self-interest.
This managerial discretion is harmful to the owners because bankruptcy does
not occur at their desired optimal cash flow level, but is delayed to a lower,
55Therefore, it is not distinguished by a star.
27

suboptimal level. It is also harmful to debt holders since in the case when
the true cash flow is lower than estimated and bankruptcy is declared the firm
is liquidated and the former debt holders receive an all equity claim on the
remaining (diminished) cash flows. Clearly, this makes the debt claim more
risky and thus less valuable. In valuing the debt claim ex ante, investors have
to rationally anticipate the managerial self-interest. I.e. investors have to take
into account that managers will not file for bankruptcy at their optimal cash
flow level, and that the liquidation value may correspondingly be based on a
cash flow level that is lower than Xb,ai.
If we call the amount by which the cash flow is lower the informational
shortfall, and denote it by S ≤ 0, then we can introduce XS as the diminished
liquidation cash flow given by
XS = Xb,ai + S
The shortfall S itself consists of two parts: (i) As long as the actual cash flow
is smaller than Xb,ai but higher than Xbm,ai which is the bankruptcy threshold
under asymmetric information chosen by managers, the management has an
incentive to delay bankruptcy filing as discussed above. Therefore, the first
part consists of the expectation taken over the interval (Xbm,ai, Xb,ai), which
we can write as E[(X −Xb,ai) 1{Xbm,ai<X<Xb,ai}]. (ii) On the other hand, with
the remaining probability that the actual cash flow is smaller than Xbm,ai,
i.e. Prob(X ≤ Xbm,ai), investors will get Xbm,ai, because managers have an
endogenous motivation to file for bankruptcy since their optimal bankruptcy
threshold has been hit. This can be written as E[(Xbm,ai−Xb,ai) 1{−∞<X<Xbm,ai}].
Taken together, the shortfall S can be written as
S =
∫ Xb,ai
Xbm,ai
(y −Xb,ai)φ(y) dy +
∫ Xbm,ai
−∞(Xbm,ai −Xb,ai)φ(y) dy (27)
where φ(·) denotes the probability density function of the normal distribution
with mean Xb,ai and standard deviation√δσ, i.e. N (Xb,ai,
√δσ).
The N (Xb,ai,√δσ) distribution is justified since we have E[Xt|ξt = Xb,ai] =
Xb,ai. Therefore, conditional on the bankruptcy event, which is given by ξt =
Xb,ai, the mean of the true cash flow is given by Xb,ai. Furthermore, conditional
on default, we have a variance of Var[Xt] = E[X2t ]−E[Xt]
2 = E[(Xt−E[Xt])2] =
E[(Xt − ξt)2] = St = δσ. The normal distribution is obvious from the fact that
28

the estimation process is driven by a Brownian motion.
This was illustrated in figure 6 as the distribution around the bankruptcy event
at time τξ.
Note again, that the thresholds Xb,ai, Xbm,ai and XS are not yet determined;
an issue we will turn to in the next section.
(ad ii) Capital structure decision with incomplete information
Although, there is an informational asymmetry between managers and investors
with regard to the true cash flow level, we assume no such asymmetry with re-
spect to the capital structure, i.e. the amount of debt issued. Therefore, equity
holders can observe the leverage ratio and enforce the management to imple-
ment their optimal debt level. In other words, we assume that managers do not
enjoy any form of entrenchment with regard to the decision about the coupon
level. As discussed in an earlier section, given that managers are entrenched,
they will always have an incentive to lower the leverage ratio.
However, even without managerial entrenchment the informational asymmetry
plays an important role in determining the optimal coupon to be issued since
equity holders can now base their optimization problem only on their noisy
estimates about the true cash flows.
In the first, but incomplete attempt to determine the optimal threshold for
owners under asymmetric information, we can follow the same reasoning as in
the previous section. Equity holders will determine the optimal (endogenous)
bankruptcy threshold by maximizing their claim. However, this will differ from
the previous X∗b because it will be based upon the estimate ξt. Therefore, we
write the smooth-pasting condition as follows
∂E[E(ξ)]
∂X|X=Xb,ai
= 0 X∗b,ai =
e−12β22δσ
β2− µ
r+ k + κ (28)
Instead of differentiating the equity claim based upon the true cash flow, the
optimality condition now involves the expected equity value based upon the
estimated cash flow, i.e. the smooth-pasting condition refers to the expected
equity value.56
This optimality condition assumes that equity holders only decide upon ex-
pected values, i.e. that they are risk-neutral with respect to the informational
56See appendix A.8 for a derivation.
29

asymmetry. Extending the optimality condition to account for risk averse be-
havior would mean introducing an additional utility function and the corre-
sponding risk aversion parameters. With regard to the effects of risk aversion,
we expect them to work in the same direction and to even aggravate the results
under risk neutrality. Therefore, at this stage of the analysis we assume risk
neutrality, and leave the incorporation of risk aversion for future research.
We can see from (28) that the solution to X∗b,ai has the same form as before
(see eq. (19)), but that it differs in the numerator of the first term, where we
have e−12β22δσ instead of 1. Since the exponent is always negative for δ > 0, this
term is always smaller than one which implies that X∗b,ai > X∗
b , i.e. the optimal
bankruptcy threshold under asymmetric information is ceteris paribus always
higher than under complete information.57 However, this inequality holds only
under the ceteris paribus condition since, as shown in the next section, the in-
formational asymmetry will impact on the optimal debt level which no longer
guarantees the above inequality. In fact, since the optimal coupon under asym-
metric information will be smaller, this might actually reverse the inequality.
Contrary to the complete information case, this is however not the end of the
story. If equity holders took X∗b,ai to be their optimal threshold, they would
ignore the important reasoning from the previous section, namely that man-
agers have an incentive to delay the bankruptcy filing which means that on
average, bankruptcy filing occurs too late for investors. Therefore, let us call
X∗b,ai the naive optimal threshold. In determining their ’sophisticated’ optimal
bankruptcy threshold, equity holders have to take the managerial self-interest
and entrenchment into account.
As discussed above, they know that on average the bankruptcy threshold is
diminished by the shortfall S so that the actual bankruptcy threshold is given
by XS = Xb,ai + S. So, they have to choose Xb,ai such that XS equals X∗b,ai,
i.e. such that the diminished threshold equals their naive optimal threshold.
This implies that the sophisticated threshold, which we will denote by X∗∗b,ai,
should be increased by the shortfall S, i.e.
X∗∗b,ai = X∗
b,ai − S =e−
12β22δσ
β2− µ
r+ k + κ− S (29)
For the management the optimal bankruptcy threshold is still given by (20),
since they have complete information, i.e. they still can determine their opti-
mal threshold based upon the true cash flow. However, given that the optimal
57Note, that for δ = 0 (no noise), e−12β22δσ = 1 and we have the same solution as in (19)
30

coupon issued is affected by the asymmetric information as discussed in the
next section, we obtain X∗bm,ai = X∗
bm(k∗ai).
In going back to equation (27), and after plugging in the optimal solutions for
Xb,ai and Xbm,ai, we see that S appears on both sides of the equation, but
due to the fact, that the integral representation has no closed-form solution we
cannot analytically solve for S. However, numerical solutions can be obtained
and will be presented in the next section.
Given the optimal threshold which, as before, can be interpreted as being a
function of the coupon level: X∗∗b,ai(k), equity holders will maximize the sum of
the ex post equity claim and the proceeds of the debt issue, i.e. if we denote the
optimal coupon issued under asymmetric information by k∗ai, the optimization
problem is given by
k∗ai = maxk
(
E[D(ξt, k,X∗∗b,ai(k)) + E(ξt, k,X
∗∗b,ai(k))]
)
(30)
Note, that in (30) the claims are now evaluated at the current estimate of
the cash flow ξt. Furthermore, since the estimates are known to be random
variables, equity holders care only about the expected values of the claims.58
As in the previous section, the solution to this optimization problem has no
closed form, and we can only provide numerical examples in a later section.59
4.2 Numerical example - Asymmetric information
Bankruptcy thresholds, Informational shortfall and Optimal coupon
With the same base case parameters as in the previous section on complete in-
formation, we present numerical solutions for the bankruptcy thresholds X∗∗bm,ai
and X∗b,ai, for the informational shortfall S and for the optimal coupon k∗ai.
Thereby, three different scenarios for the volatility of the underlying process
(σ) are plotted: Solid line: σ = 100, dotted line: σ = 50, dashed line: σ = 150.
(see figure 7)
In the upper left panel of figure 7 the dependence of the informational short-
fall S on the amount of noise, represented by δ, is shown. As expected, the
higher the informational noise, the higher is the possibility for managers to de-
lay bankruptcy filing, and thus the higher (in absolute terms) is our measure for
58The same remark made above with respect to risk-neutrality applies again.59See appendix A.9 for more details.
31

20 40 60 80 100 120 140
-300
-250
-200
-100
20 40 60 80 100 120 140
-400
-350
-300
-250
-200
-150
20 40 60 80 100 120 140
-40
-30
-20
-10
20 40 60 80 100 120 140
60
80
100
120
140
160
180
PSfrag replacements δ
δ
δ
δ
S k∗ai
X∗∗b,ai
X∗bm,ai
Figure 7: Bankruptcy thresholds, informational shortfall and optimal coupon
under asymmetric information. (solid line: σ = 100, dotted line: σ = 50,
dashed line: σ = 150)
this. Comparing the three graphs, it can be seen that the higher the volatility
of the underlying cash flow process, the higher is c.p. the shortfall. Obviously,
for δ = 0, we have the complete information case, and thus the shortfall is zero.
Taking δ = 50 as our base case value for the noise, we obtain for the shortfall
S = −25.9.The influence of noise on the optimal coupon k∗ai is plotted in the upper right
panel, and it can be observed that we have a decreasing relationship. Higher
noise means that equity holders will want to issue less debt. Comparing the
three graphs, we recognize the relationship already discussed in figure 2 that
higher volatility increases the debt level. For δ = 50 we find a coupon of
k∗ai = 104.32
In the lower left panel the influence of noise on the optimal bankruptcy thresh-
old for owners is displayed, and all three graphs appear nearly constant at
significantly different levels. In the base case scenario we find X∗∗b,ai = −197.33.
The apparent independence can be explained by the fact that the threshold is
among others influenced by the shortfall S and the coupon k∗ai which becomes
obvious from equation (29). Since the two factors have the same dependence on
noise, but enter with different signs in (29), they nearly cancel out each other.
Given a fixed coupon, we have the unambiguous result, that noise always in-
32

creases the bankruptcy threshold.60
The last panel (bottom-right) shows the optimal bankruptcy threshold chosen
by managers, and we see a decreasing relationship. For higher noise levels, man-
agers have a lower optimal threshold. The base case value is: X∗bm,ai = −308.46
For all three parameters it can be verified, that for δ = 0, we get the results
already obtained in the numerical examples under complete information.
Valuation of the claims under asymmetric information
In valuing the different claims under asymmetric information, we now have to
take into account that essentially three parameters have changed: (1) The op-
timal coupon issued, is now k∗ai. (2) The endogenous bankruptcy threshold of
the equity holders is X∗∗b,ai. (3) The liquidation value is given by an all equity
claim on the cash flow at the above bankruptcy threshold: AE(X∗∗b,ai).
These changes have to be taken into account in equations (13) - (17).
-150 -100 -50 50 100 150 200
250
500
750
1000
1250
1500
1750
2000
-150 -100 -50 50 100 150 200
10
20
30
40
50
PSfrag replacements
XX
Figure 8: Valuation of the claims under asymmetric information (dotted line;
δ = 50) and under complete information (solid line).
The resulting graphs for the debt, equity, management and bankruptcy
claim are shown in figure 8 as the dotted lines, where a noise level of δ = 50
is chosen. The solid lines are the graphs for the corresponding claims under
complete information.
The left panel of figure 8 shows the equity (convex) and debt claim (concave
graph). Although one should be careful in comparing the claims under complete
and incomplete information, since both are under the given conditions optima,
it can be observed that debt looses value, while the equity claim increases.
60This can be seen from equation (29): A higher δ lowers the numerator in the first term,
which is negative, and lowers S which enters with a minus sign.
33

This might be attributable to the fact that, although owners do suffer from the
informational asymmetry as well, they are still able to optimally choose the
bankruptcy threshold and the amount of debt to be issued.
In the right panel the graphs for the management and bankruptcy claims are
plotted, and again, applying the same caution, we can observe that the man-
agement claim increases in value which was to be expected since they dispose
of the complete information about the true cash flow.
Leverage ratio under asymmetric information
For our purposes, the most interesting influence of the informational asymme-
try may be given by the change in the leverage ratio since this documents in
how far the capital structure decision is dependent on informational asymme-
tries between management and investors. Figure 9 shows numerical results for
the dependence of the leverage ratio (L) on the amount of noise (δ), displayed
again for three different scenarios for the volatility of the underlying cash flow
process: Solid line: σ = 100, dotted line: σ = 50, dashed line: σ = 150.
First, observe that with no noise (δ = 0) we obtain the leverage ratio already
20 40 60 80 100 120 140
0.3
0.35
0.4
0.45
0.5
PSfrag replacements
δ
L
Figure 9: Leverage ratio under asymmetric information (Solid line: σ = 100,
dotted line: σ = 50, dashed line: σ = 150).
known from the previous section where we treated the complete information
case, i.e. L = 0.492. Furthermore, again without noise, the leverage decreases
(increases) for a higher (lower) volatility of the cash flow process, as discussed
and shown in figure 5.
34

L δ = 0 δ = 20 δ = 50 δ = 80 δ = 120
σ = 100 0.492 0.4307 0.3873 0.3537 0.3148
σ = 50 0.5251 0.4501 0.3872 0.335 0.2729
σ = 150 0.4813 0.4292 0.3963 0.3716 0.3435
Table 1: Numerical leverage ratios.
Now, if the noise increases, we can observe from figure 9 that the leverage ra-
tio starts to decline rapidly. Table 1 presents leverage ratios for selected noise
levels.
The decline in the leverage ratio is significantly more pronounced for a lower
volatility of the cash flow process. For our base case scenario (i.e. σ = 100,
δ = 50) we have a decline in the leverage ratio from 49.2% down to 38.7%
which is a decrease of roughly 20%. For a volatility of σ = 50 and high noise
levels (δ = 120) we can even observe that the leverage ratio drops by nearly
50%!
Thus, we conclude that noise can significantly impact on the optimal leverage
ratio, and decrease it substantially.
As mentioned earlier, empirical leverage ratios vary on average around 30%.61
The incorporation of informational asymmetry in our setup is able to produce
results consistent with these empirical findings.
Another interesting finding is that the impact of a change in the cash flow
volatility on the leverage ratio is reversed for high noise levels. While a nega-
tive relation can be observed for noise levels up to around δ = 50, we get the
reverse influence beyond this level. This is further illustrated in the left panel
of figure 10 where the dependence of L on σ is plotted for tree different noise
levels (Solid line: δ = 50, dotted line: δ = 20, dashed line: δ = 120).
The right panel of figure 10 shows the dependence of the leverage ratio on
the initial cash flow. The optimal coupon decision, and therefore the capital
structure decision depends on the initial cash flow level which we assumed to be
X0 = 100 in the complete information case. In the incomplete information case
the coupon and capital structure decision made by owners is now based upon
their estimate about the cash flow ξ0. With respect to the previous results in
this section we assumed that equity holders have an initial estimate of ξ0 = 100
61See e.g. Eom et al. (2004). However, it has to be stressed, that leverage ratios can heavily
differ among individual corporations.
35

20 40 60 80 100 120 140
0.3
0.4
0.5
0.6
60 80 100 120 140
0.3
0.325
0.35
0.375
0.4
0.425
0.45
PSfrag replacements
σ ξ0
LL
Figure 10: Leverage ratio under asymmetric information - Dependence on σ
(left panel) and ξ0 (right panel). (Solid line: δ = 50, dotted line: δ = 20,
dashed line: δ = 120).
(Clearly, without knowing that their estimate happens to be the true value).
This assumption was made to make the results under asymmetric information
comparable to complete information results.
The dependence shown in the right panel is straight-forward: For any noise
level, the higher the initial estimate with respect to the true cash flow level the
higher will be ceteris paribus the corresponding leverage ratio, whereby this
relationship is more pronounced for high noise levels.
L δ = 0 δ = 20 δ = 50 δ = 80 δ = 120
recovery rate 0.1293 0.1531 0.1714 0.1873 0.2086
coupon rate 0.0336 0.0289 0.0256 0.0231 0.0202
Table 2: Numerical recovery and coupon rates.
Looking at the impact of noise on recovery and coupon rates (see Table 2),
we observe that the recovery rates, defined as Rai =D(X∗∗
b,ai)
D(X0) , increases which
is due to the fact that while the debt value at the bankruptcy threshold is
only slightly affected, it is significantly decreased at the current cash flow level
(compare figure 8). Thus, the denominator decreases, making the ratio higher.
Compared to empirical recovery rates,62 the model with noise produces more
realistic values.
With respect to the coupon rate (Kai =k∗ai
V (X0)) it can be seen from table 2 that
it decreases with higher noise which was to be expected from the fact that the
optimal coupon decreases under noise (compare figure 7).
62See the references cited in footnote 44.
36

5 Conclusion
This paper deals with the impact of asymmetric information on the optimal
capital structure decision. This is done within a framework similar to those
proposed by Goldstein et al. (2001), Dangl & Zechner (2004) or Christensen
et al. (2000), who take the state variable to be the EBIT value of a firm. In
these papers, the cash flow dynamics are modelled as Geometric Brownian mo-
tion, which implies that cash flows never become negative. In contrast, in our
setup, we assume the cash flow to follow an Arithmetic Brownian motion, which
allows for negative values. In fact, as the numerical example shows, the endoge-
nously obtained optimal bankruptcy threshold of equity holders will typically
be negative, i.e. owners will tolerate negative cash flows as long as growth per-
spectives can outweigh the losses.
We further extend the above mentioned models by introducing managers as
having a separate claim on the cash flow. By assuming that their claim consists
of a performance-linked compensation and a fixed pay as well as non-pecuniary
benefits it is shown that the optimal bankruptcy threshold chosen by managers
is always lower than that chosen by equity holders. For the optimal coupon
chosen by managers we find that they would always prefer a coupon as low as
possible. This tendency to avoid debt is consistent with empirical findings.63
The discretionary freedom to follow self-interested goals depends on the degree
of entrenchment with which managers are endowed.
While being instructive, the introduction of a management claim was not a goal
per se, but served as prerequisite to model informational asymmetries between
managers and investors. Equity holders as well as debt holders were assumed
to have only incomplete information with respect to the underlying cash flow
process. They receive noisy signals about the EBIT and in rationally process-
ing this information, they form their best estimates through Bayesian updating.
Within the continuous-time framework this is done by applying Kalman-Bucy
filtering results.
Thereby, the informational asymmetry enters the model at two points. On the
one hand, investors must take into account that their estimate may overesti-
mate the actual cash flow which may actually be already below their optimal
bankruptcy threshold. This follows from the fact that self-interested managers
do have an incentive to delay bankruptcy filing as long as their own optimal
63See the references in footnote 25.
37

threshold hasn’t been hit. With respect to the decision to file for bankruptcy,
the informational asymmetry does provide managers with a form of entrench-
ment. On the other hand, at the time of deciding over the optimal coupon,
equity holders can base their decision only on their cash flow estimates. There-
fore, their optimization problem involves expected values instead of realized
values.
Taken together, the informational asymmetry works towards lowering the coupon
to be issued, while keeping the endogenous bankruptcy threshold of owners
nearly constant. More interestingly, it is shown that the leverage ratio can de-
cline substantially if the informational asymmetry (i.e. the noise component) is
increased. The decline being even more pronounced for a low volatility in the
underlying cash flow process.
It has to be stressed, that this result follows even without assuming that man-
agers do enjoy any entrenchment with respect to the coupon decision.64 If
managers were endowed with additional entrenchment, leverage ratios should
be even lower.
Finally, some remarks on the limits of the model are in order. The capital
structure decision considered here is a static one, i.e. we haven’t considered
the impact of the possibility to change the leverage in the future. Results by
dynamic capital structure models indicate that this additional option works to-
wards lowering the initial leverage ratio. A second limit concerns the possibility
of asset substitution. Managers in our model cannot exert any influence on the
dynamics of the underlying cash flow process. And as a last limit one should
be aware that we haven’t considered the impact of bond covenants or more
generally of exogenously determined bankruptcy thresholds. These three issues
are the subject of further research.
However, subject to the limits just mentioned, the model shows that, even
without an explicit entrenchment of managers, the informational asymmetry
can lead to substantially lower leverage ratios.
64This means, we assume that owners have the possibility to force managers to implement
their optimal coupon level since the coupon decision is observable. However, owners cannot
force managers to follow their optimal liquidation policy since they cannot observe the true
cash flow. This provides managers with an entrenchment with respect to the bankruptcy
decision as mentioned above.
38

References
Acharya, V.V., Bharath, S.T. & Srinivasan, A. (2004). Understanding the re-
covery rates on defaulted securities. working paper , London Business School
and the Centre for Economic Policy Research (CEPR).
Altman, E.I., Resti, A. & Sironi, A. (2003). Default recovery rates in credit risk
modelling: A review of the literature and empirical evidence. working paper ,
Stern School of Business, New York.
Ammann, M. & Genser, M. (2004). A testable ebit-based credit risk model.
working paper , University of St.Gallen.
Berger, P.G., Ofek, E. & Yermack, D.L. (1997). Managerial entrenchment and
capital structure decisions. Journal of Finance, LII, 1411–1438.
Black, F. & Cox, J.C. (1976). Valuing corporate securities: Some effects of bond
indenture provisions. Journal of Finance, XXXI, 351–367.
Bohlin, E. (1997). A survey of managerial incentives and investment bias -
common structure but differing assumptions. Journal of Business Finance &
Accounting , 24, 197–248.
Brennan, M. (2003). Corporate investment policy. In G.M. Constantinides,
M. Harris & R.M. Stulz, eds., Corporate Finance, vol. 21, 1A of Handbook of
the Economics of Finance, Elsevier, Amsterdam.
Brennan, M. & Kraus, A. (1987). Efficient financing under asymmetric infor-
mation. Journal of Finance, XLII, 1225–1243.
Brennan, M. & Schwartz, E.S. (1978). Corporate income taxes, valuation and
the problem of optimal capital structure. Journal of Business, 51, 103–114.
Cetin, U., Jarrow, R.A., Protter, P. & Yildirim, Y. (2003). Modeling credit risk
with partial information. Annals of Applied Probability , forthcoming.
Christensen, P.O., Flor, C.R., Lando, D. & Miltersen, K.R. (2000). Dynamic
capital structure with callable debt and debt renegotiation. working paper ,
University of Copenhagen.
Core, J.E., Holthausen, R. & Larcker, D. (1999). Corporate governance, chief
executive officer compensation, and firm performance. Journal of Financial
Economics, 51, 371–406.
39

Core, J.E., Guay, W.R. & Larcker, D.F. (2003). Executive equity compensation
and incentives: A survey. Economic Policy Review , Federal Reserve Bank of
New York, April 2003.
Dangl, T. & Zechner, J. (2004). Credit risk and dynamic capital structure
choice. Journal of Financial Intermediation, 13, 183–204.
de Jong, A. & Veld, C. (2001). An empirical analysis of incremental capital
structure decisions under managerial entrenchment. Journal of Banking &
Finance, 25, 1857–1895.
Duffie, D. & Lando, D. (2001). Term structures of credit spreads with incom-
plete accounting information. Econometrica, 69, 633–664.
Eom, Y.H., Helwege, J. & Huang, J.Z. (2004). Structural models of corporate
bond pricing: An empirical analysis. Review of Financial Studies, 17, 499–
544.
Ericsson, J. (2000). Asset substitution, debt pricing, optimal leverage and ma-
turity. working paper , McGill University, Montreal.
Fama, E.F. (1980). Agency problems and the theory of the firm. Journal of
Political Economy , 88, 288–307.
Fischer, E.O., Heinkel, R. & Zechner, J. (1989). Dynamic capital structure
choice: Theory and tests. Journal of Finance, XLIV, 19–40.
Francois, P. & Morellec, E. (2004). Capital structure and asset prices: Some
effects of bankruptcy procedures. Journal of Business, 77, 387–403.
Giesecke, K. (2003). Default and information. working paper , Cornell University.
Giesecke, K. & Goldberg, L. (2004). Forecasting default in the face of uncer-
tainty. working paper , Cornell University.
Givoly, D. & Hayn, C. (2000). The changing time-series properties of earnings,
cash flows and accruals: Has financial reporting become more conservative?
Journal of Accounting & Economics, 29, 287–320.
Goldberg, L. (2004). How good is your information? Risk , January 2004.
Goldstein, R., Ju, N. & Leland, H.E. (2001). An ebit-based model of dynamic
capital structure. Journal of Business, 74, 483–512.
40

Graham, J.R. (2000). How big are the tax benefits of debt? Journal of Finance,
LV, 1901–1941.
Grossman, S.J. & Hart, O. (1982). Corporate financial structure and man-
agerial incentives. In J.J. McCall, ed., The Economics of Information and
Uncertainty , The University of Chicago Press, Chicago.
Hackbarth, D., Hennessy, C.A. & Leland, H.E. (2003). The optimal mix of bank
and market debt: An asset pricing approach. working paper , University of
California, Berkeley.
Harris, M. & Raviv, A. (1991). The theory of capital structure. Journal of
Finance, XLVI, 297–355.
Harrison, J. (1985). Brownian Motion and Stochastic Flow Systems. John Wiley
and Sons, New York.
Hart, O. (2001). Financial contracting. Journal of Economic Literature,
XXXIX, 1079–1100.
Huson, M.R., Parrino, R. & Starks, L.T. (2001). Internal monitoring mecha-
nisms and ceo turnover: A long-term perspective. Journal of Finance, LVI,
2265–2297.
Jensen, M.C. (1986). Agency costs of free cash flow, corporate finance, and
takeovers. American Economic Review , 76, 323–329.
Jensen, M.C. & Meckling, W.H. (1976). Theory of the firm: Mangerial behavior,
agency costs and ownership structure. Journal of Financial Economics, 3,
305–360.
Jung, K., Kim, Y.C. & Stulz, R.M. (1996). Timing, investment opportunities,
managerial discretion, and the security issue decision. Journal of Financial
Economics, 42, 159–185.
Kane, A., Marcus, A. & McDonald, R. (1984). How big is the tax advantage to
debt? Journal of Finance, XXXIX, 841–853.
Kane, A., Marcus, A. & McDonald, R. (1985). Debt policy and the rate of return
premium to leverage. Journal of Financial And Quantitative Analysis, 20,
479–499.
41

Karatzas, I. & Shreve, S.E. (1998).Methods of Mathematical Finance, vol. 39 of
Applications of Mathematics. Stochastic Modelling and Applied Probability .
Springer, Berlin, 2nd edn.
Leland, H.E. (1994). Corporate debt value, bond covenants, and optimal capital
structure. The Journal of Finance, XLIX, 1213–1252.
Leland, H.E. (1998). Agency costs, risk management, and capital structure.
Journal of Finance, 53, 1213–1243.
Leland, H.E. & Pyle, D.H. (1977). Informational asymmetries, financial struc-
ture, and financial intermediation. Journal of Finance, XXXII, 371–387.
Leland, H.E. & Toft, K.B. (1996). Optimal capital structure, endogenous
bankruptcy, and the term structure of credit spreads. Journal of Finance,
LI, 987–1019.
Liptser, R.S. & Shiryaev, A.N. (2001). Statistics of Random Processes. General
Theory . Springer, Berlin.
Mehran, H. (1992). Executive incentive plans, corporate control, and capital
structre. Journal of Financial And Quantitative Analysis, 27, 539–560.
Mella-Barral, P. & Perraudin, W. (1997). Strategic debt service. Journal of
Finance, LII, 531–556.
Mello, A.S. & Parsons, J.E. (1992). Measuring the agency costs of debt. Journal
of Finance, XLVII, 1887–1904.
Merton, R.C. (1974). On the pricing of corporate debt: The risk structure of
interest rates. Journal of Finance, 449–470.
Milgrom, P. & Roberts, J. (1992). Economics, Organization and Management .
Prentice Hall, New Jersey.
Modigliani, F. & Miller, M. (1958). The cost of capital, corporation finance,
and the theory of investment. American Economic Review , 48, 261–297.
Morellec, E. (2004). Can managerial discretion explain observed leverage ratios?
Review of Financial Studies, 17, 257–294.
Myers, S.C. (1977). Determinants of corporate borrowing. Journal of Financial
Economics, 5, 147–175.
42

Myers, S.C. (2003). Financing of corporations. In G.M. Constantinides, M. Har-
ris & R.M. Stulz, eds., Corporate Finance, vol. 21, 1A of Handbook of the
Economics of Finance, Elsevier, Amsterdam.
Myers, S.C. & Majluf, N.S. (1984). Corporate financing and investment de-
cisions when firms have information that investors do not have. Journal of
Financial Economics, 13, 187–221.
Noe, T.H. & Rebello, M.J. (1996). Asymmetric information, managerial oppor-
tunism, financing, and payout policies. Journal of Finance, LI, 637–660.
Novaes, W. (2003). Capital structure choice when managers are in control:
Entrenchment versus efficiency. Journal of Business, 76, 49–81.
Øksendal, B. (2000). Stochastic Differential Equations. An Introduction with
Applications. Springer, Berlin, 5th edn.
Palia, D. (2001). The endogeneity of managerial compensation in firm valuation:
A solution. Review of Financial Studies, 14, 735–764.
Renault, O. & Scaillet, O. (2004). On the way to recovery: A nonparametric
bias free estimation of recovery rate densities. Journal of Banking & Finance,
28, 2915–2931.
Ross, S.A. (1977). The determination of financial structure: The incentive-
signalling approach. Bell Journal of Economics, 8, 23–40.
Stein, J.C. (2003). Agency, information and corporate investment. In G.M.
Constantinides, M. Harris & R.M. Stulz, eds., Corporate Finance, vol. 21,
1A of Handbook of the Economics of Finance, Elsevier, Amsterdam.
Stulz, R.M. (1990). Managerial discretion and optimal financing policies. Jour-
nal of Financial Economics, 26, 3–27.
Weiss, L. (1990). Bankruptcy resolution: Direct costs and violation of priority
of claims. Journal of Financial Economics, 27, 285–314.
Zwiebel, J. (1996). Dynamic capital structure under managerial entrenchment.
American Economic Review , 86, 1197–1215.
43

A Appendix
A.1 Laplace transform of the hitting time
Denote τ as the first time a Brownian motion with drift ν hits or exceeds the level
y ≥ 0, i.e.
τ = inf{t ≥ 0;Wt + νt ≥ y}
The transformation formula for E[e−r τ ] is then given by
E[e−r τ ] = exp{νy − y√
ν2 + 2r} (A-1)
(See Karatzas & Shreve (1998), p.63)
We apply this result to the case, where τXBdenotes the first time the process Xt
hits or falls below XB , i.e.
τXB= inf{t ≥ 0;Xt ≤ XB}
Thereby, Xt is assumed to follow an Arithmetic Brownian motion. So, we have Xt =
X0 + µt+ σWt, and we can write
τXB= inf{t ≥ 0;X0 + µt+ σWt ≤ XB}
= inf{
t ≥ 0;Wt −(µ
σ
)
≥ X0 −XB
σ
}
In order to apply the transformation formula (A-1), we identify ν = − µσand y =
X0−XB
σ, from which we get
E[e−r τXB ] = exp{
− µ
σ2(X0 −XB)−
X0 −XB
σ
√
(µ
σ
)2
+ 2r}
= exp{(
− µ
σ2−√
µ2 + 2σ2r
σ2
)
(X0 −XB)}
= exp{β2(X0 −XB)} (A-2)
A.2 Valuation of the various claims
The general solution to the ordinary differential equation
1
2σ2C(xx) + µC(x) − rC +mX + c = 0
has the form
C(X) = A1 eβ1X +A2 e
β2X +mX + c
r+µm
r2
with
β1 =−µ+
√
µ2 + 2σ2r
σ2β2 =
−µ−√
µ2 + 2σ2r
σ2
As mentioned in the text, we will use the following shortcuts to ease notation
X ≡ X
r+
µ
r2XB ≡
XB
r+
µ
r2Xb ≡
Xb
r+
µ
r2
44

All equity claim AE(X)
For the all equity claim we have
m = (1− τ e) c = 0
Therefore, AE(X) has to satisfy the ODE
1
2σ2AE(xx) + µAE(x) − rAE + (1− τ e)X = 0
which has the solution
AE(X) = A1 eβ1X +A2 e
β2X +(1− τ e)X
r+(1− τ e)µ
r2
To determine the coefficients, for X À XB we deduce that A1 = 0, since otherwise the
solution diverges.
On the other hand we have AE(XB) = 0, from which we can deduce A2
AE(XB) = A2 eβ2XB +
(1− τ e)XB
r+(1− τ e)µ
r2= 0
⇔ A2 eβ2XB + (1− τ e)XB = 0
⇔ A2 = −(1− τ e)XB e−β2XB
Therefore, we have the solution
AE(X) = (1− τ e)(
X − XB eβ2(X−XB))
(A-3)
External equity claim E(X)
For the equity claim in the levered case, we have
m = (1− τ e)(1− γ) c = −(1− τ e)(1− γ)(k + κ)
Therefore, E(X) has to satisfy the ODE
1
2σ2E(xx) + µE(x) − rE + (1− τ e)(1− γ)X − (1− τ e)(1− γ)(k + κ) = 0
which has the solution
E(X) = A1 eβ1X+A2 e
β2X+(1− τ e)(1− γ)X − (1− τ e)(1− γ)(k + κ)
r+(1− τ e)(1− γ)µ
r2
To determine the coefficients, for X À Xb we deduce that A1 = 0, since otherwise
the solution diverges.
On the other hand we have E(Xb) = 0, from which we can deduce A2
E(Xb) = A2 eβ2Xb + (1− τ e)(1− γ)
(Xb
r+
µ
r2− k + κ
r
)
= 0
⇔ A2 eβ2Xb + (1− τ e)(1− γ)
(
Xb −k + κ
r
)
= 0
⇔ A2 = −(1− τ e)(1− γ)(
Xb −k + κ
r
)
e−β2Xb
Therefore, we have the solution
E(X) = (1− τ e)(1− γ)(
(
X − (k + κ)
r
)
−(
Xb −(k + κ)
r
)
eβ2(X−Xb))
(A-4)
45

Debt claim D(X)
For the debt claim, we have
m = 0 c = (1− τk)k
Therefore, D(X) has to satisfy the ODE
1
2σ2D(xx) + µD(x) − rD + (1− τk)k = 0
which has the solution
D(X) = A1 eβ1X +A2 e
β2X + (1− τk)k
r
To determine the coefficients, for X À Xb we deduce that A1 = 0, since otherwise
the solution diverges.
On the other hand we have D(Xb) = (1−τ e)(1−α)AE(Xb), from which we can deduce
A2
D(Xb) = A2 eβ2Xb +
(1− τk)k
r= (1− τ e)(1− α)AE(Xb)
⇔ A2 eβ2Xb = (1− τ e)(1− α)AE(Xb)− (1− τk)
k
r
⇔ A2 =(
(1− τ e)(1− α)AE(Xb)− (1− τk)k
r
)
e−β2Xb
Therefore, we have the solution
D(X) =(
D(Xb)− (1− τk)k
r
)
eβ2(X−Xb) + (1− τk)k
r(A-5)
Management claim M(X)
For the management claim, we have
m = (1− τ e)γ c = (1− τk)κ− (1− τ e)γ(k + κ) + η
Therefore, M(X) has to satisfy the ODE
1
2σ2M(xx) + µM(x) − rM + (1− τ e)γX + (1− τk)κ− (1− τ e)γ(k + κ) + η = 0
which has the solution
M(X) = A1 eβ1X+A2 e
β2X+(1− τ e)γX + (1− τk)κ− (1− τ e)γ(k + κ) + η
r+µ(1− τ e)γ
r2
which we abbreviate to
M(X) = A1 eβ1X +A2 e
β2X + (1− τ e)γX − k
by introducing k ≡ (1−τe)γ(k+κ)−(1−τk)κ−η
r.
46

To determine the coefficients, for X À Xb we deduce that A1 = 0, since otherwise
the solution diverges.
On the other hand we have M(Xb) = 0, from which we can deduce A2
M(Xb) = A2 eβ2Xb + (1− τ e)γXb − k = 0
⇔ A2 =(
− (1− τ e)γXb + k)
e−β2Xb
Therefore, we have the solution
M(X) =(
− (1− τ e)γXb + k)
eβ2(X−Xb) + (1− τ e)γX − k (A-6)
Tax claim T (X)
For the tax claim, we have
m = τ e c = (τk − τ e)(k + κ)
Therefore, T (X) has to satisfy the ODE
1
2σ2T(xx) + µT(x) − rT + τ eγX + (τk − τ e)(k + κ) = 0
which has the solution
T (X) = A1 eβ1X +A2 e
β2X +τeX + (τk − τ e)(k + κ)
r+µτe
r2
To determine the coefficients, for X À Xb we deduce that A1 = 0, since otherwise
the solution diverges.
On the other hand we have T (Xb) = τ e(1− α)AE(Xb), from which we can deduce A2
T (Xb) = A2 eβ2Xb +
τeX + (τk − τ e)(k + κ)
r+µτe
r2= τ e(1− α)AE(Xb)
⇔ A2 eβ2Xb + τ eXb + (τ
k − τ e)(k + κ)
r= τ e(1− α)AE(Xb)
⇔ A2 =(
τe(1− α)AE(Xb)− τ eXb − (τk − τ e)(k + κ)
r
)
e−β2Xb
Therefore, we have the solution
T (X) =(
T (Xb)− τ eXb − (τk − τ e)(k + κ)
r
)
eβ2(X−Xb) +
τeX + (τk − τ e)(k + κ)
r(A-7)
Bankruptcy claim BC(X)
For the bankruptcy claim, we have
m = 0 c = 0
Therefore, BC(X) has to satisfy the ODE
1
2σ2BC(xx) + µBC(x) − rBC = 0
47

which has the solution
BC(X) = A1 eβ1X +A2 e
β2X
To determine the coefficients, for X À Xb we deduce that A1 = 0, since otherwise
the solution diverges.
On the other hand we have BC(Xb) = αAE(Xb), from which we can deduce A2
BC(Xb) = A2 eβ2Xb = αAE(Xb)
⇔ A2 = (αAE(Xb))e−β2Xb
Therefore, we have the solution
BC(X) = (αAE(Xb))eβ2(X−Xb) (A-8)
A.3 Optimal XB, Xb, Xbm
Differentiating the all equity claim (AE(X)) with respect to X gives
∂AE(X)
∂X=1− τ e
r− (1− τ e)XB β2 e
β2(X−XB)
or at X = XB1− τ e
r− (1− τ e)XB β2
Setting this to zero1− τ e
r− (1− τ e)XB β2 = 0
and solving for X∗
B yields
X∗
B =1
β2− µ
r(A-9)
Analogous, differentiating the equity claim (E(X)) with respect to X gives
∂E(X)
∂X=(1− τ e)(1− γ)
r− (1− τ e)(1− γ)
(
Xb −(k + κ)
r
)
β2 eβ2(X−Xb)
At X = Xb and set to zero yields
(1− τ e)(1− γ)
r− (1− τ e)(1− γ)
(
Xb −(k + κ)
r
)
β2 = 0
and finally
X∗
b =1
β2− µ
r+ k + κ (A-10)
Finally, differentiating the management claim (M(X)) with respect to X yields
∂M(X)
∂X=(1− τ e)γ
r+(
− (1− τ e)γXbm + k)
β2 eβ2(X−Xbm)
48

At X = Xbm and set to zero yields
(1− τ e)γ
r+(
− (1− τ e)γXbm + k)
β2 = 0
Solving for X∗
bm gives
X∗
bm =1
β2− µ
r+
r
γ(1− τ e)k
Expanding the last term and rearranging terms gives
X∗
bm =1
β2− µ
r+ k +
γ(1− τ e)− (1− τk)
γ(1− τ e)κ− 1
γ(1− τ e)η (A-11)
A.4 Optimal coupon
For equity holders the optimal coupon (at time t) is found by solving the maximization
problem
maxk
(
D(Xt, k,X∗
b (k)) + E(Xt, k,X∗
b (k)))
In principle, the solution is found by differentiating the sum of the equity and debt
claim with respect to k, setting it to zero and solving for k∗. Thereby, both claims make
use of the optimal X∗
b , which is X∗
b =1β2− µ
r+ k + κ. Using the same abbreviations
as before (ref), we write the sum as
Σ(k) = t(
X − k + κ
r− XB eβ2(X−XB−k−κ)
)
+(
a1
(
XB +k + κ
r− XB eβ2(k+κ)
)
− a2 k)
eβ2(X−XB−k−κ) + a2 k
with the additional definitions
t = (1− γ)(1− τ e) a1 = (1− α)(1− τ e)2 a2 =1− τk
r
Differentiating Σ with respect to k yields
∂Σ
∂k= t
(
− 1r+ β2 XB eβ2(X−XB−k−κ)
)
+(
a1
(1
r− β2 XB eβ2(k+κ)
)
− a2
)
eβ2(X−XB−k−κ)
−(
a1
(
XB +k + κ
r− XB eβ2(k+κ)
)
− a2 k)
β2 eβ2(X−XB−k−κ) + a2
Setting this to zero, there exists no closed-form solution for k∗, but it can be solved
numerically.
A.5 Equity volatility
To determine the annual percentage equity standard deviation, we need to calculate
√
Var[E(X1)]
E(X0)
49

with
Var[E(X1)] = E0[E(X1)2]− E0[E(X1)]
2
Thereby, the expectations have to be taken with respect to the probability law of X1,
which is given by the joint distribution of X, i.e. Brownian motion with drift, and the
first-passage time distribution, i.e.
Prob{Xt ∈ dx, inf{Xs; 0 < s ≤ t} ≥ Xb}
From general results of first-passage time distributions of Brownian motion with drift
(See e.g. Harrison (1985)), we know that
f(x, y, t) = Prob{Xt ∈ dx,Mt ≥ y}
=1
σ√t
(
φ(x− µt
σ√t
)
− e2µy
σ2 φ(x− 2y − µt
σ√t
))
where Xt is a general Brownian motion with drift µ and dispersion σ, Mt is defined as
inf{Xt; 0 < s ≤ t}, and X0 = 0. That is, f(x, y, t) is the joint density function for a
Brownian motion with drift starting at the origin and hitting the threshold y < 0.
In our context, y is given by Xb −X0, so that the expectation can be evaluated as
E0[E(X1)] =
∫
∞
Xb−X0
E(X +X0) f(X, (Xb −X0), 1) dX (A-12)
A.6 Probability of default
With the same reasoning as above, we can determine the probability that the firm hits
the bankruptcy threshold within a one-year horizon, which is given by the probability
Prob{inf{Xt; 0 < s ≤ t} ≤ Xb}.From e.g. Harrison (1985), the first passage time distribution is given by
F (t) = Prob{Mt > y} = N(−y + µt
σ√t
)
− e2yµ
σ2 N(y + µt
σ√t
)
where, again, y is in our context Xb − X0, and N(·) is the cumulative distributionfunction of the standard normal distribution.
The one-year probability of default is then
PD1 = 1− F (1)
This is plotted in figure 11 for different values of the underlying cash flow volatility
(σ).
A.7 Kalman filter equation
The extension of the Kalman-Bucy filter can be found in Liptser & Shiryaev (2001),
p.392ff. They establish the follwing result.
Given the system
dXt = (a0(t) + a1(t)Xt + a2(t)Zt)dt+ b1dW1t
dZt = (A0(t) +A1(t)Xt +A2(t)Zt)dt+B1dW2t
50

50 100 150 200 250
0.2
0.4
0.6
0.8
1
PSfrag replacements
PD (in %)
σ
Figure 11: 1-year probability of default
where W 1t and W
2t are independent Wiener processes.
Then the optimal estimate ξt and the mean square error St satisfy the following equa-
tions
dξt = (a0(t) + a1(t)ξt + a2(t)Zt)dt+A1(t)St
B1(t)2(
dZt − (A0(t) +A1(t)ξt +A2(t)Zt)dt)
dSt
dt= 2a1(t)St + b1(t)
2 − A1(t)2S2
t
B1(t)2
In our context, we have
a0(t) = µ, b1(t) = σ A1(t) = 1 B1(t) = δ
a1 = a2 = A0 = A2 = 0
From this it follows, that
dξt = µdt+ δ−2St (dZt − ξt dt) (A-13)
dSt
dt= σ2 − δ−2S2
t (A-14)
For the initial condition S0 = δσ, it is obvious that dSt = 0 and St = δσ. In general,
the solution for St is derived as follows
dSt = (σ2 − δ−2S2
t ) dt
⇔( δ2
σ2δ2 − S2t
)
dSt = dt
⇔ St = δσ(S0 cosh
(
σtδ
)
+ δσ sinh(
σtδ
)
δσ cosh(
σtδ
)
+ S0 sinh(
σtδ
)
)
(A-15)
where(S0 cosh
(
σtδ
)
+ δσ sinh(
σtδ
)
δσ cosh(
σtδ
)
+ S0 sinh(
σtδ
)
)
→ 1 as t→∞
A.8 Optimal Xb under incomplete information
By introducing the following definitions
t = (1− τ e)(1− γ) c1 =( µ
r2− k + κ
r
)
t c2 =(
(
Xb −k + κ
r
)
e−β2Xb
)
t
51

we write the equity claim based on the optimal estimate as
E(ξt) =t
rξt + c1 − c2 e
β2ξt
Taking the expectation gives
E[E(ξt)] =t
rE[ξt] + c1 − c2 e
β2E[ξt]+12β22Var[ξt]
=t
rXt + c1 − c2 e
β2Xt+12β22 St
Differentiating with respect to X at X = Xb gives
∂E[E(ξ)]
∂X|X=Xb
=t
r− c2 β2 e
β2Xb+12β22 St
Setting the result to zero, re-substituting c2 and solving for Xb yields
1
r−(
(
Xb −k + κ
r
)
e−β2Xb
)
β2 eβ2Xb+
12β22 St = 0
1
r−(
(Xb
r+
µ
r2− k + κ
r
)
)
β2 e12β22 St = 0
e−12β22 St
β2=(
Xb +µ
r− (k + κ)
)
Xb =e−
12β22 St
β2− µ
r+ (k + κ) (A-16)
and St = δσ.
A.9 Optimal coupon under incomplete information
The reasoning to determine the optimal coupon under incomplete information is anal-
ogous to appendix A.4. The maximization problem is given by
k∗ai = maxk
(
E[D(ξt, k,X∗∗
b,ai(k)) + E(ξt, k,X∗∗
b,ai(k))])
Using the same abbreviations as before, the sum can be written as
Σ(ξ, k) = t(ξ
r+
µ
r2− k + κ
r−(
X ′b −
k
r
)
eβ2(ξ−X′b−k)
)
+(
a1
(
X ′b +
k
r− XB eβ2(X
′b+k−XB)
)
− a2 k)
eβ2(ξ−X′b−k) + a2 k
where X ′
b =e− 1
2β22 δσ
β2− µ
r+ κ and X ′
b =X′b
r+ µ
r2 . Taking the expectation gives
E[Σ(ξ)] = t(E[ξ]
r+
µ
r2− k + κ
r−(
X ′b −
k
r
)
eβ2((E[ξ]+ 12β2Var[ξ])−X′
b−k))
+(
a1
(
X ′b +
k
r− XB eβ2(X
′b+k−XB)
)
− a2 k)
eβ2((E[ξ]+ 12β2Var[ξ])−X′
b−k) + a2 k
= t(Xt
r+
µ
r2− k + κ
r−(
X ′b −
k
r
)
eβ2((Xt+12β2St)−X′
b−k))
+(
a1
(
X ′b +
k
r− XB eβ2(X
′b+k−XB)
)
− a2 k)
eβ2((Xt+12β2St)−X′
b−k) + a2 k
52

Next, differentiating with respect to k yields
∂E[Σ]
∂k= t
(
− 1r+(
β2
(
X ′b −
k
r
)
+1
r
)
eβ2((Xt+12β2St)−X′
b−k))
+(
a1
(1
r− β2 XB eβ2(X
′b+k−XB)
)
− a2
)
eβ2((Xt+12β2St)−X′
b−k)
−(
a1
(
X ′b +
k
r− XB eβ2(X
′b+k−XB)
)
− a2 k)
β2 eβ2((Xt+
12β2St)−X′
b−k) + a2
Again, setting this to zero, this cannot explicitly be solved for k, but numerical results
are available.
53