Embed Size (px)
Citation preview
INFLUENCE OF TRIBUTARIES ON SALINITY OF AMISTAD INTERNATIONAL RESERVOIR
S. Miyamoto, Fasong Yuan and Shilpa Anand
Texas A&M University Agricultural Research Center at El Paso Texas Agricultural Experiment Station
An Investigatory Report Submitted to Texas State Soil and Water Conservation Board and
U.S. Environmental Protection Agency In a partial fulfillment of
A contract TSSWCB, No. 04-11 and US EPA, No. 4280001
Technical Report TR – 292 April 2006

ACKNOWLEDGEMENT
The study reported here was performed under a contract with the Texas State Soil and Water Conservation Board (TSSWCB Project No. 04-11) and the U.S. Environmental Protection Agency (EPA Project No. 4280001). The overall project is entitled “Basin-wide Management Plan for the Pecos River in Texas”. The materials presented here apply to Subtask 1.6; “River Salinity Modeling”. The cost of exploratory soil sample analyses was defrayed in part by the funds from the Cooperative State Research, Education, and Extension Service, U.S. Department of Agriculture under Agreement No. 2005-34461-15661. The main data set used for this study came from an open file available from the U.S. Section of the International Boundary and Water Commission (US-IBWC), and some from the Bureau of Reclamation (BOR). Administrative support to this project was provided by the Texas Water Resource Institute (TWRI). Logistic support to this project was provided by Jessica N. White and Olivia Navarrete, Student Assistants. This document was reviewed by Nancy Hanks of the Texas Clean Rivers Program (TCRP), Gilbert Anaya of the US-IBWC, and Kevin Wagner of the Texas Water Resource Institute (TWRI).
CONTENTS
ACKNOWLEDGEMENT……………………………………………………………….…..….. 1 INTRODUCTION………………………………………………………………………………. 2 STUDY AREA………………………………………………………………………………….. 3 DATA SOURCES AND PROCESSING Data Sources…………………………………………………………………………….. 5 Data Processing…………………………………………………………………………..6 RESULTS AND DISCUSSION Inflow Salinity and Salt Load…………………………………………………………… 9
Salt Balance and Salt Flushing…………………………………………………………. 12 Salinity of Reservoir Release……………………………………………………………17
Potential Scenarios for Elevated Salinity……………………………..…………………20 CONCLUSIONS……………………………..………………………………………………… 21 REFERENCES……………………………..………………………………………………….. 22
Unit Conversion
1 m = 3.3 ft 1 ft = 30.5 cm 1 km = 0.621 miles 1 ha = 2.47 acre 1 acre = 0.405 ha 1 km2 = 247 acres 1 m3 = 35.3 ft3 1 ft3 = 28.3 L 1 Mm3 = 0.811 A-F
1
INTRODUCTION
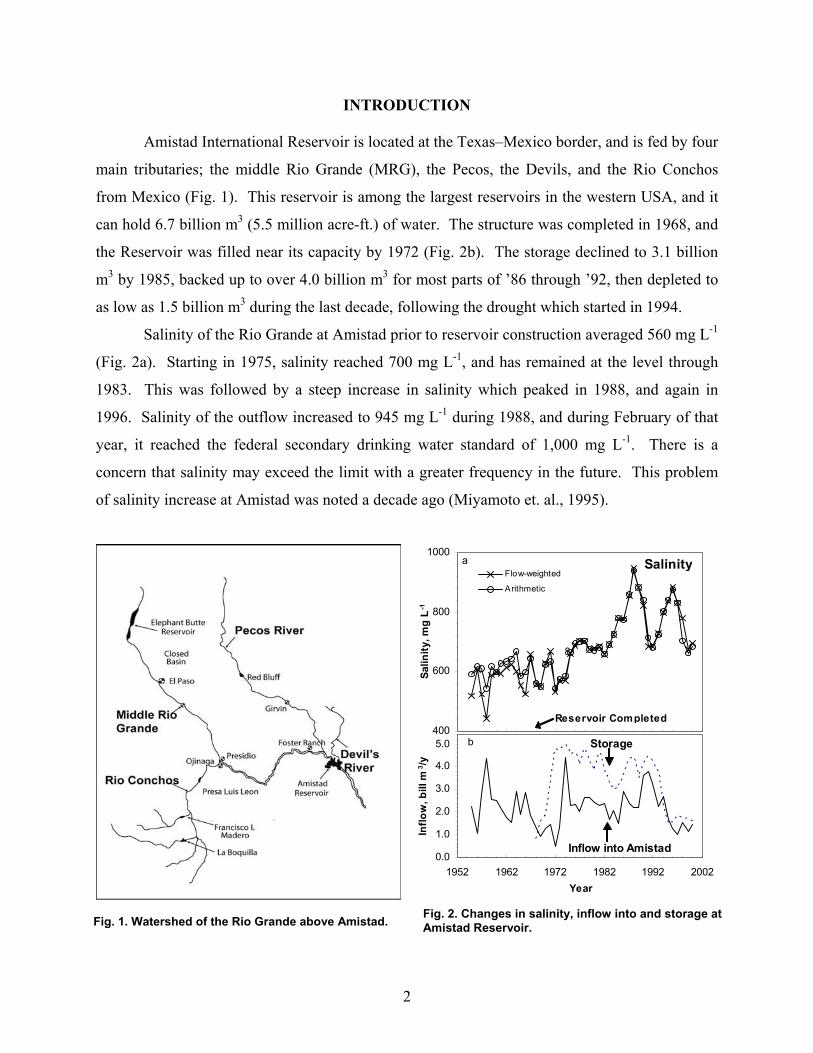
Amistad International Reservoir is located at the Texas–Mexico border, and is fed by four
main tributaries; the middle Rio Grande (MRG), the Pecos, the Devils, and the Rio Conchos
from Mexico (Fig. 1). This reservoir is among the largest reservoirs in the western USA, and it
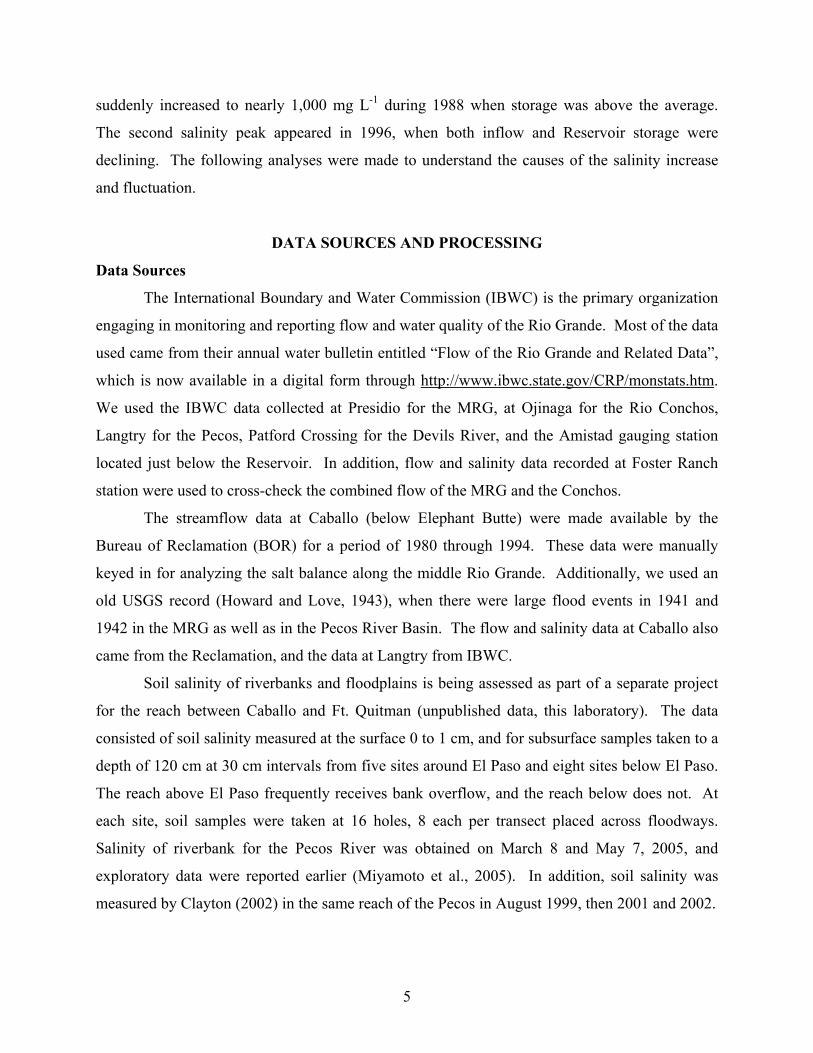
can hold 6.7 billion m3 (5.5 million acre-ft.) of water. The structure was completed in 1968, and
the Reservoir was filled near its capacity by 1972 (Fig. 2b). The storage declined to 3.1 billion
m3 by 1985, backed up to over 4.0 billion m3 for most parts of ’86 through ’92, then depleted to
as low as 1.5 billion m3 during the last decade, following the drought which started in 1994.
Salinity of the Rio Grande at Amistad prior to reservoir construction averaged 560 mg L-1
(Fig. 2a). Starting in 1975, salinity reached 700 mg L-1, and has remained at the level through
1983. This was followed by a steep increase in salinity which peaked in 1988, and again in
1996. Salinity of the outflow increased to 945 mg L-1 during 1988, and during February of that
year, it reached the federal secondary drinking water standard of 1,000 mg L-1. There is a
concern that salinity may exceed the limit with a greater frequency in the future. This problem
of salinity increase at Amistad was noted a decade ago (Miyamoto et. al., 1995).
400
600
800
1000
1952.00 1962.00 1972.00 1982.00 1992.00 2002.00
Salin
ity, m
g L
-1
Flow-weighted
Arithmetic
Salinitya
8
0.0
1.0
2.0
3.0
4.0
5.0
1952 1962 1972 1982 1992 2002Year
Inflo
w, b
ill m
3 /y
Storageb
Inflow into Amistad
Reservoir Completed
Fig. 2. Changes in salinity, inflow into and storage at Amistad Reservoir. Fig. 1. Watershed of the Rio Grande above Amistad.
2
Meantime, a reconnaissance survey was carried out for identifying salt sources which are
enterin
influence of tributaries on salinity fluctuation at
Amista
STUDY AREA
The area above Amistad is semi- ainfall ranging from 20 cm (7.8 inches)
t feeder, accounting for 33% of the inflow into the
Reserv
was once the large feeder of the Rio Grande, but now provides only 9.5% of the total inflow into
g the Pecos River (Miyamoto et al., 2005). The report indicates that the Pecos River had
largely been salinized due to saline water intrusion, and through the reduction in streamflow that
is needed for diluting the saline water intrusion. The flow of the MRG below El Paso has also
declined after the construction of Elephant Butte, and saline irrigation returnflow has deposited
large quantities of salts in the reach between El Paso and Presidio. Consequently, bank salinity
is extremely high in the MRG below El Paso. The Rio Conchos from Mexico has historically
provided the largest inflow into Amistad. According to the data from the US section of the
International Boundary and Water Commission (US-IBWC), salinity of this flow when enters the
Rio Grande has been steadily increasing in the recent decades. These are not good signs from
the view of maintaining low salinity at Amistad.
This study was conducted to identify the
d. This type of assessment may be useful for developing salinity control and water
management strategies. The data shown in Fig. 2 indicate that the first peak appeared during the
high storage period under a seemingly normal inflow situation, and will be the focus of this
study. The second peak appeared in 1996 during a low flow and low storage period. This
increase is certainly drought-related.
arid with annual r
at El Paso to 37 cm (14.5 inches) at Langtry, and 43 cm (17 inches) at the Reservoir. Pan
evaporation ranges from 270 cm (108 inches) per year at El Paso to 230 cm (91 inches) at
Langtry, and 220 cm (87 inches) at the Reservoir. Most rainfall occurs in warm months of May
through September. The monsoon rain usually comes in July and August in El Paso, and
September in most other areas of the Basin.
The Rio Conchos is by far the larges
oir since its construction in 1968 (Table 1)1-. The watershed is the Mapimi Basin of
Mexico, and the flow fluctuates widely as this watershed is in the warm monsoon climatic zone.
The River enters into the Rio Grande just below Presidio (or Ojinaga, MX). The Pecos River
1-This inflow figure includes the reduced flow from fresh water creeks, whereas an earlier report (Miyamoto et al., 1995) is based strictly on gauged flow.
3
the Reservoir1-. This river originates in
northeastern New Mexico, and is impounded by
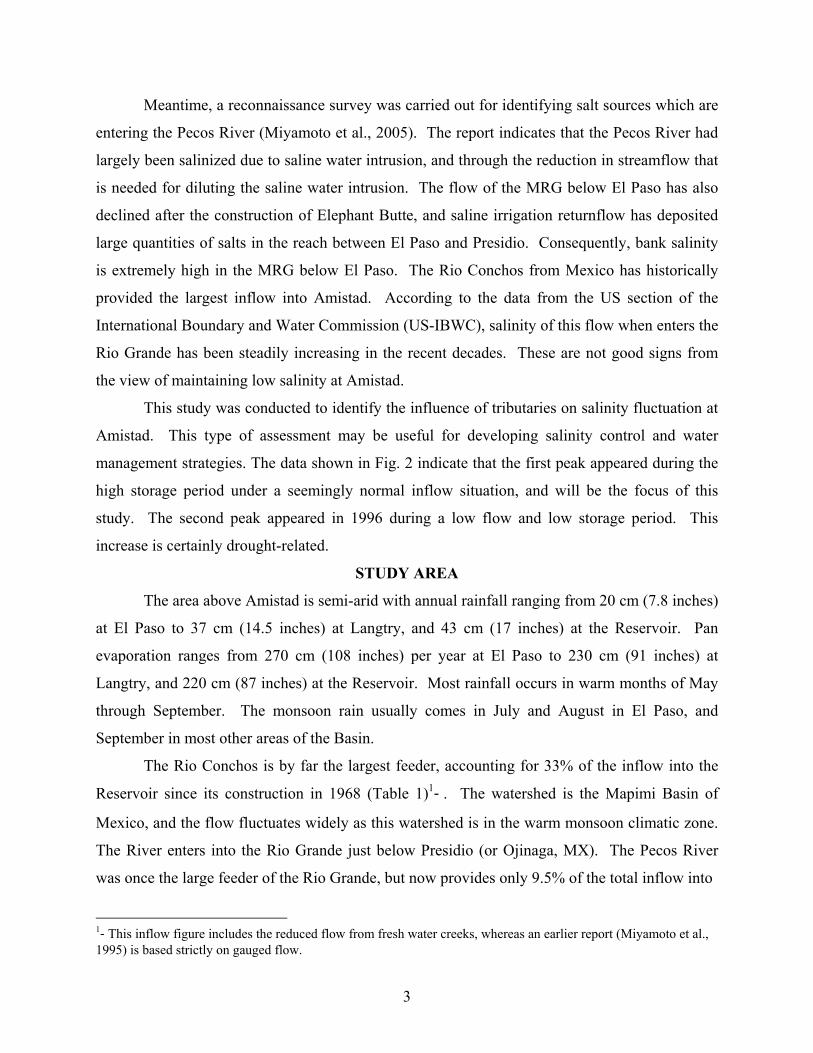
Table 1. Flow and storage characteristics of Amistad Reservoir (IBWC data for 1969-2000).
sed extensively for
irrigatio
n
The Devils River originates from the
is river has not been developed for
any ma
ty of the Reservoir
a series of reservoirs in New Mexico, and Red
Bluff Dam in Texas. Dissolution of geological
evaporites (mainly gypsum, halite, and epsomite)
into the deep canyon flow of the Pecos makes it
among the saltiest (Miyamoto et al., 2005). The
bank of this river was once infested heavily with
Tamarisk (salt cedars), but the riparian zones in
the Texas portion were cleared through the recent
eradication efforts extending from 1999 to 2004
(Hart, 2004). The Pecos River enters the Rio
Grande near Langtry.
The middle Rio Grande starts at Elephant
Butte Reservoir, and is u
n and municipal water supply. The flow
below El Paso is low, and riverbank had been
salinized due to lack of bank overflow
(Unpublished data, this laboratory). Salt cedar
became the dominant riparian vegetation below
g discussed.
Edward Plateau, and provides fresh water along
with several other creeks and arroyos into the Reservoir. Th
El Paso down to Presidio, and its control is bei
StorageMaximum Capacity 6.83Mean (1969-2000) 3.43Surface Area
at high storage (4.5 billion m3) 27.7at medium storage (3.0 billion m3) 20.3at low storage (1.5 billion m3) 11.2mean surface area 22.1
Pan Evaporation (mm/year) 2200Rainfall (mm/year) 430Residence time1
-at high storage (4.5 billion m3) 1.5at medium storage (3.0 billion m3) 1.1at low storage (1.5 billion m3) 1.0
Inflow sources Rio Conchos 844Devils 351Pecos 245Middle Rio Grande 188Others2
- 943Total 2571
1-Based on the actual inflow data.
2-"Others" denote measured, and unmeasured
fresh water inflow estimated by the annual water balance.
(billion m )
(thousand ha)
(million m3/y)
(years)
3
jor irrigation activities. The fresh water inflow into the Reservoir, excluding the Devils
River, is estimated to be as high as 943 million m3 (760,000 acre-ft) per year through water
balance calculations. The estimate by the US-IBWC is slightly larger, 1,030 million m3 (830,000
acre-ft) per year. If there is no fresh water inflow into the Reservoir, the mean salinity would top
1,050 mg L-1, which is the mean salinity of the three main tributaries. With the inflow of fresh
water, the mean salinity, as will be shown later, decreases to 643 mg L-11-.
The salinity measured in outflow usually exceeds the inflow salinity because of
evaporative concentration. However, this does not explain why salini
4
suddenly increased to nearly 1,000 mg L-1 during 1988 when storage was above the average.
The second salinity peak appeared in 1996, when both inflow and Reservoir storage were
declining. The following analyses were made to understand the causes of the salinity increase
and fluctuation.
DATA SOURCES AND PROCESSING
Data Sources
The International B the primary organization
nitoring and reporting flow and water quality of the Rio Grande. Most of the data
used ca
oundary and Water Commission (IBWC) is
engaging in mo
me from their annual water bulletin entitled “Flow of the Rio Grande and Related Data”,
which is now available in a digital form through http://www.ibwc.state.gov/CRP/monstats.htm.
We used the IBWC data collected at Presidio for the MRG, at Ojinaga for the Rio Conchos,
Langtry for the Pecos, Patford Crossing for the Devils River, and the Amistad gauging station
located just below the Reservoir. In addition, flow and salinity data recorded at Foster Ranch
station were used to cross-check the combined flow of the MRG and the Conchos.
The streamflow data at Caballo (below Elephant Butte) were made available by the
Bureau of Reclamation (BOR) for a period of 1980 through 1994. These data were manually
keyed
a, this laboratory). The data
consist
in for analyzing the salt balance along the middle Rio Grande. Additionally, we used an
old USGS record (Howard and Love, 1943), when there were large flood events in 1941 and
1942 in the MRG as well as in the Pecos River Basin. The flow and salinity data at Caballo also
came from the Reclamation, and the data at Langtry from IBWC.
Soil salinity of riverbanks and floodplains is being assessed as part of a separate project
for the reach between Caballo and Ft. Quitman (unpublished dat
ed of soil salinity measured at the surface 0 to 1 cm, and for subsurface samples taken to a
depth of 120 cm at 30 cm intervals from five sites around El Paso and eight sites below El Paso.
The reach above El Paso frequently receives bank overflow, and the reach below does not. At
each site, soil samples were taken at 16 holes, 8 each per transect placed across floodways.
Salinity of riverbank for the Pecos River was obtained on March 8 and May 7, 2005, and
exploratory data were reported earlier (Miyamoto et al., 2005). In addition, soil salinity was
measured by Clayton (2002) in the same reach of the Pecos in August 1999, then 2001 and 2002.
5
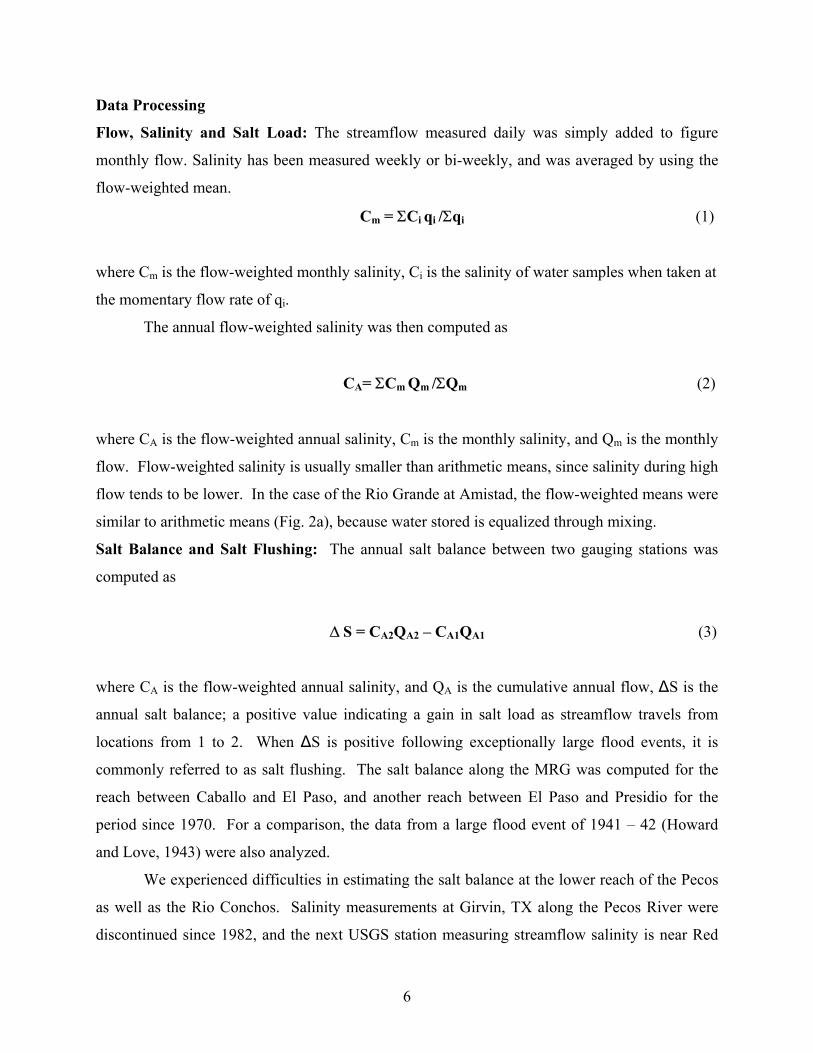
Data Processing
Flow, Salinity and Salt Load: The streamflow measured daily was simply added to figure
monthly flow. Salinity has been measured weekly or bi-weekly, and was averaged by using the
an.
eighted monthly salinity, Ci is the salinity of water samples when taken at
the momentary flow rate of qi
The annual flow-weighted salinity was then computed as
CA= ΣCm Qm /ΣQm (2)
where C is the flow-weighted annual salinity, Cm is the monthly salinity, and Qm is the monthly
flow. F
flow te s to be lower. In the case of the Rio Grande at Amistad, the flow-weighted means were
flow-weighted me
Cm = ΣCi qi /Σqi (1)
where Cm is the flow-w
.
A
low-weighted salinity is usually smaller than arithmetic means, since salinity during high
nd
similar to arithmetic means (Fig. 2a), because water stored is equalized through mixing.
Salt Balance and Salt Flushing: The annual salt balance between two gauging stations was
computed as
∆ S = CA2QA2 – CA1QA1 (3)
where CA is the flow-weighted annual salinity, and QA is the cumulative annual flow, ∆S is the
nnual alt ba nce; a ositiv e flo trave
cations from 1 to 2. When ∆S is positive following exceptionally large flood events, it is
t USGS station measuring streamflow salinity is near Red
a s la p e valu indicating a gain in salt load as stream w ls from
lo
commonly referred to as salt flushing. The salt balance along the MRG was computed for the
reach between Caballo and El Paso, and another reach between El Paso and Presidio for the
period since 1970. For a comparison, the data from a large flood event of 1941 – 42 (Howard
and Love, 1943) were also analyzed.
We experienced difficulties in estimating the salt balance at the lower reach of the Pecos
as well as the Rio Conchos. Salinity measurements at Girvin, TX along the Pecos River were
discontinued since 1982, and the nex
6
Bluff,
where ob is the observed flow, and Cob is the corresponding salinity, CB and CI are salinity of
the baseflow a e e base e r
lease or stormflow, respectively. Equation 4 simply indicates that the observed salt load is a
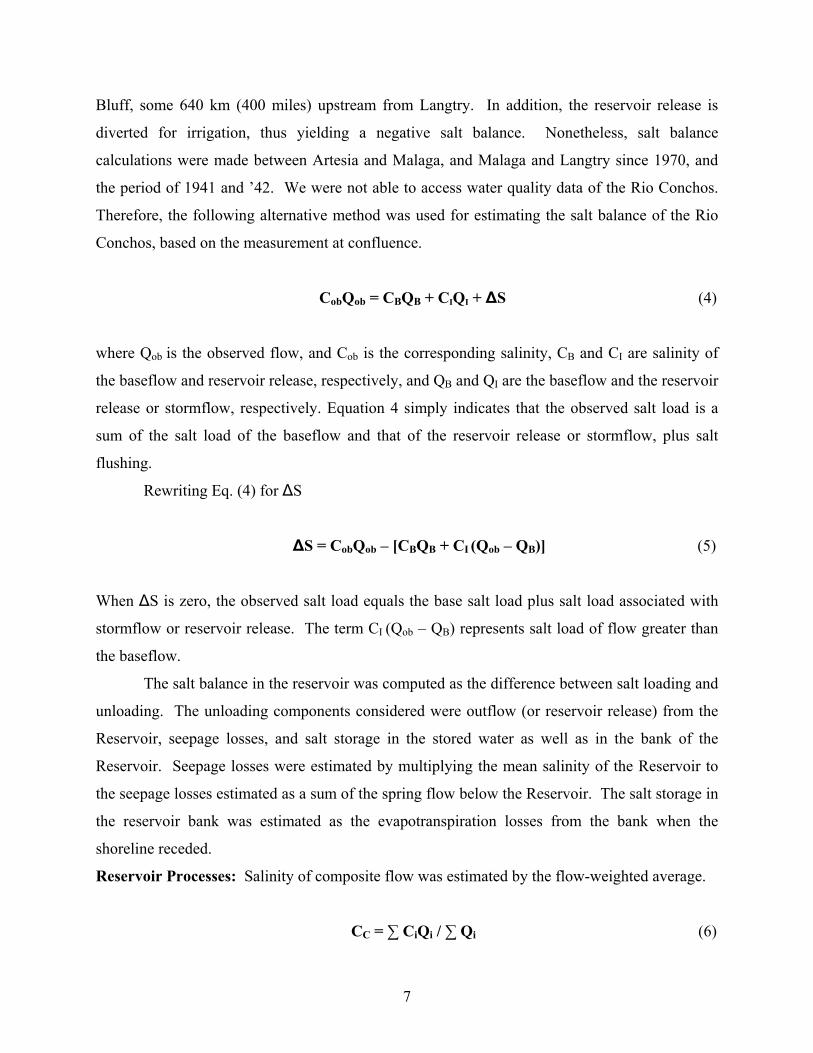
∆S = CobQob – [CBQB + CI (Qob – QB)] (5)
hen ∆S is zero, the observed salt load equals the base salt load plus salt load associated with
stormflow or reservoi
the baseflow.
age losses, and salt storage in the stored water as well as in the bank of the
CC = ∑ CiQi / ∑ Qi (6)
some 640 km (400 miles) upstream from Langtry. In addition, the reservoir release is
diverted for irrigation, thus yielding a negative salt balance. Nonetheless, salt balance
calculations were made between Artesia and Malaga, and Malaga and Langtry since 1970, and
the period of 1941 and ’42. We were not able to access water quality data of the Rio Conchos.
Therefore, the following alternative method was used for estimating the salt balance of the Rio
Conchos, based on the measurement at confluence.
CobQob = CBQB + CIQI + ∆S (4)
Q
nd reservoir release, respectively, and QB and QI ar th flow and th eservoir
re
sum of the salt load of the baseflow and that of the reservoir release or stormflow, plus salt
flushing.
Rewriting Eq. (4) for ∆S
W
r release. The term CI (Qob – QB) represents salt load of flow greater than
The salt balance in the reservoir was computed as the difference between salt loading and
unloading. The unloading components considered were outflow (or reservoir release) from the
Reservoir, seep
Reservoir. Seepage losses were estimated by multiplying the mean salinity of the Reservoir to
the seepage losses estimated as a sum of the spring flow below the Reservoir. The salt storage in
the reservoir bank was estimated as the evapotranspiration losses from the bank when the
shoreline receded.
Reservoir Processes: Salinity of composite flow was estimated by the flow-weighted average.
7

where i denotes individual flow.
Salinity of the inflow is buffered by reservoir storage. The salt balance in reservoir was
here V0 is the initial storage with its salt concentration CSO, and QC is the inflow into the
alculations.
sses (Killworth and Carmack, 1979). At the top layer,
here dTOP is the depth of the top layer subject to evaporative concentration, A is the water
is th ume
eservoir. The depth of the top layer (dTOP) was calibrated by solving Eq. (8) for dTOP and by
here VE, the volume of water evaporated, and is to be calculated by multiplying the water
an
sed, following the calibration data of Texas Water Development Board (Unpublished). This
here VP is the percolation loss, estimated from perennial springs which appear below the reser-
first described as
CS = (CSOV0 + CCQC) / (V0 + QC) (7)
w
reservoir. The value for VSO is updated by Eq. (10), and CS became CSO in subsequent
c
Once CS is estimated, the reservoir water storage was assumed to consist of two layers;
the top layer which is subject to evaporation and rainfall, and the second layer subjected to
percolation lo
CTOP = dTOPACS / (dTOPA – VE + VR) (8)
w
surface area, VE e volume of water evaporated, and VR the vol of rain fallen on the
r
substituting the measured outflow concentration COUT for CTOP.
dTOPA = COUT (VE – VR) / (COUT – CS) (9)
w
surface area and the pan coefficient to the pan evaporation data. The p coefficient of 0.70 was
u
pan coefficient was also found to be suitable in some other studies (e.g., Khan and Bohra, 1990).
The new reservoir storage was then calculated as
Vi = Vi - 1 + QC – VOUT – VE + VR – VP (10)
w
8
v d is the outflow from the reservoir. oir, an VOUT
nflow Salinity and Salt Load
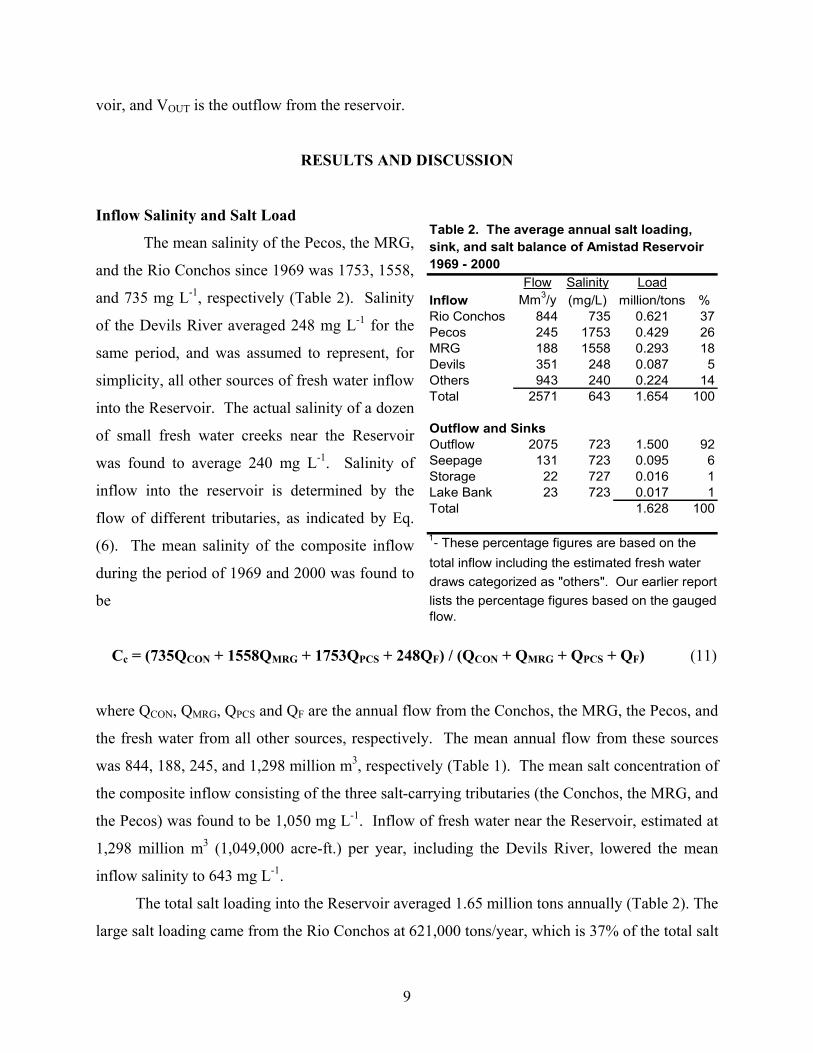
The mean salinity of the
nd the Rio Conchos since 1969 was 1753, 1558,
able 2). Salinity
here QCON, QMRG, QPCS and QF are the annual flow from
as 844, 188, 245, and 1,298 million m3, respectively (Table 1). The mean salt concentration of
large salt loading came from the Rio Conchos at 621,000 tons/year, which is 37% of the total salt
Flow
RESULTS AND DISCUSSION
I
Pecos, the MRG, sink, and salt b
a
and 735 mg L-1, respectively (T
of the Devils River averaged 248 mg L-1 for the
same period, and was assumed to represent, for
simplicity, all other sources of fresh water inflow
into the Reservoir. The actual salinity of a dozen
of small fresh water creeks near the Reservoir
was found to average 240 mg L-1. Salinity of
inflow into the reservoir is determined by the
flow of different tributaries, as indicated by Eq.
(6). The mean salinity of the composite inflow
during the period of 1969 and 2000 was found to
be
Cc = (735QCON + 1558QMRG + 1753QPCS + 248Q
F) / (QCON + QMRG + QPCS + QF) (11)
the Conchos, the MRG, the Pecos, and
Inflow Mm /y (mg/L) million/tons %Rio Conchos 844 735 0.621 37Pecos 245 1753 0.429 26MRG 188 1558 0.293 18Devils 351 248 0.087 5Others 943 240 0.224 14Total 2571 643 1.654 100
Outflow and SinksOutflow 2075 723 1.500 92Seepage 131 723 0.095 6Storage 22 727 0.016 1Lake Bank 23 723 0.017 1Total 1.628 100
1-These percentage figures are based on the total inflow including the estimated fresh water draws categorized as "others". Our earlier report lists the percentage figures based on the gauged flow.
Salinity Load3
Table 2. The average annual salt loading, alance of Amistad Reservoir
1969 - 2000
w
the fresh water from all other sources, respectively. The mean annual flow from these sources
w
the composite inflow consisting of the three salt-carrying tributaries (the Conchos, the MRG, and
the Pecos) was found to be 1,050 mg L-1. Inflow of fresh water near the Reservoir, estimated at
1,298 million m3 (1,049,000 acre-ft.) per year, including the Devils River, lowered the mean
inflow salinity to 643 mg L-1.
The total salt loading into the Reservoir averaged 1.65 million tons annually (Table 2). The
9
loading, mainly because of its large inflow into Amistad. The Conchos provided 884 million m3
of flow every year, which is 33% of the inflow into the Reservoir. Salt loading from the Pecos
of salinity increase
and the MRG were 26 and 18%, respectively. The Pecos River accounted for 9.5% of the total
inflow, and the MRG 7.3% of the inflow. These two tributaries provided 16.8% of the total
inflow into the Reservoir, yet 44% of the salt loading. The three tributaries account for 81% of
the total salt loading into the Reservoir. The contribution of flow and salt loading from the main
tributaries shown in Table 2 is smaller than the figures reported earlier by Miyamoto et al.
(1995), mainly because the previous estimate was based on gauged inflow only, excluding the
estimated freshwater inflow obtained through the mass balance calculation.
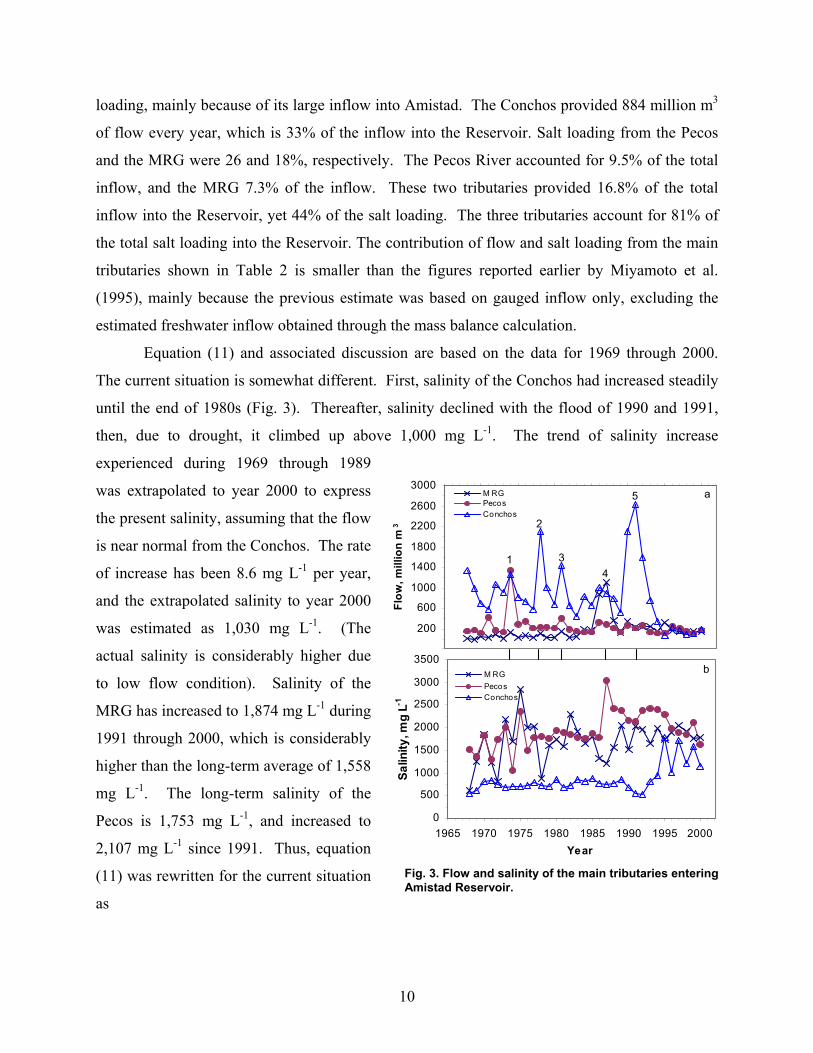
Equation (11) and associated discussion are based on the data for 1969 through 2000.
The current situation is somewhat different. First, salinity of the Conchos had increased steadily
until the end of 1980s (Fig. 3). Thereafter, salinity declined with the flood of 1990 and 1991,
then, due to drought, it climbed up above 1,000 mg L-1. The trend
10
Fig. 3. Flow and salinity of the main tributaries entering Amistad Reservoir.
-200
200
600
1000
1400
Flow
, mi
4
0
500
1000
1500
2000
2500
3000
3500
1965 1970 1975 1980 1985 1990 1995 2000Year
Salin
ity, m
g L-1
M RGPecosConchos
b
Fig. 3. Flow and salinity of the main tributaries entering Amistad Reservoir.
experienced during 1969 through 1989
was extrapolated to year 2000 to express
the present salinity, assuming that the flow
is near normal from the Conchos. The rate
of increase has been 8.6 mg L-1 per year,
and the extrapolated salinity to year 2000
was estimated as 1,030 mg L-1. (The
actual salinity is considerably higher due
to low flow condition). Salinity of the
MRG has increased to 1,874 mg L-1 during
1991 through 2000, which is considerably
higher than the long-term average of 1,558
mg L-1. The long-term salinity of the
Pecos is 1,753 mg L-1, and increased to
2,107 mg L-1 since 1991. Thus, equation
(11) was rewritten for the current situation
as
1800
2200
3000
ion
m3
2600
ll
M RG
Conchos
a
2
5Pecos
1 3
Cc = (1030QCON + 1874QMRG + 2170QPEC + 248QF) / (QCON + QMRG + QPEC + QF) (12)
he average salinity of the three salt-carrying flow is estimated at 1,383 mg L-1 for the decade of -1
We assumed that the flow stayed the same, and salinity of the fresh water flow has not
ed in 1974 from the Pecos when the
T
1990s, which is a significant increase over the long term mean of 1,050 mg L for 1969 through
2000.
changed. Salinity of the composite flow was estimated to be 807 mg L-1, which is a significant
increase over 643 mg L-1 estimated for 1969 through 2000.
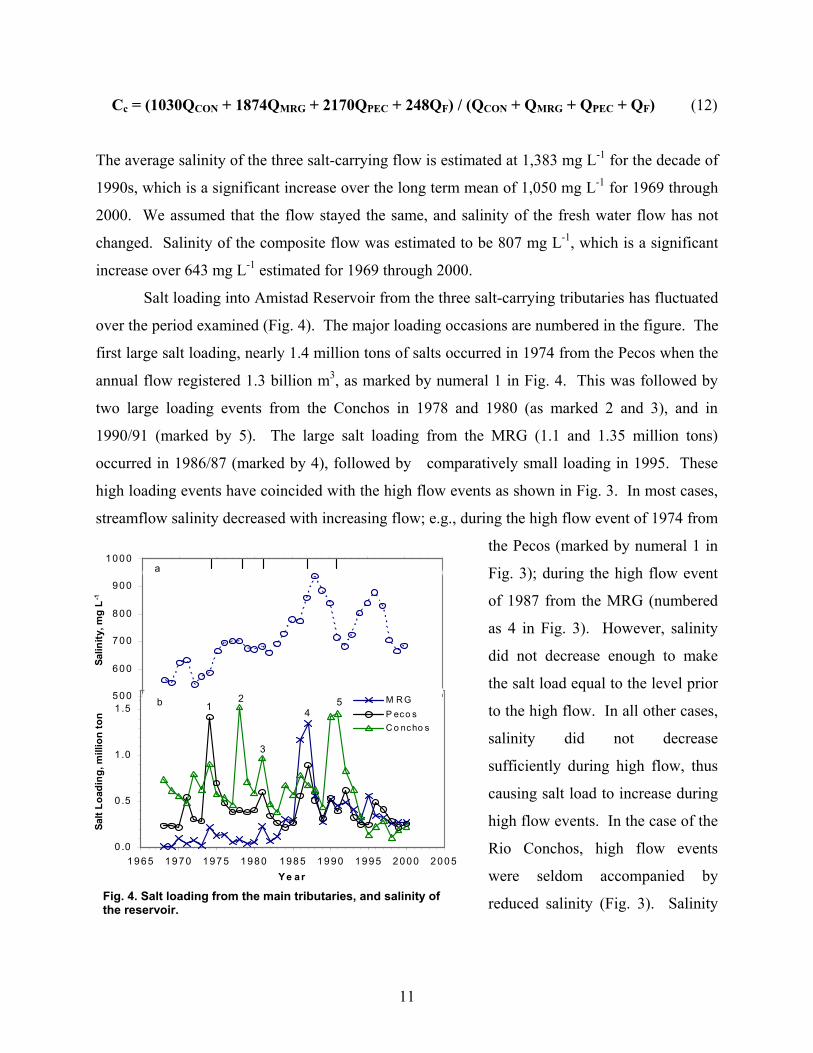
Salt loading into Amistad Reservoir from the three salt-carrying tributaries has fluctuated
over the period examined (Fig. 4). The major loading occasions are numbered in the figure. The
first large salt loading, nearly 1.4 million tons of salts occurr
11
500
600
700
Salin
ity, m
0 .0
0 .5
1 .0
1 .5
1965 1 970 1975 1980 1985 1990 1995 2000 2005Ye ar
Salt
Load
ing,
mill
ion
ton
M R GP eco sC o ncho s
b 12
3
54
Fig. 4. Salt loading from the main tributaries, and salinity of the reservoir.
800
900
1000
g L
-1
1 965 1970 1975 1980 1985 1990 1995 2000 2005a
annual flow registered 1.3 billion m3, as marked by numeral 1 in Fig. 4. This was followed by
two large loading events from the Conchos in 1978 and 1980 (as marked 2 and 3), and in
1990/91 (marked by 5). The large salt loading from the MRG (1.1 and 1.35 million tons)
occurred in 1986/87 (marked by 4), followed by comparatively small loading in 1995. These
high loading events have coincided with the high flow events as shown in Fig. 3. In most cases,
streamflow salinity decreased with increasing flow; e.g., during the high flow event of 1974 from
the Pecos (marked by numeral 1 in
Fig. 3); during the high flow event
of 1987 from the MRG (numbered
as 4 in Fig. 3). However, salinity
did not decrease enough to make
the salt load equal to the level prior
to the high flow. In all other cases,
salinity did not decrease
sufficiently during high flow, thus
causing salt load to increase during
high flow events. In the case of the
Rio Conchos, high flow events
were seldom accompanied by
reduced salinity (Fig. 3). Salinity

of the Reservoir has not necessarily coincided with these large salt-loading events. Reservoir
processes must have affected salinity of the Reservoir.
S
12
Salt
Bal
ance
, mill
ions
tons
yea
r
Year Year
Fig. 5. The annual salt balance and the streamflow measured at three locations.
Ann
ualF
low
,mill
ion
m3
Salt
Bal
ance
, mill
ions
tons
yea
r-1A
nnua
lFlo
w,m
illio
nm
3
alt Balance and Salt Flushing
hich entered into the reservoir averaged 1.65 million tons per
at the two reaches of the MRG show a
The total quantity of salt w
year, and the salt unloaded during the same period through outflow (or reservoir release)
amounted to 1.63 million tons per year (Table 2). The outflow accounted for 92% of the total
salt unloading. Deep percolation accounted for 6%, and the salt storage gain in the reservoir
amounted to only 1% of the salt inflow. However, the quantity of salts stored in the reservoir at
a mean storage of 3.43 billion m3 amounted to 2.2 million tons or 1.3 times the total annual mean
salt loading. The total salt loading exceeded the unloading only by a percentage point, thus
providing a degree of quality assurance for the data used.
The salt balance analyses performed using Eq. (5)
large quantity of salt pick-up from the reach between El Paso and Presidio during the high flow
period of 1986 and 1987 (Fig. 5). As shown in Table 3, there was a large increase in salt load as
the flow traveled through the MRG; from 0.75 to 1.16 million tons in 1986, and from 0.74 to
-1

1.34 million tons in 1987 (Table 3). These data indicate that salt flushing has occurred from the
reach between El Paso and Presidio, but not significantly in the reach above El Paso. The
quantity of salts flushed from the reach, approximately 1 million tons for the two-year period, is
large, yet it amounts to less than a three-year release of salts from Elephant Butte. During
average-flow years, the annual salt release from Elephant Butte is approximately 425,000 tons
(Miyamoto et. al., 1995).
The IBWC records show that there was also high flow in 1941/42 in the MRG. It produced
Table 3. Salt flushing during high flow events of 1941/42 and 1986/87 from the
the annual flow 2.0 billion m3 for the two-year period, which is comparable to the flood events of
1986/87 (Table 3). However, the quantity of salts flushed during the flood events of 1941/42 was
0.72 million tons in total, which is less than the flushing recorded during the 1986/87 events. The
time interval between the construction of Elephant Butte Reservoir and the flood event of 1941 -
MRG,and 1941/42 and 1974/87 for the Pecos
Caballo El Paso Presidio Year Artesia Malaga LangtryFlow (M m3/year)1
-(41) 870 630 572 (41) 1667 2001 1641(42) 2215 1920 1450 (42) 631 570 698(86) 1722 1294 881 (74) 177 194 1342(87) 1697 1327 1101 (87) 280 200 295
Salinity (mg L-1)2-
(41) 605 857 1542 (41) - 1775 3036(42) 421 560 1002 (42) - 2802 4169(86) 379 578 1319 (74) - 1327 1057(87) 411 560 1222 (87) 2344 3295 3034
Salt Load (million tons/year)(41) 0.52 0.54 0.88 (41) - 3.55 5.00(42) 0.93 1.08 1.45 (42) - 1.60 2.90(86) 0.65 0.75 1.16 (74) - 0.257 1.42(87) 0.70 0.74 1.34 (87) 0.66 0.66 0.89
Salt Flushing (million tons/year)(41) - 0.01 0.34 (41) - - 1.43(42) - 0.14 0.38 (42) - - 1.31
- 0.15 0.72 2.74(86) - 0.10 0.41 (74) - - 1.16(87) - 0.05 0.60 (87) - 0.00 0.23
0.15 1.01 1.39
1-The average river flow at Caballo, El Paso, and Presidio are 838, 499, and 164
million m3/year.2-The average salinity of the river at Caballo, El Paso and Presidio are 482, 770,
and 1464. mg L-1 for the period of 1938 through 2000.
The Rio Grande The Pecos
13
42 was 25 years, whereas the interval between the two flood events (1941 vs. 1987) was 45
ccurred more frequently than did from the MRG:
h salt loading from the Conchos
ween annual salt
years. It is possible that salts accumulated in floodways were greater in quantity prior to the
flood event of 1986/87 than the previous case.
Large salt loading from the Pecos has o
1974, 1981, and 1987. This was followed by a series of smaller loading events (Fig. 4). The salt
loading during 1974 from the Pecos was 1.43 million tons, which is as large as the loading from
the MRG during 1986 and 1987. The analysis of historical data show that the salt loading during
1941 came at an unprecedented quantity of 5 million tons at Langtry, along with 1.6 billion m3
flow at salinity of 3,000 mg L-1 (Table 3). The precipitation during 1974 occurred mostly below
Girvin, whereas the precipitation during 1941 flood occurred above Girvin where geological
salts are present. The USGS data also show that during the high flow event of 1941, salinity at
Langtry was higher than at Malaga, indicating potential salt pick-up below Malaga.
Unfortunately, the exact locations or reaches of salt entry into the Pecos during flood remain
unknown.
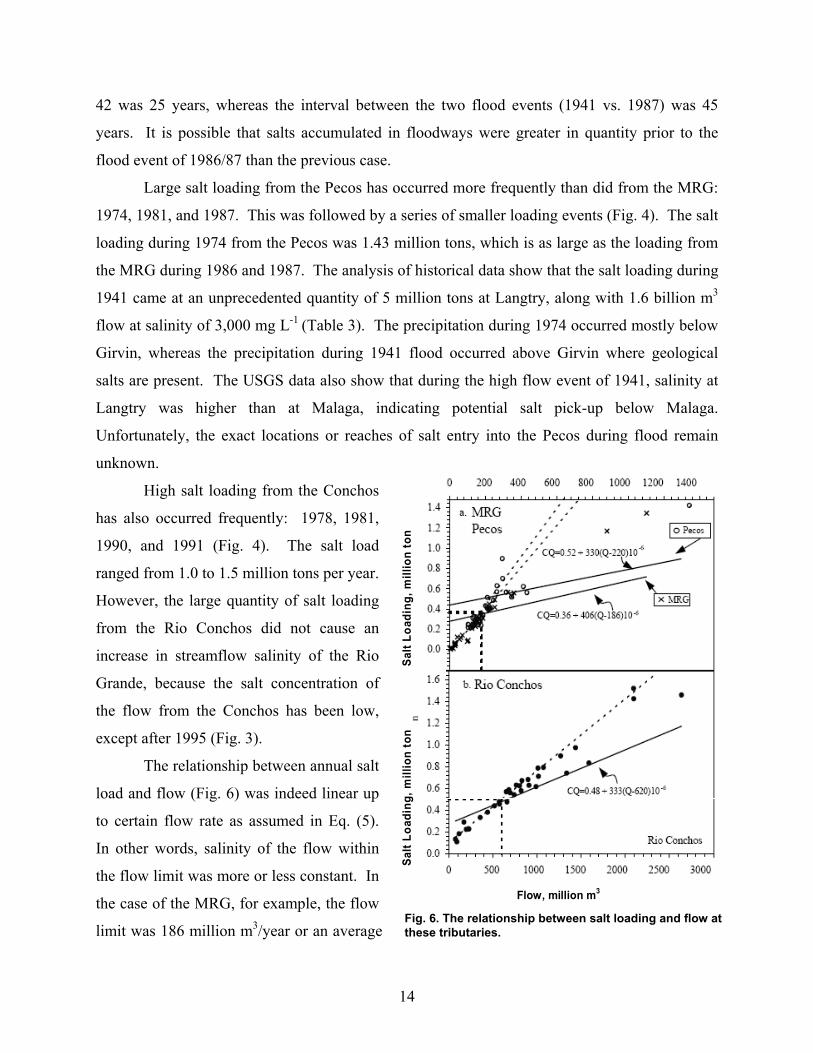
Hig
Salt
Load
ing,
mill
ion
ton
Salt
Load
ing,
mill
ion
ton
Flow, million m3
Fig. 6. The relationship between salt loading and flow at these tributaries.
has also occurred frequently: 1978, 1981,
1990, and 1991 (Fig. 4). The salt load
ranged from 1.0 to 1.5 million tons per year.
However, the large quantity of salt loading
from the Rio Conchos did not cause an
increase in streamflow salinity of the Rio
Grande, because the salt concentration of
the flow from the Conchos has been low,
except after 1995 (Fig. 3).
The relationship bet
load and flow (Fig. 6) was indeed linear up
to certain flow rate as assumed in Eq. (5).
In other words, salinity of the flow within
the flow limit was more or less constant. In
the case of the MRG, for example, the flow
limit was 186 million m3/year or an average
14

daily flow rate of 509,000 m3, which was considered to be the baseflow. The data point then
deviated from the linear relationship, due to dilution of the baseflow with flood water or
reservoir release. The concentration of flood water or reservoir release, CI was assumed to be the
lowest monthly salinity reading reported. The difference between the measured and the
estimated salt load by the equation shown in the figure is, in theory, the salt load gained by salt
flushing. In the case of the MRG, the quantities of salt flushing estimated in this manner were
roughly equal to the estimates by Eq. (3).
The relationship between salt load and flow of the Pecos River should be considered
tentative as the data points were insufficient to draw a definitive line. The lowest monthly
salinity recorded, 330 mg L-1, was considered to be salinity of the storm runoff into the reach
below Girvin. This value could be somewhat higher than the actual, as salinity of the Devils, an
adjacent river, is lower, 248 mg L-1. An important feature is that salt loading from the 1974
flood came well above the dilution line as shown by an open circle on the far right of Fig. 6.
During the flood events of 1941 and 1942 (not shown in the figure), salt loading was even higher
(Table 3). As noted earlier, the precipitation in 1941, and 1942 occurred above Girvin where
halite deposits are present, whereas the precipitation in 1974 was recorded mostly below Girvin.
During the second major salt flushing in 1978, the Conchos loaded 1.5 million tons, of
which 0.55 tons were estimated to have come from salt flushing. During the third major salt
loading in 1981 from the Conchos, salt flushing accounted for only 25% of the total salt loading.
Note that the Conchos was flushed in 1978 or 3 years prior to this event. During the major salt
loading from the MRG in 1986/87, 45% of the salt loading came from salt flushing. During the
last major salt loading from the Conchos in 1990 and 1991, 32 and 21 % of the salt loading came
from salt flushing, respectively. Salt flushing occurs as an addition to high salt load carried
through high flow.
A question arises as to the quantity of salts present on and in the floodway between El
Paso and Presidio prior to bank overflow. A survey of bank salinity being conducted for the
MRG between Caballo and Ft. Quitman shows that the average salt accumulation at the surface 1
cm was 10 tons/ha in the reach with no regular overflow, and only 0.3 tons/ha in the reach with
regular overflow (Table 4). When the samples were taken to a depth of 120 cm, the salt storage
below El Paso amounted to 144 tons / ha. The previous major flood in these reaches occurred in
1986 or 16 years prior to sampling. Soil salinity analyses made for an area outside the levee
15
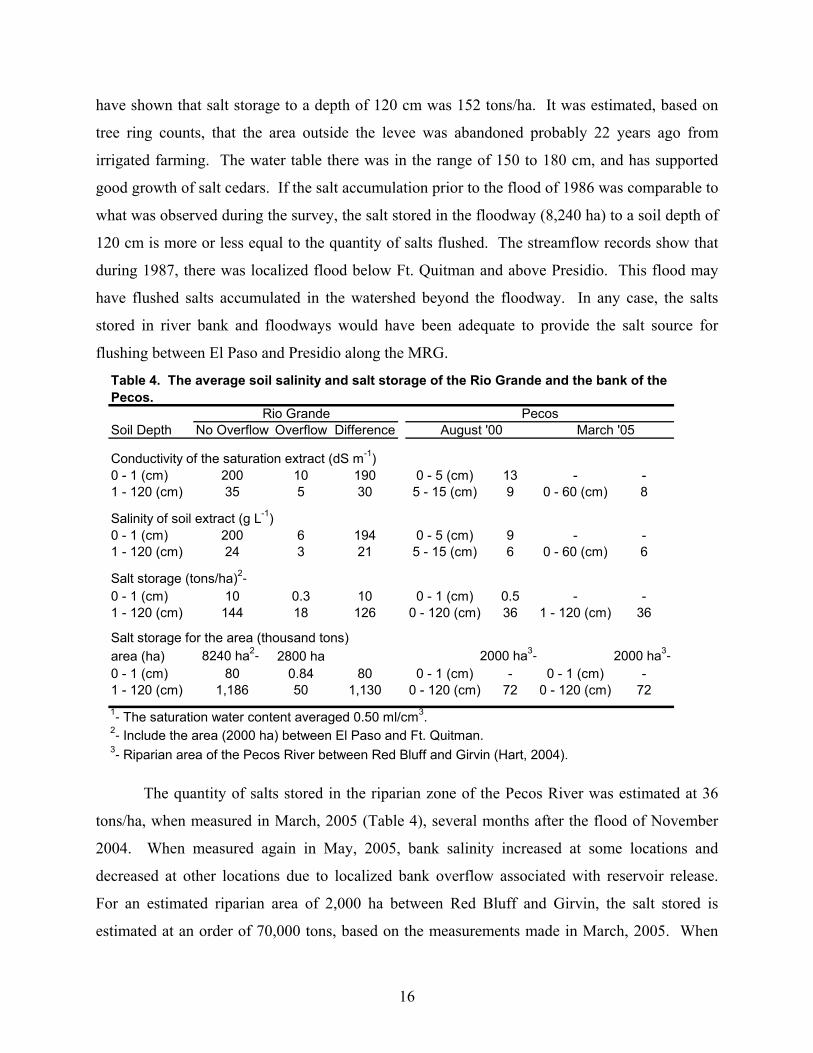
have shown that salt storage to a depth of 120 cm was 152 tons/ha. It was estimated, based on
tree ring counts, that the area outside the levee was abandoned probably 22 years ago from
irrigated farming. The water table there was in the range of 150 to 180 cm, and has supported
good growth of salt cedars. If the salt accumulation prior to the flood of 1986 was comparable to
what was observed during the survey, the salt stored in the floodway (8,240 ha) to a soil depth of
120 cm is more or less equal to the quantity of salts flushed. The streamflow records show that
during 1987, there was localized flood below Ft. Quitman and above Presidio. This flood may
have flushed salts accumulated in the watershed beyond the floodway. In any case, the salts
stored in river bank and floodways would have been adequate to provide the salt source for
flushing between El Paso and Presidio along the MRG.
The quantity of salts stored in the riparian zone of the Pecos River was estimated at 36
ns/ha, when measured in March, 2005 (Table 4), several months after the flood of November
004. When measured again in May, 2005, bank salinity increased at some locations and
ecreased at other locations due to localized bank overflow associated with reservoir release.
or an estimated riparian area of 2,000 ha between Red Bluff and Girvin, the salt stored is
stimated at an order of 70,000 tons, based on the measurements made in March, 2005. When
Soil Depth No Overflow Overflow Difference
Conductivity of the saturation extract (dS m-1)0 - 1 (cm) 200 10 190 0 - 5 (cm) 13 - -1 - 120 (cm) 35 5 30 5 - 15 (cm) 9 0 - 60 (cm) 8
Salinity of soil extract (g L-1)0 - 1 (cm) 200 6 194 0 - 5 (cm) 9 - -1 - 120 (cm) 24 3 21 5 - 15 (cm) 6 0 - 60 (cm) 6
Salt storage (tons/ha)2-0 - 1 (cm) 10 0.3 10 0 - 1 (cm) 0.5 - -1 - 120 (cm) 144 18 126 0 - 120 (cm) 36 1 - 120 (cm) 36
Salt storage for the area (thousand tons)area (ha) 8240 ha2- 2800 ha 2000 ha3- 2000 ha3-0 - 1 (cm) 80 0.84 80 0 - 1 (cm) - 0 - 1 (cm) -1 - 120 (cm) 1,186 50 1,130 0 - 120 (cm) 72 0 - 120 (cm) 72
3-Riparian area of the Pecos River between Red Bluff and Girvin (Hart, 2004).
1-The saturation water content averaged 0.50 ml/cm3.2-Include the area (2000 ha) between El Paso and Ft. Quitman.
Table 4. The average soil salinity and salt storage of the Rio Grande and the bank of the Pecos.
Rio Grande PecosAugust '00 March '05
to
2
d
F
e
16
th
17
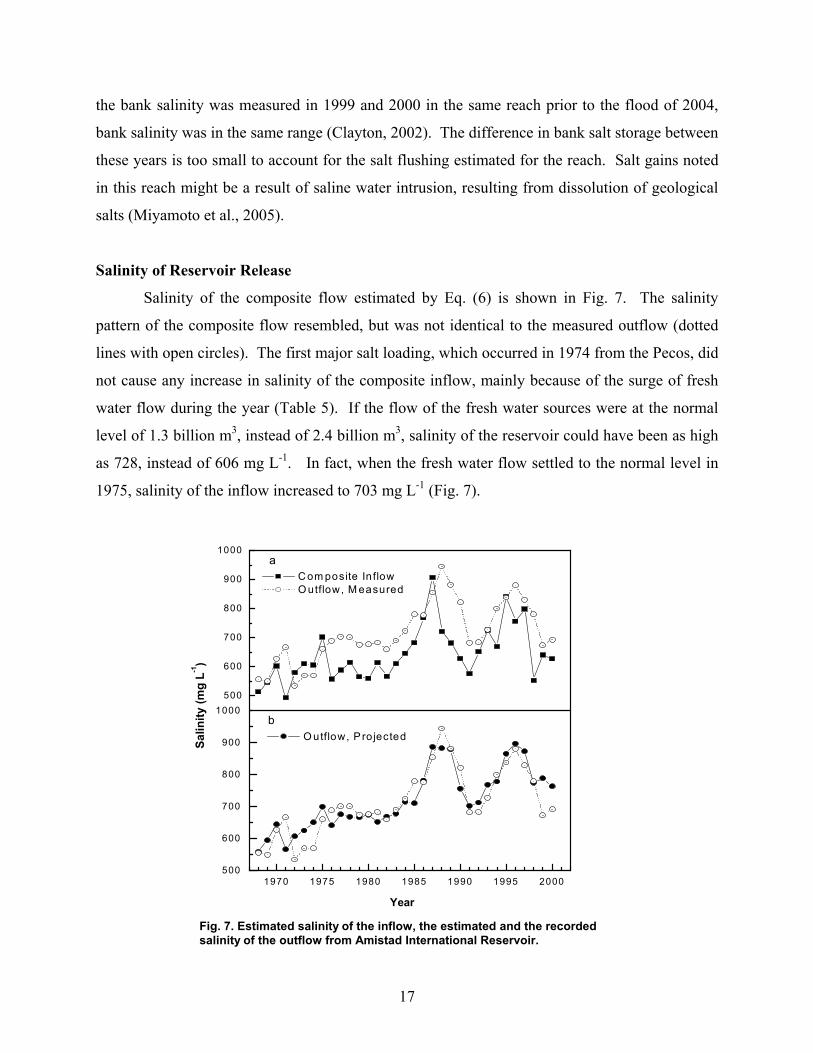
Fig. 7. Estimated salinity of the inflow, the estimated and the recorded salinity of the outflow from Amistad International Reservoir.
1970 1975 1980 1985 1990 1995 2000500
600
700
800
900
1000500
600
800
Salin
ity (m
g L-1
)
O utflow, P rojected
Year
O utflow, M easured
om posite In flowa
b
Year
700
900
1000
C
Salinity of the composite flow estimated by Eq. (6) is shown in Fig. 7. The salinity
pattern of the composite flow resembled, but was not identical to the measured outflow (dotted
lines with open circles). The first major salt loading, which occurred in 1974 from the Pecos, did
not cause any increase in salinity of the composite inflow, mainly because of the surge of fresh
water flow during the year (Table 5). If the flow of the fresh water sources were at the normal
level of 1.3 billion m3, instead of 2.4 billion m3, salinity of the reservoir could have been as high
as 728, instead of 606 mg L-1. In fact, when the fresh water flow settled to the normal level in
1975, salinity of the inflow increased to 703 mg L-1 (Fig. 7).
e bank salinity was measured in 1999 and 2000 in the same reach prior to the flood of 2004,
ank salinity was in the same range (Clayton, 2002). The difference in bank salt storage between
ese years is too small to account for the salt flushing estimated for the reach. Salt gains noted
this reach might be a result of saline water intrusion, resulting from dissolution of geological
lts (Miyamoto et al., 2005).
alinity of Reservoir Release
b
th
in
sa
S
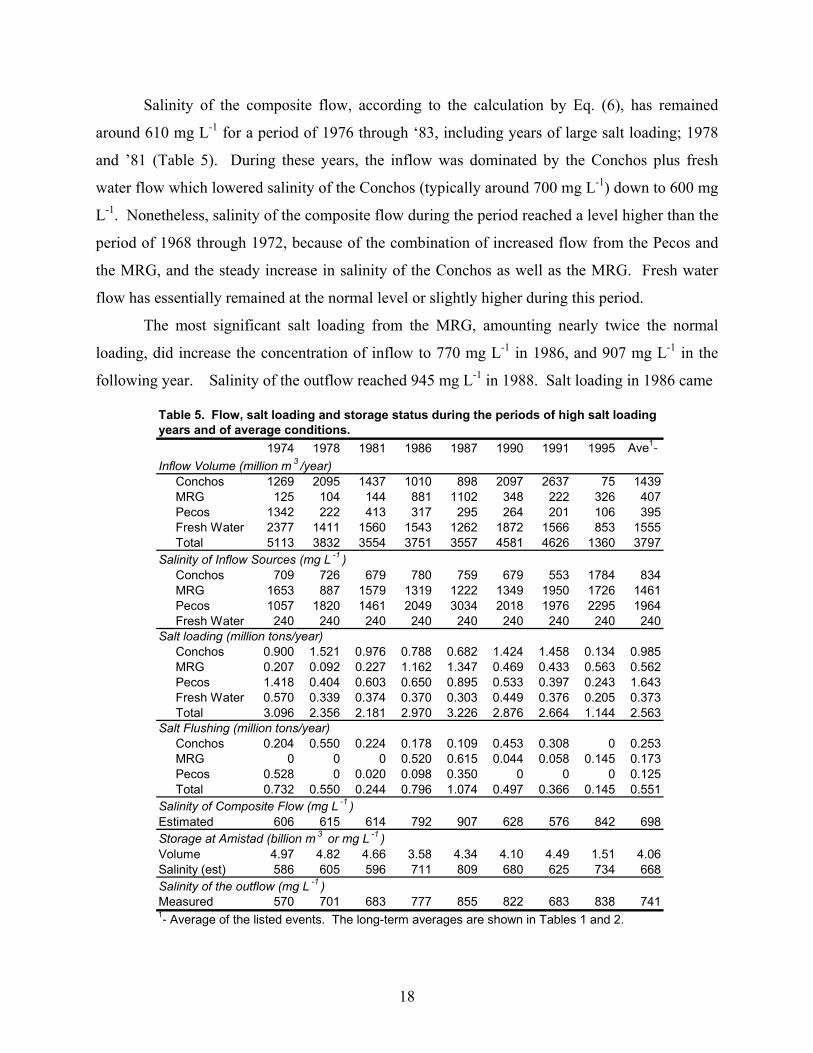
Table 5. Flow, salt loading and storage status during the periods of high salt loading years and of average conditions.
1974 1978 1981 1986 1987 1990 1991 1995 Ave1-Inflow Volume (million m 3 /year) Conchos 1269 2095 1437 1010 898 2097 2637 75 1439 MRG 125 104 144 881 1102 348 222 326 407 Pecos 1342 222 413 317 295 264 201 106 395 Fresh Water 2377 1411 1560 1543 1262 1872 1566 853 1555 Total 5113 3832 3554 3751 3557 4581 4626 1360 3797Salinity of Inflow Sources (mg L -1 ) Conchos 709 726 679 780 759 679 553 1784 834 MRG 1653 887 1579 1319 1222 1349 1950 1726 1461 Pecos 1057 1820 1461 2049 3034 2018 1976 2295 1964 Fresh Water 240 240 240 240 240 240 240 240 240Salt loading (million tons/year) Conchos 0.900 1.521 0.976 0.788 0.682 1.424 1.458 0.134 0.985 MRG 0.207 0.092 0.227 1.162 1.347 0.469 0.433 0.563 0.562 Pecos 1.418 0.404 0.603 0.650 0.895 0.533 0.397 0.243 1.643 Fresh Water 0.570 0.339 0.374 0.370 0.303 0.449 0.376 0.205 0.373 Total 3.096 2.356 2.181 2.970 3.226 2.876 2.664 1.144 2.563Salt Flushing (million tons/year) Conchos 0.204 0.550 0.224 0.178 0.109 0.453 0.308 0 0.253 MRG 0 0 0 0.520 0.615 0.044 0.058 0.145 0.173 Pecos 0.528 0 0.020 0.098 0.350 0 0 0 0.125
0.550 0.244 0.796 1.074 0.497 0.366 0.145 0.551Salinity of Composite Flow (mg L -1 )
3 -1
1
Total 0.732
Salinity of the composite flow, according to the calculation by Eq. (6), has remained
around 610 mg L-1 for a period of 1976 through ‘83, including years of large salt loading; 1978
and ’81 (Table 5). During these years, the inflow was dominated by the Conchos plus fresh
water flow which lowered salinity of the Conchos (typically around 700 mg L-1) down to 600 mg
L-1. Nonetheless, salinity of the composite flow during the period reached a level higher than the
period of 1968 through 1972, because of the combination of increased flow from the Pecos and
the MRG, and the steady increase in salinity of the Conchos as well as the MRG. Fresh water
flow ha
The m normal
Estimated 606 615 614 792 907 628 576 842 698Storage at Amistad (billion m or mg L )Volume 4.97 4.82 4.66 3.58 4.34 4.10 4.49 1.51 4.06Salinity (est) 586 605 596 711 809 680 625 734 668Salinity of the outflow (mg L -1 )Measured 570 701 683 777 855 822 683 838 741-Average of the listed events. The long-term averages are shown in Tables 1 and 2.
s essentially remained at the normal level or slightly higher during this period.
ost significant salt loading from the MRG, amounting nearly twice the
loading, did increase the concentration of inflow to 770 mg L-1 in 1986, and 907 mg L-1 in the
following year. Salinity of the outflow reached 945 mg L-1 in 1988. Salt loading in 1986 came
18
19
1987, it
e com -1
igh flo
ear. Sa ple of water
nd salt the Conchos
imi the MRG have
crease igher
linity than low.
his typ d due to
crease
orage t to water
vaporat (276,000
cre-ft)
stim
rovided
recipita n loss was
alcu
ssociate -1. The
, and is
onsisten
primarily from the MRG, and ’87 from a combination of the MRG and the Pecos. Salt flushing
of 1986 and ’87 contributed to the salinity increase at the Reservoir (Table 5). While the loading
from the Conchos was at the average, fresh water inflow in 1986 was above normal, and
was at the normal level (Table 5). If the fresh water inflow were below normal, salinity of the
Reservoir would have exceeded 1,000 mg L-1 throughout the year.
The last major salt loading which occurred in 1990 from the Conchos caused salinity of
th posite flow to decrease. This loading had low salinity (679 mg L ) due to unprecedented
w of 2.1 billion m3 from the Conchos, which is enough to fill half of the reservoir in one
linity of inflow started increasing after the large flow event, and an exam
balance is shown using the 1995 data, in Table 4. Note that the flow from
nished: the fresh water flow curtailed, while the flow and salt loading from
d well above the average. The inflow from the Pecos was below average, but at h
normal. These are ingredients ideal for increasing salinity of the composite f
e of flow situations persisted until 1998 when salinity was finally lowere
d fresh water flow.
Salinity of the reservoir outflow, calculated using Eq. (8) is shown in Fig. 7b. Reservoir
reduced salinity fluctuation, but also elevated salinity as it is subjec
ion. The annual evaporation from the Reservoir is estimated at 340 million m3
by assuming 70% of the pan evaporation rate. The mean water surface area was
ated at 22,000 ha (54,000 acres), based on the storage and surface area relationship
by the Reservoir operation. This amounts to 13.2% of the annual inflow. Since the
tion on the water surface averaged 95 million m3/year, the net evaporatio
lated to be 245 million m3 per year, or 9.5% of the annual inflow. The salinity increase
d with evaporation would be 1.1 times the mean inflow salinity or 710 mg L
easured outflow salinity averaged 734 mg L-1, which is slightly higher than 710 mg L-1
t with the two-layer model used.
h
y
a
d
in
sa
T
in
st
e
a
e
p
p
c
a
m
c
The measured outflow concentration was lower than the estimated during the period of
1972 through 1974. During this period, the fresh water flow from the Devils River was
dominant, thus it might have pushed the saline water inflow away from the outflow structure.
The spillway is located more or less at the center of the two flow regions (refer to the cover

page). The same flow pattern into the spillway may have occurred after 1995 when the flow
from the Rio Grande side became low, because of the drought in the Conchos Basin. Otherwise,
the estimated salinity of outflow agreed well with the measured.
Potential Scenarios for Elevated Salinity
Equations (11) and (12) indicate that increasing the flow from the Pecos plus the MRG,
or decreasing fresh water flow below these mean values can increase salinity of the inflow.
Increasing the flow of the Conchos usually lowers salinity of the composite flow, but can also
increase it if salinity of the composite flow is initially less than that of the Conchos. Increasing
salinity
ction in freshwater flow, which is currently estimated
r crop production, there would
e additional salt load of 197,000 tons/year (Table 11 of the Reconnaissance report), which may
to infiltrate). This will increase the current total salt
ading from 2.07 to 2.27 million tons/year. This will cause a salinity increase in inflow another
of any of these tributaries, including fresh water, can increase salinity of the composite
flow. Obviously, any reductions in inflow of fresh water (which accounts for half of the inflow)
would increase reservoir salinity.
There are several scenarios which could further increase salinity of the inflow. The first
scenario is that salinity of the tributaries continues to increase. According to Eq. (12), which
reflects the current status, the mean salinity of the composite flow has already reached 807 mg L-
1. Using a conservative evaporative concentration scenario, the outflow salinity is already at 888
mg L-1. The inflow salinity has increased at a rate of about 10 mg L-1 per year during the decade
of 1990s. If this trend continues, mean salinity of the composite inflow can reach 1,000 mg L-1
in a decade or two, unless fresh water inflow into the Reservoir increases.
Another scenario is a potential redu
to be equal to the combined flow of the Conchos, the Pecos and the MRG. These fresh water
streams, including the Devils River have not yet been developed. If this fresh water resource is
to be developed, for example, 20% of it, it can increase the current composite inflow salinity by
approximately 10% or from 807 to 888 mg L-1. The salinity of the outflow is likely to be very
close to 1,000 mg L-1, using the evaporative concentration of 1.1.
Another scenario relates to the future of the Pecos River. If local growers feel that the
high saline water from Red Bluff cannot be used economically fo
b
enter into Amistad (unless the release is left
lo
20
10%, at least in calculation. Salinity of the outflow will be very close to 1,000 mg L-1. This does
not include an anticipated distribution of 12 million m3 (15,000 acre-ft.) per year from New
Mexico, which can add an additional salt load of up to 70,000 tons/year. By the same token, the
salt load will decrease by 150,000 tons/year if the brine intrusion at Malaga Bend is controlled.
Other scenarios, such as salt flushing and a short-term drought can push salinity over
1,000 mg L-1, perhaps for a year or two, but not for a long term. Under the elevated background
salinity of the inflow, these events can push salinity of the reservoir to 1000 ppm much more
reliable model which
ause for the sharp increase in
salinity
r
easily. Provided that the flow or storage stay the same, the quantity of salts required to raise
salinity from 807 to 1000 mg L-1 is reduced by 258,000 tons per year. Another way to look at is
that salt flushing of 1986/87, if occurs again, can increase salinity of the reservoir to the order of
1100 mg L-1.
A more rigid estimate of future salinity of Amistad can be made by using probability
statistics. In order to develop river management options to curve the current increasing trend in
salinity, a model analysis is needed. Unfortunately, there is currently no
can be used to analyze all types of situations occurring on this vast watershed. Salt flushing and
salt dissolution are, for example, difficult to model, but they are the prominent features of this
basin.
CONCLUSIONS
The analyses presented here indicate that salt flushing from the Middle Rio Grande
(MRG) and, to a lesser extent, from the Pecos River was a main c
of Amistad Reservoir during 1986-1988. Salt flushing was also a significant factor in
other high salt loading events. Salt flushing from the MRG seems to have originated from the
salts stored in the floodplain below El Paso, and that from the Pecos River may involve
dissolution of geological salts present above Girvin. Limited historical records indicate that
large rainfall events in the area of halite deposits in the Pecos subbasin can flush out salts in
quantities sufficient to increase salinity of Amistad Reservoir well above 1000 mg L-1. The
gradual increase in salinity of the tributaries over the past several decades has contributed to the
increase in the background salinity, and the outflow salinity has increased from 560 mg L-1, prior
to dam construction in 1968, to 888 mg L-1 in the 1990s. Water evaporation from the reservoi
increases the background salinity by 10 to 13%. Salinity of the Amistad Reservoir can exceed
1,000 mg L-1 under a number of combinations involving high inflow from salt-carrying
21
tributaries (mainly the MRG and the Pecos), and/or low inflow of freshwater, especially when
reservoir storage is low, or the inflow is accompanied by salt flushing. A model capable of
describing salt flushing and salt dissolution, two of the unique features of this basin, would be
useful for predicting future salinity trends and for evaluating river management options to curve
the current increasing trends of reservoir salinity.
Extension at the Texas A&M University System.
Howard, C.S., Love, S.K., 1943. Quant of the United States, 1943. United
REFERENCES
Clayton, L.A., 2002. Saltcedar management strategies and effects on water quality and quantity of the Pecos River. Texas A&M University. Hart, C.R., 2004. The Pecos River ecosystem project progress report. Texas Cooperative
ity of surface waters
States Department of the Interior Water-Supply Paper 970. Khan, M.A., Bohra, D.N., 1990. Water-loss studies in the Sardar Samand Reservoir. J. Arid
Evniron. 19, 245-250. Killworth, P.D., Carmack E.C., 1979. A filling-box model of river-dominated lakes. Limnol. Oceanogr. 24, 201-217. Miyamoto, S., 1995. Flow, salts, and trace elements in the Rio Grande: a review, pp. 30. The Texas A&M University System, College Station, Texas. Miyamoto, S. et al., 2005. The reconnaissance survey of salt sources and loading into the Pecos River. The Texas A&M University System, College Station, Texas. A report to US EPA.
22