Embed Size (px)
Citation preview
International Research Journal of Engineering and Technology (IRJET) e-ISSN: 2395-0056
Volume: 04 Issue: 10 | Oct -2017 www.irjet.net p-ISSN: 2395-0072
© 2017, IRJET | Impact Factor value: 6.171 | ISO 9001:2008 Certified Journal | Page 1152
INFLUENCE OF COOLING TECHNIQUE ON TOOL WEAR IN TURNING OF
TITANIUM ALLOY Ti-6Al-4V
Mr. Shrikant Sharad Dhurgude1 , Prof. Dalwe D.M2 , Prof Doijode S.N3, Prof. Pansare V.B4
1 P.G. Student, Department of Mechanical Engineering, S.T.B.’s College of Engineering Tuljapur, Dist. Osmanabad, Maharashtra, India.
2 ,3,4 Associate Professor, Department of Mechanical Engineering, S.T.B.’s College of Engineering Tuljapur, Maharashtra, India.
-------------------------------------------------------------------***-------------------------------------------------------------------------
Abstract: In any metal cutting operation, a lot of heat is generated due to plastic deformation of work material, friction at the tool-chip interface and friction between the clearance face of the tool and work piece. The friction in machining (i.e. dry machining) adversely affects the tool wear and quality of the products produced. Thus, effective control of friction in the cutting zone is essential to ensure less tool wear and good surface quality of the work piece in machining. Cutting fluids have been the conventional choice to deal with this problem.
Cutting fluids are introduced in the machining zone to improve the tribological characteristics of machining processes and also to reduce the tool wear. The advantages of cutting fluids, however, have been called into question lately due to the negative effects on product cost, environment and human health. Later semi-dry i.e. Minimum Quantity Lubrication (MQL) machining has been tried as a possible alternative to the use of fluid.
Minimum Quantity Lubrication machining refers to the use of a small amount of cutting fluid, typically in order of 300ml/hr or less, which are about three to four orders of magnitudes lower than that used in flooded lubricating conditions.
This project work deals with the optimization process parameters for tool wear in turning of titanium alloy (Ti-6Al-4V) under different lubrication conditions such as dry, flooded and Minimum Quantity Lubrication (MQL) conditions using Taguchi’s robust design methodology.
The results have been compared among dry, flooded and MQL conditions and it reveals that MQL shows improvement in reduction of tool wear compared to dry and flooded lubricant conditions. From Analysis of Mean (ANOM), it is observed that MQL is suitable at higher cutting speed compared to dry and flooded lubricant conditions. It is observed from ANOM that uncoated tool shows better performance for dry, flooded and MQL lubricant conditions compared to CVD and PVD coated tools.
1. INTRODUCTION
Titanium alloys are metallic materials which contain a mixture of titanium and other chemical elements. Such alloys have very high tensile strength and toughness (even at extreme temperatures), light weight, extraordinary corrosion resistance and ability to withstand extreme temperatures. However, the high cost of both raw materials and processing limit their use to military applications, aircraft, spacecraft, medical devices, connecting rods on expensive sports cars and some premium sports equipment and consumer electronics. Auto manufacturers, Porsche and Ferrari, also use Titanium alloys in engine components due to its durable properties in these high stress engine environments.
An alpha-beta Titanium alloy consisting of 6% Aluminum and 4% Vanadium. Ti-6Al-4V is commonly found to be used in jet engine components. Ti-6Al-4V is an Alpha-Beta Alloy grade Wrought Titanium Alloy. It is composed of (in weight percentage) 6% Aluminum (Al), 4% Vanadium (V) and the base metal is Titanium (Ti). Other designations of Ti-6Al-4V titanium alloy include ASTM B265 Grade5, ASTM B348 Grade5, ASTM B381 Grade5, MIL-T-9046, MIL-T-9047, AMS 4928, AMS 4911, AMS 4906, and AMS 4965. The typical elastic modulus of Ti-6Al-4V at room temperature (25°C) ranges from 100 to 120 GPa. The typical density of Titanium alloys is about 4.5 g/cm3. The typical tensile strength varies between 152 and 379 MPa. The wide range of ultimate tensile strength is largely due to different heat treatment conditions.
The difficulties involved in machining of Titanium alloys:
Higher difficulties are expected when machining Titanium alloys because of the following factors:
(I) The mechanical properties, especially the hardness and the tensile stress at high temperature (400°C).
(II) The differences of structure with a variable quantity of the alpha phase.
International Research Journal of Engineering and Technology (IRJET) e-ISSN: 2395-0056
Volume: 04 Issue: 10 | Oct -2017 www.irjet.net p-ISSN: 2395-0072
© 2017, IRJET | Impact Factor value: 6.171 | ISO 9001:2008 Certified Journal | Page 1153
(III) The morphology of the transformed beta phase.
(IV) High temperature strength.
(V) Very low thermal conductivity.
(VI) Relatively low modulus of elasticity and
(VII) High chemical reactivity.
2. LITERATURE SURVEY:
Ahmad Yasir et al. [1] has done research on the machinability of Ti-6Al-4V using Physical Vapor Disposition (PVD) coated cemented carbide tools. The tool was investigated at various cutting condition under dry and near dry (or MQL) machining. Tool life is studied at different flow rates and cutting speeds. Longer tool life is obtained at one condition. At the early stage there is no significant effect of MQL on cutting force and is more effective when tool start to wear out. High value MQL is less effective at high cutting speed. MQL seems to be more effective when worn out tool is applied.
Q. L. An et al. [2] discussed Cold Water Mist Jet (CWMJ) cooling method to obtain a lower cutting temperature during TC9 titanium alloy turning process was carried out by hydrodynamic tests. CWMJ had better cooling effects as compared with other two cooling methods. Cutting temperature was greatly reduced and tool life was improved. The high velocity and small particle size both help to enhance heat transfer and lubrication effect in the cutting zone. Hence tool life was improved effectively.
Vishal S. Sharma et al. [3] performed turning operation to evaluate friction and heat generation at the cutting zone is the frequent problems. The heat generation plays a negative role during machining of modern materials because of their characteristics as poor thermal conductivity, high strength at elevated temperature, resistance to wear and chemical degradation. Major advances in techniques as Minimum Quantity Lubrication (MQL)/Near, Dry Machining (NDM), High Pressure Coolant (HPC), cryogenic cooling results in reduction of friction and heat at the cutting zone. Cryogenic cooling increases tool life without compromising on the environmental conditions. With the MQL/NDM technique machining cost and the amount of lubricant is reduced and is better with the use of vegetable oils. Turning with HPC technique results in formation of segmented chips better penetration at interface and thus lower cutting force better tool life and acceptable surface finish.
Shane Y. Hong et al. [4] worked on Titanium alloy Ti-6Al-4V, it is difficult-to-machine material because of its
extremely short tool life. Minimum amount of liquid nitrogen is used between the chip breaker and the tool rake face. Liquid nitrogen is used and cutting temperature is reduced. Micro nozzle is used to inject forced LN2 and is not wasted by cooling unnecessary areas.
E. O. Ezugwu et al. [5] discussed about manufacturing of aero-engine that are based on nickel and titanium alloys. These materials are referred to as difficult-to-cut. Dry machining at high speed conditions, the use of high pressure and/or ultra high pressure coolant supplies, minimum quantity lubrication, cryogenic machining and rotary machining technique are used in their research. Moderate speed conditions when machining of aero-engine alloys leads lower machining productivity. These developments ensure that cutting tool materials maintain their properties at higher cutting conditions.
A. Attanansio et al. [6] have used the MQL technique in turning to determine the tool wear reduction. The results obtained from experimental tests and EDS microanalysis of tools are as follows. Lubricating the rake surface of a tip by the MQL technique does not produce evident wear reduction. Tool life time of a tip used in dry cutting conditions is similar to that of a tip lubricated by MQL on the rake. Lubricating the flank surface of a tip by the MQL technique reduces the tool wear and increases the tool life. Traces of lubricant compounds have been found on the worn surfaces only when MQL has been applied on the flank surface. The conclusion of authors is, the MQL gives some advantages during the turning operation, but it presents some limits due to the difficulty of lubricant reaching the cutting surface.
K. Weinert et al. [7] have proposed reduction of cooling lubricants in the modern cutting technologies of dry machining and MQL has led to significant advancements in machining technology. Today, many machining processes and work piece materials are produced by applying modern cutting tools and coatings, adapted tool designs and machining strategies, as well as optimized machine tools. These high-performance system components ensure economic and highly productive processes, slightly reducing the production times of wet machining processes and improving the work piece quality significantly. Dry machining operations, mainly applied in high-volume, large-scale industries, like automotive manufacturing, still require special solutions. However, it is envisioned that the increasing number of industrial applications and the ongoing research activities in the field of dry machining and MQL will support and ultimately result in the expansion of these modern high-performance technologies to small and medium-sized manufacturers.
International Research Journal of Engineering and Technology (IRJET) e-ISSN: 2395-0056
Volume: 04 Issue: 10 | Oct -2017 www.irjet.net p-ISSN: 2395-0072
© 2017, IRJET | Impact Factor value: 6.171 | ISO 9001:2008 Certified Journal | Page 1154
M. M. A. Khan et al. [8] have compared the effects of dry, wet and minimum quantity lubrication (MQL) in terms of chip – tool interface temperature, chip formation mode, tool wear and surface roughness. MQL machining was performed much superior compared to the dry and wet machining due to substantial reduction in cutting zone temperature enabling favorable chip formation and chip–tool interaction and it was also seen from the results that the substantial reduction in tool wears resulted in enhanced the tool life and surface finish.
C. Chungchoo et al. [9] have presented a computer algorithm of new quantitative models for flank and crater wear estimation. First, a quantitative model based on a correlation between increases in feed and radial forces and the average width of flank wear is developed. Then another model which relates acoustic emission (AErms) in the turning operation with the flank and crater wear developed on the tool is presented. The flank wear estimated by the first model is then employed in the second model to predict the crater wear on the tool insert. The influence of flank and crater wear on AErms generated during the turning operation has also been investigated. Additionally, chip-flow direction and tool–chip rake face interfacing area are also examined. The experimental results indicate that the computer program developed, based on the algorithm mentioned above, has a high accuracy for estimation of tool flank wear.
E. O. Ezugwu and Z. M. Wang [10] have reviewed the main problems associated with the machining of titanium as well as tool wear and the mechanisms responsible for tool failure. It was found that the straight tungsten carbide (WC/Co) cutting tools continue to maintain their superiority in almost all machining processes of titanium alloys, this paper also discusses special machining methods, such as rotary cutting and the use of ledge tools, which have shown some success in the machining of titanium alloys.
M. Hagiwara et al. [11] have presented a new methodology for optimization of machining performance in contour finish turning operations. Two machining performance measures, chip breakability and surface roughness, are considered as optimization criteria due to their importance in finishing operations. Chip breakability covers two major factors: chip shape and size. Comprehensive case studies are presented to demonstrate the determination and application of optimal cutting conditions through experimental validation.
N. R. Dhar et al. [12] investigated the role of MQL on tool wear and surface roughness in turning AISI-4340 steel at different industrial speed and feed combination by uncoated carbide insert. The results include significant reduction in tool wear rate and surface roughness by MQL
mainly through reduction in the cutting zone temperature and favorable change in the chip–tool and work–tool interaction.
Z. G. Wang et al. [13] have investigated the effects of different coolant supply strategies (using flood coolant, dry cutting, and minimum quantity of lubricant [MQL]) on cutting performance in continuous and interrupted turning process of Ti6Al4V. Based on the observation of the cutting forces with the different coolant supply strategies, the mean friction coefficient in the sliding region at the tool–chip interface is obtained and used in a finite element method (FEM) to simulate the deformation process of Ti6Al4V during turning. From the FEM simulation and Oxley’s predictive machining theory, cutting forces are estimated under different coolant supply strategies and verified experimentally. Finally the authors concluded that in continuous cutting, MQL is effective at higher cutting and high feed rate and in interrupted cutting, MQL is more effective than dry and flooded cooling.
3 EXPERIMENTAL DESIGN AND SETUP
The objective of this project work is to find out the set of optimum values for the control factors in order to reduce tool wear using Taguchi’s robust design methodology. An extensive literature survey has been carried out for better understanding of importance of dry, wet and minimum quantity lubrication conditions including its manufacturing and performance aspects.
The literature review also helped in proper selection of material for experimentation i.e. Titanium Ti-6Al-4V alloy. This alloy is selected for its typical characteristics of high strength, good formability and good machinability. This alloy is widely used in the aerospace, defense, aviation,
military equipment and space applications.
As seen from the literature, the MQL technique suggests several advantages in machining processes. Most of the experimental investigations on machinability aspects are limited to the role and effectiveness of MQL over dry and flooded machining. But, in order to achieve good surface quality on a machined surface with minimum specific tool wear, either the cutting conditions should be carefully selected with an optimum amount of MQL or a new tool material is to be developed with lower coefficient of friction and high heat resistance. Hence, an attempt has been made in this project to optimize cutting parameters viz cutting speed, feed rate, depth of cut and also enhance the machinability characteristics in turning of titanium Ti-6Al-4V alloy using three carbide turning inserts under different lubricant conditions like Dry, Flooded and Minimum Quantity Lubricant conditions. In the present investigation, Taguchi method and the utility concept has been employed
International Research Journal of Engineering and Technology (IRJET) e-ISSN: 2395-0056
Volume: 04 Issue: 10 | Oct -2017 www.irjet.net p-ISSN: 2395-0072
© 2017, IRJET | Impact Factor value: 6.171 | ISO 9001:2008 Certified Journal | Page 1155
to determine the best combination of the process parameters to minimize tool wear.
3.1 DESIGN OF EXPERIMENTS:
3.1.1 SELECTION OF CONTROL FACTORS AND LEVELS:
A total of five process parameters with three levels are chosen as the control factors such that the levels are sufficiently far apart so that they cover wide range. The process parameter and their ranges are finalized using literature and machine operator’s experience. The five control factors selected are type of lubricant (A) spindle speed (B), feed (C), depth of cut (D) and type of tool (E). Ti-6Al-4V alloy work piece are used in experimentation.
3.1.2 SELECTION OF ORTHOGONAL ARRAY: Selection of particular orthogonal array from the standard O.A, depends on the number of factors, levels of each factor and the total degrees of freedom.
i) Number of control factors = 5
ii) Number of levels for each control factors = 3
iii) Over all mean =1
iv) Total degrees of freedom of factors = 5x(3-
1)=10
v) Two factor interactions(total four interactions) (AxB), (AxC), (AxD), (AxE) = 4x(3-1)x(3-1)=16
vi) Number of experiments to be conducted =27.
Based on these values and the required minimum number of experiments to be conducted are 27, the nearest
O.A. fulfilling this condition is . It can accommodate a maximum five number of control factors each at three levels with 27 numbers of experiments. Here the requirement is to accommodate five control factors at three levels, which can be easily done in this O.A.
TABLE 3.3: EXPERIMENTAL DESIGN
EXPERIMENTS
NO
COLUMN
A
B
C
D
E
1
2
3
DRY
DRY
DRY
63
63
63
0.206
0.274
0.343
0.6
1.0
1.6
UNCOATED
CVD
PVD
4
5
6
DRY
DRY
DRY
79
79
79
0.206
0.274
0.343
0.6
1.0
1.6
UNCOATED
CVD
PVD
7
8
9
DRY
DRY
DRY
99
99
99
0.206
0.274
0.343
0.6
1.0
1.6
UNCOATED
CVD
PVD
10
11
12
FLOODED
FLOODED
FLOODED
63
63
63
0.206
0.274
0.343
0.6
1.0
1.6
UNCOATED
CVD
PVD
13
14
15
FLOODED
FLOODED
FLOODED
79
79
79
0.206
0.274
0.343
0.6
1.0
1.6
UNCOATED
CVD
PVD
16
17
18
FLOODED
FLOODED
FLOODED
99
99
99
0.206
0.274
0.343
0.6
1.0
1.6
UNCOATED
CVD
PVD
19
20
21
MQL
MQL
MQL
63
63
63
0.206
0.274
0.343
0.6
1.0
1.6
UNCOATED
CVD
PVD
22
23
24
MQL
MQL
MQL
79
79
79
0.206
0.274
0.343
0.6
1.0
1.6
UNCOATED
CVD
PVD
25
26
27
MQL
MQL
MQL
99
99
99
0.206
0.274
0.343
0.6
1.0
1.6
UNCOATED
CVD
PVD
3.2: WORK PLAN, EXPERIMENTAL DESIGN AND SETUP: The present study has been done through the following plan of experiment.
a) Checking and preparing the Lathe ready for performing the machining operation.
b) Cutting titanium bars by power saw and performing initial turning operation in Lathe to obtain required dimension of the work pieces.
International Research Journal of Engineering and Technology (IRJET) e-ISSN: 2395-0056
Volume: 04 Issue: 10 | Oct -2017 www.irjet.net p-ISSN: 2395-0072
© 2017, IRJET | Impact Factor value: 6.171 | ISO 9001:2008 Certified Journal | Page 1156
c) Performing straight turning operation on specimens in various cutting environments involving various combinations of process control parameters such as coolant, spindle speed, feed, depth of cut and type of tool
as per ) .
e) Measurement of flank wear on cutting tool using Profile projector. The machining tests are carried on GEDEEWEILER LZ350 lathe as shown in Figure 3.1 and its specifications are shown in Table 3.4.
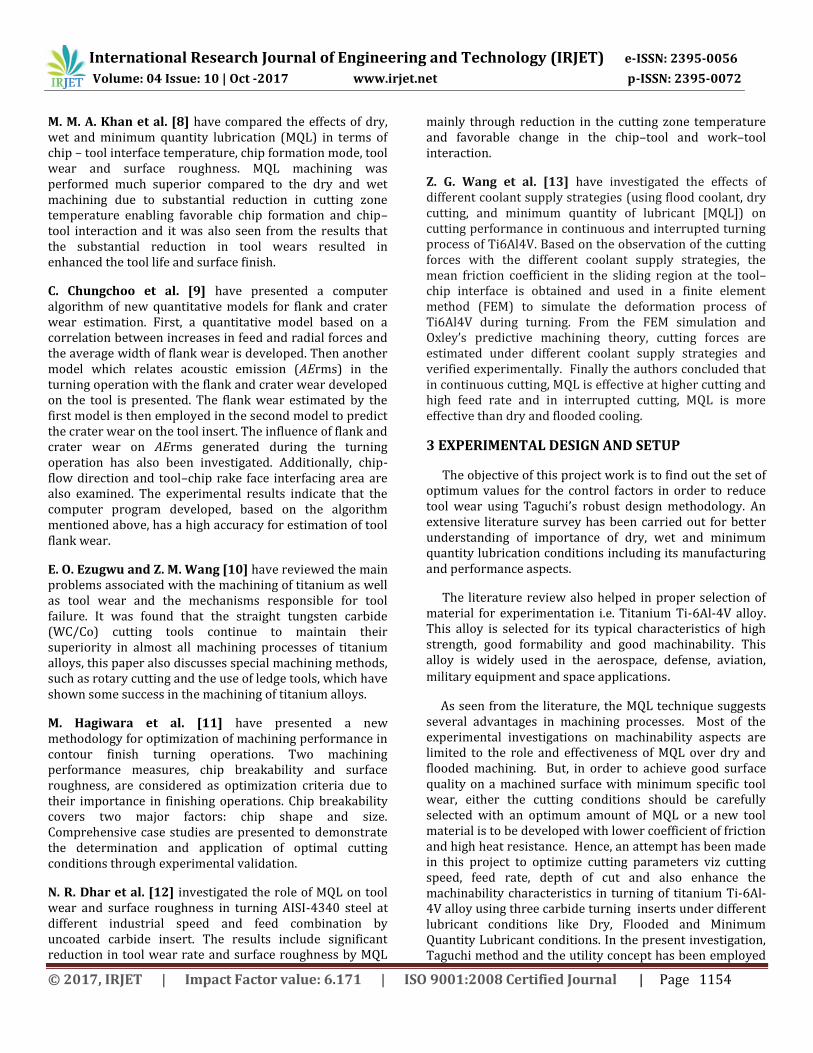
Machine tool- Lathe Machine GEDEEWEILER LZ350
Fig. 3.1: Principal components and movements of a typical lathe LZ350
TABLE 3.4: SPECIFICATION OF GEDEE WEILER LZ350:
SPEED (rpm) FEED (mm/rev) DEPTH OF CUT
(mm)
45 – 2000 0.017 – 1.096 0.1 – 12 3.3 WORKPIECE MATERIAL:
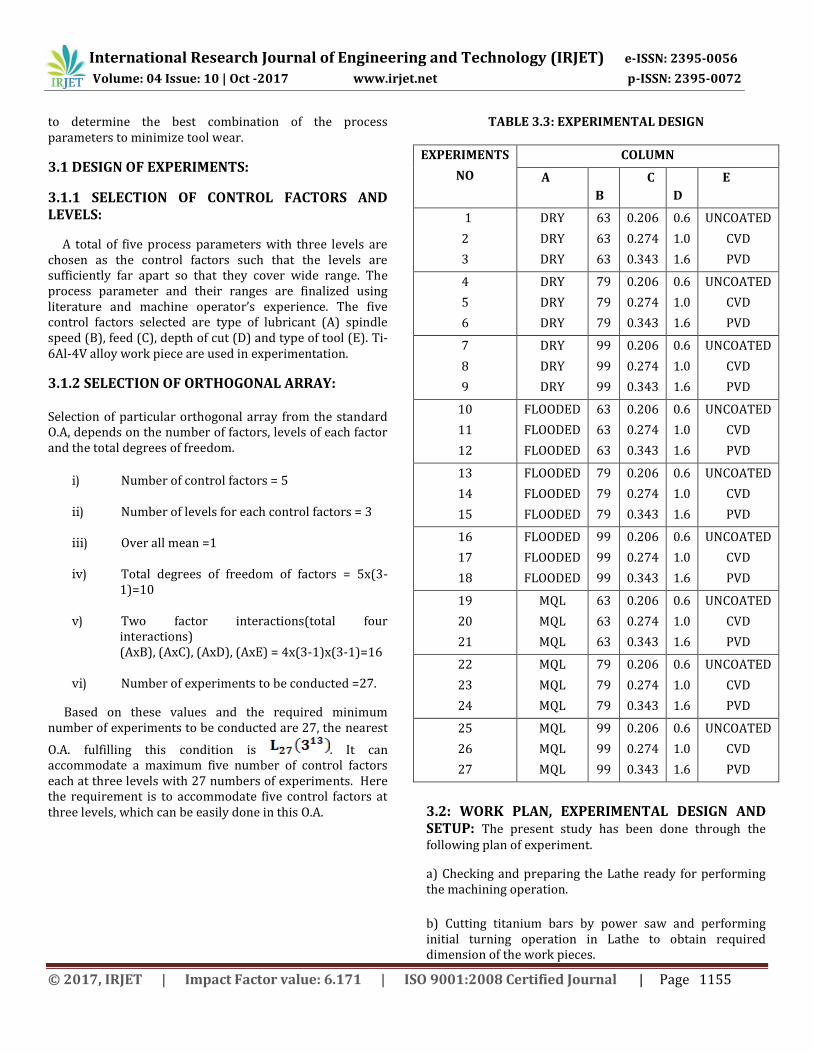
The work piece material used is Titanium alloy grade-5 (Ti-6Al-4V) of 150mm long and 50mm diameter. The work piece material is shown in Figure 3.2.
Fig. 3.2: Work-piece Titanium-Ti-6Al-4V
3.4 CUTTING TOOLS:
In this work, the cutting tools used are carbide inserts. Three different types of carbide cutting inserts are used in this work. They are
1. Uncoated tool 2. CVD coated tool 3. PVD coated tool
These are made by SECO with following specifications
1. Uncoated grade 883: Micro grain with very high hardness and good toughness, principally intended for roughing of super alloys and titanium alloys.
2. CVD coated TM 4000: This grade provides:
1. Simplicity and ease of use 2. Reduced tool compensations and adjustments on
the machine 3. Increased machine utilization and productivity 4. Improved part quality and machining confidence 5. Reduced tool inventory and simplified logistics
3) PVD coated TS 2000:
Hard micro grain principally intended for finishing operations on super alloys and titanium alloys. Insert that cut faster, work harder and last longer. A new generation of grades for heat resistant alloys. (Ti, Al)N+TiN 1.5 MEASUREMENT OF FLANK WEAR ON CUTTING
TOOL:
The flank wear of cutting tool after machining is measured using a profile projector is shown in Figure 4.6. The tool bits are placed on specimen locator of profile projector and light is focused on flank face of the inserts and tool wear is measured precisely. The specifications of the profile projector are: L.C = 0.01mm and Projection is 1:10.
Fig. 3.6 Profile projector
3.6 LUBRICANT/CUTTING FLUID:
The cutting lubricant/fluid used in the machining is synthetic oil under both flooded and MQL conditions.
International Research Journal of Engineering and Technology (IRJET) e-ISSN: 2395-0056
Volume: 04 Issue: 10 | Oct -2017 www.irjet.net p-ISSN: 2395-0072
© 2017, IRJET | Impact Factor value: 6.171 | ISO 9001:2008 Certified Journal | Page 1157
3.7 TYPE OF MACHINING:
The experiments are carried out on lathe under different lubricant conditions i.e. dry, flooded and MQL conditions as
per OA.
Dry machining:
The experiments are carried out using standard
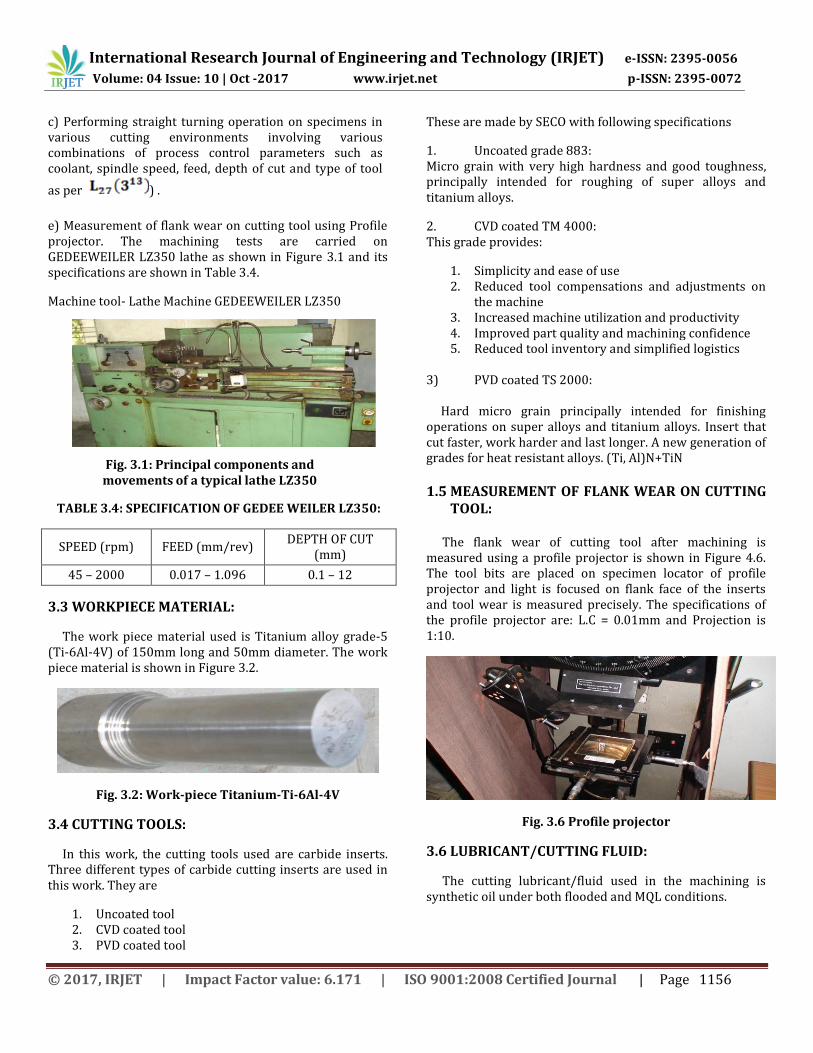
orthogonal array (OA) as shown in Table 3.3. The tool wear is measured using a Profile projector. Each experiment is conducted for two trails. The machined flank wear for two trails are shown in Table 3.5. The dry machining is shown in the Figure 3.8.
Fig. 3.7 Dry machining
Flooded machining:
The experiments are carried out under flooded
machining using standard orthogonal array (OA). The cutting fluid used under flooded machining is synthetic oil. The flow rate of the lubricant in flooded machining is adjusted as 3litres/min. The tool wear (flank wear) is measured using a Profile projector. The machined flank wear for the two trials under flooded condition is shown in Table 3.5. The flooded machining is shown in Figure 3.9.
Fig. 3.8 Flooded machining
Minimum Quantity Lubrication machining (MQL):
In the recent years a lot of research has been carried out to avoid the cutting fluids from the production. Many Industries and researchers are trying to reduce the use of coolant lubricant fluids in metal cutting to obtain safety, environmental and economical benefits. Dry cutting and semi-dry cutting such as Minimum Quantity Lubrication (MQL) have been favored by the industry. Minimum quantity lubrication (MQL) presents itself as a viable alternative for hard and dry machining with respect to tool wear, machined surface quality.
The experiments are conducted under MQL machining
using standard orthogonal array (OA). The
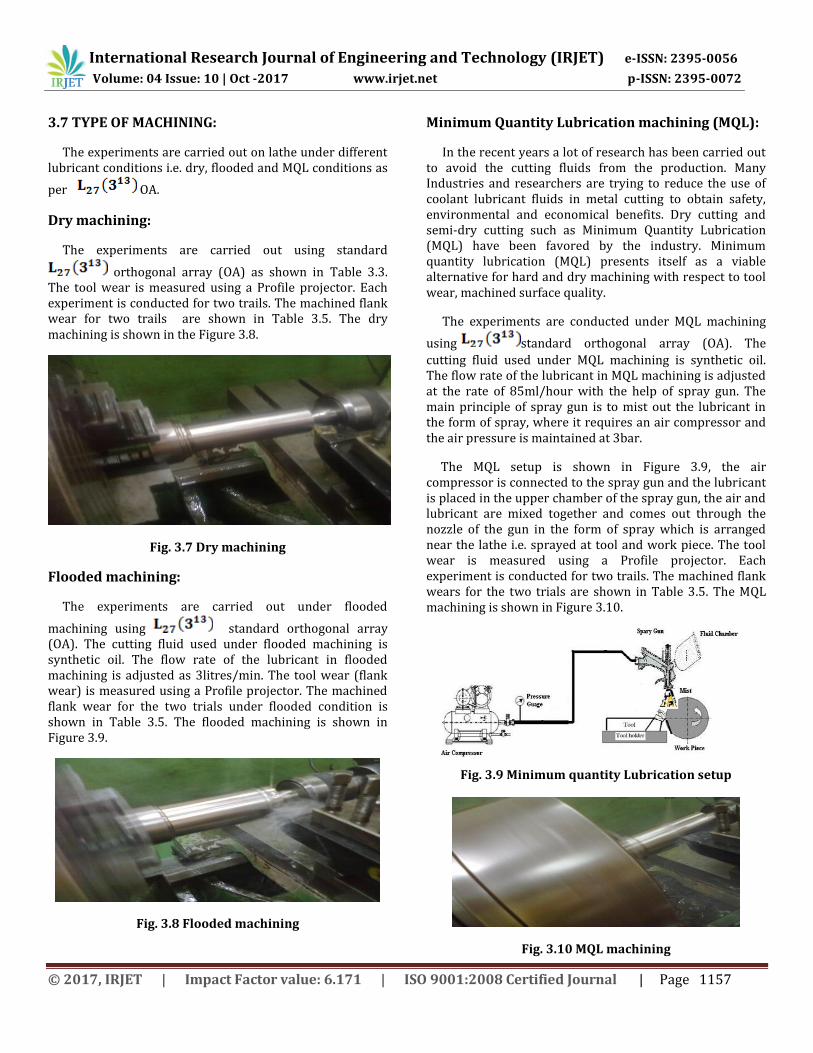
cutting fluid used under MQL machining is synthetic oil. The flow rate of the lubricant in MQL machining is adjusted at the rate of 85ml/hour with the help of spray gun. The main principle of spray gun is to mist out the lubricant in the form of spray, where it requires an air compressor and the air pressure is maintained at 3bar.
The MQL setup is shown in Figure 3.9, the air compressor is connected to the spray gun and the lubricant is placed in the upper chamber of the spray gun, the air and lubricant are mixed together and comes out through the nozzle of the gun in the form of spray which is arranged near the lathe i.e. sprayed at tool and work piece. The tool wear is measured using a Profile projector. Each experiment is conducted for two trails. The machined flank wears for the two trials are shown in Table 3.5. The MQL machining is shown in Figure 3.10.
Fig. 3.9 Minimum quantity Lubrication setup
Fig. 3.10 MQL machining
International Research Journal of Engineering and Technology (IRJET) e-ISSN: 2395-0056
Volume: 04 Issue: 10 | Oct -2017 www.irjet.net p-ISSN: 2395-0072
© 2017, IRJET | Impact Factor value: 6.171 | ISO 9001:2008 Certified Journal | Page 1158
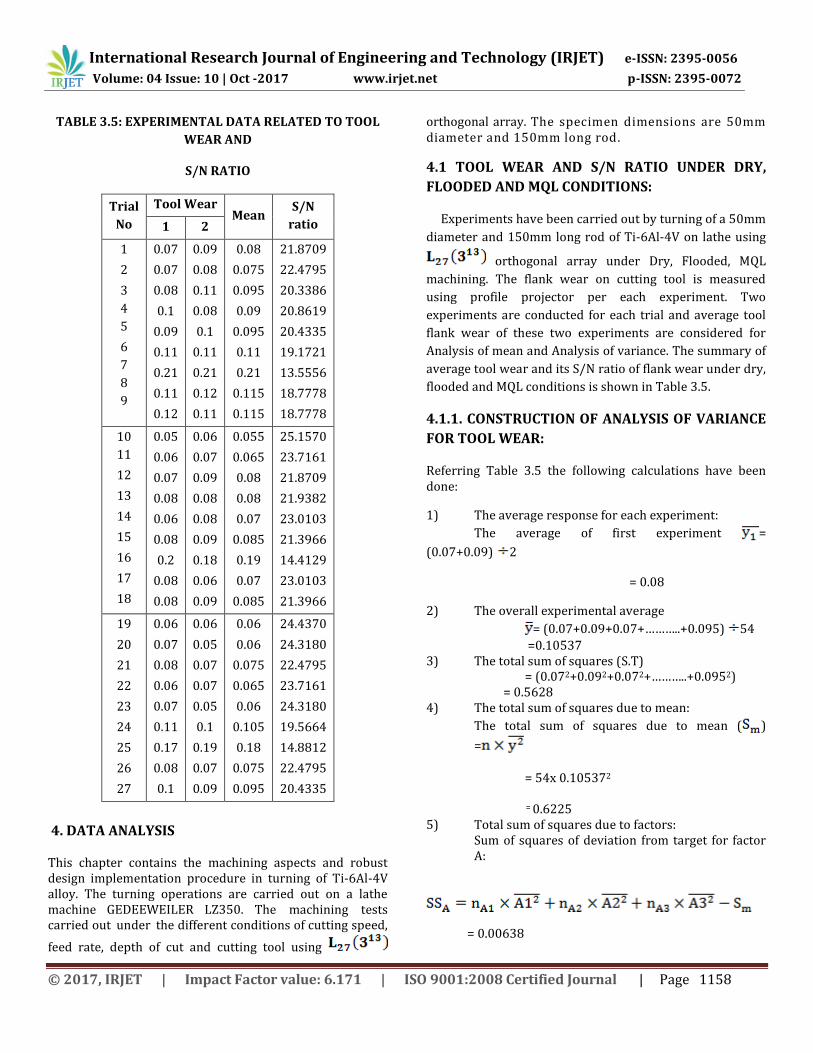
TABLE 3.5: EXPERIMENTAL DATA RELATED TO TOOL
WEAR AND
S/N RATIO
Trial
No
Tool Wear Mean
S/N
ratio 1 2
1
2
3
4
5
6
7
8
9
0.07
0.07
0.08
0.1
0.09
0.11
0.21
0.11
0.12
0.09
0.08
0.11
0.08
0.1
0.11
0.21
0.12
0.11
0.08
0.075
0.095
0.09
0.095
0.11
0.21
0.115
0.115
21.8709
22.4795
20.3386
20.8619
20.4335
19.1721
13.5556
18.7778
18.7778
10
11
12
13
14
15
16
17
18
0.05
0.06
0.07
0.08
0.06
0.08
0.2
0.08
0.08
0.06
0.07
0.09
0.08
0.08
0.09
0.18
0.06
0.09
0.055
0.065
0.08
0.08
0.07
0.085
0.19
0.07
0.085
25.1570
23.7161
21.8709
21.9382
23.0103
21.3966
14.4129
23.0103
21.3966
19
20
21
22
23
24
25
26
27
0.06
0.07
0.08
0.06
0.07
0.11
0.17
0.08
0.1
0.06
0.05
0.07
0.07
0.05
0.1
0.19
0.07
0.09
0.06
0.06
0.075
0.065
0.06
0.105
0.18
0.075
0.095
24.4370
24.3180
22.4795
23.7161
24.3180
19.5664
14.8812
22.4795
20.4335
4. DATA ANALYSIS
This chapter contains the machining aspects and robust design implementation procedure in turning of Ti-6Al-4V alloy. The turning operations are carried out on a lathe machine GEDEEWEILER LZ350. The machining tests carried out under the different conditions of cutting speed,
feed rate, depth of cut and cutting tool using
orthogonal array. The specimen dimensions are 50mm diameter and 150mm long rod.
4.1 TOOL WEAR AND S/N RATIO UNDER DRY,
FLOODED AND MQL CONDITIONS:
Experiments have been carried out by turning of a 50mm
diameter and 150mm long rod of Ti-6Al-4V on lathe using
orthogonal array under Dry, Flooded, MQL
machining. The flank wear on cutting tool is measured
using profile projector per each experiment. Two
experiments are conducted for each trial and average tool
flank wear of these two experiments are considered for
Analysis of mean and Analysis of variance. The summary of
average tool wear and its S/N ratio of flank wear under dry,
flooded and MQL conditions is shown in Table 3.5.
4.1.1. CONSTRUCTION OF ANALYSIS OF VARIANCE
FOR TOOL WEAR:
Referring Table 3.5 the following calculations have been done:
1) The average response for each experiment:
The average of first experiment =
(0.07+0.09) 2
= 0.08
2) The overall experimental average
= (0.07+0.09+0.07+………..+0.095) 54
=0.10537 3) The total sum of squares (S.T)
= (0.072+0.092+0.072+………..+0.0952) = 0.5628
4) The total sum of squares due to mean:
The total sum of squares due to mean ( )
=
= 54x 0.105372
= 0.6225 5) Total sum of squares due to factors:
Sum of squares of deviation from target for factor A:
= 0.00638
International Research Journal of Engineering and Technology (IRJET) e-ISSN: 2395-0056
Volume: 04 Issue: 10 | Oct -2017 www.irjet.net p-ISSN: 2395-0072
© 2017, IRJET | Impact Factor value: 6.171 | ISO 9001:2008 Certified Journal | Page 1159
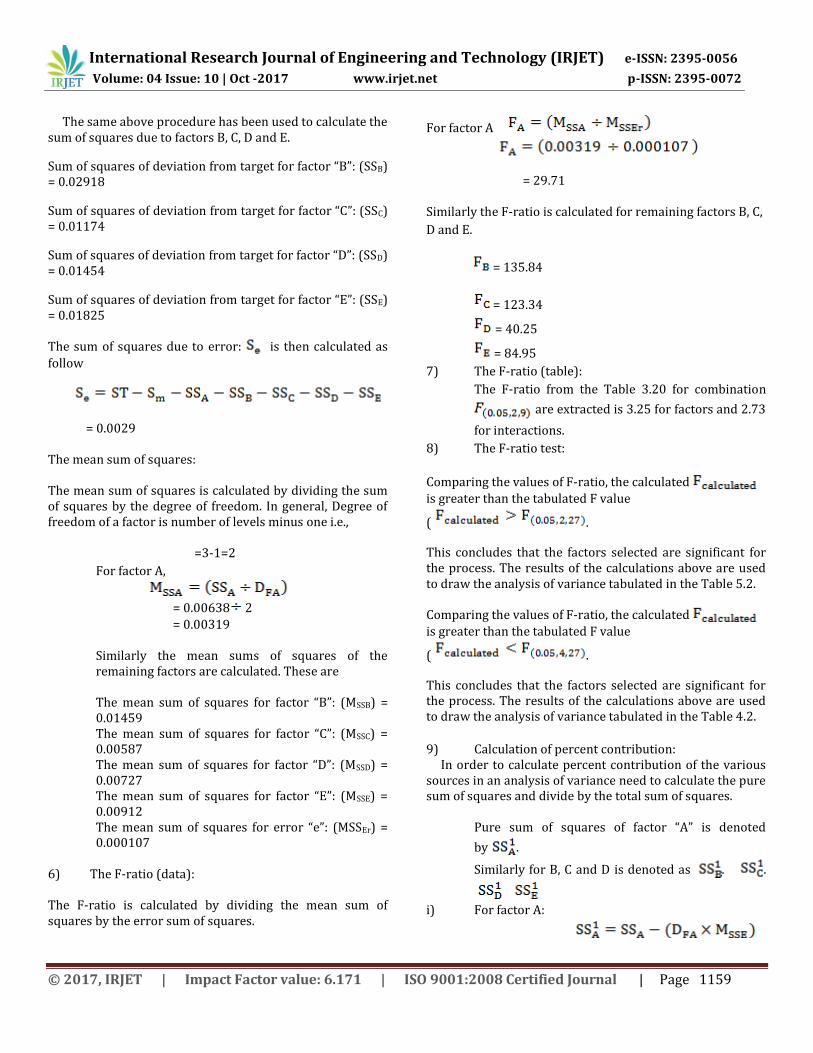
The same above procedure has been used to calculate the sum of squares due to factors B, C, D and E.
Sum of squares of deviation from target for factor “B”: (SSB) = 0.02918
Sum of squares of deviation from target for factor “C”: (SSC) = 0.01174
Sum of squares of deviation from target for factor “D”: (SSD) = 0.01454
Sum of squares of deviation from target for factor “E”: (SSE) = 0.01825
The sum of squares due to error: is then calculated as
follow
= 0.0029 The mean sum of squares: The mean sum of squares is calculated by dividing the sum of squares by the degree of freedom. In general, Degree of freedom of a factor is number of levels minus one i.e.,
=3-1=2
For factor A,
= 0.00638 2
= 0.00319
Similarly the mean sums of squares of the remaining factors are calculated. These are The mean sum of squares for factor “B”: (MSSB) = 0.01459 The mean sum of squares for factor “C”: (MSSC) = 0.00587 The mean sum of squares for factor “D”: (MSSD) = 0.00727 The mean sum of squares for factor “E”: (MSSE) = 0.00912 The mean sum of squares for error “e”: (MSSEr) = 0.000107
6) The F-ratio (data): The F-ratio is calculated by dividing the mean sum of squares by the error sum of squares.
For factor A
= 29.71
Similarly the F-ratio is calculated for remaining factors B, C,
D and E.
= 135.84
= 123.34
= 40.25
= 84.95
7) The F-ratio (table):
The F-ratio from the Table 3.20 for combination
are extracted is 3.25 for factors and 2.73
for interactions.
8) The F-ratio test:
Comparing the values of F-ratio, the calculated
is greater than the tabulated F value
( .
This concludes that the factors selected are significant for the process. The results of the calculations above are used to draw the analysis of variance tabulated in the Table 5.2.
Comparing the values of F-ratio, the calculated
is greater than the tabulated F value
( .
This concludes that the factors selected are significant for the process. The results of the calculations above are used to draw the analysis of variance tabulated in the Table 4.2.
9) Calculation of percent contribution: In order to calculate percent contribution of the various sources in an analysis of variance need to calculate the pure sum of squares and divide by the total sum of squares.
Pure sum of squares of factor “A” is denoted
by .
Similarly for B, C and D is denoted as . .
i) For factor A:
International Research Journal of Engineering and Technology (IRJET) e-ISSN: 2395-0056
Volume: 04 Issue: 10 | Oct -2017 www.irjet.net p-ISSN: 2395-0072
© 2017, IRJET | Impact Factor value: 6.171 | ISO 9001:2008 Certified Journal | Page 1160
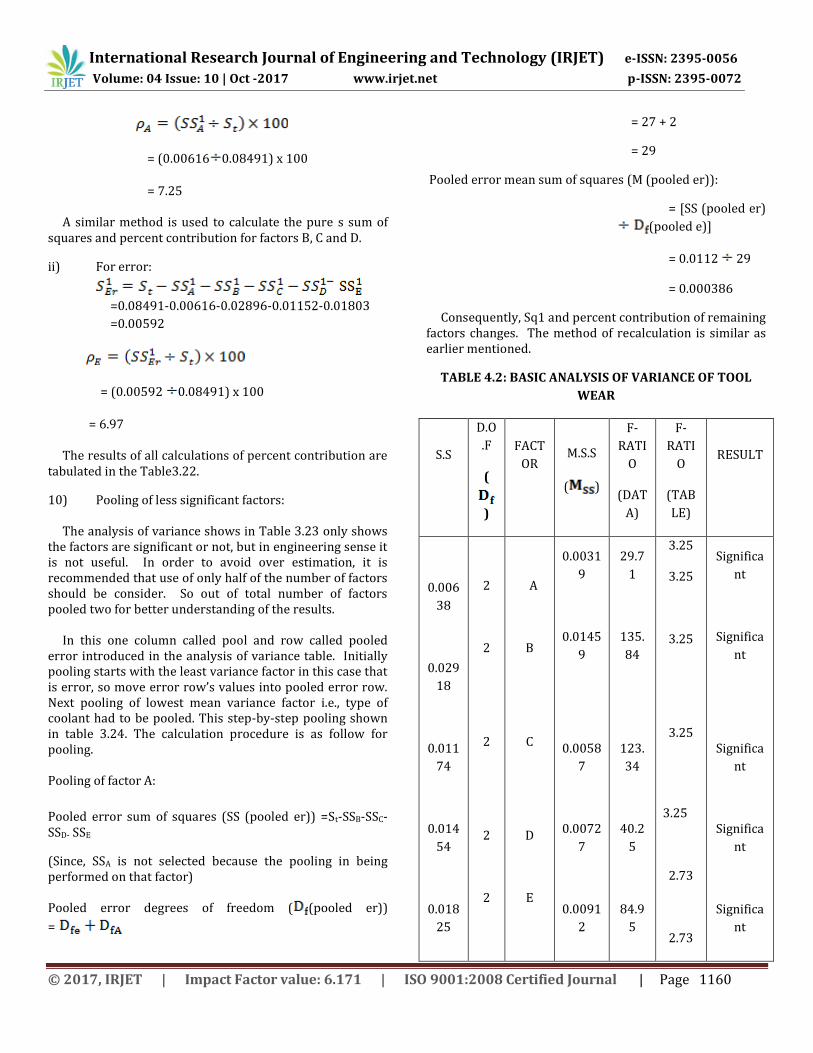
= (0.00616 0.08491) x 100
= 7.25
A similar method is used to calculate the pure s sum of squares and percent contribution for factors B, C and D.
ii) For error:
=0.08491-0.00616-0.02896-0.01152-0.01803
=0.00592
= (0.00592 0.08491) x 100
= 6.97
The results of all calculations of percent contribution are tabulated in the Table3.22.
10) Pooling of less significant factors: The analysis of variance shows in Table 3.23 only shows the factors are significant or not, but in engineering sense it is not useful. In order to avoid over estimation, it is recommended that use of only half of the number of factors should be consider. So out of total number of factors pooled two for better understanding of the results. In this one column called pool and row called pooled error introduced in the analysis of variance table. Initially pooling starts with the least variance factor in this case that is error, so move error row’s values into pooled error row. Next pooling of lowest mean variance factor i.e., type of coolant had to be pooled. This step-by-step pooling shown in table 3.24. The calculation procedure is as follow for pooling. Pooling of factor A:
Pooled error sum of squares (SS (pooled er)) =St-SSB-SSC-SSD- SSE
(Since, SSA is not selected because the pooling in being performed on that factor)
Pooled error degrees of freedom ( (pooled er))
=
= 27 + 2
= 29
Pooled error mean sum of squares (M (pooled er)):
= [SS (pooled er)
(pooled e)]
= 0.0112 29
= 0.000386
Consequently, Sq1 and percent contribution of remaining factors changes. The method of recalculation is similar as earlier mentioned.
TABLE 4.2: BASIC ANALYSIS OF VARIANCE OF TOOL
WEAR
S.S
D.O
.F
(
)
FACT
OR
M.S.S
( )
F-
RATI
O
(DAT
A)
F-
RATI
O
(TAB
LE)
RESULT
0.006
38
0.029
18
0.011
74
0.014
54
0.018
25
2
2
2
2
2
A
B
C
D
E
0.0031
9
0.0145
9
0.0058
7
0.0072
7
0.0091
2
29.7
1
135.
84
123.
34
40.2
5
84.9
5
3.25
3.25
3.25
3.25
3.25
2.73
2.73
Significa
nt
Significa
nt
Significa
nt
Significa
nt
Significa
nt
International Research Journal of Engineering and Technology (IRJET) e-ISSN: 2395-0056
Volume: 04 Issue: 10 | Oct -2017 www.irjet.net p-ISSN: 2395-0072
© 2017, IRJET | Impact Factor value: 6.171 | ISO 9001:2008 Certified Journal | Page 1161
0.00041
0.000
55
0.000
69
0.000
27
4
4
4
4
A*B
A*C
A*D
A*E
0.0001
0.0001
4
0.0001
4
0.0000
69
0.95
1.13
0.81
0.64
2.73
2.73
Insignific
ant
Insignific
ant
Insignific
ant
Insignific
ant
0.002
9 27
ERRO
R
0.0001
07
0.084
91 53 St
0.622
5 1
MEA
N
0.562
8 ST
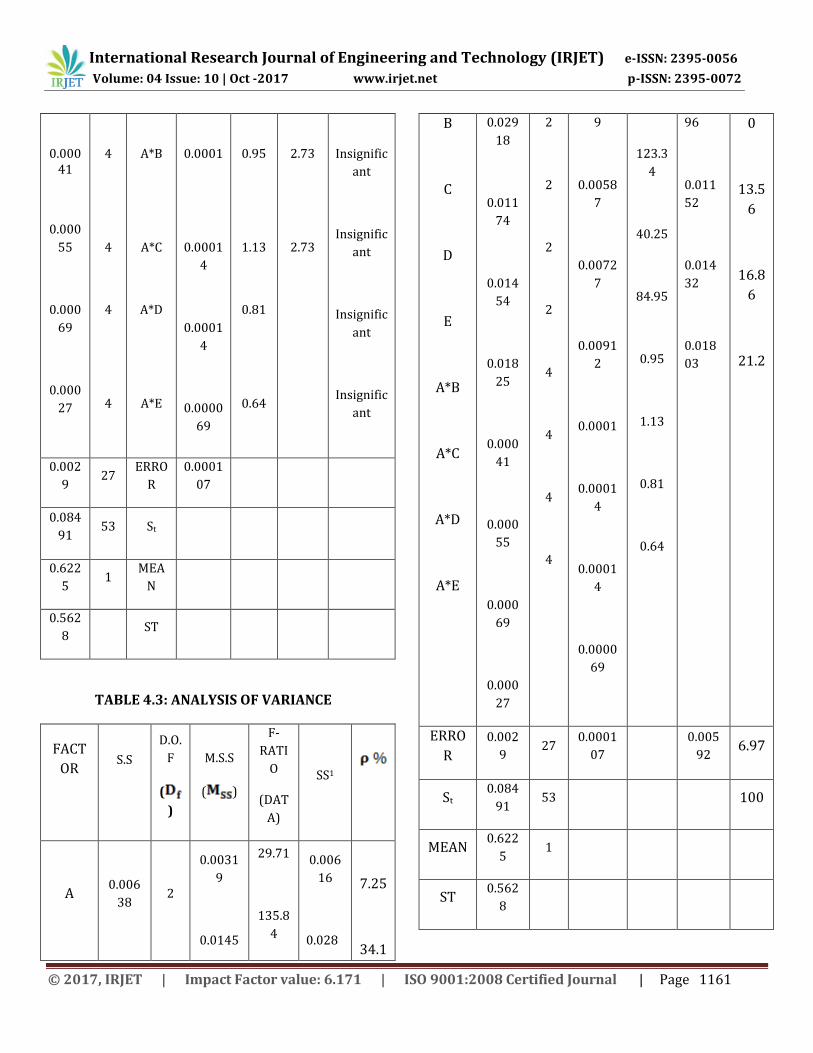
TABLE 4.3: ANALYSIS OF VARIANCE
FACT
OR
S.S
D.O.
F
(
)
M.S.S
( )
F-
RATI
O
(DAT
A)
SS1
A
0.006
38
2
0.0031
9
0.0145
29.71
135.8
4
0.006
16
0.028
7.25
34.1
B
C
D
E
A*B
A*C
A*D
A*E
0.029
18
0.011
74
0.014
54
0.018
25
0.000
41
0.000
55
0.000
69
0.000
27
2
2
2
2
4
4
4
4
9
0.0058
7
0.0072
7
0.0091
2
0.0001
0.0001
4
0.0001
4
0.0000
69
123.3
4
40.25
84.95
0.95
1.13
0.81
0.64
96
0.011
52
0.014
32
0.018
03
0
13.5
6
16.8
6
21.2
ERRO
R
0.002
9 27
0.0001
07
0.005
92 6.97
St 0.084
91 53 100
MEAN 0.622
5 1
ST 0.562
8
International Research Journal of Engineering and Technology (IRJET) e-ISSN: 2395-0056
Volume: 04 Issue: 10 | Oct -2017 www.irjet.net p-ISSN: 2395-0072
© 2017, IRJET | Impact Factor value: 6.171 | ISO 9001:2008 Certified Journal | Page 1162
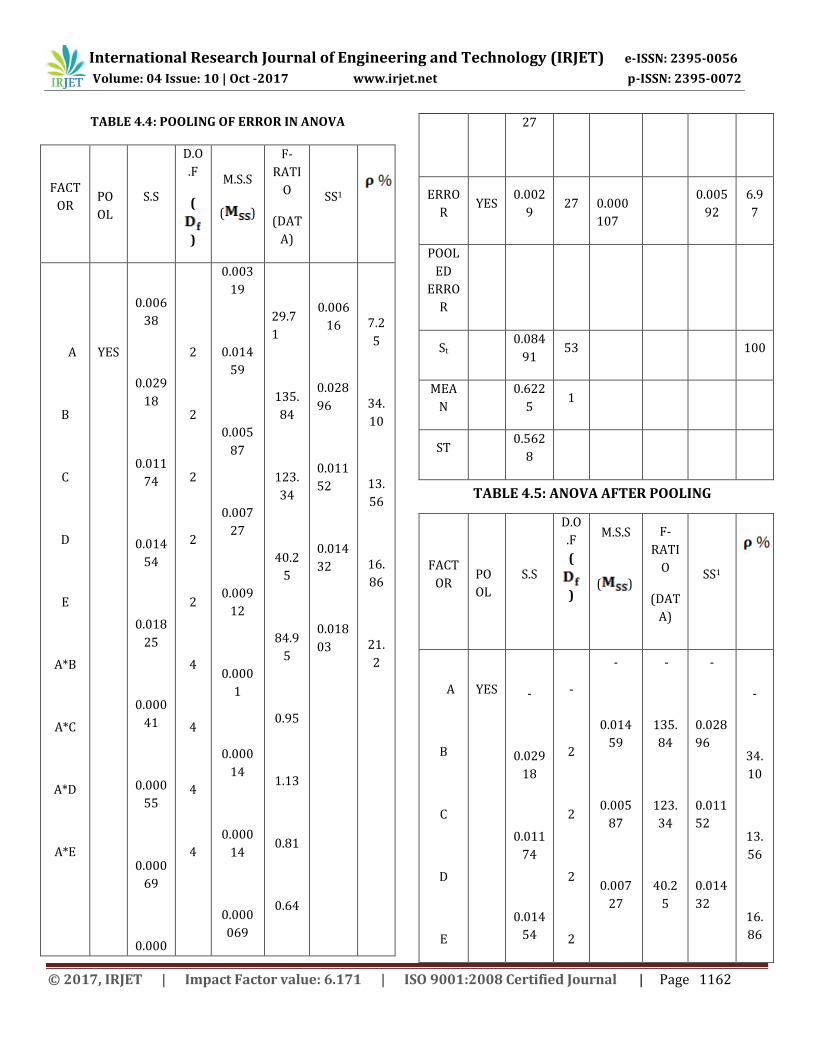
TABLE 4.4: POOLING OF ERROR IN ANOVA
FACT
OR
PO
OL
S.S
D.O
.F
(
)
M.S.S
( )
F-
RATI
O
(DAT
A)
SS1
A
B
C
D
E
A*B
A*C
A*D
A*E
YES
0.006
38
0.029
18
0.011
74
0.014
54
0.018
25
0.000
41
0.000
55
0.000
69
0.000
2
2
2
2
2
4
4
4
4
0.003
19
0.014
59
0.005
87
0.007
27
0.009
12
0.000
1
0.000
14
0.000
14
0.000
069
29.7
1
135.
84
123.
34
40.2
5
84.9
5
0.95
1.13
0.81
0.64
0.006
16
0.028
96
0.011
52
0.014
32
0.018
03
7.2
5
34.
10
13.
56
16.
86
21.
2
27
ERRO
R YES
0.002
9 27
0.000
107
0.005
92
6.9
7
POOL
ED
ERRO
R
St 0.084
91 53 100
MEA
N
0.622
5 1
ST 0.562
8
TABLE 4.5: ANOVA AFTER POOLING
FACT
OR
PO
OL
S.S
D.O
.F
(
)
M.S.S
( )
F-
RATI
O
(DAT
A)
SS1
A
B
C
D
E
YES
-
0.029
18
0.011
74
0.014
54
-
2
2
2
2
-
0.014
59
0.005
87
0.007
27
-
135.
84
123.
34
40.2
5
-
0.028
96
0.011
52
0.014
32
-
34.
10
13.
56
16.
86
International Research Journal of Engineering and Technology (IRJET) e-ISSN: 2395-0056
Volume: 04 Issue: 10 | Oct -2017 www.irjet.net p-ISSN: 2395-0072
© 2017, IRJET | Impact Factor value: 6.171 | ISO 9001:2008 Certified Journal | Page 1163
A*B
A*C
A*D
A*E
0.018
25
0.000
41
0.000
55
0.000
69
0.000
27
4
4
4
4
0.009
12
0.000
1
0.000
14
0.000
14
0.000
069
84.9
5
0.95
1.13
0.81
0.64
0.018
03
21.
2
ERRO
R YES - - -
POOL
ED
ERRO
R
0.011
2 29
0.000
386
0.120
8
14.
22
St 0.084
91 53 100
MEA
N
0.622
5 1
ST 0.562
8
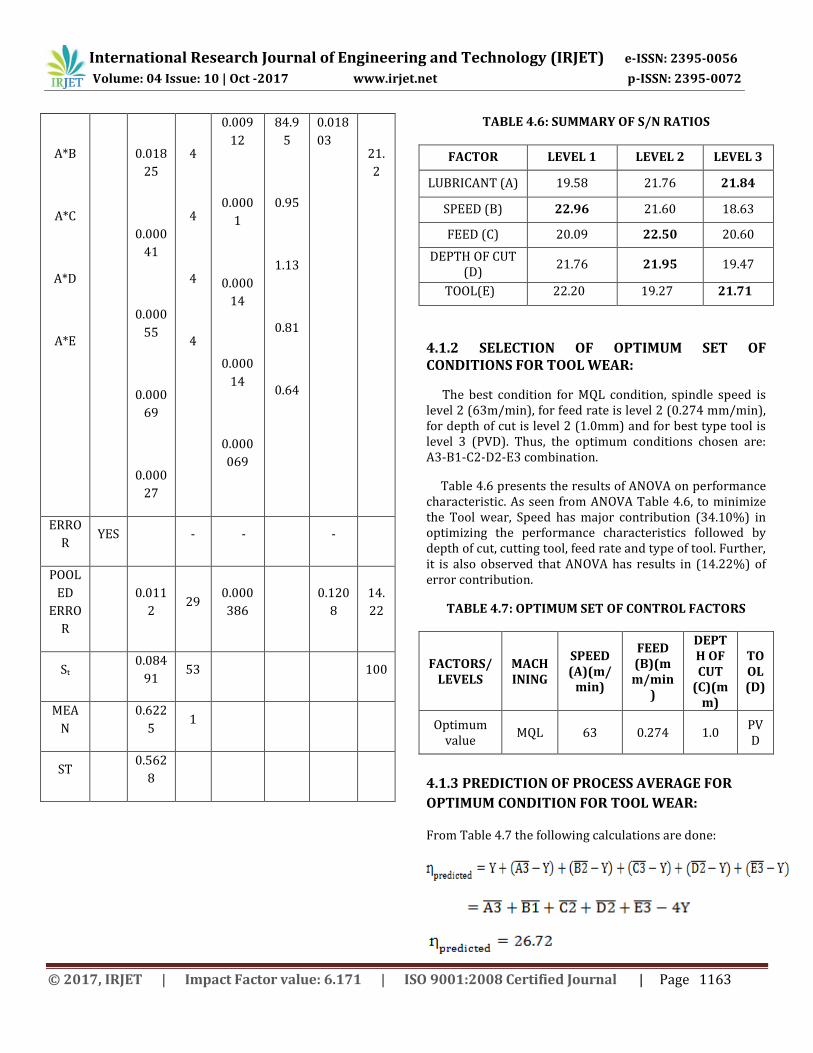
TABLE 4.6: SUMMARY OF S/N RATIOS
FACTOR LEVEL 1 LEVEL 2 LEVEL 3
LUBRICANT (A) 19.58 21.76 21.84
SPEED (B) 22.96 21.60 18.63
FEED (C) 20.09 22.50 20.60
DEPTH OF CUT (D)
21.76 21.95 19.47
TOOL(E) 22.20 19.27 21.71
4.1.2 SELECTION OF OPTIMUM SET OF CONDITIONS FOR TOOL WEAR:
The best condition for MQL condition, spindle speed is level 2 (63m/min), for feed rate is level 2 (0.274 mm/min), for depth of cut is level 2 (1.0mm) and for best type tool is level 3 (PVD). Thus, the optimum conditions chosen are: A3-B1-C2-D2-E3 combination.
Table 4.6 presents the results of ANOVA on performance characteristic. As seen from ANOVA Table 4.6, to minimize the Tool wear, Speed has major contribution (34.10%) in optimizing the performance characteristics followed by depth of cut, cutting tool, feed rate and type of tool. Further, it is also observed that ANOVA has results in (14.22%) of error contribution.
TABLE 4.7: OPTIMUM SET OF CONTROL FACTORS
FACTORS/LEVELS
MACHINING
SPEED (A)(m/
min)
FEED (B)(mm/min
)
DEPTH OF CUT
(C)(mm)
TOOL (D)
Optimum value
MQL 63 0.274 1.0 PVD
4.1.3 PREDICTION OF PROCESS AVERAGE FOR
OPTIMUM CONDITION FOR TOOL WEAR:
From Table 4.7 the following calculations are done:
International Research Journal of Engineering and Technology (IRJET) e-ISSN: 2395-0056
Volume: 04 Issue: 10 | Oct -2017 www.irjet.net p-ISSN: 2395-0072
© 2017, IRJET | Impact Factor value: 6.171 | ISO 9001:2008 Certified Journal | Page 1164
Therefore, the predicted average for optimum condition of Tool wear is 26.72.
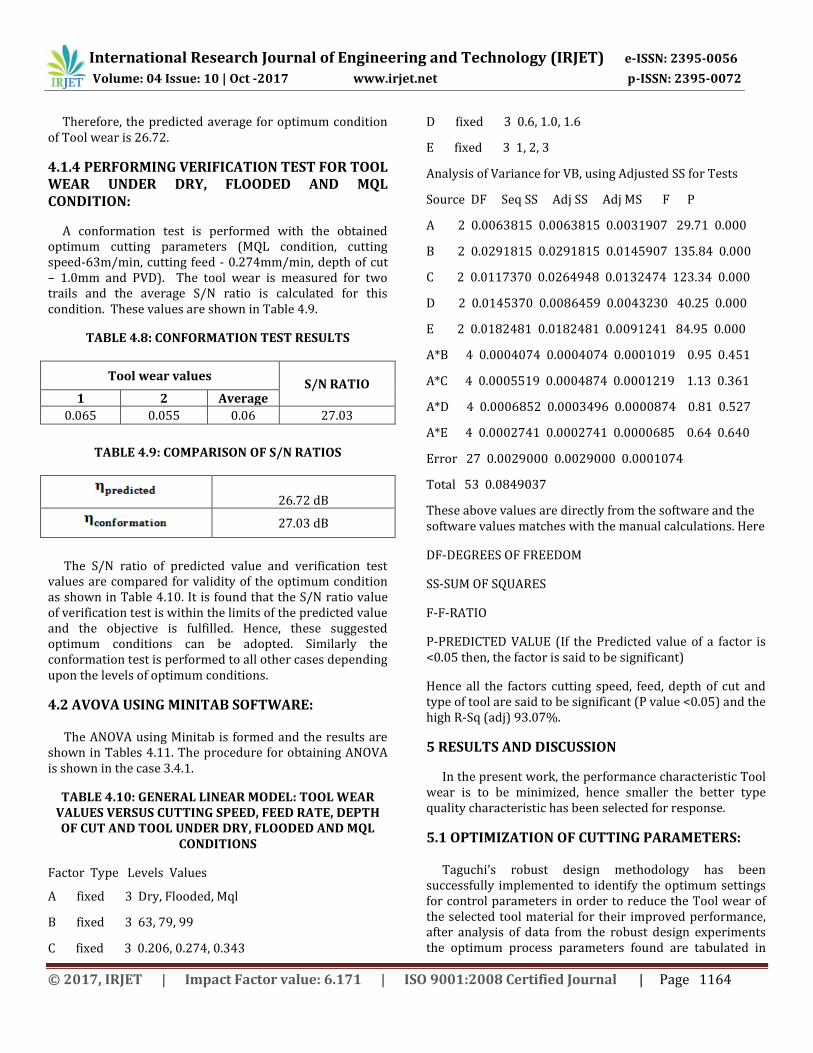
4.1.4 PERFORMING VERIFICATION TEST FOR TOOL WEAR UNDER DRY, FLOODED AND MQL CONDITION:
A conformation test is performed with the obtained optimum cutting parameters (MQL condition, cutting speed-63m/min, cutting feed - 0.274mm/min, depth of cut – 1.0mm and PVD). The tool wear is measured for two trails and the average S/N ratio is calculated for this condition. These values are shown in Table 4.9.
TABLE 4.8: CONFORMATION TEST RESULTS
Tool wear values S/N RATIO
1 2 Average
0.065 0.055 0.06 27.03
TABLE 4.9: COMPARISON OF S/N RATIOS
26.72 dB
27.03 dB
The S/N ratio of predicted value and verification test values are compared for validity of the optimum condition as shown in Table 4.10. It is found that the S/N ratio value of verification test is within the limits of the predicted value and the objective is fulfilled. Hence, these suggested optimum conditions can be adopted. Similarly the conformation test is performed to all other cases depending upon the levels of optimum conditions.
4.2 AVOVA USING MINITAB SOFTWARE:
The ANOVA using Minitab is formed and the results are shown in Tables 4.11. The procedure for obtaining ANOVA is shown in the case 3.4.1.
TABLE 4.10: GENERAL LINEAR MODEL: TOOL WEAR VALUES VERSUS CUTTING SPEED, FEED RATE, DEPTH OF CUT AND TOOL UNDER DRY, FLOODED AND MQL
CONDITIONS
Factor Type Levels Values
A fixed 3 Dry, Flooded, Mql
B fixed 3 63, 79, 99
C fixed 3 0.206, 0.274, 0.343
D fixed 3 0.6, 1.0, 1.6
E fixed 3 1, 2, 3
Analysis of Variance for VB, using Adjusted SS for Tests
Source DF Seq SS Adj SS Adj MS F P
A 2 0.0063815 0.0063815 0.0031907 29.71 0.000
B 2 0.0291815 0.0291815 0.0145907 135.84 0.000
C 2 0.0117370 0.0264948 0.0132474 123.34 0.000
D 2 0.0145370 0.0086459 0.0043230 40.25 0.000
E 2 0.0182481 0.0182481 0.0091241 84.95 0.000
A*B 4 0.0004074 0.0004074 0.0001019 0.95 0.451
A*C 4 0.0005519 0.0004874 0.0001219 1.13 0.361
A*D 4 0.0006852 0.0003496 0.0000874 0.81 0.527
A*E 4 0.0002741 0.0002741 0.0000685 0.64 0.640
Error 27 0.0029000 0.0029000 0.0001074
Total 53 0.0849037
These above values are directly from the software and the software values matches with the manual calculations. Here
DF-DEGREES OF FREEDOM
SS-SUM OF SQUARES
F-F-RATIO
P-PREDICTED VALUE (If the Predicted value of a factor is <0.05 then, the factor is said to be significant)
Hence all the factors cutting speed, feed, depth of cut and type of tool are said to be significant (P value <0.05) and the high R-Sq (adj) 93.07%.
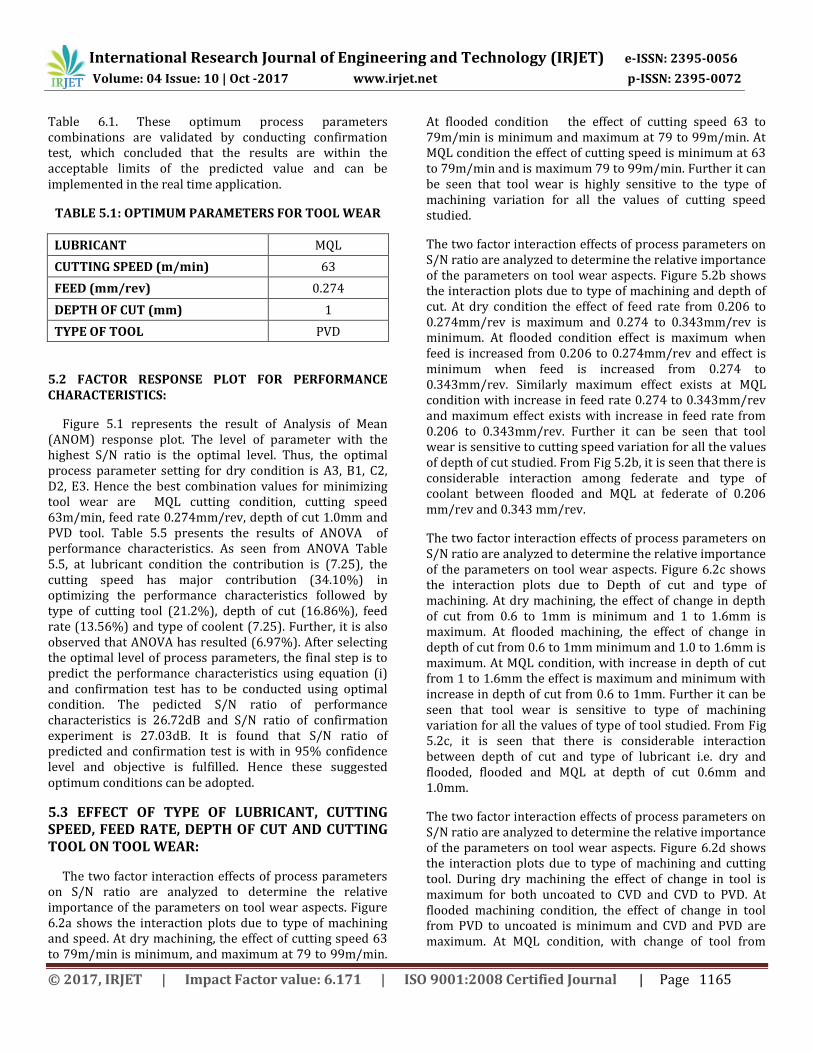
5 RESULTS AND DISCUSSION
In the present work, the performance characteristic Tool wear is to be minimized, hence smaller the better type quality characteristic has been selected for response.
5.1 OPTIMIZATION OF CUTTING PARAMETERS:
Taguchi’s robust design methodology has been successfully implemented to identify the optimum settings for control parameters in order to reduce the Tool wear of the selected tool material for their improved performance, after analysis of data from the robust design experiments the optimum process parameters found are tabulated in
International Research Journal of Engineering and Technology (IRJET) e-ISSN: 2395-0056
Volume: 04 Issue: 10 | Oct -2017 www.irjet.net p-ISSN: 2395-0072
© 2017, IRJET | Impact Factor value: 6.171 | ISO 9001:2008 Certified Journal | Page 1165
Table 6.1. These optimum process parameters combinations are validated by conducting confirmation test, which concluded that the results are within the acceptable limits of the predicted value and can be implemented in the real time application.
TABLE 5.1: OPTIMUM PARAMETERS FOR TOOL WEAR
LUBRICANT MQL
CUTTING SPEED (m/min) 63
FEED (mm/rev) 0.274
DEPTH OF CUT (mm) 1
TYPE OF TOOL PVD
5.2 FACTOR RESPONSE PLOT FOR PERFORMANCE CHARACTERISTICS:
Figure 5.1 represents the result of Analysis of Mean (ANOM) response plot. The level of parameter with the highest S/N ratio is the optimal level. Thus, the optimal process parameter setting for dry condition is A3, B1, C2, D2, E3. Hence the best combination values for minimizing tool wear are MQL cutting condition, cutting speed 63m/min, feed rate 0.274mm/rev, depth of cut 1.0mm and PVD tool. Table 5.5 presents the results of ANOVA of performance characteristics. As seen from ANOVA Table 5.5, at lubricant condition the contribution is (7.25), the cutting speed has major contribution (34.10%) in optimizing the performance characteristics followed by type of cutting tool (21.2%), depth of cut (16.86%), feed rate (13.56%) and type of coolent (7.25). Further, it is also observed that ANOVA has resulted (6.97%). After selecting the optimal level of process parameters, the final step is to predict the performance characteristics using equation (i) and confirmation test has to be conducted using optimal condition. The pedicted S/N ratio of performance characteristics is 26.72dB and S/N ratio of confirmation experiment is 27.03dB. It is found that S/N ratio of predicted and confirmation test is with in 95% confidence level and objective is fulfilled. Hence these suggested optimum conditions can be adopted.
5.3 EFFECT OF TYPE OF LUBRICANT, CUTTING SPEED, FEED RATE, DEPTH OF CUT AND CUTTING TOOL ON TOOL WEAR:
The two factor interaction effects of process parameters on S/N ratio are analyzed to determine the relative importance of the parameters on tool wear aspects. Figure 6.2a shows the interaction plots due to type of machining and speed. At dry machining, the effect of cutting speed 63 to 79m/min is minimum, and maximum at 79 to 99m/min.
At flooded condition the effect of cutting speed 63 to 79m/min is minimum and maximum at 79 to 99m/min. At MQL condition the effect of cutting speed is minimum at 63 to 79m/min and is maximum 79 to 99m/min. Further it can be seen that tool wear is highly sensitive to the type of machining variation for all the values of cutting speed studied.
The two factor interaction effects of process parameters on S/N ratio are analyzed to determine the relative importance of the parameters on tool wear aspects. Figure 5.2b shows the interaction plots due to type of machining and depth of cut. At dry condition the effect of feed rate from 0.206 to 0.274mm/rev is maximum and 0.274 to 0.343mm/rev is minimum. At flooded condition effect is maximum when feed is increased from 0.206 to 0.274mm/rev and effect is minimum when feed is increased from 0.274 to 0.343mm/rev. Similarly maximum effect exists at MQL condition with increase in feed rate 0.274 to 0.343mm/rev and maximum effect exists with increase in feed rate from 0.206 to 0.343mm/rev. Further it can be seen that tool wear is sensitive to cutting speed variation for all the values of depth of cut studied. From Fig 5.2b, it is seen that there is considerable interaction among federate and type of coolant between flooded and MQL at federate of 0.206 mm/rev and 0.343 mm/rev.
The two factor interaction effects of process parameters on S/N ratio are analyzed to determine the relative importance of the parameters on tool wear aspects. Figure 6.2c shows the interaction plots due to Depth of cut and type of machining. At dry machining, the effect of change in depth of cut from 0.6 to 1mm is minimum and 1 to 1.6mm is maximum. At flooded machining, the effect of change in depth of cut from 0.6 to 1mm minimum and 1.0 to 1.6mm is maximum. At MQL condition, with increase in depth of cut from 1 to 1.6mm the effect is maximum and minimum with increase in depth of cut from 0.6 to 1mm. Further it can be seen that tool wear is sensitive to type of machining variation for all the values of type of tool studied. From Fig 5.2c, it is seen that there is considerable interaction between depth of cut and type of lubricant i.e. dry and flooded, flooded and MQL at depth of cut 0.6mm and 1.0mm.
The two factor interaction effects of process parameters on S/N ratio are analyzed to determine the relative importance of the parameters on tool wear aspects. Figure 6.2d shows the interaction plots due to type of machining and cutting tool. During dry machining the effect of change in tool is maximum for both uncoated to CVD and CVD to PVD. At flooded machining condition, the effect of change in tool from PVD to uncoated is minimum and CVD and PVD are maximum. At MQL condition, with change of tool from
International Research Journal of Engineering and Technology (IRJET) e-ISSN: 2395-0056
Volume: 04 Issue: 10 | Oct -2017 www.irjet.net p-ISSN: 2395-0072
© 2017, IRJET | Impact Factor value: 6.171 | ISO 9001:2008 Certified Journal | Page 1166
uncoated to CVD the effect is very small and is maximum with change of tool from CVD to PVD. From Fig 5.2d, it is seen that there is considerable interaction among type of tool and type of coolant between Flooded and Dry at uncoated and PVD tools.
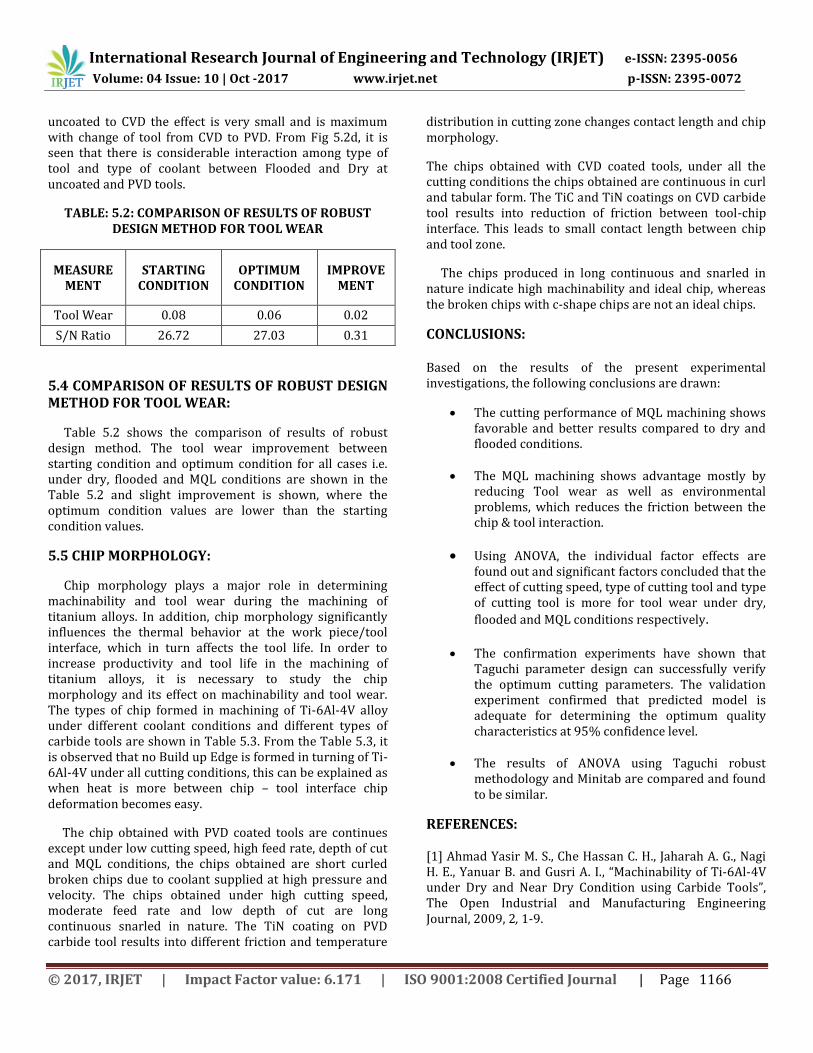
TABLE: 5.2: COMPARISON OF RESULTS OF ROBUST DESIGN METHOD FOR TOOL WEAR
MEASUREMENT
STARTING CONDITION
OPTIMUM CONDITION
IMPROVEMENT
Tool Wear 0.08 0.06 0.02
S/N Ratio 26.72 27.03 0.31
5.4 COMPARISON OF RESULTS OF ROBUST DESIGN METHOD FOR TOOL WEAR:
Table 5.2 shows the comparison of results of robust design method. The tool wear improvement between starting condition and optimum condition for all cases i.e. under dry, flooded and MQL conditions are shown in the Table 5.2 and slight improvement is shown, where the optimum condition values are lower than the starting condition values.
5.5 CHIP MORPHOLOGY:
Chip morphology plays a major role in determining machinability and tool wear during the machining of titanium alloys. In addition, chip morphology significantly influences the thermal behavior at the work piece/tool interface, which in turn affects the tool life. In order to increase productivity and tool life in the machining of titanium alloys, it is necessary to study the chip morphology and its effect on machinability and tool wear. The types of chip formed in machining of Ti-6Al-4V alloy under different coolant conditions and different types of carbide tools are shown in Table 5.3. From the Table 5.3, it is observed that no Build up Edge is formed in turning of Ti-6Al-4V under all cutting conditions, this can be explained as when heat is more between chip – tool interface chip deformation becomes easy.
The chip obtained with PVD coated tools are continues except under low cutting speed, high feed rate, depth of cut and MQL conditions, the chips obtained are short curled broken chips due to coolant supplied at high pressure and velocity. The chips obtained under high cutting speed, moderate feed rate and low depth of cut are long continuous snarled in nature. The TiN coating on PVD carbide tool results into different friction and temperature
distribution in cutting zone changes contact length and chip morphology.
The chips obtained with CVD coated tools, under all the cutting conditions the chips obtained are continuous in curl and tabular form. The TiC and TiN coatings on CVD carbide tool results into reduction of friction between tool-chip interface. This leads to small contact length between chip and tool zone.
The chips produced in long continuous and snarled in nature indicate high machinability and ideal chip, whereas the broken chips with c-shape chips are not an ideal chips.
CONCLUSIONS:
Based on the results of the present experimental investigations, the following conclusions are drawn:
The cutting performance of MQL machining shows favorable and better results compared to dry and flooded conditions.
The MQL machining shows advantage mostly by reducing Tool wear as well as environmental problems, which reduces the friction between the chip & tool interaction.
Using ANOVA, the individual factor effects are found out and significant factors concluded that the effect of cutting speed, type of cutting tool and type of cutting tool is more for tool wear under dry,
flooded and MQL conditions respectively.
The confirmation experiments have shown that Taguchi parameter design can successfully verify the optimum cutting parameters. The validation experiment confirmed that predicted model is adequate for determining the optimum quality characteristics at 95% confidence level.
The results of ANOVA using Taguchi robust
methodology and Minitab are compared and found to be similar.
REFERENCES:
[1] Ahmad Yasir M. S., Che Hassan C. H., Jaharah A. G., Nagi H. E., Yanuar B. and Gusri A. I., “Machinability of Ti-6Al-4V under Dry and Near Dry Condition using Carbide Tools”, The Open Industrial and Manufacturing Engineering Journal, 2009, 2, 1-9.
International Research Journal of Engineering and Technology (IRJET) e-ISSN: 2395-0056
Volume: 04 Issue: 10 | Oct -2017 www.irjet.net p-ISSN: 2395-0072
© 2017, IRJET | Impact Factor value: 6.171 | ISO 9001:2008 Certified Journal | Page 1167
[2] Q. L. An, Y. C. Fu B., J. H. Xu, “Experimental study on turning of TC9 titanium alloy with cold water mist jet cooling”, International Journal of Machine Tools & Manufacture 51, 2011, 549–555.
[3] Vishal S. Sharma, Manu Dogra, N. M. Suri, “Cooling techniques for improved productivity in turning”, International Journal of Machine Tools & Manufacture 49, 2009, 435–453.
[4] Shane Y. Hong, Irel Markus, Woo-cheol Jeong, “New cooling approach and tool life improvement in cryogenic machining of titanium alloy Ti-6Al-4V”, International Journal of Machine Tools & Manufacture 41, 2001, 2245–2260.
[5] E. O. Ezugwu, “High Speed Machining of Aero-Engine Alloys”, Journal of the Brazilian Society of Mechanical Science & Engineering, January-March 2004, Vol. XXVI, 1 -11.
[6] A. Attanasio, M. Gelfi and C. Giardini, “Minimal quantity lubrication in turning: Effect on tool wear”, Wear, Vol. 260, 2005, 333–338.
[7] K. Weinert, Inasaki I., Sutherland J. W., Wakabayashi T., “Dry machining and Minimum Quantity Lubrication”, University of Dortmund, Germany, 1998, 371-397.
[8] M. M. A. Khan, M. A. H. Mithu and N. R. Dhar, “Effects of minimum quantity lubrication on turning AISI 9310 alloy steel using vegetable oil-based cutting fluid”, Journal of Materials Processing Technology, Vol. 209, 2009, 5573–5583.
[10] Chungchoo and D. Saini, “An estimation of tool wear in CNC turning operations using fuzzy neural network model”, Proceedings of the 8th International Conference on Manufacturing Engineering (CD-ROM), Vol. 1, 2000, 1–7.
[11] E. O. Ezugwu and Z. M. Wang, “Titanium alloys and their machinability- a review”, Journal of Materials Processing Technology, Vol. 68, 1997, 262-274.
[12] M. Hagiwara, S. Chen and I. S. Jawahir, “Optimization of machining performance in contour finish turning operations”, Thesis, University of Kentucky.
[13] N. R. Dhar, M. Kamruzzaman and Mahiuddin Ahmed, “Effect of minimum quantity lubrication (MQL) on tool wear and surface roughness in turning AISI-4340 steel”, Journal of Materials Processing Technology, Vol.172, 2006, 299–304.
[14] Wang Z. G., Rahman M., Wong Y. S., “Modeling of cutting forces during machining of titanium alloys with
different coolant strategies”. Proceedings of the 8th CIRP International Workshop on Modeling in Machining Operations, Chemnitz, Germany, 275–282.
[15] Phillip J. Ross, “Taguchi Techniques for Quality Engineering”, Tata McGraw Hill, Second Edition, 2005.
[16] Shrikant S. Dhurgude “REVIEW ON INFLUENCE OF COOLING TECHNIQUE ON TOOL WEAR IN TURNING OF TITANIUM ALLOY Ti-6Al-4V “