Embed Size (px)
Citation preview

Influence of bioenergy crop Jatropha curcas amendmenton soil biogeochemistry in a tropical vertisol
Bharati Kollah & Garima Dubey & Peter Dunfield &
Santosh Ranjan Mohanty
Received: 1 October 2013 /Accepted: 23 February 2014# Springer Science+Business Media Dordrecht 2014
Abstract Experiments were carried out to determine how the incorporation of biomass fromthe bioenergy crop Jatropha curcas into a tropical vertisol affects the biogeochemical process-es important for greenhouse gas (GHG) fluxes, specifically methane (CH4) production, carbondioxide (CO2) production, and CH4 consumption. Leaf biomass of J. curcas was incorporatedat 0.1, 0.5, and 1 % (w/w) into soil maintained under 60 % of moisture-holding capacity(MHC). Biomass addition significantly stimulated potential CH4 and CO2 production whileinhibiting potential CH4 consumption. When 1 % of J. curcas biomass was added to soil,potential CH4 production increased nearly 50-fold over 60 days, from 2.45 μg CH4g
−1
soil day−1 in unamended soil to 115 μg g−1 day−1 in soil containing leaf biomass. Soil CO2
production also doubled when the J. curcas biomass was added. The potential CH4 consump-tion rate of soil was inhibited almost completely by 1 % of added biomass. The culturablemethanotroph population was positively correlated with the CH4 consumption rate (r=0.961,p<0.0001) and was inhibited 20-fold by 1 % of biomass addition. In contrast, the totalpopulation of aerobic heterotrophs culturable on a complex medium increased from 11 to59×106 of colony-forming units (CFU)g−1 of soil after biomass addition. Significant positivecorrelation was observed between the total heterotroph population and both CH4 production(r=0.861, p=0.0003) and CO2 production (r=0.863, p=0.0002). Our study shows thatbiomass from the bioenergy crop J. curcas can affect soil biogeochemical processes that controlGHG emissions. We propose that a high incorporation of J. curcas biomass could dramaticallychange the CH4 flux in tropical soil by simultaneously increasing CH4 production anddecreasing CH4 consumption, and we therefore recommend that biomass incorporation to soilbe minimized (<0.1 %) as a strategy to mitigate GHG emission.
Keywords Bioenergy. Carbon dioxide . Climate mitigation . Greenhouse gas . Jatropha . Leafbiomass .Methane . Tropical soil
Mitig Adapt Strateg Glob ChangeDOI 10.1007/s11027-014-9555-6
B. Kollah :G. Dubey : S. R. Mohanty (*)Indian Institute of Soil Science (IISS), Nabibagh, Bhopal 462038, Indiae-mail: [email protected]
P. DunfieldDepartment of Biological Sciences, University of Calgary, 2500 University Dr. NW, Calgary, Alberta T2N1N4, Canada

1 Introduction
Recently, there is increasing interest in developing alternative energy sources to sustainablymeet global energy demand. Biomass-based fuels such as biodiesel from Jatropha curcas havegained special interest as they can ensure energy security, a cleaner environment, andsustainable development. It is predicted that by 2015 Jatropha will be planted on 12.8 millionha worldwide (Kant and Wu 2011). In addition to the global energy crisis, there is increasingconcern about atmospheric greenhouse gas (GHG) such as carbon dioxide (CO2) and methane(CH4) as agents of global climate change. In the years between c. 1750 and 2011, atmosphericCO2 increased by 40 % from 278 to 390.5 ppm, while atmospheric CH4 increased by 150 %from 722 to 1,803 ppb (Sun et al. 2011; MacCracken 2013).
Production and consumption of CO2 and CH4 in soils are a complex microbial phenomenathat regulate the atmospheric GHG budget. Soils can be either net sinks or net sources of thesegases depending on the balance of production and consumption processes. Emission of CO2
via microbial and plant respiration is the second largest terrestrial CO2 source (Heimann andReichstein 2008; Yiqi and Zhou 2010). Recently, it was found that soil CO2 production hasincreased by about 0.1 % per year between 1989 and 2008 (Bond-Lamberty and Thomson2010). CH4 production by methanogenic Archaea can occur in soils provided that they containdegradable carbon substrate and are exposed to anoxic conditions over a sufficiently long timeperiod to allow the onset of methanogenesis (Conrad et al. 2006). Aerobic microbial con-sumption of CH4 also occurs in most soils, and dry upland soils are usually net sinks foratmospheric CH4 (Bender and Conrad 1994; Hutsch et al. 1994; Kightley and Cooper 1995;Boetius et al. 2000; Srikitjakarn et al. 2002; Dunfield 2007). The strength of this sink isestimated at 10–40 Tg per year CH4 (Reeburg 1993; Roslev and King 1995; Hardy and King2001; Reeburgh 2003).
In this study, we attempt to link the intensive cultivation of J. curcas across the world topotential global climate change scenarios. The objectives of this research were to understandthe influence of this bioenergy crop biomass on soil biogeochemical processes governing (1)CO2 production, (2) CH4 production, and (3) CH4 consumption processes in a tropical vertisoland identify possible mitigation strategies for global change.
2 Materials and methods
2.1 Site and soil characterization
Soil samples were collected from the experimental agricultural fields of the Indian Institute ofSoil Science (IISS) in Bhopal, Madhya Pradesh, India (23° 18′ N latitude, 77° 24′ E longitudeand 485 m above mean sea level). The soils were obtained by removing the top ~1 cm andcollecting the next 10-cm depth layer with a shovel. Three randomly collected individualsamples were mixed to make a composite sample, and the composite sample was stored inplastic bags at 4 °C until use. The soil is a very fine clay loam, hyperthermic, typic haplustertand characterized by an organic carbon content of 5.7 g kg−1, available N of 225 mg kg−1,available P of 2.6 mg kg−1, and available K of 230 mg kg−1. The textural composition of thesoil was as follows: sand, 15.2 %; silt, 30.3 %; and clay, 54.5 %. Electrical conductivity (EC)was 0.43 dS m−1 and pH 7.5. The water holding capacity was 62 % (w/w), bulk density was1.45 mg m−3, and porosity was 45 % in the surface soil (0–15 cm). The region receives1,005 mm of average annual rainfall. A major part of rain (88 %) falls during June toSeptember.
Mitig Adapt Strateg Glob Change

2.2 J. curcas leaf collection and preparation
Fully grown mature leaves of J. curcas were collected from healthy plants cultivated at theexperimental site located at Rajiv Gandhi Technological University in Bhopal. The plants were5–6 years old and were maintained under normal agronomic practices. Leaves were collectedfrom healthy plants during the monsoon season (July–September 2012) when the plants showoptimum propagation and the maximum number of leaves. Collected plant materials werecleaned with sterile distilled water and dried for 3 days in the shade. The dried plant materialwas crushed in an electric grinder to coarse powder consistency. The powder material waspassed through a 2-mm sieve and stored in an airtight plastic container at ambient temperature.
2.3 Experimental design and microcosm setup
The experiment used a completely randomized design to determine the influence of J. curcasbiomass on soil biogeochemical processes. Different leaf biomass treatments were performedin a factorial combination of one soil, three GHG cycling processes (CO2 production, CH4
production, and CH4 consumption), and four leaf biomass levels (0, 0.1, 0.5, and 1 % w/w ofsoil). Each experiment was replicated three times for a total of 36 (3 GHG cycling processes×4biomass levels×3 replicates) microcosms.
2.4 Potential CH4 production
Ten-gram portions of soil were added to sterile 130-mL serum vials and amended withpowdered leaf biomass (0, 0.1, 0.5, and 1 % w/w). A flooded moisture regime was simulatedby adding 25 mL of sterile distilled water. Vials were sealed gas-tight with butyl rubber septaand incubated in the dark in an incubator at 30±2 °C. Vials for CH4 production were shaken8 h daily in a horizontal rotary shaker at 100 rotations per minute. The accumulation of CH4 inthe vial headspaces was monitored at regular intervals by removing headspace gas samples(0.1 mL) with an airtight syringe for analysis of CH4 via gas chromatography-flame ionizationdetection (GC-FID, see below). After each sampling, the removed headspace gas (0.1 mL) wasreplaced with an equivalent amount of high-purity helium (He) to maintain the gas-phasepressure.
2.5 CO2 production
Ten-gram portions of soil were added to presterile 130-mL serum vials. Powdered leaf biomass(0, 0.1, 0.5, and 1 % w/w) was mixed into the soil by using a sterile glass rod, and the soil wasadjusted to 60 % of moisture-holding capacity (MHC) by adding sterile distilled water. Vialswere sealed with butyl rubber septa and incubated statically in the dark at 30±2 °C. HeadspaceCO2 mixing ratios were monitored at regular intervals for 10 days by removal of 0.1-mL gassamples for analysis by GC. After each sampling, the removed headspace was replaced with anequivalent amount of high-purity helium to maintain the pressure equilibrium.
2.6 Potential CH4 consumption
To quantify CH4 consumption potential of soil samples, incubations were carried out using theprotocol described by Mohanty et al. (2007). Briefly, 10-g portions of the soil were placed insterile 130-mL serum vials. Powdered leaf biomass of J. curcas was added at 0, 0.1, 0.5, and1 % w/w and mixed thoroughly using a sterile glass rod. Soils were adjusted to 60 % of MHC
Mitig Adapt Strateg Glob Change
by adding sterile distilled water. Serum vials were sealed with neoprene septa, and theheadspace was injected with 5 mL (approximately 4.4 %v/v) CH4 (Mohanty et al. 2000).Serum vials were incubated at 30±2 °C in the dark. After shaking the vials, headspace gassamples (0.1 mL) were removed with syringes and analyzed by GC-FID. This was repeated atregular intervals until the CH4 mixing ratio decreased to a near-ambient level. After eachsampling, the headspace was replaced with an equivalent amount of high-purity He to maintainthe pressure equilibrium. The amount of CH4 remaining in the headspace was plotted on a logscale against the time of incubation (Mohanty et al. 2006). After an initial lag phase,consumption of CH4 followed a first-order reaction as the plots yielded straight lines basedon the equation C=C0e
−kt, where C is the concentration of CH4 remaining in the vial after timet, C0 is the initial concentration of CH4, and k is the first-order kinetic constant. The lag phasewas estimated as the period (in days) from the start of the incubation to the phase of rapidlydeclining headspace CH4.
2.7 Estimation of CO2 and CH4
The CH4 or CO2 mixing ratios in the headspaces of serum vials were analyzed using a gaschromatograph (CIC 2010 series, India) equipped with an FID and a Porapak Q column (2-mlength, 2/8-in. diameter, 80/100 mesh, stainless steel column). The injector, column, anddetector were maintained at 120, 60, and 300 °C, respectively. CO2 was measured afterconversion to CH4 in a methanizer at 330 °C. A 0.1-mL gas sample was injected into thegas chromatograph with a gas-tight syringe. Under these conditions, the retention time of CH4
was 1.3 min and CO2 was 2.5 min. The GC was calibrated before and after each set of themeasurements using standard mixtures of CH4 (Sigma Gases, New Delhi, India) and/or CO2
(Inox Air, Bhopal, India).
2.8 Microbial population dynamics
Total culturable heterotrophs and methanotrophs were enumerated after the incubation periods.The population of total culturable aerobic heterotrophic bacteria in the soil samples wasestimated by a standard serial 10−6-fold dilution plate technique using tryptone yeast extractmedium (Rand et al. 1976) and expressed as colony-forming units (CFU) g−1 of dry soil.Culturable methanotrophs were enumerated in serial dilution series as described by (Grahamet al. 1992). Triplicate plates for each dilution were incubated on nitrate mineral salts medium(Whittenbury et al. 1970) in airtight glass desiccators under an atmosphere of CH4 (5 %v/v) inair at 32±2 °C. The atmosphere was replenished with CH4 every fourth day during a 30-dayincubation. After 30 days, colonies were assayed for soluble methane monooxygenase(sMMO) enzyme activity via an assay based on the ability of the enzyme to co-oxidizenaphthalene to naphthol, which forms a colored complex with O-dianisidine. The coloniesthat developed color after the addition of naphthalene and O-dianisidine (tetrazotized) werecounted as CH4-consuming bacteria.
2.9 Statistical analysis
All data were calculated on the basis of soil oven-dry weight and were arithmetic averages ofthree replicate observations. Datasets were statistically analyzed via ANOVA, and the meancomparison between treatments was tested by Tukey’s honestly significant difference (HSD).The Pearson product moment correlation coefficients were estimated to define the correlations
Mitig Adapt Strateg Glob Change

among the parameters. Ordination biplots of a principal component analysis were carried outto demonstrate the relationships among different parameters. Statistical analyses were per-formed using the agricolae and vegan packages of R statistical software (R version 2.15.1).
3 Results
3.1 Potential CH4 production from soil
The vertisol used in the study produced CH4 only after a long lag phase (40 days) followingthe start of the incubations (Fig. 1). J. curcas leaf biomass stimulated CH4 production byreducing the lag phase to 20 days and increasing the amount of CH4 produced during themethanogenic phase (Fig. 1). To quantify the influence of J. curcas leaf biomass on CH4
production, cumulative CH4 production was estimated at the end of the incubation (60 days)(Table 1). Cumulative CH4 production in the control soil was 147.6 μg of CH4 produced g
−1 ofsoil, but increased with 0.1, 0.5, and 1 % of biomass addition 1.4-, 2.8-, and 47-fold,respectively. The response of CH4 production to biomass addition was nonlinear, and additionof 1 % leaf biomass had a much more prominent effect than the other biomass levels.
3.2 CO2 production from soil
The temporal course of CO2 production responded differently to J. curcas leaf biomassaddition (Fig. 2). CO2 production that began immediately after incubations were started andcontinued during a 10-day incubation. The 0.1 % biomass treatment had a small effect on CO2
production, while 0.5 and 1 % treatments had greater effects. The cumulative CO2 productionamong different treatments varied much less than did potential CH4 production (Table 1). TotalCO2 production was in the range of 1,109 to 2,240 μg g−1 soil, with the lowest production inthe control soil and the highest in the 1 % biomass treatment.
0 10 20 30 40 50 600
200
400
600
Control0.1% Leaf biomass0.5% Leaf biomass1% Leaf biomass
2000400060008000
10000
CH
4 p
rod
uct
ion
(µ
g g
-1 s
oil
)
Fig. 1 Effect of Jatropha curcas leaf biomass incorporation on CH4 production in a tropical vertisol. Freshleaves of J. curcas were air-dried, ground, sieved, and added to soil at 0, 0.1, 0.5, and 1 % (w/w). Samples wereincubated in closed vials under flooded conditions (1:2.5, soil to water). Data points represent the arithmeticmean of measurements in three replicate vials ±1 standard deviation (SD) of the mean. Where the SD bars are notseen, they are contained within the symbols
Mitig Adapt Strateg Glob Change

3.3 CH4 consumption activity of soil
Incorporation of J. curcas leaf biomass had a significantly negative effect on the potential CH4
consumption activity of soil. The convex decline pattern of headspace CH4 over time wasconsistent with progressive growth of methane-oxidizing bacteria (MOB) populations duringthe incubation, with an increasing population resulting in faster CH4 consumption (Fig. 3).CH4 consumption activity was quantified using three measures: lag phase (the period from thestart of the incubation to the initiation of active CH4 consumption), apparent rate constant k,and the half-life t1/2 of headspace CH4 (Table 1). The apparent rate constant k was determinedfrom the slope of the logarithm of the CH4 concentration in the headspace versus time
Table 1 Impact of incorporation of Jatropha curcas biomass on CH4 production, CO2 production, and CH4
consumption in a tropical vertisol
Leaf biomass incorporation level CH4
production(μg g−1 soil)
CO2
production(μg g−1 soil)
CH4 consumption
Post-lagphase rateconstant (g−1
soil day−1)
Half-life (t1/2) ofheadspace CH4
(days)
Lagphase(days)
None 147.6b 1,109b 0.498a 1.399b 3.33d
0.1 % leaf biomass 209.5b 1,525ab 0.351a 1.973b 5.33c
0.5 % leaf biomass 412.4b 2,208a 0.150b 5.018b 8.66b
1 % leaf biomass 6,956a 2,240a 0.001b 574.9a 14a
Tukey’s HSD (α=0.05, df error=10) 4,433.8 860.68 0.149 376.80 1.86
CO2 and CH4 production was estimated as headspace gas accumulated over a period of 10 and 60 days,respectively. The CH4 consumption values were determined in soil samples incubated 14 days under a headspaceof CH4 in air as described in the “Materials and methods.” Different lowercase letters in each column indicatesignificant differences at p<0.05 based on Tukey’s HSD test. Values are means of three replicates
0 2 4 6 8 100
1000
2000
3000Control0.1% Leaf biomass0.5% Leaf biomass1% Leaf biomass
CO
2 p
rod
uct
ion
(µ
g g
-1 s
oil
)
Fig. 2 Effect of Jatropha curcas leaf biomass incorporation on CO2 production in a tropical vertisol. Leaves ofJ. curcaswere ground, sieved, and added to soil at 0, 0.1, 0.5, and 1 % (w/w). Soil samples were adjusted to 60 %of MHC and incubated in closed vials. Data points represent the arithmetic mean of three replicate vials ±1standard deviation (SD) of the mean. Where SD bars are not seen, they are contained within the symbols
Mitig Adapt Strateg Glob Change
(Mohanty et al. 2007) during the rapid decline phase (i.e., after the lag phase). The rateconstant k was expressed as the fraction of CH4 consumed g−1 of soil day−1 and is specific to asystem with 120-mL total headspace.
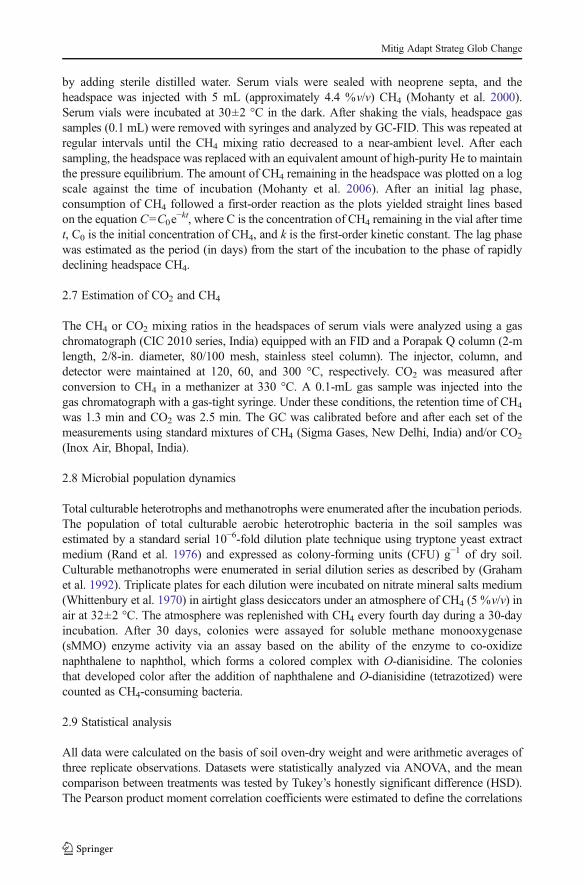
The adverse effect of biomass was most prominent at higher (0.5 and 1 %) biomass levels(Fig. 3, Table 1). The native soil was a net CH4 sink, but the CH4 consumption rate wasinhibited at 29.5, 69.8, and 99.8 % by 0.1, 0.5, and 1 % biomass, respectively. The lag phasesalso increased with biomass addition, from 3.3 days in the control soil to 5.3 and8.7 days in the 0.1 and 0.5 % biomass treatments, respectively. The lag phase in the1 % biomass treatment was greater than that in the 14-day incubation period. In fact,there was little indication of any decline in headspace CH4 in the highest biomasstreatment (1%), indicating almost complete inhibition of CH4 consumption over the incubationperiod. The half-life t1/2 of headspace CH4 varied between 1.4 days in the control and 575 daysin the 1 % biomass treatment.
3.4 Microbial population dynamics
Populations of different functional microbial groups in the soil responded differently to theaddition of J. curcas leaf biomass (Table 2). The total aerobic heterotroph population variedbetween 11×106 and 59×106 CFU g−1 soil. Higher culturable heterotrophic bacterial popula-tions were found in soils amended with biomass. Heterotrophic populations were increased 2-,3-, and 5-fold by 0.1, 0.5, and 1 % of biomass addition compared to the control soil. Theestimated population of culturable methanotrophs varied between 1.33×10⁶ and 27.3×10⁶ CFU g−1 soil. As expected from the CH4 consumption rate measurements, the highestabundance of culturable methanotrophs was estimated in the control soil without biomassaddition, while the lowest abundance was estimated in the soil with 1 % of leaf biomass added.Culturable methanotrophs decreased by 52, 79, and 95 % in the 0.1, 0.5, and 1 % biomasstreatments, respectively, compared to the control soil.
0 2 4 6 8 10 12 140
2
4
6
8
10
Control0.1% Leaf biomass0.5% Leaf biomass1% Leaf biomass
Lo
g o
f re
sid
ual
CH
4 (µ
g g
-1 s
oil
)
Fig. 3 Effect of Jatropha curcas leaf biomass incorporation on CH4 consumption in a tropical vertisol. Leaveswere ground, sieved (2 mm) and added to soil at 0, 0.1, 0.5, and 1 % (w/w). Soils samples were adjusted to 60 %of MHC and incubated in closed vials containing 4.4 % (v/v) CH4 in air. Data points represent the arithmeticmean of three replicate vials ±1 standard deviation (SD) of the mean. Where SD bars are not seen, they arecontained within the symbols
Mitig Adapt Strateg Glob Change

3.5 Correlation analysis, ordination biplot of principal component analysis
Correlation analysis was carried out using all measured parameters: CH4 production, CO2 produc-tion, CH4 consumption rate constant, CH4 consumption lag phase, CH4 consumption half-life ofheadspace CH4, total culturable heterotroph population, and culturableMOB population (Table 3).CH4 production was positively correlated to CO2 production, and both were negatively correlatedwith apparent CH4 consumption rate (p<0.0001). A positive correlation (p<0.0001) was observedbetween CH4 and CO2 production rates and populations of heterotrophs. The CH4 consumptionrate constant k was highly positively correlated with populations of culturable MOB (p<0.0001).
The principal component analysis (PCA) of the data matrix showed that most of thevariance was explained by the first two principal components. The first component
Table 2 Effect of incorporation of Jatropha curcas biomass on culturable populations of aerobic heterotrophsand methanotrophs in a tropical vertisol
Leaf biomass incorporation level Aerobic heterotrophs(×106 CFU g−1 soil)
Methane-consuming bacteria(×104 CFU g−1 soil)
None 11.00c 27.33a
0.1 % leaf biomass 22.67bc 13.0ab
0.5 % leaf biomass 31.67b 5.66b
1 % leaf biomass 59.67a 1.33b
Tukey’s HSD (α=0.05, df error=10) 14.47 13.86
Methanotrophs were estimated after incubation 14 days under a headspace of CH4 in air as described in the“Materials and methods.” Different lowercase letters in each column indicate significant differences at p<0.05based on Tukey’s HSD test. Values are means of triplicate observations
Table 3 Pearson product moment correlations of parameters measured in the study
Parameters CH4 CO2 k t1/2 Lag phase Heterotrophs
CO2 0.632(0.0274)*
k −0.990(5.09e−10)***
−0.696(0.0118)**
t1/2 0.993(8.37e−11)***
0.612(0.0341)*
−0.992(1.63e−10)***
Lag 0.883(0.0001)***
0.832(0.0007)***
−0.894(8.62e−05)***
0.855(0.0003)***
Heterotrophs 0.861(0.0003)***
0.863(0.0002)***
−0.878(0.0001)***
0.841(0.0005)***
0.948(2.53e−06)***
Methanotrophs −0.958(9.33e−07)***
−0.773(0.0031)***
0.961(6.50e−07)***
−0.937(6.82e−06)***
−0.961(6.56e−07)***
−0.929(1.21e−05)***
CO2 is the cumulative CO2 production, CH4 is the cumulative CH4 production, k is the apparent rate constant ofCH4 consumption, t1/2 is the half-life of headspace CH4, Lag phase is the lag phase of CH4 consumption,heterotrophs are the population of aerobic heterotrophic bacteria, and methanotrophs are the population ofmethane-consuming bacteria. Values in parentheses are p values against the null hypothesis that the truecorrelation is equal to 0
(–) negative correlation
*p<0.1; **p<0.05; ***p<0.01 (significant)
Mitig Adapt Strateg Glob Change

explained 96.23 % of the variability (eigenvalue 2.07), while 2.99 % (eigenvalue 0.064)of the variability was explained by the second component (Fig. 4). The ordination biplotcategorized the 1 % leaf biomass treatment as the favored treatment for CH4 production,while the control and lower leaf biomass level (0.1 %) were closely associated withhigher CH4 consumption rates. CO2 production was maximal in 1 and 0.5 % leafbiomass amendment. The biplot indicated a negative relationship between potentialCH4 consumption and CO2 production.
4 Discussion
Annual J. curcas biomass production is 0.79–2.27 t ha−1 (Abugre et al. 2011). J. curcasbiomass contains 3.22–4.44 % N, 1.4–2.09 % P, and 1.2–1.68 % K. It is nutritionally betterthan cow manure and has therefore been used as a green manure for many other crops(Montoya and Tejeda 1989; Wang et al. 2011). In one experiment, application of 10-t freshbiomass ha−1 of J. curcas as a green manure to a loamy acidic paddy soil increased averagerice yields by 11–23 % (Sherchan et al. 1989). Here, we demonstrate that the incorporation of
Fig. 4 Ordination biplot of a PCA showing the first two principal components, vectors of parameter (lines), andJatropha curcas biomass level (symbols). Principal component (PC) 1 accounted for 96.23 % of the variation(2.07 eigenvalue), while PC2 accounted for 2.99 % of the variation (0.064 eigenvalue). The vectors are asfollows: CH4 production (CH4), CO2 production (CO2), apparent CH4 consumption rate constant (k), CH4
consumption lag phase (Lag), population of aerobic heterotrophs (Het), and population of methanotrophs (MOB).Different symbols represent leaf biomass treatments: control with 0 % leaf biomass added (squares), 0.1 % leafbiomass (up-pointing triangles), 0.5 % leaf biomass (down-pointing triangles), and 1 % leaf biomass (circles). InPCA, vectors with narrow angles to an axis are strongly correlated to that axis, while vectors that areperpendicular show no correlation. Longer vector stems indicate higher confidence, while inferences made fromvariables located near the center of the diagram are often imprecise
Mitig Adapt Strateg Glob Change

J. curcas biomass may have negative effects as well. It influences soil GHG cycling process bystimulating CH4 and CO2 production and inhibiting CH4 consumption.
CO2 production and the total heterotrophic microbial population were both stimulated byJ. curcas biomass. Plant biomass is an energy and carbon source for microbial growth and ismineralized to CO2. Increased CO2 emission has been reported from a Mexican soil afteramendment with seed cake of J. curcas (Ruíz-Valdiviezo et al. 2013). High CO2 productionfrom soil with leaf biomass was attributed to the mineralization of the easily decomposablepolysaccharide fraction of leaf biomass in soil (Müller et al. 2006).
Potential CH4 production was also stimulated by J. curcas biomass addition to soil. Thiswas probably a dual effect of increased soil anoxia and increased substrates formethanogenesis. Application of organic material increases anoxic microsites of soils byincreasing microbial metabolism and therefore biological oxygen demand, and these anoxicsites support methanogenesis (Collins et al. 2011). J. curcas leaf biomass increased aerobicheterotrophic microbial activity (r=0.861, p=0.0003) and production of CH4. CH4 is producedin soil directly from methanogenic metabolism of acetic acid or H2, but also indirectly throughfermentation of substrates like acetaldehydes and short-chain fatty acids to acetate (Lindauet al. 1993b; Yao and Conrad 2001; Lu et al. 2005). Aqueous extracts of J. curcas kernelscontain 2-furancarboxaldehyde (29.7 %), 5-(hydroxymethyl) acetic acid (16.2 %), and 2-furancarboxaldehyde (14.6 %) (Oskoueian et al. 2011). Alternatively, the anaerobic break-down of cellulose and other materials in the biomass could have produced the precursors forsyntrophic methanogenesis.
In contrast, CH4 consumption was decreased by the addition of leaf biomass from J. curcas.This negative impact was greatest at the 0.5 and 1 % biomass levels. CH4 consumption activityin soil samples was quantified using three parameters: lag phase, apparent rate constant k, andhalf-life of headspace CH4. The apparent rate constant k was negatively correlated with lagphase (p<0.00001) and positively correlated with t1/2 (p<0.00001). Similar correlations werefound earlier in rice field soil (Adhya et al. 2000; Mohanty et al. 2000, 2009). We also found asignificant positive correlation between the CH4 consumption rate constant k and culturableMOB populations (Table 3). Similar correlations between k and methanotroph populationshave been found previously (Bharati et al. 2000; Mohanty et al. 2013).
Inhibition of CH4 consumption could be attributed to inhibitory factors in the J. curcas leafbiomass. For example, plant terpenoids have been shown to inhibit methantrophy (Amaralet al. 1998), and diverse terpenoids are detectable in J. curcas leaves, roots, stems and seeds(HuiFen et al. 2012; Sharma et al. 2012; Yang et al. 2013). J. curcas is used in traditionalmedicine and contains a variety of antimicrobial compounds (Abdelgadir and Van Staden2013), some of which may be particularly active against MOB.
The relationships of the different parameters of the study were most evident in the ordinationbiplot of the PCA (Fig. 4). CH4 production was positively related to biomass amendment, whileCH4 consumption was negatively related.
5 Conclusions
Extensive cultivation of J. curcas could influence soil biogeochemical processes that regulateglobal climate change. Incorporation of J. curcas leaf biomass into a vertisol increased theproduction of greenhouse gases (CO2 and CH4), while it inhibited the CH4-consuming activityof soil. Theoretically, this could lead to increased emissions of both CO2 and CH4 from thesoil. The results imply that GHG emissions from soils will be increased by J. curcas cultivationif its biomass is not managed properly. Based on these initial studies, J. curcas biomass
Mitig Adapt Strateg Glob Change

incorporation to soil should be minimized and application kept below 0.1 % (2 t ha−1) as astrategy to mitigate GHG emissions.
Acknowledgments The authors are thankful to DBT India for financial support for the project on metagenomiccharacterization nutrient cycling microbes in the rhizosphere of the bioenergy crop J. curcas. The authors are alsograteful to the Director, Indian Institute of Soil Science, Bhopal, India, for all institutional support during theproject. The comments and recommendations of two anonymous reviewers are greatly acknowledged.
References
Abdelgadir HA, Van Staden J (2013) Ethnobotany, ethnopharmacology and toxicity of Jatropha curcas L.(Euphorbiaceae): a review. S Afr J Bot 88:204–218
Abugre S, Oti-Boateng C, Yeboah M (2011) Litter fall and decomposition trend of Jatropha curcas L. leavesmulches under two environmental conditions. Agric Biol J N Am 2:462–470
Adhya TK, Bharati K, Mohanty SR et al (2000) Methane emission from rice fields at Cuttack, India. MethaneEmiss Major Rice Ecosyst Asia 58:95–105
Amaral JA, Ekins A, Richards SR, Knowles R (1998) Effect of selected monoterpenes on methane consumption,denitrification, and aerobic metabolism by bacteria in pure culture. Appl Environ Microbiol 64:520–525
Bender M, Conrad R (1994) Microbial consumption of methane, ammonium and carbon monoxide, and turnoverof nitrous oxide and nitric oxide in soils. Biogeochemistry 27:97–112
Bharati K, Mohanty SR, Singh DP et al (2000) Influence of incorporation or dual cropping of Azolla on methaneemission from a flooded alluvial soil planted to rice in eastern India. Agric Ecosyst Environ 79:73–83
Boetius A, Ravenschlag K, Schubert CJ, Rickert D (2000) A marine microbial consortium apparently mediatinganaerobic consumption of methane. Nature 407:623–626
Bond-Lamberty B, Thomson A (2010) Temperature-associated increases in the global soil respiration record.Nature 464:579–582. doi:10.1038/nature08930
Collins HP, Alva AK, Streubel JD et al (2011) Greenhouse gas emissions from an irrigated silt loam soil amendedwith anaerobically digested dairy manure. Soil Sci Soc Am J 75:2206–2216
Conrad R, Erkel C, Liesack W (2006) Rice cluster I methanogens, an important group of Archaea producinggreenhouse gas in soil. Curr Opin Biotechnol 17:262–267
Dunfield P (2007) The soil methane sink. In: Reay DS, Hewitt CN, Smith KA, Grace J (eds) Greenhouse gassinks. CAB International, Wallingford, pp 152–170
Graham DW, Korich DG, LeBlanc RP et al (1992) Applications of a colorimetric plate assay for soluble methanemonooxygenase activity. Appl Environ Microbiol 58:2231–2236
Hardy KR, King GM (2001) Enrichment of high-affinity CO oxidizers in Maine forest soil. Appl EnvironMicrobiol 67:3671–3676
Heimann M, Reichstein M (2008) Terrestrial ecosystem carbon dynamics and climate feedbacks. Nature 451:289–292
HuiFenM, LiPing H, NanJun L et al (2012) Volatile components of Jatropha curcas. J Northeast For Univ 40:30–33
Hutsch BW,Webster CP, Powlson DS (1994) Methane consumption in soil as affected by land use, soil pH and Nfertilization. Soil Biol Biochem 26:1613–1622
Kant P, Wu S (2011) The extraordinary collapse of Jatropha as a global biofuel. Environ Sci Technol-Columb 45:7114
Kightley D, Cooper M (1995) Capacity for methane consumption in landfill cover soils measured in laboratory-scale soil microcosms. Appl Environ Microbiol 61:592–601
Lindau CW, Patrick JWH, DeLaune RD (1993b) Factors affecting methane production in flooded rice soils. In:Harper LA, Mosier AR, Duxbury JM, Rolston DE, Peterson E, Baenziger P, Luxmoore RJ, Karl M, BartelsJM (eds) Agricultural ecosystem effects on trace gases and global climate change ASA Spec Pub 55 Am SocAgron Inc Madison Wis 157–165
Lu Y, Leuders T, Friedrich MW, Conrad R (2005) Detecting active methanogenic populations on rice roots usingstable isotope probing. Environ Microbiol 7:326–336
MacCracken MC (2013) Climate engineering: impact reducer or suffering inducer? In: Watts RG (ed)Engineering response to climate change. Planning a research and development agenda, 2nd edn. Taylorand Francis, Boca Raton, pp 413–474
Mitig Adapt Strateg Glob Change

Mohanty SR, Bharati K, Deepa N et al (2000) Influence of heavy metals on methane consumption in tropical ricesoils. Ecotoxicol Environ Saf 47:277–284
Mohanty SR, Bodelier PL, Floris V, Conrad R (2006) Differential effects of nitrogenous fertilizers on methane-consuming microbes in rice field and forest soils. Appl Environ Microbiol 72:1346–1354
Mohanty SR, Bodelier PLE, Conrad R (2007) Effect of temperature on composition of the methanotrophiccommunity in rice field and forest soil. FEMS Microbiol Ecol 62:24–31
Mohanty SR, Bharati K, Rao VR, Adhya TK (2009) Dynamics of changes in methanogenesis and associatedmicroflora in a flooded alluvial soil following repeated application of dicyandiamide, a nitrification inhibitor.Microbiol Res 164:71–80
Mohanty SR, Kollah B, Sharma VK et al (2013) Methane consumption and methane driven redox process duringsequential reduction of a flooded soil ecosystem. Ann Microbiol. doi:10.1007/s13213-013-0633-x
Montoya JD, Tejeda EP (1989) Potential multipurpose agroforestry crops identified for the Mexican Tropics. In:DalamWickens GE, Haq N, Day P (eds) New crops food and industry. Chapman and Hall, London, pp 166–173
Müller T, Fragstein V, Niemsdorff P (2006) Organic fertilizers derived from plant materials. Part II: turnover infield trials. J Plant Nutr Soil Sci 169:265–273
Oskoueian E, Abdullah N, Ahmad S et al (2011) Bioactive compounds and biological activities of Jatrophacurcas L. kernel meal extract. Int J Mol Sci 12:5955–5970
Rand MC, Greenberg AE, Taras MJ (1976) Standard methods for the examination of water and wastewater. Am.Public Health Assoc, Washington
Reeburg WS (1993) The role of methanotrophy in the global methane budget. In: Murrell JC, Kelly JP (eds)Microbial growth in C-1 compound. Andover, Intercept Ltd, pp 1–14
Reeburgh WS (2003) Global methane biogeochemistry. Treatise Geochem 4:65–89Roslev P, King GM (1995) Aerobic and anaerobic starvation metabolism in methanotrophic bacteria. Appl
Environ Microbiol 61:1563–1570Ruíz-Valdiviezo VM, Mendoza-Urbina LD, Luna-Guido M et al (2013) Emission of CO2, CH4 and N2O and
dynamics of mineral N in soils amended with castor bean (Ricinus communis L.) and piñón (Jatropha curcasL.) seed cake. Plant Soil Environ 59:51–56
Sharma AK, Gangwar M, Tilak R et al (2012) Comparative in vitro antimicrobial and phytochemical evaluationof methanolic extract of root, stem and leaf of Jatropha curcas. Pharmacogn J 4:34–40
Sherchan DP, Thapa YB, Khadka RJ, Tiwari TP (1989) Effect of green manure on rice production. PAC occas.pap. Pakhribas Agricultural Center, DhanKuta
Srikitjakarn L, Sirimalaisuwan A, Khattiya R et al (2002) Seroprevalence of melioidosis in dairy cattle in ChiangMai Province, northern Thailand. Southeast Asian J Trop Med Public Health 33:739–741
Sun Y, Yin J, Cao H et al (2011) Elevated CO2 influences nematode-induced defense responses of tomatogenotypes differing in the JA pathway. PloS One 6:e19751
Wang Z, Calderon MM, Lu Y (2011) Lifecycle assessment of the economic, environmental and energyperformance of Jatropha curcas L. biodiesel in China. Biomass Bioenergy 35:2893–2902
Whittenbury R, Phillips KC,Wilkinson JF (1970) Enrichment, isolation and some properties of methane-utilizingbacteria. J Gen Microbiol 61:205–218
Yang Y, Liu J, Li X et al (2013) New terpenoids from the roots of Jatropha curcas. Chin Sci Bull 58:1–5Yao H, Conrad R (2001) Thermodynamics of propionate degradation in anoxic paddy soil from different rice-
growing regions. Soil Biol Biochem 33:359–364. doi:10.1016/S0038-0717(00)00148-6Yiqi L, Zhou X (2010) Soil respiration and the environment. Academic, San Diego
Mitig Adapt Strateg Glob Change