Embed Size (px)
Citation preview
INFLATION CONVERGENCE ACROSS COUNTRIES
Markus Hyvonen
Research Discussion Paper 2004-04
June 2004
Economic Research Department Reserve Bank of Australia
I am grateful to Glenn Stevens for conversations that initiated work on this paper and to Stephen Cecchetti, Ellis Connolly, Guy Debelle, Alex Heath, Jonathan Kearns, Marion Kohler and Anthony Richards for invaluable comments and suggestions. Any errors are my own. The views expressed in this paper are those of the author and should not be attributed to the Reserve Bank of Australia.
Abstract
Ball and Sheridan (forthcoming) show that OECD countries with a history of high inflation before the 1990s have subsequently experienced a larger degree of disinflation than countries with a history of low inflation. They label this process ‘regression to the mean’, and argue that it explains why those OECD countries which adopted inflation targeting experienced larger falls in inflation compared to other OECD countries.
This paper explores further this phenomenon of convergence of inflation rates across countries. An extension of the analysis used by Ball and Sheridan finds that convergence in inflation rates also occurs in a much larger sample of countries over the same time period that they study. However, tests using data from the 1960s to the 1980s show that inflation convergence across OECD countries does not occur consistently over time. In contrast, when this analysis is repeated with data for US metropolitan regions, convergence occurs consistently since the early 1960s. Interpreted in the context of historical developments in monetary policy, the evidence suggests that rather than just being a mechanical occurrence, the convergence in national inflation rates experienced in the 1990s was brought about by monetary policy becoming more similar across countries, with authorities becoming more focused on achieving low inflation, especially in those countries which had been less successful in reducing inflation in the 1980s. In other words, the adoption of inflation targeting at least partly contributed to inflation convergence in the 1990s.
JEL Classification Numbers: E31, E52 Keywords: inflation, monetary policy
i
Table of Contents
1. Introduction 1
2. Inflation Convergence 2
2.1 Ball and Sheridan 2
2.2 An Investigation of the Reasons for Inflation Convergence 6
3. How Pervasive is Inflation Convergence? 7
3.1 Broader Sample of Countries 8
3.2 Other Time Periods 10
4. Policy as an Explanation for Inflation Convergence 12
5. Inflation Convergence in US Metropolitan Regions 16
6. Conclusion 19
Appendix A: Sensitivity Analysis 21
References 22
ii
INFLATION CONVERGENCE ACROSS COUNTRIES
Markus Hyvonen
1. Introduction
For most industrialised countries, including Australia, the period since the early 1990s has been a period of low and stable inflation. While a number of factors, such as economic reforms and globalisation, enabled low inflation to persist over this period, there were also some important developments in monetary policy: a number of countries adopted formal inflation targets as the benchmark for policy, and the Economic and Monetary Union (EMU) convergence process provided similar policies in continental Europe.1 A number of authors (including King 1997; Brooks 1998; Bernanke et al 1999; Corbo, Landerretche and Schmidt-Hebbel 2002) have observed that those countries that adopted explicit inflation targets experienced substantial falls in their average rate of inflation. They argue that inflation targeting was (at least partly) responsible for the large degree of disinflation. In contrast, Ball and Sheridan (forthcoming) provide a different interpretation of the 1990s disinflation by arguing that inflation-targeting countries experienced a large fall in inflation because they had a higher rate of initial inflation relative to other industrialised countries. They label this phenomenon ‘regression to the mean’, or as referred to here, inflation convergence.
This paper explores the inflation convergence concept put forward by Ball and Sheridan in more detail. It suggests that rather than being a merely statistical phenomenon as implied by Ball and Sheridan, the observed convergence in inflation rates is perhaps better thought of as having been brought about by the decisions of policy-makers.
Section 2 briefly reviews Ball and Sheridan’s analysis, and then explores the theoretical case for the inflation convergence result. Section 3 examines the robustness of the convergence result by replicating Ball and Sheridan’s
1 Rogoff (2003) provides a general discussion of the factors behind the global fall in inflation
over the last decade.
2
methodology out-of-sample. An explanation linking inflation convergence with monetary policy is presented through a historical analysis of policy regimes in Section 4. Section 5 then looks for evidence to support this alternative explanation by examining inflation convergence within US metropolitan regions, followed by the conclusions in Section 6.
2. Inflation Convergence
Ball and Sheridan examine various aspects of the economic performance of OECD countries, including output growth, inflation variability and inflation persistence. They also investigate changes in several bivariate relationships. This paper, however, only focuses on Ball and Sheridan’s inflation convergence results, which are reviewed in this section.
2.1 Ball and Sheridan
Ball and Sheridan (forthcoming) introduce their inflation convergence argument in a paper evaluating the comparative performance of countries who have adopted inflation-targeting regimes. They initially produce results suggesting benefits from inflation targeting, namely that the seven OECD countries that adopted inflation targets experienced larger falls in inflation than the thirteen OECD countries that did not adopt the regime.2 However, Ball and Sheridan argue that these results merely reflect the fact that inflation targeters had higher initial inflation, and ‘there is regression to the mean’. In other words, countries with high inflation will experience a larger degree of disinflation just by returning to some underlying cross-country mean rate of inflation. Ball and Sheridan use the following simple
2 The inflation targeters are Australia, Canada, Finland, New Zealand, Sweden, Spain and the
United Kingdom. The other 13 OECD countries are Austria, Belgium, Denmark, France, Germany, Ireland, Italy, Japan, the Netherlands, Norway, Portugal, Switzerland and the United States. Ball and Sheridan wish to examine ‘major developed, moderate inflation economies’, and hence their sample excludes the emerging-market economies that joined the OECD after 1990 (Czech Republic, Hungary, Mexico, Poland, Slovak Republic and South Korea), countries that experienced annual inflation over 20 per cent since 1984 (Greece, Iceland and Turkey) and countries that lacked an independent currency before the introduction of the euro (Luxembourg).

3
OLS regression to illustrate the dominance of inflation convergence (regression (2) in Ball and Sheridan):3
iipre
ipre
ipost
i ITDummy εβπβαππ +++=− 210 (1)
where postiπ is the average inflation rate for country i after the adoption of inflation
targeting, preiπ is the average inflation rate for country i before the adoption of
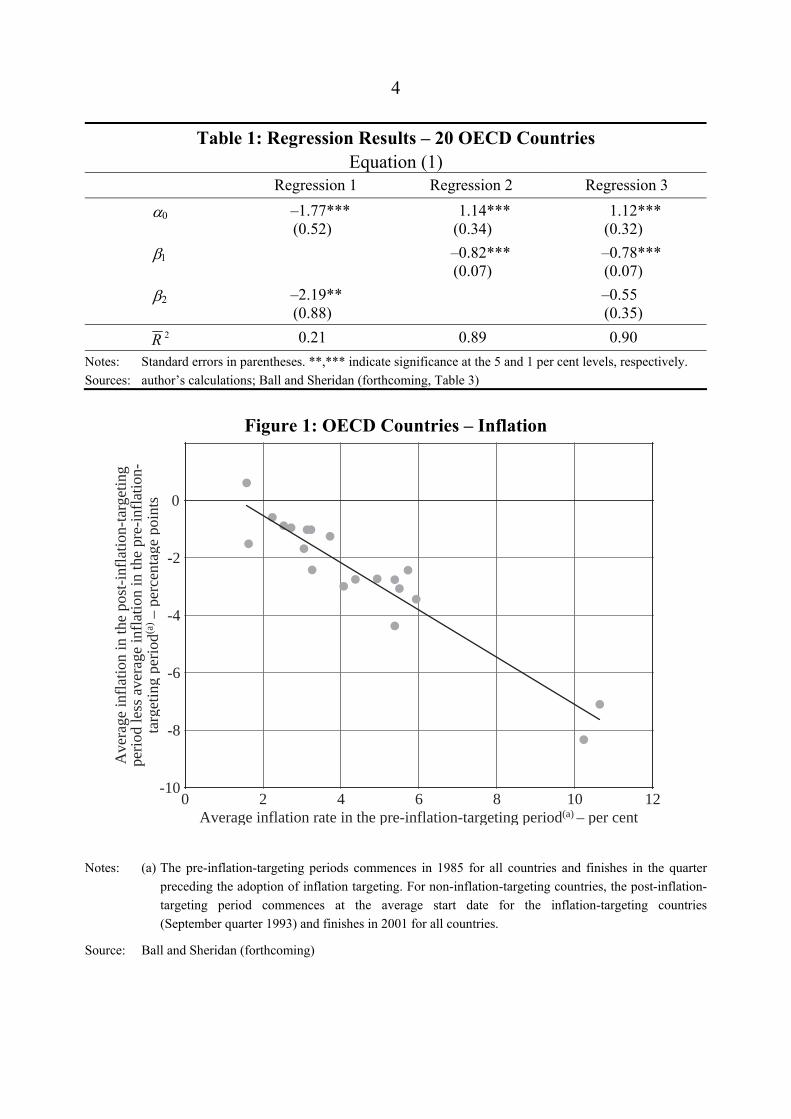
inflation targeting, and ITDummyi is a dummy variable equal to one for the inflation-targeting countries.4 The results produced by Ball and Sheridan are replicated in Table 1.5 These show that when only the ITDummyi variable is considered, as in Regression 1, there is evidence to suggest that inflation-targeting countries had higher disinflation, with β2 being negative and significant. Implicitly, this is the specification considered in the earlier empirical evidence on inflation targeting. However, drawing on the insight from Ball and Sheridan, if one instead uses the initial inflation rate in the regression, as in Regression 2, the coefficient on initial inflation, β1 is negative and highly significant, and explanatory power of the regression is much higher than that of Regression 1. When both variables are included in Regression 3, the results suggest that initial inflation is more important in explaining the change in inflation over the 1990s, with β1 significantly negative, while the β2 coefficient is still negative, but no longer significant. These results suggest that higher inflation in the earlier period is associated with a larger fall in inflation between the two periods, and that for a given level of initial inflation, there is no difference in disinflation between inflation targeters and non-inflation targeters. Together with similar findings on inflation volatility, these results cause Ball and Sheridan to conclude that ‘inflation targeting has no beneficial effects’.
3 Ball and Sheridan’s specification is rearranged so that the coefficient on the initial inflation
variable is β1. This is done to avoid any confusion in the case of results from Equation (2). Also, subscript i is added to the specification for clarity.
4 Countries that did not adopt inflation targeting are assumed to start the post-inflation-targeting period at the average adoption date of inflation targets for the seven targeters. Ball and Sheridan calculate this is as the September quarter 1993.
5 Table 1 presents the results of Equation (1) for three different specifications: the first with the dummy variable omitted, the second with the initial inflation variable omitted and the third being the full specification, Regressions 1, 2 and 3, respectively. The results of Regression 2 were calculated by the author.
4
Table 1: Regression Results – 20 OECD Countries Equation (1)
Regression 1 Regression 2 Regression 3
α0 –1.77*** (0.52)
1.14*** (0.34)
1.12*** (0.32)
β1 –0.82*** (0.07)
–0.78*** (0.07)
β2 –2.19** (0.88)
–0.55 (0.35)
2R 0.21 0.89 0.90 Notes: Standard errors in parentheses. **,*** indicate significance at the 5 and 1 per cent levels, respectively. Sources: author’s calculations; Ball and Sheridan (forthcoming, Table 3)
Figure 1: OECD Countries – Inflation
••
••
••
••••
••
•••
••••
•
-10
-8
-6
-4
-2
0
0 2 4 6 8 10 12
Ave
rage
infl
atio
n in
the
post
-inf
latio
n-ta
rget
ing
peri
od le
ss a
vera
ge in
flat
ion
in th
e pr
e-in
flat
ion-
targ
etin
g pe
riod
(a) –
per
cent
age
poin
ts
Average inflation rate in the pre-inflation-targeting period(a) – per cent
Notes: (a) The pre-inflation-targeting periods commences in 1985 for all countries and finishes in the quarter preceding the adoption of inflation targeting. For non-inflation-targeting countries, the post-inflation-targeting period commences at the average start date for the inflation-targeting countries (September quarter 1993) and finishes in 2001 for all countries.
Source: Ball and Sheridan (forthcoming)
5
This inflation convergence phenomenon is illustrated in Figure 1, which plots average inflation in the post-inflation-targeting period less the average inflation in the pre-inflation-targeting period on the y-axis against average inflation in the pre-inflation-targeting period on the x-axis. The strong negative relationship is readily apparent.
The finding that the inflation-targeting dummy is significant by itself, but no longer significant once the initial inflation variable is included in Equation (1) is important. It suggests that the initial inflation variable and the inflation-targeting dummy are positively correlated, which is consistent with Ball and Sheridan’s finding that the inflation-targeting countries had higher initial inflation. This correlation shows up in a significantly positive coefficient from regressing the inflation-targeting dummy on initial inflation (not shown).6 The positive correlation between the two variables is problematic, as it raises the possibility of endogeneity in the choice to adopt inflation targeting.
Indeed, in his comments on the Ball and Sheridan paper, Gertler (forthcoming) suggests that the inflation convergence argument is effectively an attempt to account for the potential endogeneity of inflation targeting. In particular, he argues that it is possible that the history of high inflation (as shown in Ball and Sheridan) induced certain countries to adopt inflation targeting. Thus there are two possible explanations for the favourable performance of inflation-targeting countries: either inflation targeting caused better performance, or the better performance merely reflects the fact that countries with a history of high inflation chose to adopt inflation targeting and that the inflation rates of these countries converged independently of the adoption of inflation targeting. Interpreted in this manner, it does seem that Ball and Sheridan have raised a valid criticism of the earlier empirical evidence on the impact of inflation targeting. However, Gertler goes on to argue that Ball and Sheridan’s convergence framework is not ‘sharp enough’ to control for the potential endogeneity, disagreeing with their conclusion that
6 Using more sophisticated probit and logit models, Mishkin and Schmidt-Hebbel (2002) and
Hu (2003) also find some evidence that high inflation increases the likelihood of adopting inflation targeting.
6
inflation targeting is irrelevant.7 He points out that Ball and Sheridan’s results are also consistent with an alternative interpretation, whereby inflation targeting indeed facilitated the disinflation.
2.2 An Investigation of the Reasons for Inflation Convergence
Ball and Sheridan highlight the inadequate treatment of potential endogeneity as a flaw in the existing literature on inflation targeting. However, the inflation convergence framework they use to control for ‘endogeneity’ would appear flawed in that ‘regression to the mean’ has no solid theoretical foundation. While there is a clear theoretical justification for the phenomenon of price level convergence based on the law of one price, it has been shown that price level convergence across countries can actually lead in the short term to some dispersion in inflation rates (see, for example, Rogers 2002).
In their paper, Ball and Sheridan do not discuss a theoretical model underlying their inflation convergence argument. Their explanation for why ‘regression to the mean’ occurs is captured by the following quote:
Poor performers in the pre-targeting period tend to improve more than good performers simply because initial performance depends partly on transitory factors.
This explanation is rather specific in that it assumes these ‘transitory factors’ as the cause for higher inflation in the preceding period, implying that there is little inertia in the inflation outcomes of countries.8 Moreover, the explanation generally ignores the role played by monetary policy. In particular, it is widely accepted that regardless of the framework, monetary policy is one of the most important
7 An alternative and perhaps more obvious way to control for the potential endogeneity in the
adoption of inflation targeting would be through the use of instrumental variable (IV) techniques. However, the use of an endogeneity correction in analysing the performance of inflation-targeting countries is not really feasible given the small sample available, and hence that approach is not attempted here.
8 Indeed, the analysis in Section 4 shows that the inflation-targeting countries had higher inflation than other OECD countries ever since the early 1970s oil-price shock, which suggests that these ‘transitory factors’ lasted for over 15 years!
7
determinants of inflation in the long run.9 It is highly likely that poor inflation performance is at least partially caused by poor policy. So while ‘transitory factors’ are relevant, arguably it is the response of monetary policy to these factors which is more likely to cause the inflation performance of countries to vary. If indeed poor policy leads to poor inflation performance, it would seem likely that an improvement in the way policy is conducted would lead to better inflation outcomes. In other words, policy could indeed be the reason for the observed mean-reversion result.
In the absence of a convincing theoretical case for inflation convergence, Ball and Sheridan’s explanation appears to rely on convergence being a statistical or mechanical property of cross-country performance. If so, to attribute the observed fall in inflation in the inflation-targeting countries to the convergence phenomenon, one would ideally be able to show that the phenomenon is a stable property in cross-country inflation data over time. If it is not, ‘regression to the mean’ seems more like an ex-post observation about inflation in the 1990s, rather than an explanation for the better performance of inflation-targeting countries.
This paper evaluates two explanations for inflation convergence. The first is that inflation convergence is a mechanical property of cross-country inflation performance, as implied by Ball and Sheridan. The alternative explanation considered is that inflation convergence is brought about by monetary policy, more specifically, convergence in the objectives of policy.
3. How Pervasive is Inflation Convergence?
In this section, the robustness of inflation convergence is explored in two dimensions – the sample of countries and the time period. This is done in order to examine whether or not inflation convergence is a mechanical property of the cross-country inflation process. The approach used is to extend Ball and Sheridan’s simple cross-sectional methodology, which was described in Section 2.
9 As Friedman (1970, p 24) famously said, ‘inflation is always and everywhere a monetary
phenomenon’.

8
3.1 Broader Sample of Countries
To first test whether Ball and Sheridan’s mean-reversion phenomenon is unique to OECD countries, their equation is estimated using inflation data for a much larger sample of IMF member countries. The use of this dataset gives the broadest possible sample of countries, effectively representing a global sample.10
Ball and Sheridan’s model, Equation (1), is slightly modified by dropping the inflation-targeting dummy, as the interest here is solely on inflation convergence.11 The resulting model is:
iititit επβαππ ++=− −− 1101 (2)
where itπ is the average inflation rate for country i in period t. The periods t-1 and t here are the equivalents of pre- and post-inflation-targeting periods, defined as 1985–1992 and 1993–2002, respectively. Also, here itπ and 1−itπ are the natural
logs of )100
1( itπ+ in each of the two periods. The use of logs is to prevent the results
from being dominated by a small number of countries with very high inflation,
while the )100
1( itπ+ transformation allows zero and negative inflation rates.12
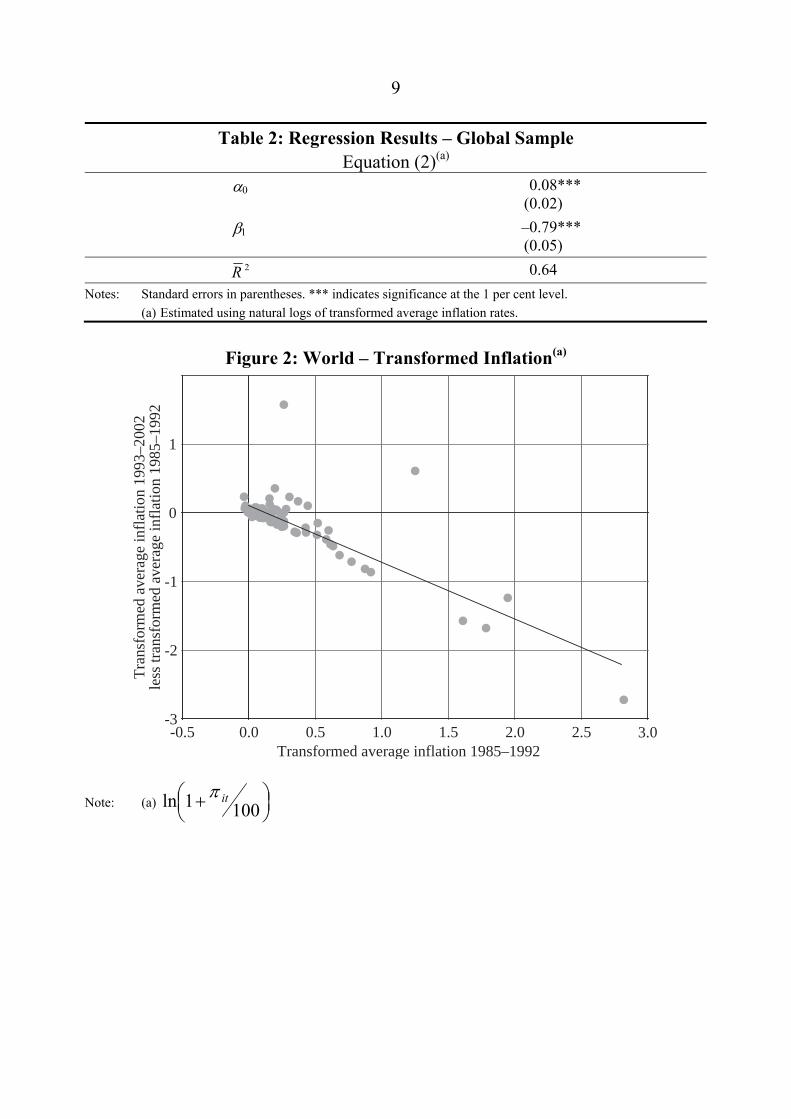
Table 2 presents the results and Figure 2 illustrates these in a scatter plot.
10 The data are sourced from the IMF’s World Economic Outlook (WEO) database, April 2003,
available at <http://www.imf.org/external/pubs/ft/weo/2003/01/data/index.htm>. Countries that do not have data available for each year between 1985 and 2002 are excluded, as are those with two or more consecutive zero observations. These criteria yield a sample of 149 countries out of 177 contained in the WEO database.
11 While there are a number of inflation-targeting countries (12 as identified in IMF (2003)) outside Ball and Sheridan’s sample of 20 OECD countries, most of these adopted inflation targeting much later than the 7 countries identified as inflation targeters in Ball and Sheridan’s sample. This argues against including an inflation-targeting dummy variable. In any case, including an inflation-targeting dummy which identifies all inflation-targeting countries (as identified in IMF (2003)) does not change the results in any material way. The coefficient on the dummy variable is slightly negative but insignificant, and the 1β coefficient is basically unchanged.
12 The mean reversion result is robust to the use of other transformations and methods of removing outliers. These results are available from the author upon request.
9
Table 2: Regression Results – Global Sample Equation (2)(a)
α0 0.08*** (0.02)
β1 –0.79*** (0.05)
2R 0.64 Notes: Standard errors in parentheses. *** indicates significance at the 1 per cent level. (a) Estimated using natural logs of transformed average inflation rates.
Figure 2: World – Transformed Inflation(a)
Transformed average inflation 1985–1992
Tra
nsfo
rmed
ave
rage
infl
atio
n 19
93–2
002
less
tran
sfor
med
ave
rage
infl
atio
n 19
85–1
992
•
•
•
•
••••••••••
•
•
•
•••••••• ••• •••
• •••••• •• •••••••• •• ••• •• ••
••••••••
•• •••••• •
•
••••••••••••
• •••••••
•
• •••••• •
•
••
•• ••• •••••
•••••••• ••
••• •• •••••• •
•
••••
• •
•
••
-3
-2
-1
0
1
-0.5 0.0 0.5 1.0 1.5 2.0 2.5 3.0
Note: (a)
+ 1001 itln π
10
Given the use of logs, these results are not directly comparable with those presented in Table 1 and Figure 1. Regression of Equation (2) with log transformed data for Ball and Sheridan’s smaller sample of countries produces a regression coefficient β1 of –0.91, which is little different to that for the global sample shown in Table 2. The coefficient is still highly significant and the explanatory power of the regression is quite good. The results suggest that the inflation convergence phenomenon in the 1990s was indeed a global phenomenon and not unique to the OECD countries.
3.2 Other Time Periods
Ball and Sheridan’s methodology is now extended to earlier time periods to assess whether or not the inflation convergence phenomenon was unique to the 1990s.
The same sample of 20 OECD countries used by Ball and Sheridan is used here. CPI data are available for all of the 20 countries from 1960, enabling the calculation of inflation rates from 1961.13 The period 1961–1992 is then divided into three sub-periods (1961–1972, 1973–1982 and 1983–1992) which roughly correspond with calendar decades.14 Apart from dividing the data into decades, these sub-periods are motivated by the timing of the major inflationary event that occurred during the period, namely the oil-price shock of the early 1970s. Under this classification, the first sub-period is the period before the oil-price shock, the second sub-period contains the 10 years after the initial shock, and the final sub-period is also 10 years in duration.15 These three sub-periods allow two additional regressions of Equation (2); one which compares the periods 1961–1972 and
13 Data are sourced from Thomson Financial. The all items consumer price index (CPI) is used
for all countries except Italy, in which case the CPI excluding tobacco is used before 1996. 14 The last sub-period finishes in June quarter 1993 for non-inflation-targeting countries, and at
the introduction of inflation targets (as listed in Table 1 in Ball and Sheridan (forthcoming)) for inflation-targeting countries.
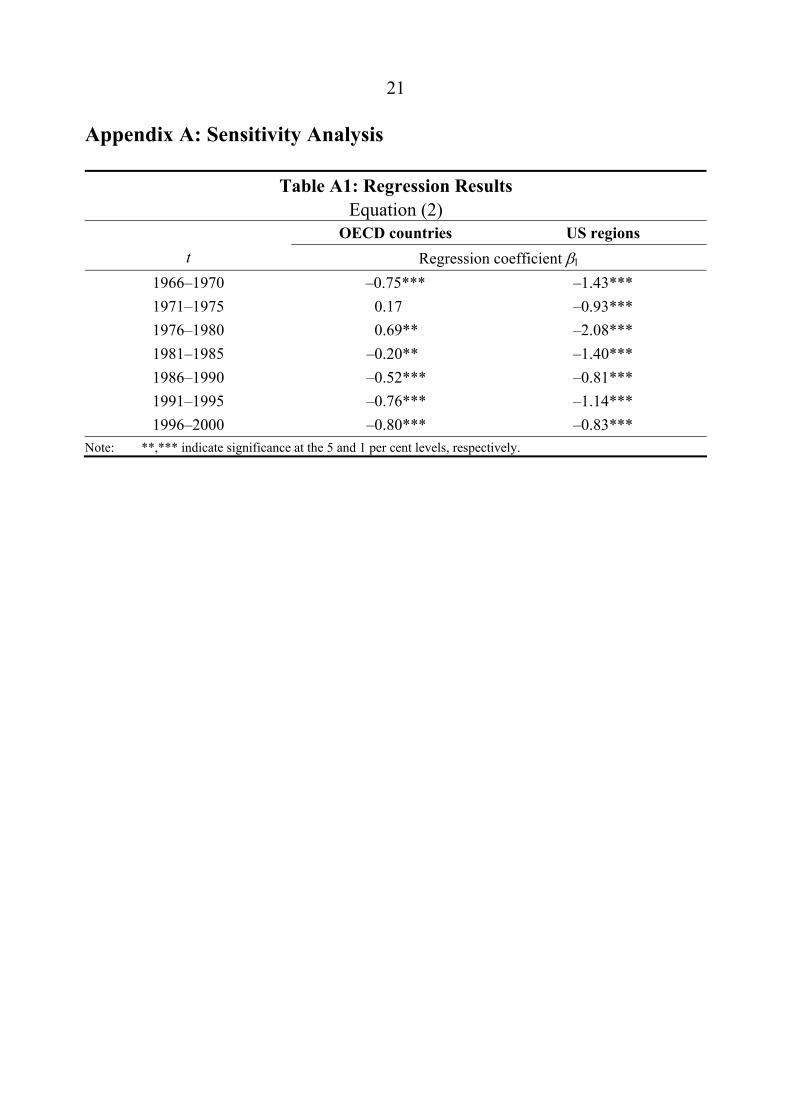
15 While this classification is somewhat arbitrary, sensitivity analysis suggests that the results are robust to other schemes, for example strict calendar decades. Table A1 in Appendix A presents the results of Regression 2 on the same dataset using five-year periods. In addition to providing more evidence that inflation convergence is not a stable property over time, there are two other noteworthy results in Table A1; firstly, there is evidence of inflation convergence having occurred in the late 1960s (a period during which the Bretton Woods regime was in place), and secondly, there is one regression comparing the periods 1976–1980 and 1971–1975 where the data show statistically significant inflation divergence.
11
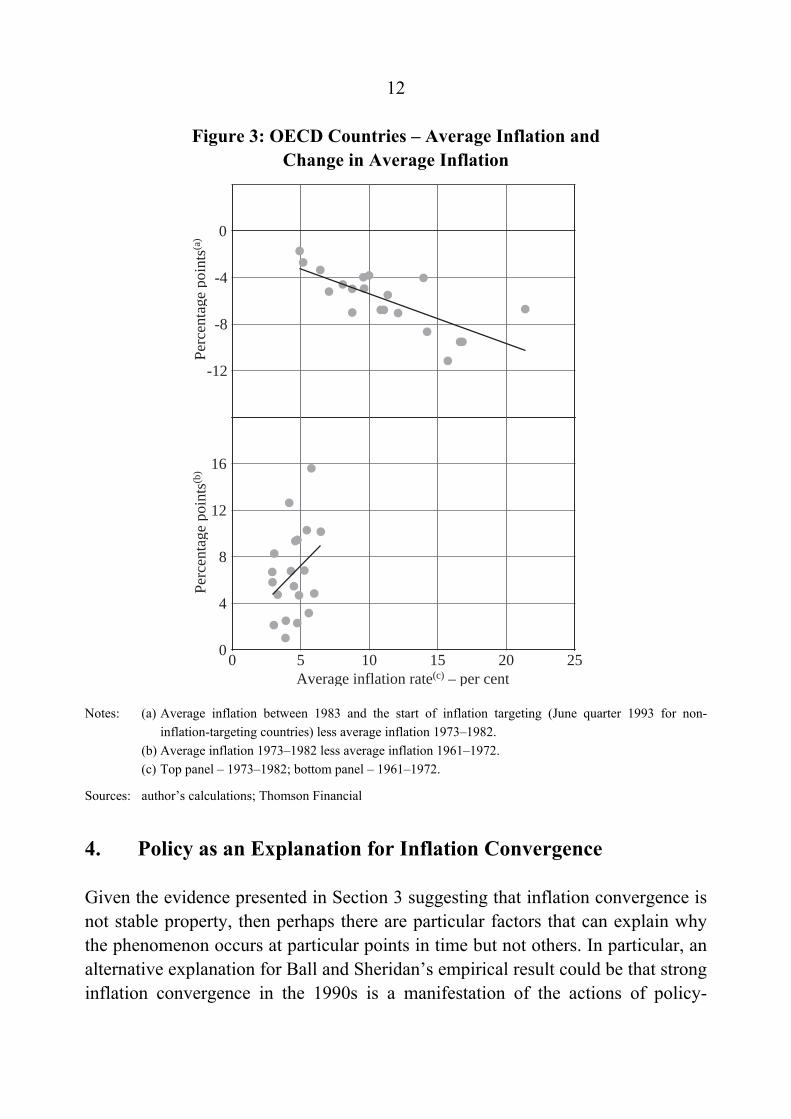
1973–1982, and the other which compares 1973–1982 and 1983–1993. Table 3 presents the results and Figure 3 illustrates these using a scatter plot.
Table 3: Regression Results – 20 OECD Countries Equation (2)
1983–1993:Q3(a) 1973–1982
α0 –1.18 (1.10)
1.32 (3.59)
β1 –0.42*** (0.09)
1.19 (0.78)
2R 0.51 0.06 Notes: Standard errors in parentheses. *** indicates significance at the 1 per cent level. (a) Adoption of inflation targets for inflation-targeting countries.
The top panel of Figure 3 shows that inflation convergence appears to have taken place between the 1970s and the 1980s. However, the evidence is noticeably weaker than for the period with the switch to inflation targeting. While negative and statistically significant, the β1 coefficient is only around –0.4, roughly half of the one calculated by Ball and Sheridan for the inflation-targeting episode. Also, the fit is not quite as good, with a 2R statistic of around 0.5. In contrast, the bottom panel of Figure 3 shows that there is no evidence of convergence having occurred between the 1960s and the 1970s. The regression coefficient β1 is actually positive, which suggests that rather than converging, inflation rates across countries actually dispersed over this period. In other words, countries with higher inflation rates in the 1960s experienced a larger increase in average inflation in the 1970s, suggesting that responses to the early 1970s oil-price shock varied quite a bit across the OECD. However, the β1 coefficient is statistically insignificant, implying this dispersion result is weak at best.
This evidence from earlier periods shows that inflation convergence is not a stable property of cross-country inflation performance. However, the strength of the convergence phenomenon in 1990s, the inflation-targeting episode, relative to earlier periods is particularly noteworthy. Given that Ball and Sheridan apparently treat inflation convergence as a statistical phenomenon, the evidence that it does not occur consistently in earlier periods casts doubt over their conclusions regarding the relative performance of inflation-targeting countries. It appears that something other than automatic convergence was at work in the 1990s.
12
Figure 3: OECD Countries – Average Inflation and Change in Average Inflation
Average inflation rate(c) – per cent
Perc
enta
ge p
oint
s(b)
Perc
enta
ge p
oint
s(a)
• • •••
•
••
• ••
•
••
•
• ••
•
•
-12
-8
-4
0
••• ••
•
•
•••
•
•
•
•
•
••
•
••
0
4
8
12
16
0 5 10 15 20 25
Notes: (a) Average inflation between 1983 and the start of inflation targeting (June quarter 1993 for non-inflation-targeting countries) less average inflation 1973–1982.
(b) Average inflation 1973–1982 less average inflation 1961–1972. (c) Top panel – 1973–1982; bottom panel – 1961–1972.
Sources: author’s calculations; Thomson Financial
4. Policy as an Explanation for Inflation Convergence
Given the evidence presented in Section 3 suggesting that inflation convergence is not stable property, then perhaps there are particular factors that can explain why the phenomenon occurs at particular points in time but not others. In particular, an alternative explanation for Ball and Sheridan’s empirical result could be that strong inflation convergence in the 1990s is a manifestation of the actions of policy-
13
makers. More specifically, it could be that inflation convergence was brought about by the goals of monetary policy becoming more similar across countries. This alternative explanation is discussed in more detail below in the context of industrialised countries.
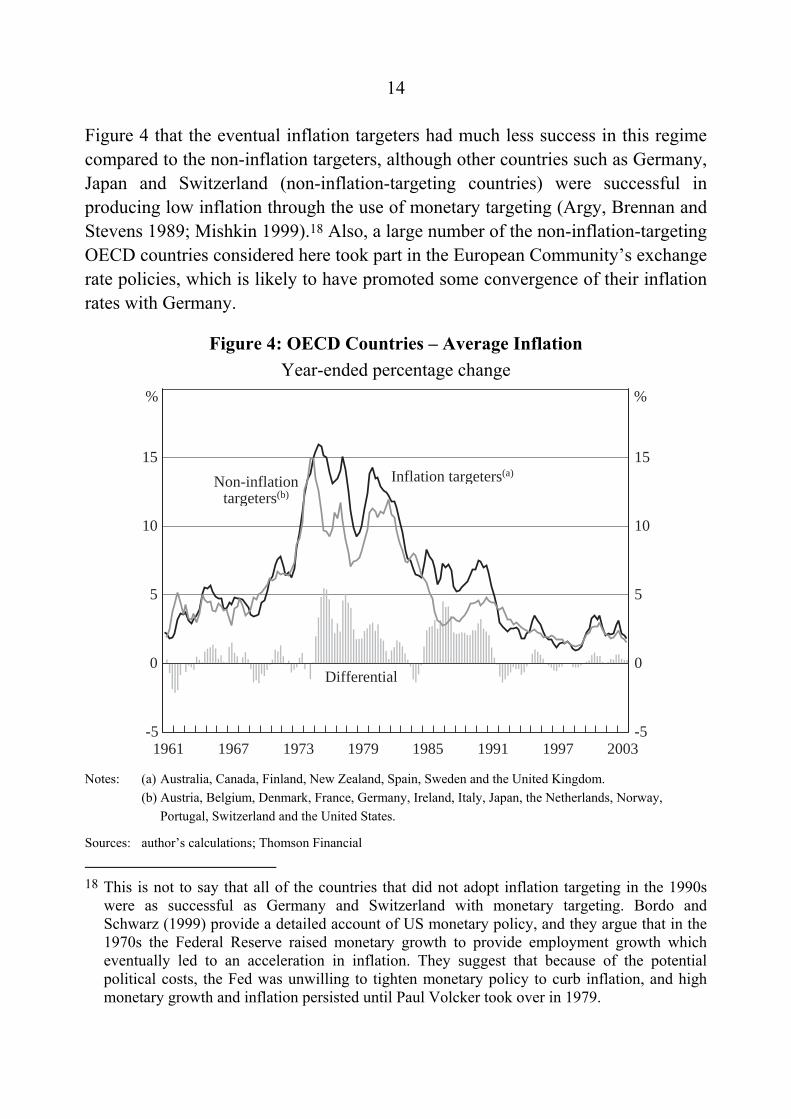
Figure 4 plots the simple-average inflation rates for the group of countries that eventually adopted inflation targeting and 13 OECD countries that did not adopt the regime, as defined by Ball and Sheridan, as well as the difference between these two averages. The data show that average inflation rates for the two groups tracked each other quite closely through the 1960s, a decade of relatively low and stable inflation. The monetary policy regime in place at that time was the Bretton Woods system of fixed exchange rates, which came to an end in 1971. The first oil-price shock followed shortly afterwards, and the inflation performance of these two groups diverged significantly with the average inflation rate for inflation targeters peaking at over 5 percentage points above that of the non-inflation-targeting group soon after the initial shock. The reason for this divergence is likely to have been a combination of differences in structural factors and the reaction of policy to the oil-price shock between the two groups. What followed the collapse of the Bretton Woods system was a move to generalised floating exchange rates, and a number of OECD countries (including Australia, Canada and the United Kingdom) adopted a form of monetary targeting.16,17 It is obvious from 16 In contrast, the economic policies of the European Community (EC) were aimed at
maintaining stability in exchange rates. In 1972, the so called ‘snake’ regime was established, whereby bilateral movements of participating exchange rates were constrained to a narrow band. In addition to EC member countries at the time, Denmark, Ireland, Norway, Sweden and the United Kingdom also joined the regime. However, a number of countries (including Sweden and the United Kingdom) exited the ‘snake’ in the following years to leave only five participating countries by 1977. The Exchange Rate Mechanism (ERM) of the European Monetary System (EMS), which superseded the ‘snake’, began operating in 1979 with eight original participants (Belgium, Denmark, France, Germany, Ireland, Italy, Luxembourg and the Netherlands), with Spain, the United Kingdom and Portugal joining about a decade later. Despite numerous realignments (of countries’ central rates) during the first eight years of the regime, the ERM provided relative stability to participants until the exit of the Italian lira and the British pound in 1992 (Bladen-Hovell 1994; Kenen 1995; Eichengreen 1997).
17 Out of the 4 other inflation-targeting countries, Spain also adopted a monetary-targeting regime in 1978 which was in place until it entered the ERM. Sweden and Finland maintained exchange rate anchors right through to their adoption of inflation targeting, while New Zealand had both fixed and crawling-peg exchange rate regimes in place until the float of the New Zealand dollar in 1985, after which there was no nominal anchor until the adoption of inflation targeting (Aurikko 1986; Quigley 1992; Kenen 1995; Bernanke et al 1999).
14
Figure 4 that the eventual inflation targeters had much less success in this regime compared to the non-inflation targeters, although other countries such as Germany, Japan and Switzerland (non-inflation-targeting countries) were successful in producing low inflation through the use of monetary targeting (Argy, Brennan and Stevens 1989; Mishkin 1999).18 Also, a large number of the non-inflation-targeting OECD countries considered here took part in the European Community’s exchange rate policies, which is likely to have promoted some convergence of their inflation rates with Germany.
Figure 4: OECD Countries – Average Inflation Year-ended percentage change
-5
0
5
10
15
-5
0
5
10
15Inflation targeters(a)
2003
Non-inflationtargeters(b)
Differential
1997199119851979197319671961
%%
Notes: (a) Australia, Canada, Finland, New Zealand, Spain, Sweden and the United Kingdom. (b) Austria, Belgium, Denmark, France, Germany, Ireland, Italy, Japan, the Netherlands, Norway,
Portugal, Switzerland and the United States.
Sources: author’s calculations; Thomson Financial
18 This is not to say that all of the countries that did not adopt inflation targeting in the 1990s
were as successful as Germany and Switzerland with monetary targeting. Bordo and Schwarz (1999) provide a detailed account of US monetary policy, and they argue that in the 1970s the Federal Reserve raised monetary growth to provide employment growth which eventually led to an acceleration in inflation. They suggest that because of the potential political costs, the Fed was unwilling to tighten monetary policy to curb inflation, and high monetary growth and inflation persisted until Paul Volcker took over in 1979.
15
While the eventual inflation-targeting countries had some success at closing the gap during the subsequent decade, with the targeters briefly having lower inflation around 1984, this coincided with the OECD-wide recession that occurred in the early 1980s. After the mid 1980s, the unfavourable gap opened up again as output growth recovered, suggesting that the eventual inflation-targeters’ policies were not as effective as those of the other group in controlling inflation. By the mid 1980s, it had become clear to policy-makers that the relationship between monetary aggregates, inflation and nominal income was not providing an accurate enough guide for conducting policy, which led to Australia, Canada and the United Kingdom to abandon this regime (Mishkin 1999). What followed for these countries was a period of highly discretionary policy-making, in which the stance of policy was assessed on the basis of a range of indicators. During this time, Germany maintained its monetary-targeting regime with a clear commitment to maintaining price stability, while in the US, the Fed acted to lock in the low inflation brought about in part by early 1980s recession.19 Judging by the evidence in Figure 4, the inflation targeters’ policies were not very effective in lowering inflation, as evidenced by the eventual inflation targeters having higher average inflation rates compared to the non-inflation-targeting group.
A number of the eventual inflation targeters had either joined or pegged their currencies against the ERM by 1990, which is likely to have been responsible for some of the closing in the gap with the non-targeting group. However, the inflation-targeting countries only managed to close the gap by the end of 1991, associated with recessions that, measured by output gaps, were on average more severe than those experienced in countries that did not adopt inflation targeting. By the end of these recessions, most of the seven that became inflation targeters had adopted the regime. In the following years, the gap appears to have remained closed (the average inflation rates in the two groups are identical after 1991). The evidence here suggests that in terms of inflation control, the inflation-targeting group of countries succeeded in the 1990s (when inflation targeting was introduced) where they had failed in the 1980s. In the 1990s, the policy objectives of both groups, in terms of intolerance of inflation, appeared to become more similar, which is likely to have been at least partially responsible for the similarity
19 Bernanke and Mishkin (1997) argue that German and Swiss monetary policy was very similar
in practise to present-day inflation targeting, rather than orthodox monetary targeting. Hence, they suggest their policies should be thought of as ‘hybrid’ inflation targeting.

16
in their inflation performance.20 In other words, inflation convergence is to some extent caused by convergence in the goals of monetary policy.
5. Inflation Convergence in US Metropolitan Regions
In order to examine the role played by monetary policy in inflation convergence, it is necessary to somehow control for the impact of policy on the inflation process. One way to do this is to examine inflation convergence in a group of countries that share the same monetary policy and compare the results with countries that have sovereign monetary policy. Evidence of consistently strong inflation convergence across countries sharing the same monetary policy would suggest that similarity of policy has a role in bringing about inflation convergence. An obvious example of countries sharing the same monetary policy would be the 12 countries participating in the third stage of the EMU. However, the third stage of the EMU only commenced in 1999, which provides less than five years of data to examine. An alternative approach used in this paper is to examine the performance of US metropolitan regions for which CPI data are available.21
While US regions are subject to the same monetary policy, both in terms of interest rate and exchange rate policy, a complication arises from the fact that these regions share many other common factors. For example, they are subject to the same federal fiscal policy. Also, regions of the US (or any country for that matter) are likely to be much more economically integrated than the sample of OECD countries considered here, which suggests that regions are subject to more common shocks over time than even the narrow group of countries. This closer degree of integration combined with fixed exchange rates is likely to lead to stronger convergence than what was observed for OECD countries, which have had
20 While the other 13 countries have not announced a formal inflation target, or were not
inflation targeters until very late in the decade, a number of authors argue that they conduct monetary policy as if they had an ‘inflation target in mind’ (Stone 2003, p 3). Such countries have been called ‘eclectic’ (Carare and Stone 2003) and ‘covert’ (Mankiw 2001) inflation targeters.
21 The author would like to thank Ellis Connolly for suggesting this approach.
17
differential exchange rate regimes over the last four decades.22 No effort is made to control for these other factors here, which limits the strength of the results. On the other hand, interest rate policy arguably has a larger impact on inflation than these other factors.
To establish whether or not inflation convergence occurs between US metropolitan regions, Equation (2) is estimated using a dataset of regional consumer prices for the US.23 Inflation convergence is examined for the same time periods as in the earlier analysis for OECD and the global dataset. The results of Equation (2) for the US regions are presented in Table 4 and Figure 5.
The results show that there is evidence of strong inflation convergence occurring consistently over the past four decades. The β1 coefficients are negative and highly significant in all three periods, and notably larger in absolute terms than those obtained for the OECD, especially in the two earlier periods.24 Also, the explanatory power of the regressions is consistently high, as seen in the adjusted
2R statistics. These findings point to inflation convergence being a stable property of inflation for metropolitan regions in the United States over the past four decades.25
22 With fixed exchange rates, in the long-run productivity differentials in the non-traded sector
are likely to be responsible for most of the cross-country divergences in inflation rates (sometimes referred to as the Balassa-Samuelson effect). In the US, however, this effect is likely to be small with virtually no barriers to trade or mobility of labour across regions. In the case of floating exchange regimes, continuous appreciations or depreciations can lead to persistent inflation differentials.
23 The series used is labelled ‘consumer prices for all urban consumers’ (CPI-U) for metropolitan areas. These data are sourced from the Bureau of Labor Statistics, available at <http://www.bls.gov/cpi/>. Here, regions that do not have data available for the years 1961–2002 are excluded, yielding a sample of 18 regions (out of 27 possible regions).
24 In fact, there appears to be a steady decline in the absolute size of these coefficients over the past 40 years. A potential explanation for this pattern could be related to the fact that recessions in the US have become less frequent and less severe (Bernanke 2004). In this case, the larger negative coefficients in the earlier periods could be a function of greater cross-sectional volatility in inflation outcomes.
25 Table A1 in Appendix A presents the β1 coefficients from regressions of Equation (2) on the dataset of US regional consumer prices under the alternative of five-year time periods. The results in Table A1 tell a similar story to those presented here.
18
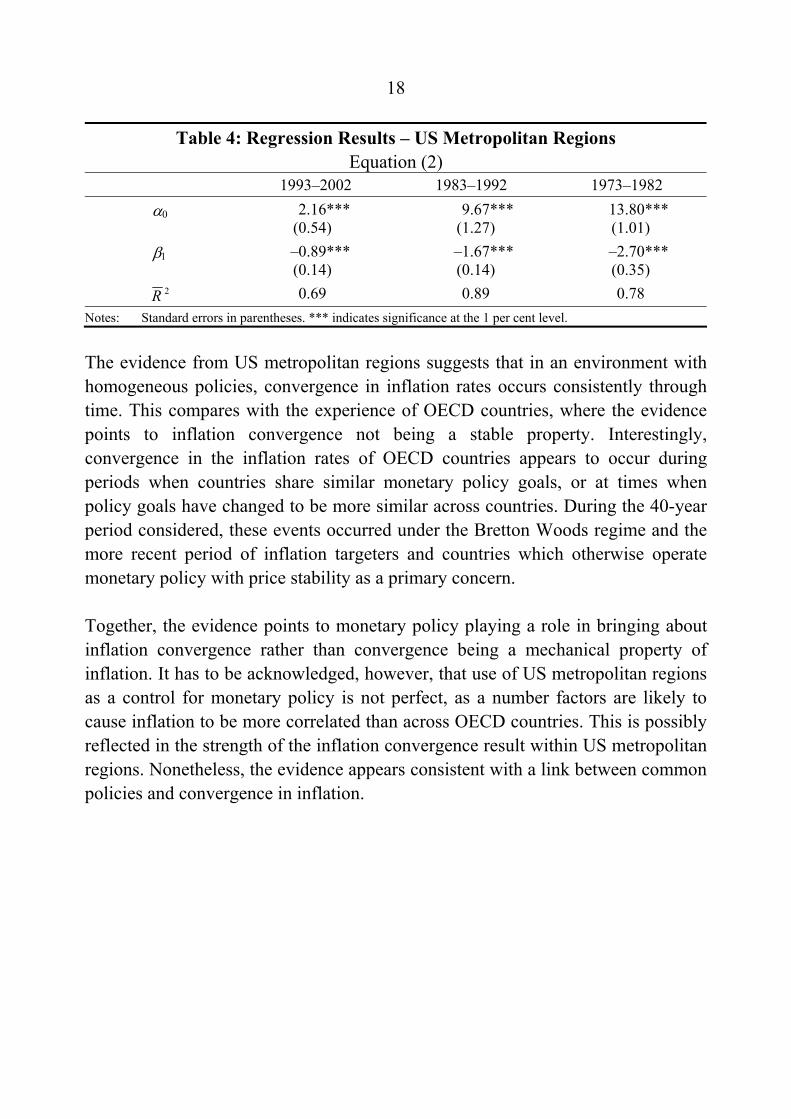
Table 4: Regression Results – US Metropolitan Regions Equation (2)
1993–2002 1983–1992 1973–1982 α0 2.16***
(0.54) 9.67***
(1.27) 13.80*** (1.01)
β1 –0.89*** (0.14)
–1.67*** (0.14)
–2.70*** (0.35)
2R 0.69 0.89 0.78 Notes: Standard errors in parentheses. *** indicates significance at the 1 per cent level.
The evidence from US metropolitan regions suggests that in an environment with homogeneous policies, convergence in inflation rates occurs consistently through time. This compares with the experience of OECD countries, where the evidence points to inflation convergence not being a stable property. Interestingly, convergence in the inflation rates of OECD countries appears to occur during periods when countries share similar monetary policy goals, or at times when policy goals have changed to be more similar across countries. During the 40-year period considered, these events occurred under the Bretton Woods regime and the more recent period of inflation targeters and countries which otherwise operate monetary policy with price stability as a primary concern.
Together, the evidence points to monetary policy playing a role in bringing about inflation convergence rather than convergence being a mechanical property of inflation. It has to be acknowledged, however, that use of US metropolitan regions as a control for monetary policy is not perfect, as a number factors are likely to cause inflation to be more correlated than across OECD countries. This is possibly reflected in the strength of the inflation convergence result within US metropolitan regions. Nonetheless, the evidence appears consistent with a link between common policies and convergence in inflation.
19
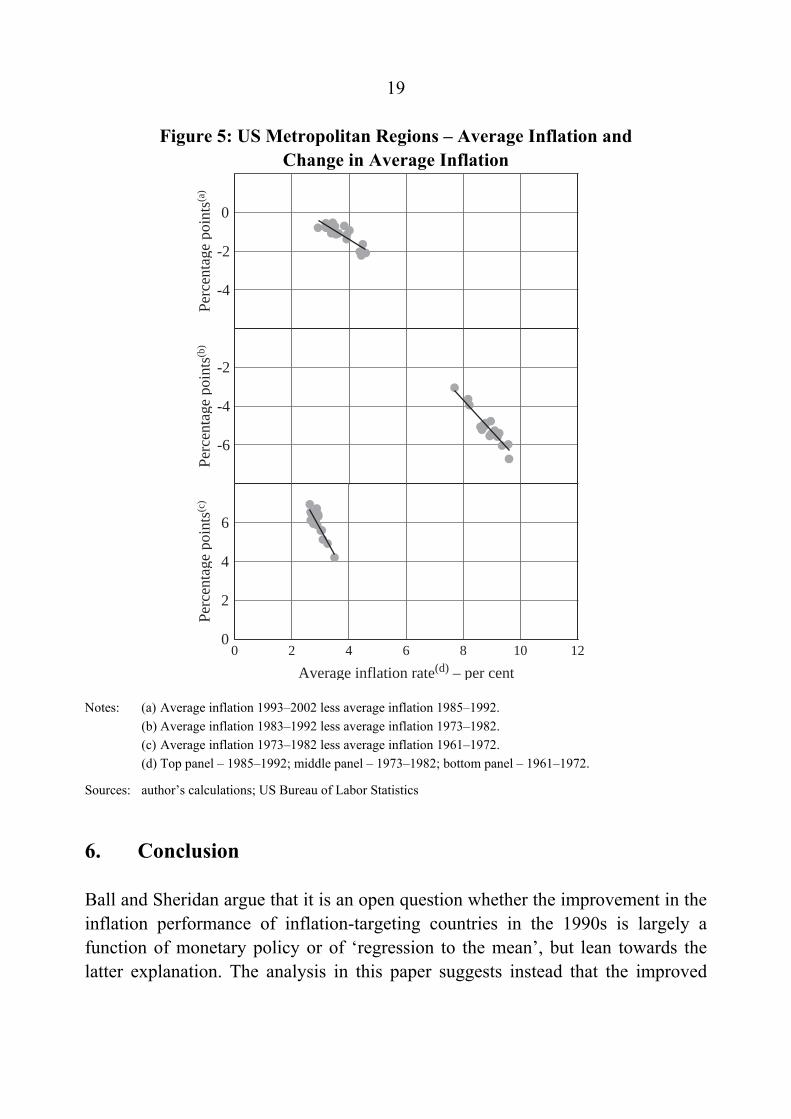
Figure 5: US Metropolitan Regions – Average Inflation and Change in Average Inflation
•••• ••••••••••
••••
-4
-2
0
•••
•••••• •••••
••••-6
-4
-2
•••
•••••••••••••••
0
2
4
6
0 2 4 6 8 10 12
Perc
enta
ge p
oint
s(a)
Perc
enta
ge p
oint
s(b)
Perc
enta
ge p
oint
s(c)
Average inflation rate(d) – per cent
Notes: (a) Average inflation 1993–2002 less average inflation 1985–1992. (b) Average inflation 1983–1992 less average inflation 1973–1982. (c) Average inflation 1973–1982 less average inflation 1961–1972. (d) Top panel – 1985–1992; middle panel – 1973–1982; bottom panel – 1961–1972.
Sources: author’s calculations; US Bureau of Labor Statistics
6. Conclusion
Ball and Sheridan argue that it is an open question whether the improvement in the inflation performance of inflation-targeting countries in the 1990s is largely a function of monetary policy or of ‘regression to the mean’, but lean towards the latter explanation. The analysis in this paper suggests instead that the improved
20
performance is largely a function of monetary policy decisions, in particular the clear commitment to anti-inflation policies that became common in the 1990s, including inflation targeting. However, Ball and Sheridan are no doubt correct in saying that more definitive conclusions on the success of inflation targeting will only be feasible after a number of decades of experience with the regime.
In a world where central banks closely watch each other, one might have expected that countries with relatively poor inflation performance would seek to emulate the policies of countries that had been successful in maintaining low inflation. Hence, the fact that the convergence of inflation rates at low levels did not occur until the 1990s is somewhat puzzling. A plausible explanation would seem to be that by the start of this decade there was both broad consensus that high inflation was costly, and institutional changes in many countries that allowed central banks to more actively pursue the goal of low and stable inflation. Inflation targeting was the framework adopted by a number of countries in their quest for low inflation.
The question remains as to whether regimes such as exchange rate or monetary targeting would have been as successful as inflation targeting for those countries with high inflation that adopted inflation targeting. As has been shown in this paper, the eventual inflation targeters were different from other countries in that they had a history of nearly two decades of inflation rates higher than their peers. Also, some of the eventual inflation targeters unsuccessfully operated both exchange rate and monetary-targeting regimes prior to their adoption of inflation targeting. This suggests that inflation targeting may have indeed been the best choice of regime for these countries over the past decade.
21
Appendix A: Sensitivity Analysis
Table A1: Regression Results Equation (2)
OECD countries US regions t Regression coefficient β1
1966–1970 –0.75*** –1.43*** 1971–1975 0.17 –0.93*** 1976–1980 0.69** –2.08*** 1981–1985 –0.20** –1.40*** 1986–1990 –0.52*** –0.81*** 1991–1995 –0.76*** –1.14*** 1996–2000 –0.80*** –0.83***
Note: **,*** indicate significance at the 5 and 1 per cent levels, respectively.
22
References
Argy V, A Brennan and G Stevens (1989), ‘Monetary targeting: the international experience’, in I Macfarlane and G Stevens (eds), Studies in Money and Credit, Proceedings of a Conference, Reserve Bank of Australia, Sydney, pp 10–52.
Aurikko E (1986), ‘The increased internationalization of Finnish financial markets’, Bank of Finland Monthly Bulletin, (Special Issue), pp 26–31.
Ball L and N Sheridan (forthcoming), ‘Does inflation targeting matter?’, in BS Bernanke and M Woodford (eds), Inflation Targeting, University of Chicago Press, Chicago.
Bernanke BS (2004), ‘The great moderation: the decline in output and inflation volatility since the 1970s’, paper presented at the annual conference of the Eastern Economic Association, Washington DC, 20 February.
Bernanke BS, T Laubach, FS Mishkin and AS Posen (1999), Inflation targeting: lessons from the international experience, Princeton University Press, Princeton, New Jersey.
Bernanke BS and FS Mishkin (1997), ‘Inflation targeting: a new framework for monetary policy’, Journal of Economic Perspectives, 11(2), pp 97–116.
Bladen-Hovell (1994), ‘The European monetary system’, in MJ Artis and N Lee (eds), The Economics of the European Union, Oxford University Press, Oxford, pp 328–345.
Bordo MD and AJ Schwartz (1999), ‘Monetary policy regimes and economic performance: the historical record’, in JB Taylor and M Woodford (eds), Handbook of Macroeconomics: Volume IA, Elsevier Science, Amsterdam, pp 149–234.
Brooks R (1998), ‘Inflation and monetary policy reform’, A Singh, J Felman, R Brooks, T Callen and C Thimann (eds), Australia: Benefiting from Economic Reform, International Monetary Fund, Washington DC, pp 63–94.
23
Carare A and MR Stone (2003), ‘Inflation targeting regimes’, IMF Working Paper No 03/9.
Corbo, V, O Landerretche and K Schmidt-Hebbel (2002), ‘Does inflation targeting make a difference?’, in N Loayza and R Soto (eds), Inflation Targeting: Design, Performance, Challenges, Central Bank of Chile, Santiago, pp 221–269.
Eichengreen B (1997), European Monetary Unification: Theory, Practice, and Analysis, MIT Press, Cambridge.
Friedman M (1970), ‘The counter-revolution in monetary theory’, Institute of Economic Affairs Occasional Paper No 33.
Gertler M (forthcoming), ‘Comments on Ball and Sheridan’, in BS Bernanke and M Woodford (eds), Inflation Targeting, University of Chicago Press, Chicago.
Hu Y (2003), ‘Empirical investigations of inflation targeting’, Institute for International Economics Working Paper No 03-6.
IMF (International Monetary Fund) (2003), International Financial Statistics: April 2003, IMF Publication Services, Washington.
Kenen PB (1995), Economic and Monetary Union in Europe: Moving Beyond Maastricht, Cambridge University Press, Cambridge.
King M (1997), ‘The inflation target five years on’, Bank of England Quarterly Bulletin, 37(4), pp 434–442.
Mankiw NG (2001), ‘U.S. monetary policy during the 1990s’, NBER Working Paper No 8471.
Mishkin FS (1999), ‘International experiences with different monetary policy regimes’, Journal of Monetary Economics, 43(3), pp 579–605.
24
Mishkin FS and K Schmidt-Hebbel (2002), ‘A decade of inflation targeting in the world: what do we know and what do we need to know?’, in N Loayza and R Soto (eds), Inflation Targeting: Design, Performance, Challenges, Central Bank of Chile, Santiago, pp 171–219.
Quigley NC (1992), ‘Monetary policy and the New Zealand system: an historical perspective’, Reserve Bank of New Zealand Discussion Paper No G92/1.
Rogers JH (2002), ‘Monetary union, prive level convergence, and inflation: how close is Europe to the United States’, International Finance Discussion Paper No 740.
Rogoff K (2003), ‘Globalization and global disinflation’, paper presented at a conference sponsored by the Federal Reserve Bank of Kansas City on ‘Monetary Policy and Uncertainty: Adapting to a Changing Economy’, Jackson Hole, 28–30 August.
Stone MR (2003), ‘Greater monetary policy transparency for the G3: lessons from full-fledged inflation targeters’, IMF Working Paper No 03/218.