Embed Size (px)
Citation preview
BioMed CentralBMC Systems Biology
ss
Open AcceMethodology articleInferring branching pathways in genome-scale metabolic networksEsa Pitkänen*1, Paula Jouhten2 and Juho Rousu1Address: 1Department of Computer Science, University of Helsinki, Finland and 2VTT Technical Research Centre of Finland, Espoo, Finland
Email: Esa Pitkänen* - [email protected]; Paula Jouhten - [email protected]; Juho Rousu - [email protected]
* Corresponding author
AbstractBackground: A central problem in computational metabolic modelling is how to findbiochemically plausible pathways between metabolites in a metabolic network. Two general,complementary frameworks have been utilized to find metabolic pathways: constraint-basedmodelling and graph-theoretical path finding approaches. In constraint-based modelling, one aimsto find pathways where metabolites are balanced in a pseudo steady-state. Constraint-basedmethods, such as elementary flux mode analysis, have typically a high computational cost stemmingfrom a large number of steady-state pathways in a typical metabolic network. On the other hand,graph-theoretical approaches avoid the computational complexity of constraint-based methods bysolving a simpler problem of finding shortest paths. However, while scaling well with network size,graph-theoretic methods generally tend to return more false positive pathways than constraint-based methods.
Results: In this paper, we introduce a computational method, ReTrace, for finding biochemicallyrelevant, branching metabolic pathways in an atom-level representation of metabolic networks.The method finds compact pathways which transfer a high fraction of atoms from source to targetmetabolites by considering combinations of linear shortest paths. In contrast to current steady-state pathway analysis methods, our method scales up well and is able to operate on genome-scalemodels. Further, we show that the pathways produced are biochemically meaningful by an exampleinvolving the biosynthesis of inosine 5'-monophosphate (IMP). In particular, the method is able toavoid typical problems associated with graph-theoretic approaches such as the need to define sidemetabolites or pathways not carrying any net carbon flux appearing in results. Finally, we discussan application involving reconstruction of amino acid pathways of a recently sequenced organismdemonstrating how measurement data can be easily incorporated into ReTrace analysis. ReTraceis licensed under GPL and is freely available for academic use at http://www.cs.helsinki.fi/group/sysfys/software/retrace/.
Conclusion: ReTrace is a useful method in metabolic path finding tasks, combining some of thebest aspects in constraint-based and graph-theoretic methods. It finds use in a multitude of tasksranging from metabolic engineering to metabolic reconstruction of recently sequenced organisms.
Published: 29 October 2009
BMC Systems Biology 2009, 3:103 doi:10.1186/1752-0509-3-103
Received: 20 July 2009Accepted: 29 October 2009
This article is available from: http://www.biomedcentral.com/1752-0509/3/103
© 2009 Pitkänen et al; licensee BioMed Central Ltd. This is an Open Access article distributed under the terms of the Creative Commons Attribution License (http://creativecommons.org/licenses/by/2.0), which permits unrestricted use, distribution, and reproduction in any medium, provided the original work is properly cited.
Page 1 of 22(page number not for citation purposes)
BMC Systems Biology 2009, 3:103 http://www.biomedcentral.com/1752-0509/3/103
BackgroundGenome-scale metabolic reconstructions from a variety oforganisms have become available in recent years [1]. Atthe same time, data from different organism-specific net-works has been collected into "universal" metabolic data-bases such as KEGG [2] and BioCyc [3]. This has enabledcomparative analyses of metabolism over multiple organ-isms [4,5], and proven useful in drug discovery [6], meta-bolic flux analysis [7] and metabolic engineering [8] tasks.
A typical way to query a metabolic model is to ask whethera biologically realistic connection exists in the modelfrom a metabolite to another. We may ask this question indifferent contexts, depending on the task at hand. Forinstance, when reconstructing a metabolic network for anovel organism [9], we are interested in discovering if apreviously characterized pathway is present in the organ-ism under study [10]. Further, we may ask whether theorganism possesses the ability to produce a substance, forexample a particular amino acid, from available nutrients[11]. This is often either to verify that the reconstructedmodel has the expected structure or to predict a novel phe-notype. Unfortunately, genome-scale reconstructionsoften contain errors, even after manual curation, whichneed to be taken into account during path finding [12]. Inthis paper, we introduce a novel method for inferring bio-logically relevant pathways in metabolic networks. First,we review the current methods for metabolic pathwayanalysis and describe our contribution. Section Methodsintroduces methodology, path finding problem, algo-rithm and its implementation. In section Results, wereport the results of computational experiments. Finally,the paper ends in Conclusions.
Review of methods for metabolic pathway analysisTwo complementary approaches have been used toanswer the questions discussed above, constraint-basedand graph-theoretical path finding methods. In constraint-based methods [11,13], one tries to infer a pathway wherethe intermediate metabolites are balanced in a (pseudo)steady-state. In a steady-state, the net production of eachintermediate metabolite is zero. Pathways satisfying thisconstraint can be branching, in general consisting of oneor more linear paths enabling the production of the targetmetabolite from sources.
On the other hand, in graph-theoretical methods, one typ-ically wants to find a number of shortest paths leadingfrom the source to the target metabolite [14-19]. Methodsusually deal only with linear, non-branching pathways.Thus, graph-theoretical methods are often restricted toone source and one target metabolite. Two recent surveyarticles discuss the relationship between the twoapproaches [20,21]. Results from graph-theoretical pathfinding and steady-state pathway analyses complement
each other. Graph-theoretical approaches tend to generatea large number of alternative pathways, which need to befiltered and ranked according to some realistic criteria toproduce meaningful results. On the other hand, the com-putational complexity of steady-state analyses hinders theanalysis of large metabolic models, though recent studieshave improved the efficiency of methods [22]. Particu-larly, graph-theoretical analyses could be used to producea moderate-sized representation of a genome-scale modelcontaining only the parts relevant to the task at hand,making the steady-state analysis feasible.
In the ARM method, information on the mapping pat-terns of carbon atoms in metabolic reactions was utilized[14]. In ARM, a graph is first constructed where nodes cor-responded to atoms of metabolites while edges describedhow the atoms were transferred in reactions from metab-olite to metabolite. Then, to answer a path query, an algo-rithm returning k shortest paths was invoked to returnpathways that transfer at least one carbon from source totarget metabolite. Such pathways were shown often tocorrespond to biologically relevant pathways. Moreover,the algorithm scaled up well with the network size. How-ever, ARM was unable to deal with branching pathwaysand pathways transferring more carbon atoms were notprioritized over those transferring less carbons.
Until more recently, other graph-theoretical approacheshave avoided the use of atom mapping information. Thisis probably due to the fact the obtaining reliable mappingdata is a hard problem, both computationally and bio-chemically. In ARM, atom mappings were computed for anumber of KEGG reactions using a heuristic methodbased on matching of maximum common subgraphs[14]. Later, atom mapping information was added also fora subset of KEGG reactions as the KEGG RPAIR database[23].
Certain metabolites appear in many different reactions inmetabolism carrying out tasks such as providing energyfor reactions and maintaining redox balance. Such metab-olites are commonly called pool or currency metabolites.Examples include ATP, NAD and water, which indeedhave a high degree of connectivity in metabolic networks.If a pool metabolite appears in a reaction in its typicalrole, the metabolite is usually said to be a side metabolite inthe particular reaction. However, assignment of metabo-lites to side metabolites is context-dependent. Forinstance, ATP appears in side metabolite role in additionto being the end product on the pathway responsible forsynthesizing ATP.
In simple shortest path analysis, pool metabolites oftencause false positive pathways to be identified, as the short-est paths often traverse via them [24]. A popular method
Page 2 of 22(page number not for citation purposes)
BMC Systems Biology 2009, 3:103 http://www.biomedcentral.com/1752-0509/3/103
to deal with the problem is to remove pool metabolitesfrom the metabolic network. Then, we are faced withassignment of metabolites as pool metabolites, which is atask that depends on the pathway queries we would liketo ask. Taking again ATP as an example, by removing ATPfrom the metabolic network, we lose the opportunity toobtain results involving pathways which synthesize ATP.
There have been attempts to avoid the problem of assign-ing a list of side metabolites altogether in pathway analy-sis tasks. Rahman et al. utilized information on metabolitestructures in Pathway Hunter Tool (PHT) [16]. In PHT,metabolite structural similarity is first used to identifyreactant pairs in reactions which resemble each othermost. Path finding is then performed on a graph consist-ing only of reaction connections between the most similarmetabolites. For instance, in reaction glucose + ATP →glucose 6-phosphate + ADP one can find out that glucoseand ADP do not resemble each other, and thus no path-way should use the connection glucose → ADP. Of course,the method is dependent on molecular structure data. Forsome metabolites such data is not available. However,exact atom mappings are not required, and it is possibleto approximate molecular similarity with an appropriateheuristic.
A method has been proposed by Croes et al. to avoid sidemetabolites in path finding by weighting the edges of themetabolic network graph by the metabolite degree [25].In this method, Metabolic PathFinding, highly connectedmetabolites such as pool metabolites receive a highweight. Therefore, when searching for the lightest pathsbetween the query metabolites, the method tends to gen-erate pathways that avoid pool metabolites. It is still pos-sible for a pool metabolite to appear in a result pathwayas it has not been removed from the network. Moreover,some metabolites such as pyruvate have a high degreewithout appearing as side metabolites in most reactions.As a downside of the method, routes through such metab-olites will be penalized.
Blum and Kohlbacher combined atom mapping informa-tion with metabolic graphs weighted by metabolitedegrees [26]. In their approach, k lightest linear paths arefirst sought for in a graph corresponding to a metabolicnetwork, where two metabolites are connected if there isa reaction where at least one atom is transferred betweenthe metabolites. To this end, the authors computed atommappings for a set of reactions using a minimum cut algo-rithm. The quality of atom mappings was then improvedby taking into account the structure of the EC hierarchy.Finally, when a set of pathways had been found betweenthe query metabolites, a check would be made to ensurethat at least one atom is actually transferred from source
to target. The method has been implemented as the toolMetaRoute [18].
Subsequently, also Metabolic PathFinding was improvedby Faust et al. by taking advantage of the annotations forreactant pairs in KEGG reactions contained in the RPAIRdatabase [19]. RPAIR describes how the atoms are trans-ferred from a substrate to a product in reactions. Moreo-ver, each reactant (substrate-product) pair has beenannotated with the inferred role of the reactant pair ineach reaction [27]. Roles include "main", "trans", "cofac","ligase" and "leave". Pairs assigned as "ligase" and "leave",often indicate a connection irrelevant to typical path find-ing queries. For instance, in reaction glucose + ATP → glu-cose 6-phosphate + ADP, reactant pairs (glucose, glucose6-phosphate) and (ATP, ADP) have been annotated as"main" pairs while (glucose 6-phosphate, ATP) is a"trans" pair. Since no atoms are transferred from glucoseto ADP, this reactant pair has not been annotated.
Faust et al. evaluated the accuracy of different combina-tions of path finding parameters in retrieving 55 knownreference pathways in three organisms (E. coli, S. cerevisiae,H. sapiens) [19]. Different method variants were con-structed, for instance, by choosing whether to removehighly connected metabolites, whether to assign weightsto metabolites according to their degree and whether toassign weights to reactions according to their annotatedrole in RPAIR by favoring "main" pairs. The extensive sta-tistical testing performed by the authors demonstratedthat the inclusion of RPAIR annotations together withmetabolite weighting improves the path finding resultssignificantly.
The graph-theoretical methods discussed above only findnon-branching pathways. As many important pathwaysare best understood by considering the different branchesleading to the target metabolite, it can be argued that ametabolic path finding method should incorporate sup-port also for non-linear pathways. Some methods, such asMetaRoute [18] offer the possibility to view a graphicalrepresentation of the combination of the linear pathsleading from source to target. However, in such represen-tations unrelated linear paths may be shown together,making drawing conclusions about the branching path-way structure more difficult.
These concerns can be addressed in constraint-basedmodelling framework. A prominent concept in this frame-work is elementary flux mode (EFM). An elementary fluxmode is a minimal set of enzymes capable of operating ina pseudo steady-state, with reactions respecting irreversi-bility constraints [13]. Elementary flux modes haveproven to be useful in analysis of small to medium-scalemetabolic models [28]. In particular, EFMs can accurately
Page 3 of 22(page number not for citation purposes)
BMC Systems Biology 2009, 3:103 http://www.biomedcentral.com/1752-0509/3/103
describe the branching nature of many pathways, such aspentose phosphate pathway.
Without additional constraints, both graph-theoreticaland constraint-based methods produce a very largenumber of pathways for typical queries. For instance,about 500000 linear pathways of length at most nine reac-tions were found from glucose to pyruvate [29], whileroughly the same number of elementary flux modes werefound in a metabolic network of 110 reactions connectingglucose, acetyl, glycine and succinate to CO2, acetyl, for-mate, ethanol and lactose [30]. In particular, the largenumber of EFMs in typical settings has prohibited theanalysis of genome-scale models [22]. To analyze agenome-scale model with EFMs in a constraint-basedmodelling framework, one effectively needs to limit thecomplexity of the model, either reducing the model sizeor imposing constraints. A particular problem is how toassign the external metabolites which are excluded fromthe pseudo steady state constraint. Of course, this taskdepends on the intended use of the model. Popular toolswhich can be used to compute elementary flux modesinclude METATOOL [31] and YANA [32].
A recent case study [33] compared path findingapproaches to elementary flux mode analysis in produc-ing sugars from fatty acids. In that work, the system understudy was relatively small, consisting of the reactions ofthe Krebs cycle, glycolysis and gluconeogenesis. The ques-tion asked was whether it was possible for the system toproduce glucose 6-phosphate (G6P) from acetyl-CoA(AcCoA). Two different models were considered. First, amodel with no glyoxylate cycle was demonstrated to notto be able to perform the desired conversion in steady-state. Second, when the glyoxylate cycle was added, asteady-state conversion from AcCoA to G6P was possible.Then, the authors queried two methods, Metabolic Path-Finding [15] and Pathway Hunter Tool [16], for pathsconnecting AcCoA to G6P. The methods failed, accordingto the authors, to provide realistic pathways correspond-ing to the steady-state pathways found by elementary fluxmode analysis. In particular, many resulting pathways didnot carry any carbon net flux, a necessary property of abiosynthetic pathway. However, the authors criticize thepathways found by PathFinding and PHT for not necessar-ily being balanced at steady-state. This can be arguedagainst in a general path finding setting, as biologicallyimportant but unbalanced metabolic pathways exist [20].Moreover, an unbalanced pathway might be important inits own right, demonstrating a mechanism for the net car-bon flow, for instance.
In previous work, we introduced the concept of feasiblepathways [17]. In this graph-theoretical approach, the met-abolic network is viewed as an and-or graph where and
nodes correspond to reactions and or nodes correspond tometabolites. A feasible pathway is a set of reactions whereeach reaction is reachable from a set of source metabolites.Two procedural rules define reachability of reactions andmetabolites: a reaction can be made reachable if and onlyif all its substrates have been made reachable, while ametabolite can be made reachable if and only if either atleast one of reactions producing has been made reachableor the metabolite is a source metabolite. In other words, afeasible pathway is branching when there is a reactionwith two or more substrates. In this approach, poolmetabolites are dealt with by removing them from thenetwork before analysis.
Our contributionIn this paper, we introduce a new graph-theoreticalmethod, ReTrace, for finding branching pathways in large-scale metabolic networks. Our method builds on theobservation utilized in the previous works of Arita [14]and Blum and Kohlbacher [26] that a biologically inter-esting pathway should transfer at least one atom fromsource to target metabolite.
Our method tries to overcome the problem of irrelevantconnections faced by most path finding approaches bysearching for pathways at atom level instead of reaction-metabolite level. ReTrace searches for pathways in anatom-level representation of the metabolic network incontrast to most other path finding methods discussedabove. Particularly, the method improves Arita's ARMmethod [14] by being able to find branching pathwaysthat transfer as many as possible of the atoms in the targetmetabolite from precursors. To our best knowledge, this isthe first path finding method which explicitly tries to max-imize this quantity. Favoring pathways which transfer asmany atoms as possible can be justified by considering apathway that fails to transfer all target metabolite atoms.In order to operate, such pathway necessarily involvesreaction or reactions, which bring the missing atoms intothe pathway from dangling substrates. Specifically, a dan-gling substrate is a metabolite consumed but not pro-duced by a reaction on the pathway. The number ofdangling substrates invariably decreases, as more atomsare transferred to the target metabolite by the pathway.We argue that to find plausible pathways, a path findingmethod should either minimize the number of danglingsubstrates or transfer as many atoms as possible to target.Particularly, ReTrace is designed to do both at the sametime.
To this end, we introduce a scoring function for pathwaystaking into account the number of target atoms trans-ferred from source atoms. We then formulate the problemof finding high-scoring branching pathways, study itscomplexity and give an efficient algorithm to solve the
Page 4 of 22(page number not for citation purposes)
BMC Systems Biology 2009, 3:103 http://www.biomedcentral.com/1752-0509/3/103
problem. The algorithm operates at the atom-level repre-sentation, finding a number of shortest paths [34,35]between source and target metabolites and combiningpaths into branching, high-scoring pathways. Conse-quently, we retain the scalability of other graph-theoreti-cal path finding methods and thus enable the analysis ofgenome-scale metabolic networks without any modelrestriction done prior to analysis.
In particular, our method avoids the context-dependentproblem of defining side metabolites in each reaction. Forinstance, ATP is a typical side metabolite that participatesin a large number of reactions. However, as discussed ear-lier, by removing ATP from analysis we at the same timelose the possibility to analyze the ATP synthesis pathways.Operating in an atom-level representation of the meta-bolic network, ReTrace disregards side metabolite connec-tions automatically being unable to transfer atoms fromsource to target metabolite.
The ability to incorporate measurement data into analysisis vital in discovering condition-specific pathways. Inorder to achieve this, in addition to the scoring functiondiscussed above, ReTrace allows scores to be assigned toreactions. Pathway search is then guided by the scores tofavor pathways which utilize reactions with high scores.Thus, by encoding measurement data into reaction-spe-cific scores, one can obtain pathways which were active inthe measured conditions, for instance. In this paper, wedescribe an application where we incorporated sequencesimilarity data into ReTrace analysis [36]. In general, onecan consider incorporation of data from other sources,such gene or protein expression data, or enzyme functionprediction [37] data obtained with machine learningmethods.
We have implemented the method in Python [38]. Thesoftware is released under GPL and is freely available foracademic purposes.
MethodsWe begin by defining some key concepts, a scoring func-tion for pathways and a computational problem of find-ing branching, high scoring pathways. Then, we describean algorithm, ReTrace, for solving the path finding prob-lem.
First, we define to be a collection of metabolites and ℜto be a collection of reactions which utilize the metabo-
lites in . A metabolic reaction r ∈ ℜ is defined by giving
its substrate and product metabolite sets I(r), O(r) ⊆ ,
respectively. For instance, the reaction glucose (GLC) +
ATP → glucose 6-phosphate (G6P) + ADP could be given
by I(r) = {GLC, ATP} and O(r) = {G6P, ADP}. Each
metabolite m ∈ consists of atoms, B(m) ⊆ , where
is the set of atom positions over all metabolites. Theatoms in different metabolites are distinct. For example,we could assign six (carbon) atoms to both GLC and G6P,and let B(GLC) = {a1,..., a6} and B(G6P) = {a7,..., a12}. We
deal with bidirectional reactions by considering thereverse direction as a separate reaction , e.g., I( ) = O(r)
and O( ) = I(r). Unidirectional reactions are then natu-rally taken into account by leaving the reverse reaction outof the model.
Further, we define the atom mapping [39] for a reaction r ∈to be a relation Γ:ℜ → × specifying how substrateatoms are transferred to product atoms. To give an exam-ple, let = {a1, a2, a3, a4} and = {m1, m2, m3}, with
metabolite structures defined by B(m1) = {a1, a2}, B(m2) =
{a3} and B(m3) = {a4}. We can now define a reaction r
with I(r) = {m1} and O(r) = {m2, m3} and the atom map-
ping associated with r to be Γ1(r) = {(a1, a3), (a2, a4)}.
Alternatively, atom mapping can be defined as Γ2(r) =
{(a1, a4), (a2, a3)}. We say that the reaction r consumes
atoms (r) = {a|(a, a') ∈ Γ (r)} and produces atoms (r)
= {a'|(a, a') ∈ Γ (r)}.
For a collection of reactions ℜ with associated atom map-
pings Γ, we define a directed atom graph G (ℜ, ) = (V,
E), induced by atom collection and atom mappings Γwith vertices V and edges E as follows. For each atom a ∈A, we have a vertex va ∈ V. Each pair (a, a') ∈ Γ (r), r ∈ R,
corresponds to an edge (va, va') ∈ E. Note that if reaction
directionality is not explicitly constrained, the atom graphwill contain the edge (va', va) for each edge (va, va') due to
reverse reactions being treated as separate reactions. The
example reaction r, atom mappings Γ1(r), Γ2(r) and the
induced atom graphs are shown in Figure 1.
In this section, we discuss only reactions with simple or 0-1 stoichiometry, that is, reactions where each substrate andproduct either appears exactly once or does not appear inI(r) and O(r), respectively. Briefly, one can relax thisassumption by replicating atoms and involved edges inmetabolites which appear in a reaction more than oncebut this topic is not pursued further here. For a reaction rinvolving only simple stoichiometries, we assume therelation Γ(r) to be bijective, i.e., there is an one-to-onecorrespondence between substrate and product atoms.
A
A
r r
r
A A
A
I O
A
A
Page 5 of 22(page number not for citation purposes)
BMC Systems Biology 2009, 3:103 http://www.biomedcentral.com/1752-0509/3/103
However, if a reaction consumes or produces two units ofa metabolite, for example, there is necessarily an atomthat is either mapped from or mapped to more than once.As an example, consider the reaction m1 → 2m2 havingΓ(r) = {(a1, a3), (a2, a3)} with atom a3 of metabolite m2appearing twice in the relation. Hence, atom mappings ofreactions involving stoichiometries different than zero orone, are not bijective.
A subset P = {r1,..., rk} ⊆ ℜ is called a pathway. A pathway
transfers an atom s ∈ to an atom t ∈ if and only if
there is a path s → t in the atom graph G(P). We denote byfP (S) the set of atoms to which atoms in S are transferred
by the pathway P. Figure 2 shows examples of fP (S) in the
context of a small example pathway.
As discussed in the previous section, metabolic pathwayswhich transfer a large fraction of their source atoms toproduct atoms should be prioritized over pathways trans-ferring a lesser number of atoms. In particular, we areinterested specifically in carbon atoms, as their supply isoften the limiting factor in cellular functions. Yields ofother atoms such as nitrogen or sulfur may also be ofimportance, depending on the role of the pathway inmetabolism.
To take these considerations into account, we define ascoring criterion for pathways, given source and target
atoms, S, T ⊆ , respectively. For instance, source andtarget atoms can be defined as sets of single atoms, allatoms in some metabolites, or all carbon atoms in somemetabolites. If a metabolite contains atoms in the source
or target atom set, we denote it as a source or target metab-olite, respectively. We define our pathway scoring criterionas the fraction ZO of target atoms T which are transferred
by the pathway P from source atoms S,
A pathway with ZO(P, S, T) = 1 is called a complete pathway.Intuitively, a pathway with high ZO is able to produce alarge fraction of target atoms from source atoms, and doesnot require a high contribution from atoms in other thansource metabolites. Figure 3 shows four example path-ways and ZO scores corresponding to them.
It is easy to see that ZO is maximized on the pathway P = .Instead, we study the following problem where the path-way size is involved.
Computational Problem 1
(Find-Branching-Pathways). Given a set of reactions , sets S,
T ⊆ , l ∈ + and w ∈ �, find all pathways P ⊆ ℜ such that
ZO(P, S, T) ≥ w and |P| <l.
In Find-Branching-Pathways, we aim to find pathwaysthat transfer enough atoms from sources to targets whileusing less than some specified amount of reactions. It ispossible that a pathway P is branching, or non-linear. Forinstance, the top right pathway in Figure 3 illustrates asimple branching pathway. It is easy to see that Find-Branching-Pathways is computationally hard by consider-ing a related problem, Find-Minimal-Pathway, where we
A A
A
Z P S TfP S T
TO( , , )( )
| |.=
∩
A
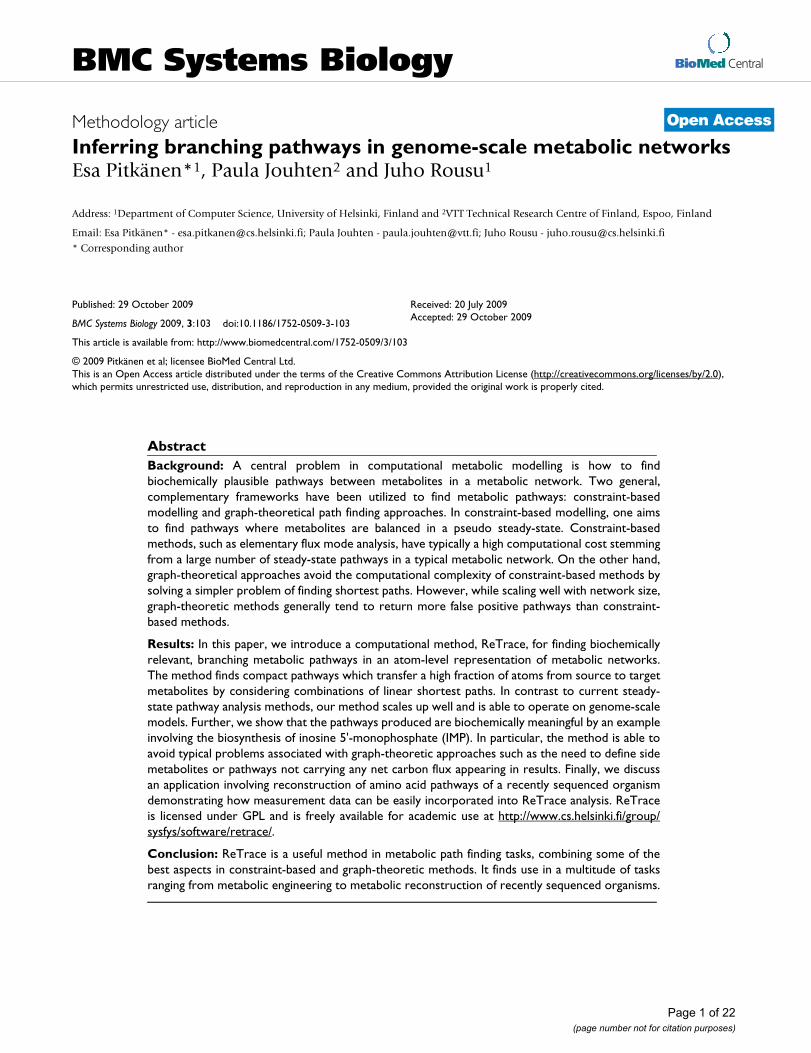
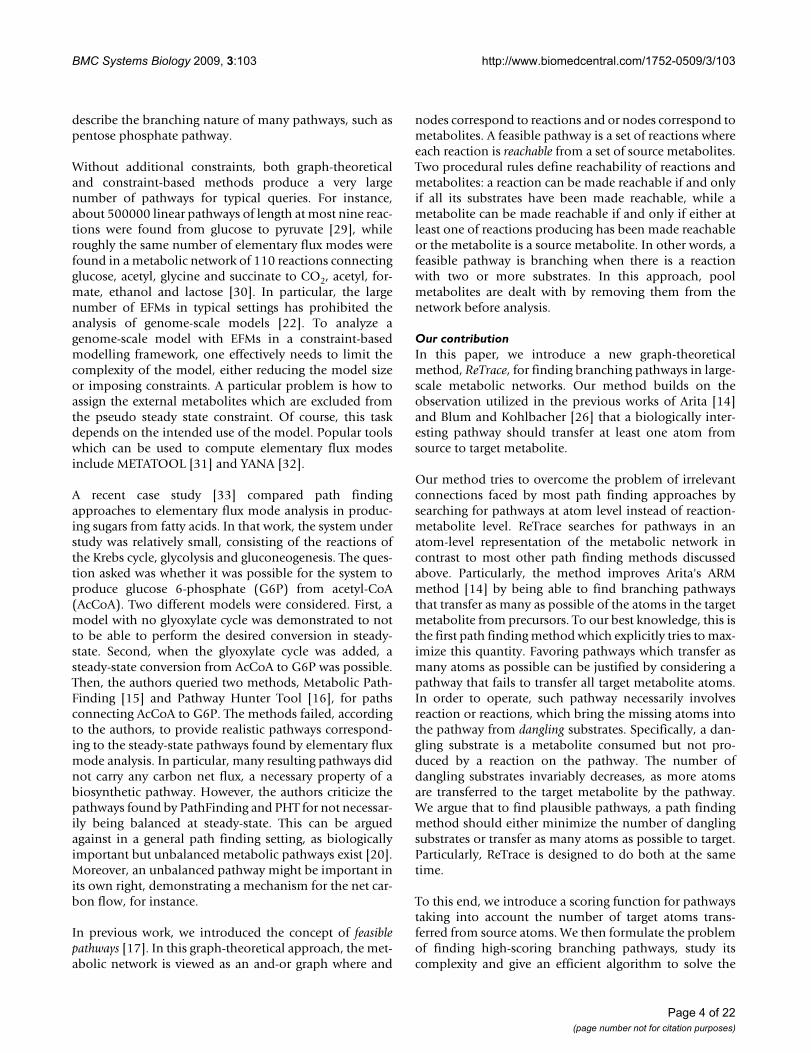
Example atom mappingsFigure 1Example atom mappings. Example reaction r: m1 → m2 +
m3, two alternative atom mappings Γ1(r) = {(a1, a3), (a2, a4)}
(left) and Γ2(r) = {(a1, a4), (a2, a3)} (right) and corresponding
atom graphs G({r}) for atom mappings Γ1, Γ2. Atom mappings indicated by shading of atoms. The reaction consumes atoms
(r) = {a1, a2} and produces atoms (r) = {a3, a4}.
ra1
a2
a3
a4
ra1
a2
a3
a4
v3
v4
v3
v4
v1
v2
v1
v2
I O
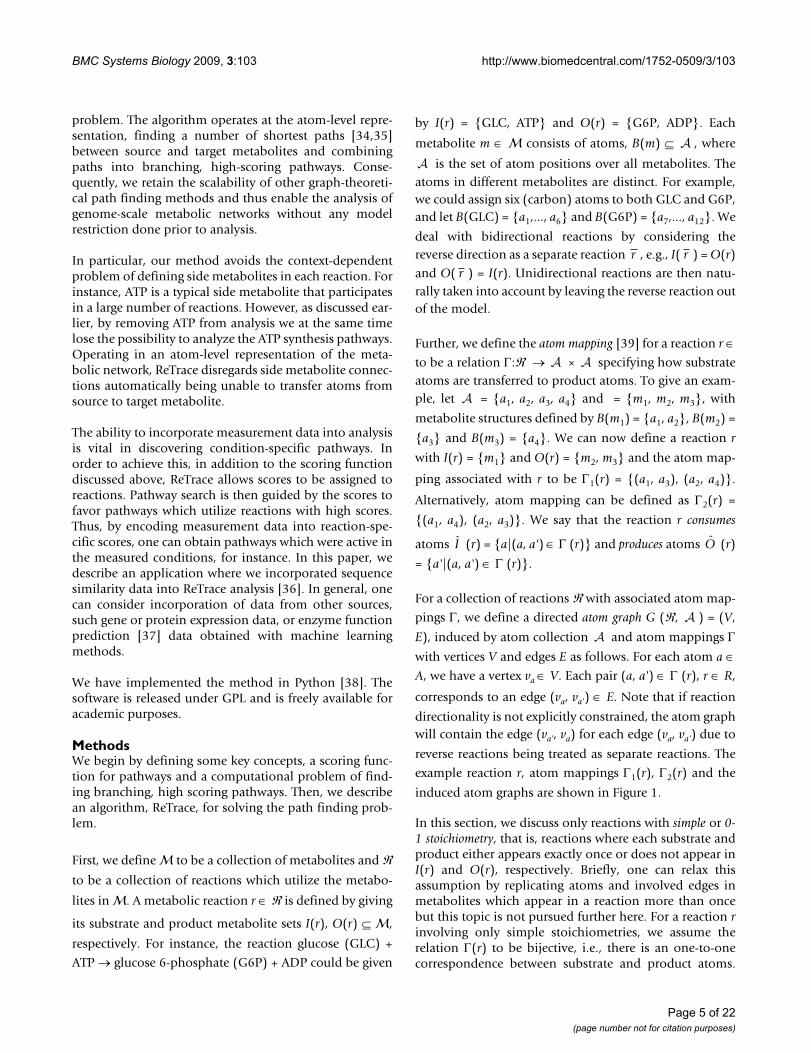
Example pathway of three reactionsFigure 2Example pathway of three reactions. Example pathway of three reactions r1, r2 and r3 and seven metabolites m1,..., m7 containing 13 atoms in total. Atom coloring indicates how the atoms are mapped in reactions. For instance, the pathway transfers atom a1 to atoms fP ({a1}) = {a5, a7, a12} and atom a8 to atom fP ({a8}) = {a13}.
r1 r2 r3
a1a2a3
a4
a5
a6
a7
a8
a9a10
a11a12a13
m1
m2
m3
m4
m5
m6
m7
Page 6 of 22(page number not for citation purposes)
BMC Systems Biology 2009, 3:103 http://www.biomedcentral.com/1752-0509/3/103
try to find the pathway P with minimal size such thatZO(P, S, T) ≥ w.
Computational Problem 2(Find-Minimal-Pathway). Given an instance of a Find-Branching-Pathways problem, find a pathway P satisfying theconstraints of Find-Branching-Pathways such that |P| ≤ |P'| forany other pathway P' satisfying the constraints.
Lemma 1. Find-Minimal-Pathway is NP-hard
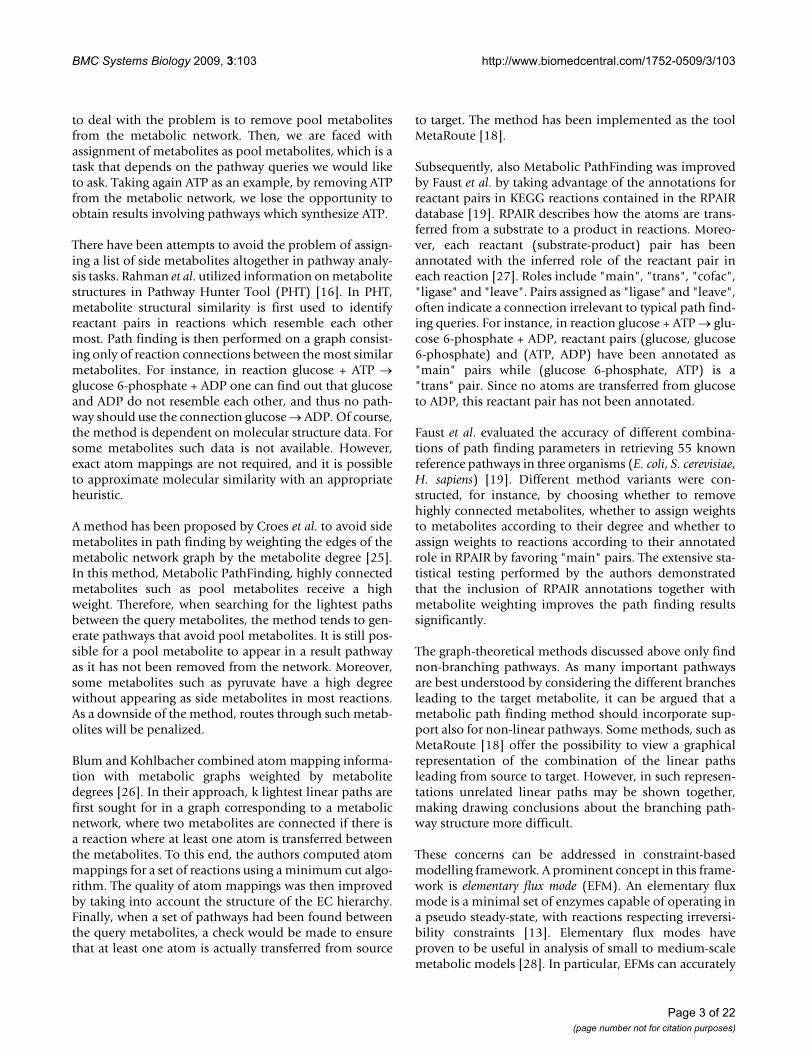
Proof. We show that Find-Minimal-Pathway is NP-hard[40] by a reduction from the Minimum-Set-Cover prob-lem. Let be a collection of subsets of a finite set . In
Minimum-Set-Cover, we seek the minimal subset ⊆
such that every element in belongs to at least one mem-
ber in . Now, we construct an instance of the Find-Min-
imal-Pathway problem as follows. For each element si ∈
, we assign two atoms ai, into A. We then assign a
reaction ri to R for each subset Ci ∈ such that Γ(ri) =
{(aj, )|sj ∈ Ci}. Finally, we set S = {aj|sj ∈ Ci, Ci ∈ }, T
= { |sj ∈ Ci, Ci ∈ } and w = 1. A solution to Minimum-
Set-Cover can be reconstructed in polynomial time from
the solution to Find-Minimal-Pathway by assigning Ci ∈
for each ri ∈ P. As Minimum-Set-Cover is NP-complete
[40], it follows that Find-Minimal-Pathway is NP-hard. �
Subsequently, we can conclude that the original problemFind-Branching-Pathways is NP-hard, because we cansolve Find-Minimal-Pathway by finding the (potentiallyexponential number of) solution pathways to Find-Branching-Pathways and choosing the smallest pathway.Figure 4 illustrates how a small minimum set coverinstance is reduced into an instance of the Find-Minimal-Pathway problem.
Corollary 1. Find-Branching-Pathways is NP-hard �
When solving Find-Branching-Pathways in practice, wewould like to benefit from information from othersources to help us evaluate the pathways found. As animportant example, we discuss the use of genome-levelevidence in the pathway context in section Implementa-tion.
C S
′C C
C
′C
S ′ai
C
′a j C
′a j C
′C
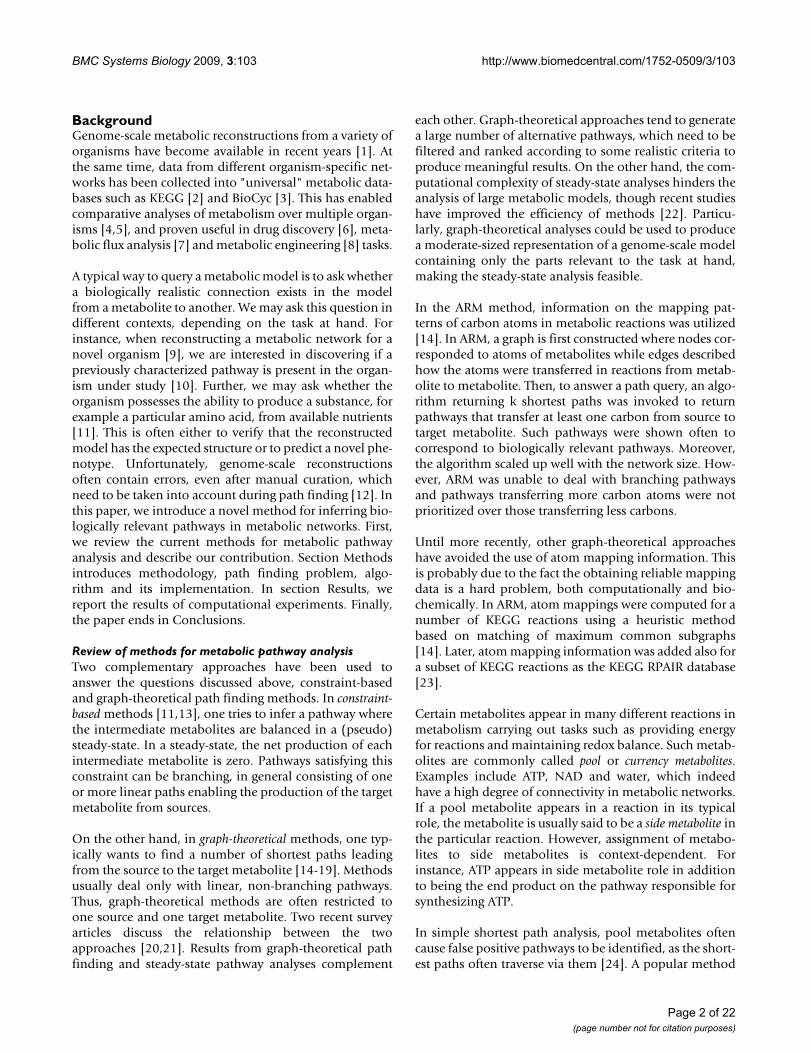
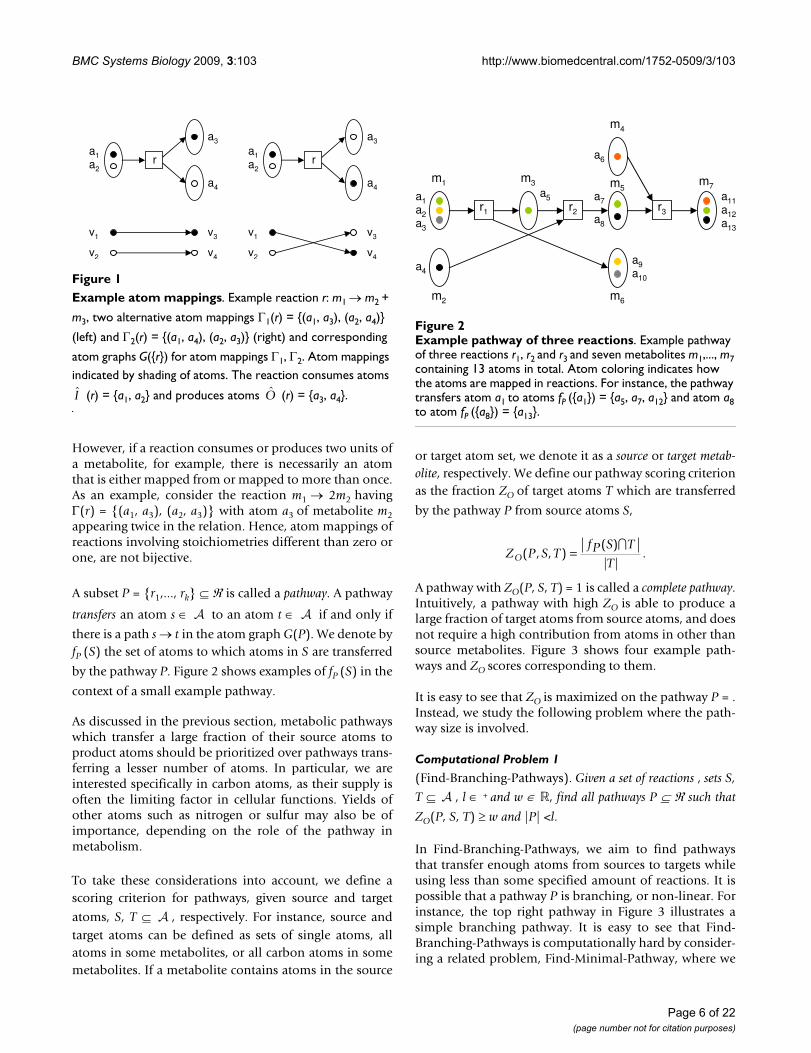
Pathway examplesFigure 3Pathway examples. Examples of four pathways and associated ZO scores. Assignment of sets S and T are indicated with dashed boxes and atom mappings with atom colorings in figure. Top left: pathway P1 = {r1, r2} transfers all three atoms in S to
T, achieving ZO (P1, S, T) = = 1. Bottom left: pathway P2 = {r3, r4} transfers green and black atoms to T. Since grey atom is not
in S, ZO (P2, S, T) = . Top right: branching pathway P3 = {r5, r6, r7, r8} transfers all atoms in S, resulting in ZO (P3, S, T) = 1. Bot-
tom right: pathway P4 = {r9, r10} transfers the only target atom from S, giving ZO(P4, S, T) = 1. However, two atoms of S are not transferred to T.
33
23
Page 7 of 22(page number not for citation purposes)
BMC Systems Biology 2009, 3:103 http://www.biomedcentral.com/1752-0509/3/103
AlgorithmDue to the computational complexity of the Find-Branch-ing-Pathways problem, we develop next an efficient heu-ristic algorithm for it.
First, we observe that to maximize ZO we should seek a
pathway that is able to transfer an atom to each targetatom from source atoms. Further, to achieve a pathwaysmaller than l reactions, we should prefer reactions whichare able to transfer many atoms at the same time. To illus-trate this, let us first define a reaction path p as a sequence
of reactions p = (r1, r2,..., rn), ri ∈ R, such that there is a path
from an atom s consumed by the first reaction, s ∈ (r1),
to an atom t produced by the last reaction, t ∈ (rn), in
the atom graph induced by the reactions in p. Clearly,such reaction path is able to transfer at least the atom s toatom t but the path may be to transfer additional atoms aswell. Analogously to the definition of a pathway, wedenote by fp(S) the set of atoms to which atoms in S can
be transferred by the reaction path p in this fashion. Asmore source atoms are transferred via a reaction path totargets, higher ZO is achieved. Thus, we observe that reac-
tion paths with large fp(S) sets should be preferred.
Second, we are able to achieve higher ZO with combina-tions of pathways. Consider a pathway P with ZO(P, S, T)< 1. Now, since not all target atoms can be transferredfrom sources, there must be a target atom t ∈ T which isnot connected by a path from any source atom in theatom graph G(P). We should thus consider an addition ofa pathway P' such that a path s → t exists in pathway P ∪P' from some s ∈ S. To minimize the size of the combinedpathway, we should utilize reactions already on the path-way P, and find an addition that is able to provide the tar-get atoms not already transferred. In particular, we shouldlook for branching points on the pathway P where anatom u in one or more substrates is not already connectedto the sources but there is a path u → t in G(P). In suchcase, connecting a source atom to u by an addition of apathway P' such that u ∈ fP'(S) guarantees that ZO(P ∪ P',S, T) > ZO(P, S, T). However, it should be noted that cer-
I
O
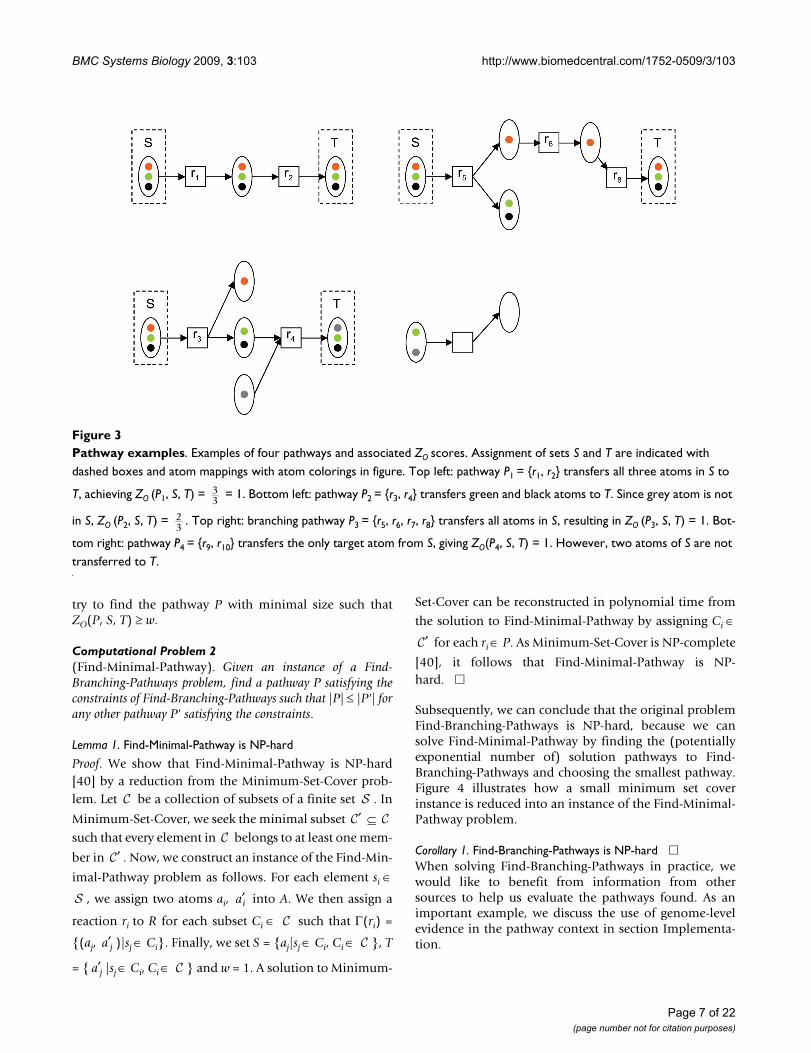
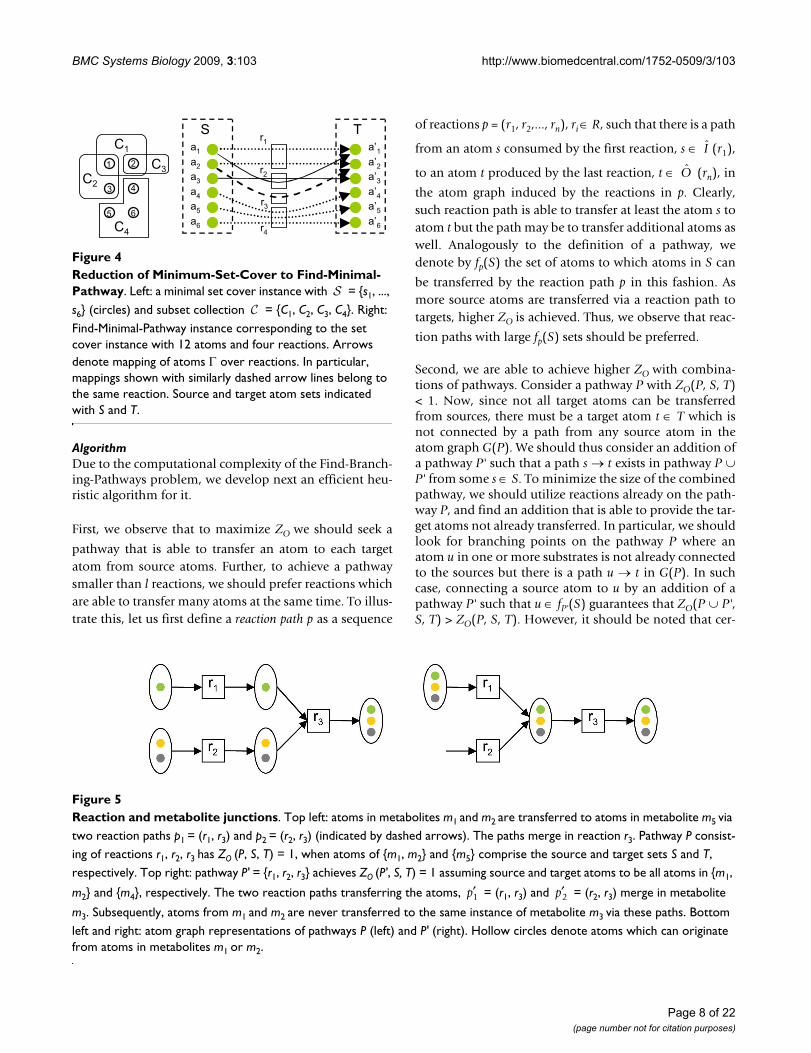
Reduction of Minimum-Set-Cover to Find-Minimal-PathwayFigure 4Reduction of Minimum-Set-Cover to Find-Minimal-Pathway. Left: a minimal set cover instance with = {s1, ..., s6} (circles) and subset collection = {C1, C2, C3, C4}. Right: Find-Minimal-Pathway instance corresponding to the set cover instance with 12 atoms and four reactions. Arrows denote mapping of atoms Γ over reactions. In particular, mappings shown with similarly dashed arrow lines belong to the same reaction. Source and target atom sets indicated with S and T.
C1
C2C3
C4
1 2
3 4
5 6
a1a2a3a4a5a6
a’1a’2a’3a’4a’5a’6
r1
r2
r4
r3
S T
S
C
Reaction and metabolite junctionsFigure 5Reaction and metabolite junctions. Top left: atoms in metabolites m1 and m2 are transferred to atoms in metabolite m5 via two reaction paths p1 = (r1, r3) and p2 = (r2, r3) (indicated by dashed arrows). The paths merge in reaction r3. Pathway P consist-ing of reactions r1, r2, r3 has ZO (P, S, T) = 1, when atoms of {m1, m2} and {m5} comprise the source and target sets S and T, respectively. Top right: pathway P' = {r1, r2, r3} achieves ZO (P', S, T) = 1 assuming source and target atoms to be all atoms in {m1,
m2} and {m4}, respectively. The two reaction paths transferring the atoms, = (r1, r3) and = (r2, r3) merge in metabolite
m3. Subsequently, atoms from m1 and m2 are never transferred to the same instance of metabolite m3 via these paths. Bottom left and right: atom graph representations of pathways P (left) and P' (right). Hollow circles denote atoms which can originate from atoms in metabolites m1 or m2.
′p1 ′p2
Page 8 of 22(page number not for citation purposes)
BMC Systems Biology 2009, 3:103 http://www.biomedcentral.com/1752-0509/3/103
tain path combinations yield pathways, where necessarilymore than one instance of target molecule is produced.Consider the two pathways illustrated in Figure 5. In thepathway on the left, two reaction paths merge in a reactionjunction. A reaction junction occurs, when two paths sharea reaction (r3 in Figure 5) but the reactions preceding theshared reaction (r1, r2) do not share any product metabo-lites. The shared reaction is then a reaction junction. In theexample presented in Figure 5, atoms in products of r1 andr2, m3 and m4 respectively, are transferred to the samemolecular instance of metabolite m5.
On the other hand, in the pathway on the right, the twopaths meet in a metabolite junction m3. A metabolite junc-tion is a metabolite shared by two paths such that bothpaths contain the same reaction consuming the metabo-lite. In Figure 5, metabolite m3 is the shared product of r1and r2. The atoms in substrates of r1 and r2 are in this casenever transferred to the same instance of m3: Instead, theatoms always end up in different molecules of m4.Although the pathway is unable to provide all sourceatoms in the same target molecule, the score ZO does notdifferentiate between these two cases. We would, how-ever, like to avoid pathways with metabolite junctions,because such pathways in reality can be split into two ormore pathways, each transferring source atoms to a singleinstance of the target metabolite.
These ideas lead into the following recursive algorithm,ReTrace, where we find paths leading to target metabolitesfrom sources in the atom graph, and combine these pathsto achieve a higher ZO score. To discover alternative path-ways, a number of paths are generated at each recursionlevel. Furthermore, in order to to reduce occurences ofmetabolite junctions, ReTrace only considers combina-tions which add reaction junctions to the pathway.
The description of the ReTrace method is divided belowinto Procedures ReTrace, FindPath and FindPathStart,where Procedure ReTrace (Table 1) prepares an atomgraph instance, Procedure FindPath (Table 2) solves Find-Branching-Pathways recursively and Procedure FindPath-Start (Table 3) finds the first node of the given path. Theoperation of ReTrace is explained with a small example inFigure 6. Procedure ReTrace first constructs the atomgraph G induced by reactions R. Nodes vΔ and vU whichrepresent all source and unresolved atoms are added to thegraph. An atom node u is unresolved, if there is no path vΔ→ u on the pathway and addition of a such path wouldcreate a path vΔ → t to some t ∈ T for which no pathalready existed. Each target atom is considered at this stepan unresolved node. Subsequently, the algorithmattempts to resolve the unresolved nodes by adding pathsto the pathway. Additional edges are added to G to con-nect vΔ to source atoms. Finally, Procedure FindPath is
called, which recursively adds paths to the pathway untilall nodes have been resolved or there are no more paths toadd which would resolve nodes.
In Procedure FindPath, the graph is first set up to reflectthe current set of unresolved nodes by adding edges (vu,vU) for each u ∈ U . Then, the algorithm computes k short-est simple paths from vΔ to vU in the atom graph G by callingthe subroutine FindKShortestSimpleAtomPaths. A simple(or acyclic) path is a path where no node is repeated. Toimplement FindKShortestSimplePaths, any algorithmdeveloped for the k shortest simple path problem [35] canbe used. For instance, Yen's algorithm takes O(kn(m + nlog n)) time to compute k shortest simple paths in a graphwith n nodes and m edges [34]. After the shortest pathshave been computed, the graph is restored by deleting theedges added in step 1. By finding paths from vΔ to vU,ReTrace aims to discover additions to the current pathwayP which would increase the ZO score. Further, the addi-tions should be as small as possible because of the maxi-mum pathway size constraint. To this end, ReTracecomputes explicitly simple paths in contrast to findingshortest paths where cycles are allowed: a cyclic path canalways be transformed into a smaller acyclic path whichtransfers the same set of atoms from sources to target asthe cyclic path.
Note that algorithms for the more general case of comput-ing of k shortest paths which are allowed to be cyclic, areconsiderably faster than algorithms for computing onlythe simple paths. For instance, the running times of Epp-stein's algorithm [35] and REA [41] are O(m + n log n + k
log k) and O(m + kn log ( )), respectively. However,
because the atom graphs considered in this study containcycles, we would have to remove cyclic paths from thepathways returned by the k shortest path algorithm. Fur-thermore, to compensate for the cyclic pathways gener-ated, we would have to increase the number of shortestpaths computed at each step according to the expectednumber of acyclic paths. Due to these considerations, wehave adopted Yen's algorithm in our current implementa-tion of ReTrace.
Then, the reactions involved in the shortest atom path Q
are assigned as the reaction set P' in step 5. Function Γ-1 :
× → ℜ gives each atom graph edge the reaction thatinduced the edge. Each set P' is considered as an additionto the current pathway P in steps 5-14. If the combined
pathway P ∪ P' meets the ZO and pathway size require-
ments, and it has not been already generated, it is reportedas a result. The computation of ZO score of the current
mn
A A
Page 9 of 22(page number not for citation purposes)
BMC Systems Biology 2009, 3:103 http://www.biomedcentral.com/1752-0509/3/103
Page 10 of 22(page number not for citation purposes)
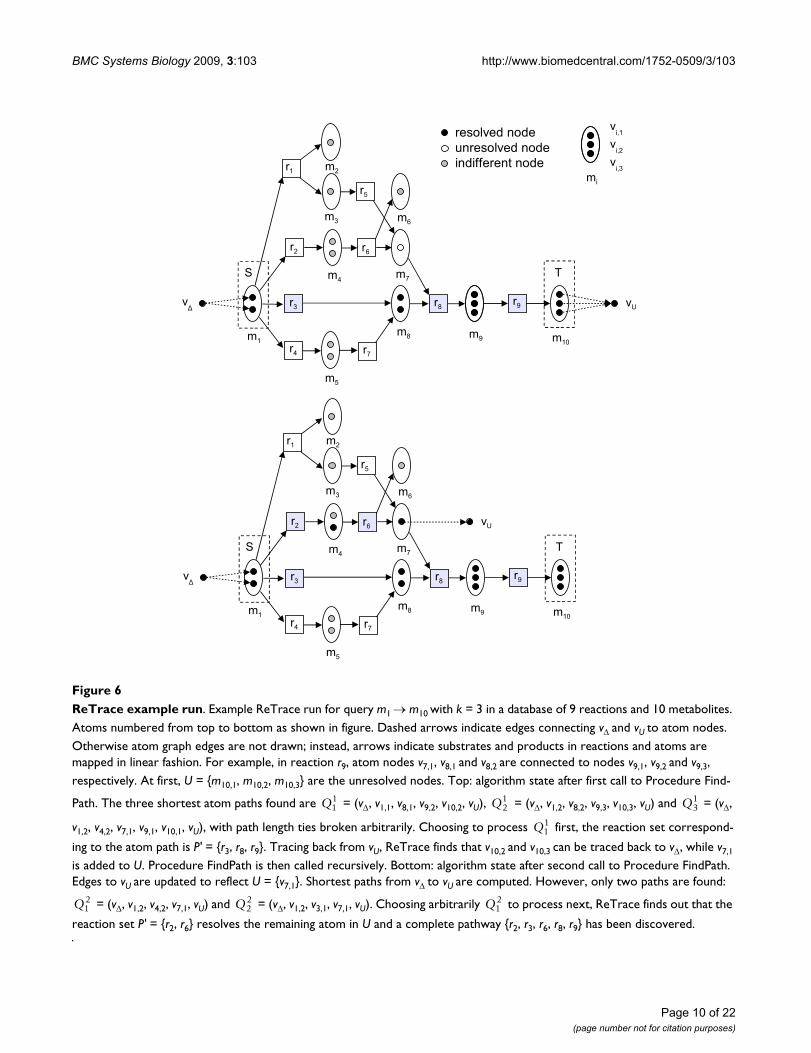
ReTrace example runFigure 6ReTrace example run. Example ReTrace run for query m1 → m10 with k = 3 in a database of 9 reactions and 10 metabolites. Atoms numbered from top to bottom as shown in figure. Dashed arrows indicate edges connecting vΔ and vU to atom nodes. Otherwise atom graph edges are not drawn; instead, arrows indicate substrates and products in reactions and atoms are mapped in linear fashion. For example, in reaction r9, atom nodes v7,1, v8,1 and v8,2 are connected to nodes v9,1, v9,2 and v9,3, respectively. At first, U = {m10,1, m10,2, m10,3} are the unresolved nodes. Top: algorithm state after first call to Procedure Find-
Path. The three shortest atom paths found are = (vΔ, v1,1, v8,1, v9,2, v10,2, vU), = (vΔ, v1,2, v8,2, v9,3, v10,3, vU) and = (vΔ,
v1,2, v4,2, v7,1, v9,1, v10,1, vU), with path length ties broken arbitrarily. Choosing to process first, the reaction set correspond-
ing to the atom path is P' = {r3, r8, r9}. Tracing back from vU, ReTrace finds that v10,2 and v10,3 can be traced back to vΔ, while v7,1
is added to U. Procedure FindPath is then called recursively. Bottom: algorithm state after second call to Procedure FindPath. Edges to vU are updated to reflect U = {v7,1}. Shortest paths from vΔ to vU are computed. However, only two paths are found:
= (vΔ, v1,2, v4,2, v7,1, vU) and = (vΔ, v1,2, v3,1, v7,1, vU). Choosing arbitrarily to process next, ReTrace finds out that the
reaction set P' = {r2, r6} resolves the remaining atom in U and a complete pathway {r2, r3, r6, r8, r9} has been discovered.
�� ��
� �
��
���
� ��
��
�
�� ��
��
�
��
�
�
��
��
�� ���
��������������������������������������������
�� ��
� �
��
���
� ��
��
�
��
��
��
�
��
�
�
��
��
�� �����
��
����
���
����
��
Q11 Q2
1 Q31
Q11
Q12 Q2
2 Q12
BMC Systems Biology 2009, 3:103 http://www.biomedcentral.com/1752-0509/3/103
pathway in step 6 can be done in O(|P ∪ P'|) = O(n) timeby breadth-first search in the atom graph G. Next, thealgorithm considers the atoms which remain unresolvedafter addition of path P'. In steps 9-12, the algorithm back-
tracks from each atom u ∈ U using the Procedure Find-PathStart and checks whether path P' transfers a sourceatom to u. If this is not true, the atom u is an unresolvedatom.
Lastly, in step 14, FindPath is called recursively to findadditions to the pathway P ∪ P' by looking for paths fromvΔ to the new set of unresolved nodes U '. The recursiondepth is at most |T|, because during each call at least oneunresolved atom is resolved, at most one atom is added tothe set U' per atom u ∈ U and U = T at depth 1. As a max-imum of k paths is generated in each FindPath call, andFindPath is recursively called at most once for each, intotal FindPath is called O(k|T|) times.
Lemma 2ReTrace takes O(k|T|(n(m + n log n) + |T|)) time, assumingYen's k shortest simple paths algorithm in step 2 of ProcedureFindPath. �
ImplementationWe have implemented ReTrace in Python [38] as a com-mand-line program. The software is freely available for
academic use at http://www.cs.helsinki.fi/group/sysfys/software/retrace. Implementation details and user guideare available in Additional file 1 and in the above webpage.
ReTrace requires that Python 2.5 has been installed. Inaddition, if available, ReTrace calls Graphviz dot toolhttp://www.graphviz.org/ to draw the pathway diagrams.Internet connection is recommended, because an externalweb program [42] is called to draw molecule structures.Finally, ReTrace assumes that a local install of the KEGGLIGAND database in flatfile format is available.
Our implementation of ReTrace utilizes atom mappingdata from the KEGG RPAIR database. During startup,ReTrace parses RPAIR entries and constructs an atomgraph corresponding to the data. Details on atom graphconstruction are given in Additional file 1.
The atom graph constructed is unweighted by default. It ispossible to assign weights to atom graph edges by a com-mand line option. Three weighting schemes are currentlysupported: unweighted, RPAIR size-weighted and reactionscore weighted. In RPAIR size-weighting, edges from sub-
strate atoms to RPAIR nodes are assigned weight ,
where α is the number of atoms mapped by the RPAIRassociated with the edge. Edges from RPAIR nodes toproduct atoms are assigned weight 0. For instance, if anRPAIR entry maps six atoms from a substrate to a product,then the six edges from substrate atoms to RPAIR nodes
each receive the weight , while the edges from RPAIR
nodes to product atoms receive weights 0. Thus, in RPAIRsize-weighted graphs, path finding tends to favor path-
1α
16
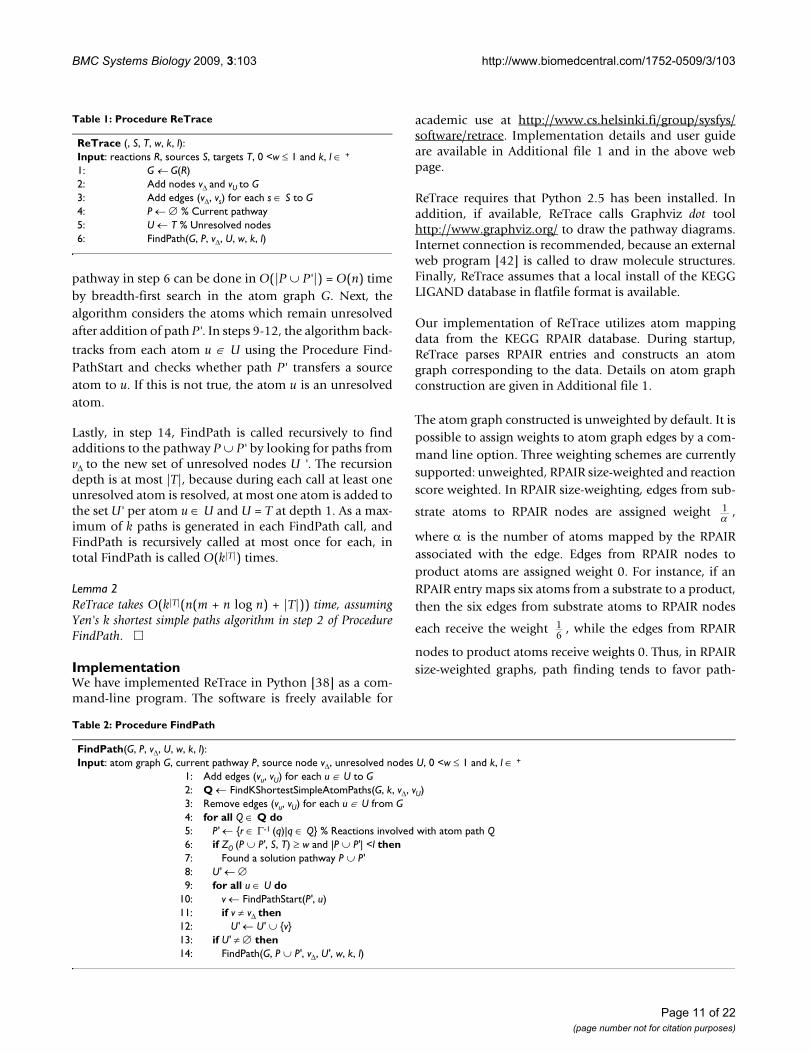
Table 1: Procedure ReTrace
ReTrace (, S, T, w, k, l):Input: reactions R, sources S, targets T, 0 <w ≤ 1 and k, l ∈ +
1: G ← G(R)2: Add nodes vΔ and vU to G3: Add edges (vΔ, vs) for each s ∈ S to G4: P ← ∅ % Current pathway5: U ← T % Unresolved nodes6: FindPath(G, P, vΔ, U, w, k, l)
Table 2: Procedure FindPath
FindPath(G, P, vΔ, U, w, k, l):Input: atom graph G, current pathway P, source node vΔ, unresolved nodes U, 0 <w ≤ 1 and k, l ∈ +
1: Add edges (vu, vU) for each u ∈ U to G2: Q ← FindKShortestSimpleAtomPaths(G, k, vΔ, vU)3: Remove edges (vu, vU) for each u ∈ U from G4: for all Q ∈ Q do5: P' ← {r ∈ Γ-1 (q)|q ∈ Q} % Reactions involved with atom path Q6: if ZO (P ∪ P', S, T) ≥ w and |P ∪ P'| <l then7: Found a solution pathway P ∪ P'8: U' ← ∅9: for all u ∈ U do
10: v ← FindPathStart(P', u)11: if v ≠ vΔ then12: U' ← U' ∪ {v}13: if U' ≠ ∅ then14: FindPath(G, P ∪ P', vΔ, U', w, k, l)
Page 11 of 22(page number not for citation purposes)
BMC Systems Biology 2009, 3:103 http://www.biomedcentral.com/1752-0509/3/103
ways which utilize reactions where a large number ofatoms are transferred at the same time.
ReTrace supports also the option of specifying arbitraryscores C(r) to reactions. The edges are assigned weights
, where is the highest-scoring reaction associ-
ated with the edge and β is a constant.
Therefore, a reaction having a high score causes atomgraph edges corresponding to the reaction to receive a lowweight, increasing chances that shortest paths visit itsedges, and finally, that the reaction appears in result path-ways.
Reaction scores provide a mechanism to easily incorpo-rate measurement data to guide pathway search. In sec-tion Results, we discuss the application of ReTrace inreconstructing biosynthesis pathways on basis of genomicevidence.
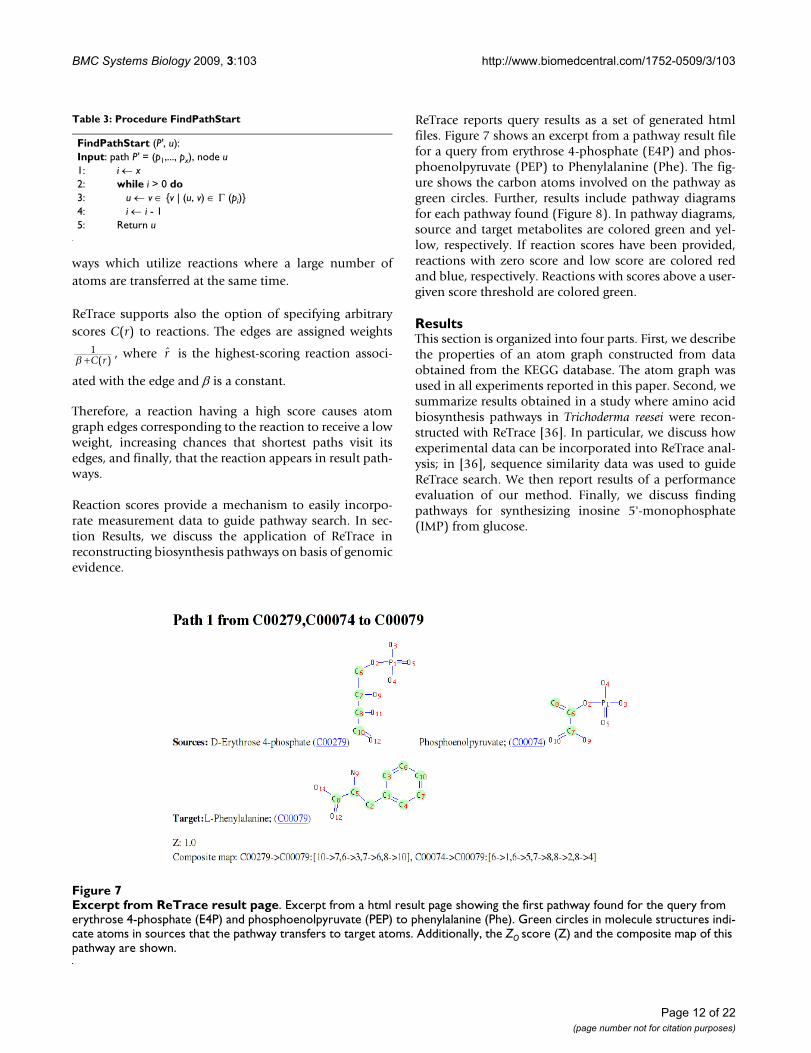
ReTrace reports query results as a set of generated htmlfiles. Figure 7 shows an excerpt from a pathway result filefor a query from erythrose 4-phosphate (E4P) and phos-phoenolpyruvate (PEP) to Phenylalanine (Phe). The fig-ure shows the carbon atoms involved on the pathway asgreen circles. Further, results include pathway diagramsfor each pathway found (Figure 8). In pathway diagrams,source and target metabolites are colored green and yel-low, respectively. If reaction scores have been provided,reactions with zero score and low score are colored redand blue, respectively. Reactions with scores above a user-given score threshold are colored green.
ResultsThis section is organized into four parts. First, we describethe properties of an atom graph constructed from dataobtained from the KEGG database. The atom graph wasused in all experiments reported in this paper. Second, wesummarize results obtained in a study where amino acidbiosynthesis pathways in Trichoderma reesei were recon-structed with ReTrace [36]. In particular, we discuss howexperimental data can be incorporated into ReTrace anal-ysis; in [36], sequence similarity data was used to guideReTrace search. We then report results of a performanceevaluation of our method. Finally, we discuss findingpathways for synthesizing inosine 5'-monophosphate(IMP) from glucose.
1β +C r( )
r
Table 3: Procedure FindPathStart
FindPathStart (P', u):Input: path P' = (p1,..., px), node u1: i ← x2: while i > 0 do3: u ← v ∈ {v | (u, v) ∈ Γ (pi)}4: i ← i - 15: Return u
Excerpt from ReTrace result pageFigure 7Excerpt from ReTrace result page. Excerpt from a html result page showing the first pathway found for the query from erythrose 4-phosphate (E4P) and phosphoenolpyruvate (PEP) to phenylalanine (Phe). Green circles in molecule structures indi-cate atoms in sources that the pathway transfers to target atoms. Additionally, the ZO score (Z) and the composite map of this pathway are shown.
Page 12 of 22(page number not for citation purposes)
BMC Systems Biology 2009, 3:103 http://www.biomedcentral.com/1752-0509/3/103
Atom graph construction from KEGG RPAIRWe constructed an atom graph corresponding to 7781reactions in the March 2009 version of KEGG LIGAND[2]. The atom graph was constructed by considering the11265 entries in the KEGG RPAIR subdatabase. EachRPAIR entry specifies an atom mapping for a reactant pair,or substrate and product, in one or more reactions. Forinstance, RPAIR entry RP00001 describes the mapping of
atoms between NADPH and NADP+ in those 815 reac-tions, where the mapping for this reactant pair is identical.A total of 140 RPAIR entries where two or more entrieswere found to refer to the same atom number by differenttype (e.g., carbon vs nitrogen) were discarded from furtheranalysis. Unfortunately, the RPAIR data fails to map manyreactions with non-1-0-stoichiometries correctly, map-ping usually only one instance of reactants and leaving
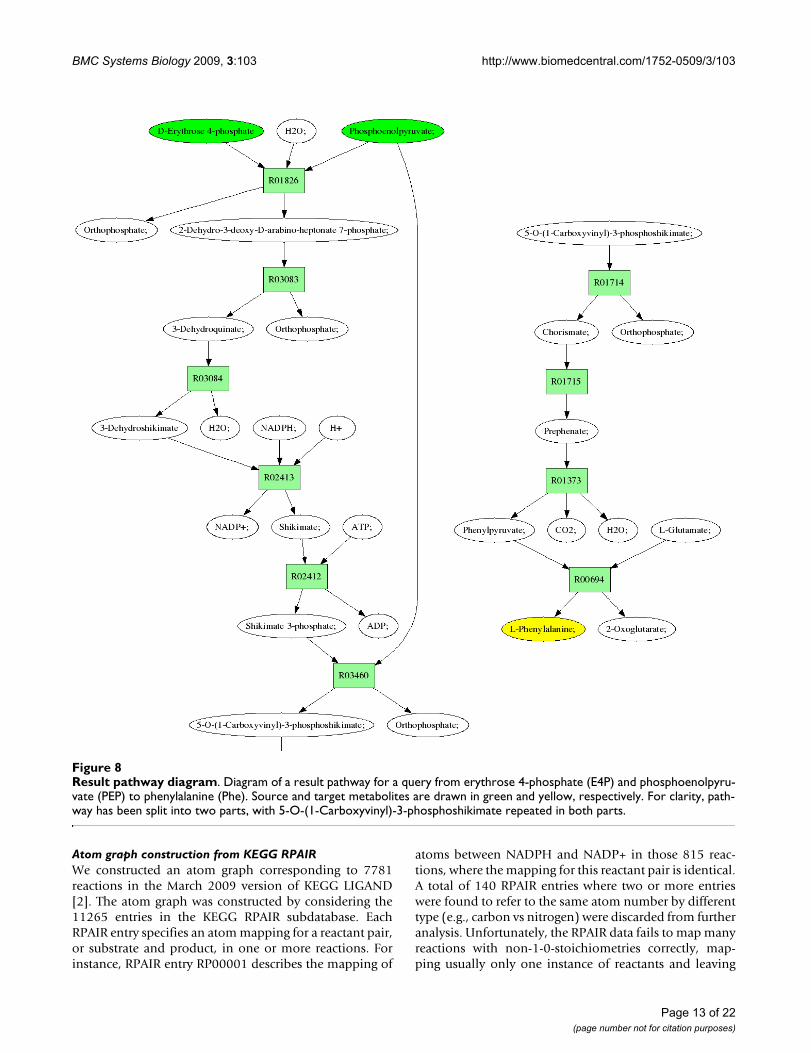
Result pathway diagramFigure 8Result pathway diagram. Diagram of a result pathway for a query from erythrose 4-phosphate (E4P) and phosphoenolpyru-vate (PEP) to phenylalanine (Phe). Source and target metabolites are drawn in green and yellow, respectively. For clarity, path-way has been split into two parts, with 5-O-(1-Carboxyvinyl)-3-phosphoshikimate repeated in both parts.
Page 13 of 22(page number not for citation purposes)
BMC Systems Biology 2009, 3:103 http://www.biomedcentral.com/1752-0509/3/103
others unmapped. Confronted with such cases, ReTracefails to find pathways utilizing the unmapped portions ofthe reactions.
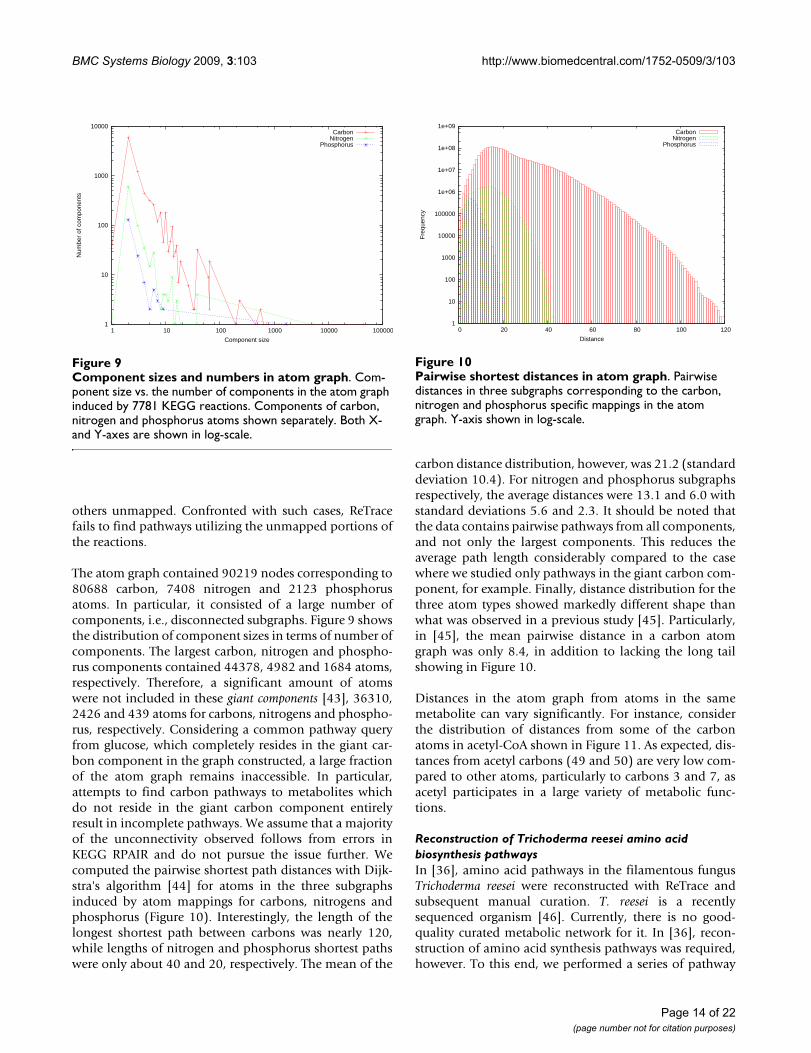
The atom graph contained 90219 nodes corresponding to80688 carbon, 7408 nitrogen and 2123 phosphorusatoms. In particular, it consisted of a large number ofcomponents, i.e., disconnected subgraphs. Figure 9 showsthe distribution of component sizes in terms of number ofcomponents. The largest carbon, nitrogen and phospho-rus components contained 44378, 4982 and 1684 atoms,respectively. Therefore, a significant amount of atomswere not included in these giant components [43], 36310,2426 and 439 atoms for carbons, nitrogens and phospho-rus, respectively. Considering a common pathway queryfrom glucose, which completely resides in the giant car-bon component in the graph constructed, a large fractionof the atom graph remains inaccessible. In particular,attempts to find carbon pathways to metabolites whichdo not reside in the giant carbon component entirelyresult in incomplete pathways. We assume that a majorityof the unconnectivity observed follows from errors inKEGG RPAIR and do not pursue the issue further. Wecomputed the pairwise shortest path distances with Dijk-stra's algorithm [44] for atoms in the three subgraphsinduced by atom mappings for carbons, nitrogens andphosphorus (Figure 10). Interestingly, the length of thelongest shortest path between carbons was nearly 120,while lengths of nitrogen and phosphorus shortest pathswere only about 40 and 20, respectively. The mean of the
carbon distance distribution, however, was 21.2 (standarddeviation 10.4). For nitrogen and phosphorus subgraphsrespectively, the average distances were 13.1 and 6.0 withstandard deviations 5.6 and 2.3. It should be noted thatthe data contains pairwise pathways from all components,and not only the largest components. This reduces theaverage path length considerably compared to the casewhere we studied only pathways in the giant carbon com-ponent, for example. Finally, distance distribution for thethree atom types showed markedly different shape thanwhat was observed in a previous study [45]. Particularly,in [45], the mean pairwise distance in a carbon atomgraph was only 8.4, in addition to lacking the long tailshowing in Figure 10.
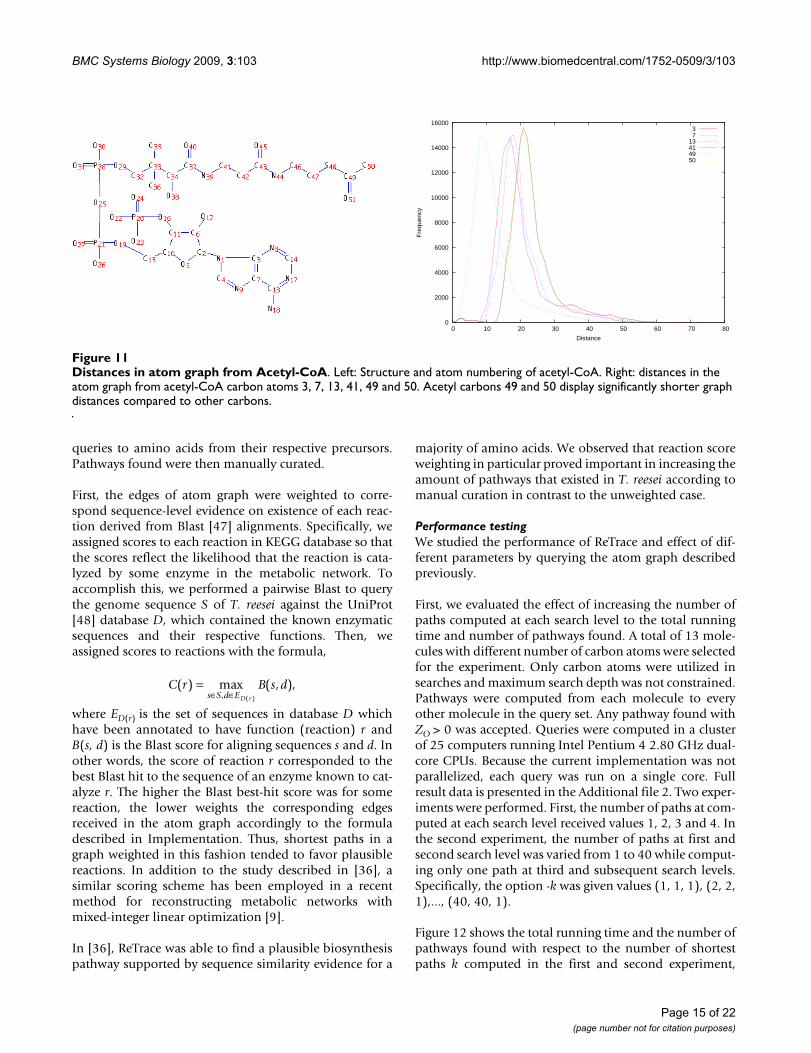
Distances in the atom graph from atoms in the samemetabolite can vary significantly. For instance, considerthe distribution of distances from some of the carbonatoms in acetyl-CoA shown in Figure 11. As expected, dis-tances from acetyl carbons (49 and 50) are very low com-pared to other atoms, particularly to carbons 3 and 7, asacetyl participates in a large variety of metabolic func-tions.
Reconstruction of Trichoderma reesei amino acid biosynthesis pathwaysIn [36], amino acid pathways in the filamentous fungusTrichoderma reesei were reconstructed with ReTrace andsubsequent manual curation. T. reesei is a recentlysequenced organism [46]. Currently, there is no good-quality curated metabolic network for it. In [36], recon-struction of amino acid synthesis pathways was required,however. To this end, we performed a series of pathway
Component sizes and numbers in atom graphFigure 9Component sizes and numbers in atom graph. Com-ponent size vs. the number of components in the atom graph induced by 7781 KEGG reactions. Components of carbon, nitrogen and phosphorus atoms shown separately. Both X- and Y-axes are shown in log-scale.
1
10
100
1000
10000
1 10 100 1000 10000 100000
Num
ber
of c
ompo
nent
s
Component size
CarbonNitrogen
Phosphorus
Pairwise shortest distances in atom graphFigure 10Pairwise shortest distances in atom graph. Pairwise distances in three subgraphs corresponding to the carbon, nitrogen and phosphorus specific mappings in the atom graph. Y-axis shown in log-scale.
1
10
100
1000
10000
100000
1e+06
1e+07
1e+08
1e+09
0 20 40 60 80 100 120
Fre
quen
cy
Distance
CarbonNitrogen
Phosphorus
Page 14 of 22(page number not for citation purposes)
BMC Systems Biology 2009, 3:103 http://www.biomedcentral.com/1752-0509/3/103
queries to amino acids from their respective precursors.Pathways found were then manually curated.
First, the edges of atom graph were weighted to corre-spond sequence-level evidence on existence of each reac-tion derived from Blast [47] alignments. Specifically, weassigned scores to each reaction in KEGG database so thatthe scores reflect the likelihood that the reaction is cata-lyzed by some enzyme in the metabolic network. Toaccomplish this, we performed a pairwise Blast to querythe genome sequence S of T. reesei against the UniProt[48] database D, which contained the known enzymaticsequences and their respective functions. Then, weassigned scores to reactions with the formula,
where ED(r) is the set of sequences in database D whichhave been annotated to have function (reaction) r andB(s, d) is the Blast score for aligning sequences s and d. Inother words, the score of reaction r corresponded to thebest Blast hit to the sequence of an enzyme known to cat-alyze r. The higher the Blast best-hit score was for somereaction, the lower weights the corresponding edgesreceived in the atom graph accordingly to the formuladescribed in Implementation. Thus, shortest paths in agraph weighted in this fashion tended to favor plausiblereactions. In addition to the study described in [36], asimilar scoring scheme has been employed in a recentmethod for reconstructing metabolic networks withmixed-integer linear optimization [9].
In [36], ReTrace was able to find a plausible biosynthesispathway supported by sequence similarity evidence for a
majority of amino acids. We observed that reaction scoreweighting in particular proved important in increasing theamount of pathways that existed in T. reesei according tomanual curation in contrast to the unweighted case.
Performance testingWe studied the performance of ReTrace and effect of dif-ferent parameters by querying the atom graph describedpreviously.
First, we evaluated the effect of increasing the number ofpaths computed at each search level to the total runningtime and number of pathways found. A total of 13 mole-cules with different number of carbon atoms were selectedfor the experiment. Only carbon atoms were utilized insearches and maximum search depth was not constrained.Pathways were computed from each molecule to everyother molecule in the query set. Any pathway found withZO > 0 was accepted. Queries were computed in a clusterof 25 computers running Intel Pentium 4 2.80 GHz dual-core CPUs. Because the current implementation was notparallelized, each query was run on a single core. Fullresult data is presented in the Additional file 2. Two exper-iments were performed. First, the number of paths at com-puted at each search level received values 1, 2, 3 and 4. Inthe second experiment, the number of paths at first andsecond search level was varied from 1 to 40 while comput-ing only one path at third and subsequent search levels.Specifically, the option -k was given values (1, 1, 1), (2, 2,1),..., (40, 40, 1).
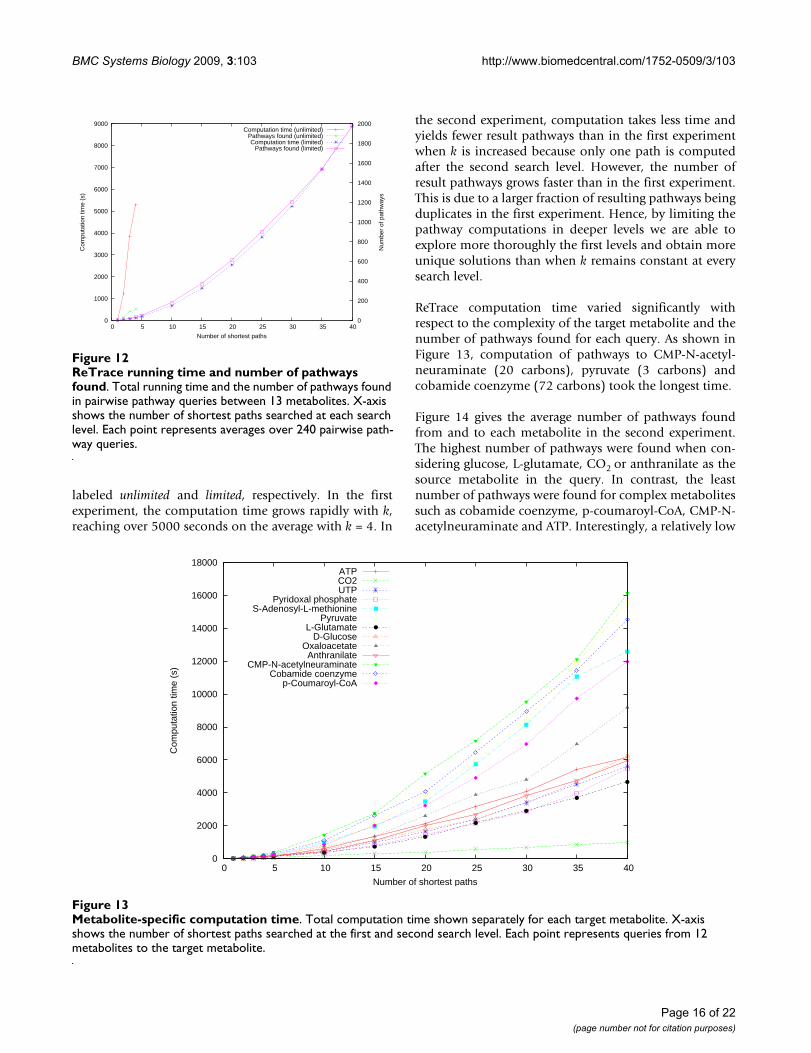
Figure 12 shows the total running time and the number ofpathways found with respect to the number of shortestpaths k computed in the first and second experiment,
C r B s ds S d ED r
( ) max ( , ),, ( )
=∈ ∈
Distances in atom graph from Acetyl-CoAFigure 11Distances in atom graph from Acetyl-CoA. Left: Structure and atom numbering of acetyl-CoA. Right: distances in the atom graph from acetyl-CoA carbon atoms 3, 7, 13, 41, 49 and 50. Acetyl carbons 49 and 50 display significantly shorter graph distances compared to other carbons.
0
2000
4000
6000
8000
10000
12000
14000
16000
0 10 20 30 40 50 60 70 80
Fre
quen
cy
Distance
37
13414950
Page 15 of 22(page number not for citation purposes)
BMC Systems Biology 2009, 3:103 http://www.biomedcentral.com/1752-0509/3/103
labeled unlimited and limited, respectively. In the firstexperiment, the computation time grows rapidly with k,reaching over 5000 seconds on the average with k = 4. In
the second experiment, computation takes less time andyields fewer result pathways than in the first experimentwhen k is increased because only one path is computedafter the second search level. However, the number ofresult pathways grows faster than in the first experiment.This is due to a larger fraction of resulting pathways beingduplicates in the first experiment. Hence, by limiting thepathway computations in deeper levels we are able toexplore more thoroughly the first levels and obtain moreunique solutions than when k remains constant at everysearch level.
ReTrace computation time varied significantly withrespect to the complexity of the target metabolite and thenumber of pathways found for each query. As shown inFigure 13, computation of pathways to CMP-N-acetyl-neuraminate (20 carbons), pyruvate (3 carbons) andcobamide coenzyme (72 carbons) took the longest time.
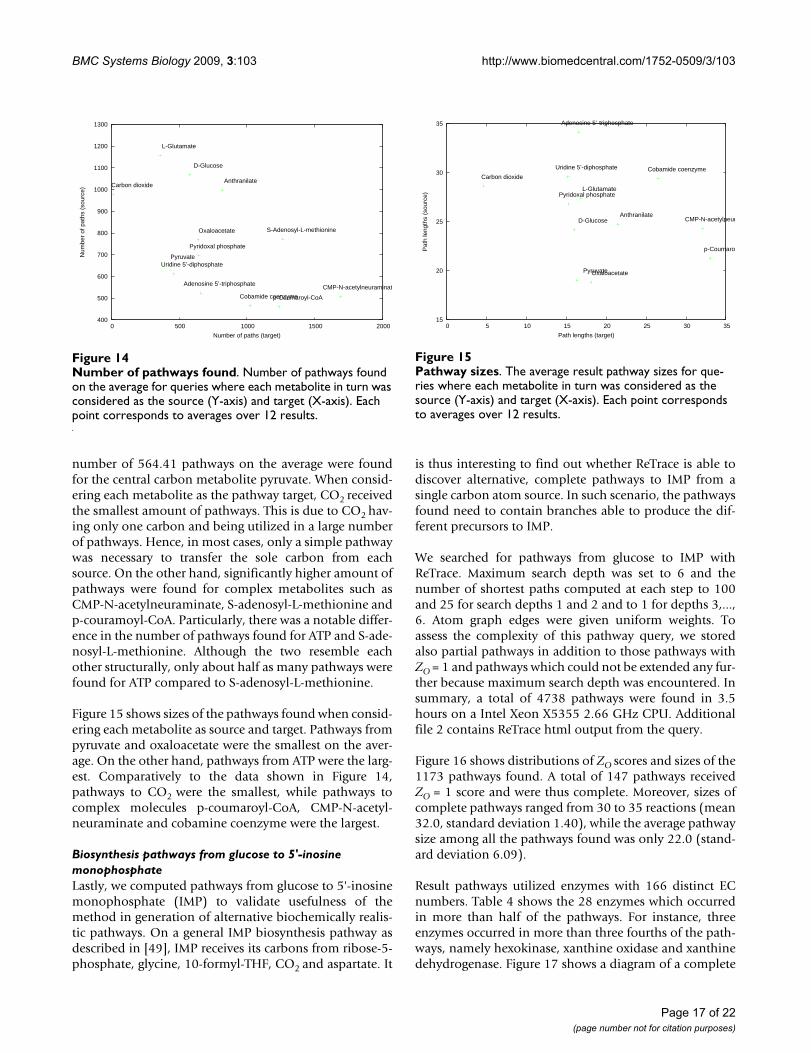
Figure 14 gives the average number of pathways foundfrom and to each metabolite in the second experiment.The highest number of pathways were found when con-sidering glucose, L-glutamate, CO2 or anthranilate as thesource metabolite in the query. In contrast, the leastnumber of pathways were found for complex metabolitessuch as cobamide coenzyme, p-coumaroyl-CoA, CMP-N-acetylneuraminate and ATP. Interestingly, a relatively low
ReTrace running time and number of pathways foundFigure 12ReTrace running time and number of pathways found. Total running time and the number of pathways found in pairwise pathway queries between 13 metabolites. X-axis shows the number of shortest paths searched at each search level. Each point represents averages over 240 pairwise path-way queries.
0
1000
2000
3000
4000
5000
6000
7000
8000
9000
0 5 10 15 20 25 30 35 40 0
200
400
600
800
1000
1200
1400
1600
1800
2000
Com
puta
tion
time
(s)
Num
ber
of p
athw
ays
Number of shortest paths
Computation time (unlimited)Pathways found (unlimited)Computation time (limited)
Pathways found (limited)
Metabolite-specific computation timeFigure 13Metabolite-specific computation time. Total computation time shown separately for each target metabolite. X-axis shows the number of shortest paths searched at the first and second search level. Each point represents queries from 12 metabolites to the target metabolite.
0
2000
4000
6000
8000
10000
12000
14000
16000
18000
0 5 10 15 20 25 30 35 40
Com
puta
tion
time
(s)
Number of shortest paths
ATPCO2UTP
Pyridoxal phosphateS-Adenosyl-L-methionine
PyruvateL-Glutamate
D-GlucoseOxaloacetate
AnthranilateCMP-N-acetylneuraminate
Cobamide coenzymep-Coumaroyl-CoA
Page 16 of 22(page number not for citation purposes)
BMC Systems Biology 2009, 3:103 http://www.biomedcentral.com/1752-0509/3/103
number of 564.41 pathways on the average were foundfor the central carbon metabolite pyruvate. When consid-ering each metabolite as the pathway target, CO2 receivedthe smallest amount of pathways. This is due to CO2 hav-ing only one carbon and being utilized in a large numberof pathways. Hence, in most cases, only a simple pathwaywas necessary to transfer the sole carbon from eachsource. On the other hand, significantly higher amount ofpathways were found for complex metabolites such asCMP-N-acetylneuraminate, S-adenosyl-L-methionine andp-couramoyl-CoA. Particularly, there was a notable differ-ence in the number of pathways found for ATP and S-ade-nosyl-L-methionine. Although the two resemble eachother structurally, only about half as many pathways werefound for ATP compared to S-adenosyl-L-methionine.
Figure 15 shows sizes of the pathways found when consid-ering each metabolite as source and target. Pathways frompyruvate and oxaloacetate were the smallest on the aver-age. On the other hand, pathways from ATP were the larg-est. Comparatively to the data shown in Figure 14,pathways to CO2 were the smallest, while pathways tocomplex molecules p-coumaroyl-CoA, CMP-N-acetyl-neuraminate and cobamine coenzyme were the largest.
Biosynthesis pathways from glucose to 5'-inosine monophosphateLastly, we computed pathways from glucose to 5'-inosinemonophosphate (IMP) to validate usefulness of themethod in generation of alternative biochemically realis-tic pathways. On a general IMP biosynthesis pathway asdescribed in [49], IMP receives its carbons from ribose-5-phosphate, glycine, 10-formyl-THF, CO2 and aspartate. It
is thus interesting to find out whether ReTrace is able todiscover alternative, complete pathways to IMP from asingle carbon atom source. In such scenario, the pathwaysfound need to contain branches able to produce the dif-ferent precursors to IMP.
We searched for pathways from glucose to IMP withReTrace. Maximum search depth was set to 6 and thenumber of shortest paths computed at each step to 100and 25 for search depths 1 and 2 and to 1 for depths 3,...,6. Atom graph edges were given uniform weights. Toassess the complexity of this pathway query, we storedalso partial pathways in addition to those pathways withZO = 1 and pathways which could not be extended any fur-ther because maximum search depth was encountered. Insummary, a total of 4738 pathways were found in 3.5hours on a Intel Xeon X5355 2.66 GHz CPU. Additionalfile 2 contains ReTrace html output from the query.
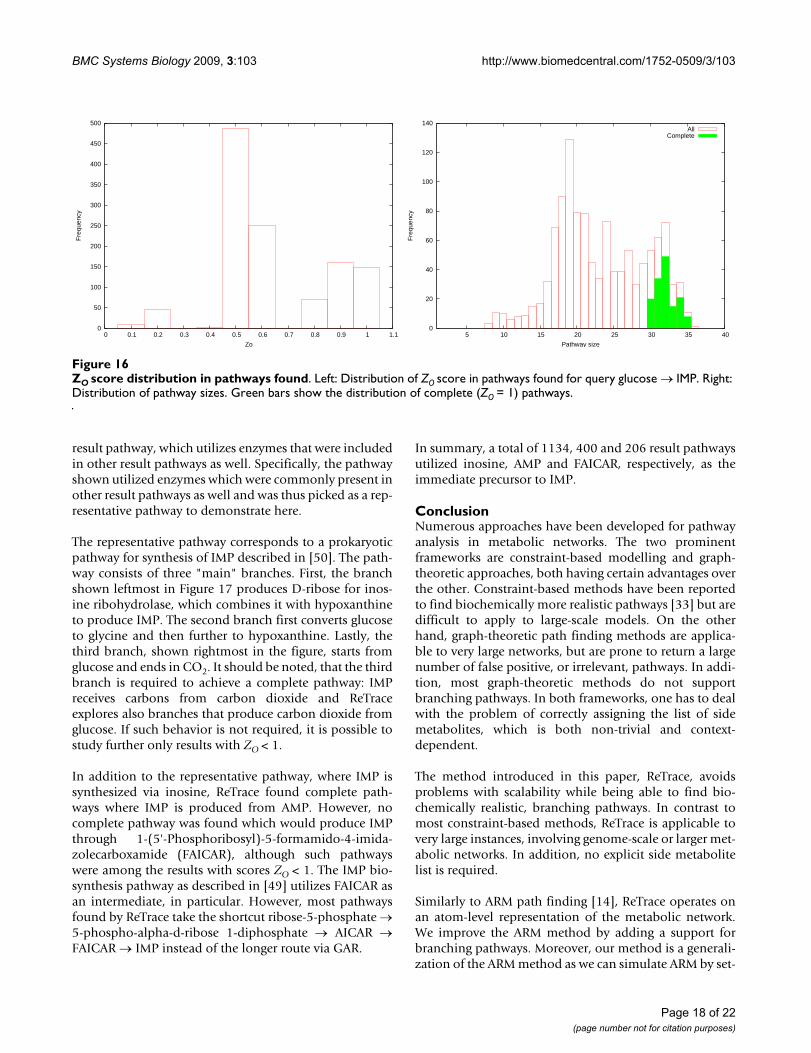
Figure 16 shows distributions of ZO scores and sizes of the1173 pathways found. A total of 147 pathways receivedZO = 1 score and were thus complete. Moreover, sizes ofcomplete pathways ranged from 30 to 35 reactions (mean32.0, standard deviation 1.40), while the average pathwaysize among all the pathways found was only 22.0 (stand-ard deviation 6.09).
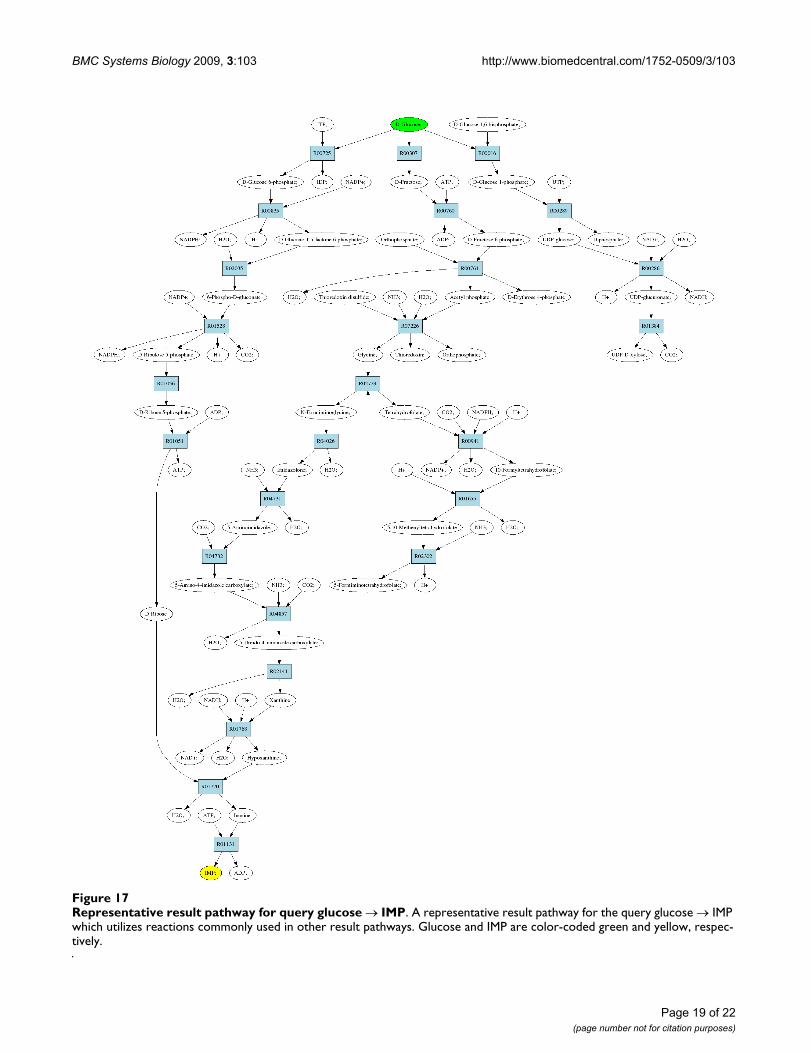
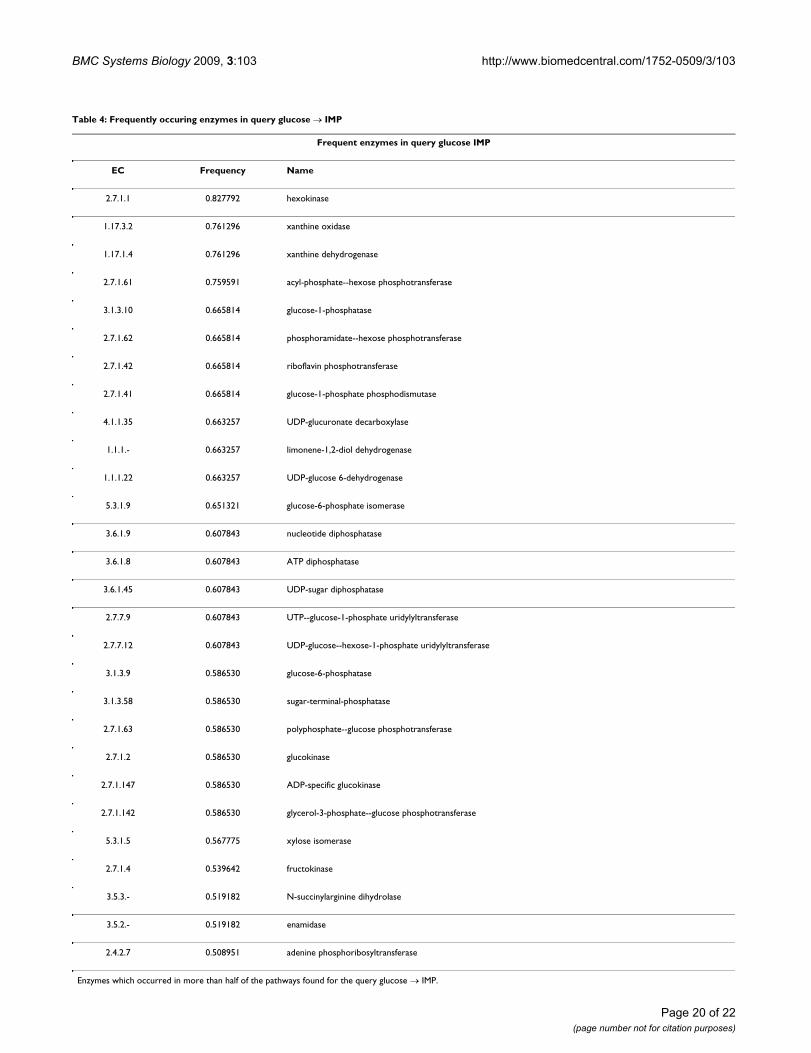
Result pathways utilized enzymes with 166 distinct ECnumbers. Table 4 shows the 28 enzymes which occurredin more than half of the pathways. For instance, threeenzymes occurred in more than three fourths of the path-ways, namely hexokinase, xanthine oxidase and xanthinedehydrogenase. Figure 17 shows a diagram of a complete
Number of pathways foundFigure 14Number of pathways found. Number of pathways found on the average for queries where each metabolite in turn was considered as the source (Y-axis) and target (X-axis). Each point corresponds to averages over 12 results.
400
500
600
700
800
900
1000
1100
1200
1300
0 500 1000 1500 2000
Num
ber
of p
aths
(so
urce
)
Number of paths (target)
Oxaloacetate
Carbon dioxide
p-Coumaroyl-CoA
Uridine 5’-diphosphate
L-Glutamate
D-Glucose
Pyridoxal phosphate
S-Adenosyl-L-methionine
Pyruvate
Adenosine 5’-triphosphate
Anthranilate
CMP-N-acetylneuraminate
Cobamide coenzyme
Pathway sizesFigure 15Pathway sizes. The average result pathway sizes for que-ries where each metabolite in turn was considered as the source (Y-axis) and target (X-axis). Each point corresponds to averages over 12 results.
15
20
25
30
35
0 5 10 15 20 25 30 35
Pat
h le
ngth
s (s
ourc
e)
Path lengths (target)
Oxaloacetate
Carbon dioxide
p-Coumaroy
Uridine 5’-diphosphate
L-Glutamate
D-Glucose
Pyridoxal phosphate
Pyruvate
Adenosine 5’-triphosphate
AnthranilateCMP-N-acetylneura
Cobamide coenzyme
Page 17 of 22(page number not for citation purposes)
BMC Systems Biology 2009, 3:103 http://www.biomedcentral.com/1752-0509/3/103
result pathway, which utilizes enzymes that were includedin other result pathways as well. Specifically, the pathwayshown utilized enzymes which were commonly present inother result pathways as well and was thus picked as a rep-resentative pathway to demonstrate here.
The representative pathway corresponds to a prokaryoticpathway for synthesis of IMP described in [50]. The path-way consists of three "main" branches. First, the branchshown leftmost in Figure 17 produces D-ribose for inos-ine ribohydrolase, which combines it with hypoxanthineto produce IMP. The second branch first converts glucoseto glycine and then further to hypoxanthine. Lastly, thethird branch, shown rightmost in the figure, starts fromglucose and ends in CO2. It should be noted, that the thirdbranch is required to achieve a complete pathway: IMPreceives carbons from carbon dioxide and ReTraceexplores also branches that produce carbon dioxide fromglucose. If such behavior is not required, it is possible tostudy further only results with ZO < 1.
In addition to the representative pathway, where IMP issynthesized via inosine, ReTrace found complete path-ways where IMP is produced from AMP. However, nocomplete pathway was found which would produce IMPthrough 1-(5'-Phosphoribosyl)-5-formamido-4-imida-zolecarboxamide (FAICAR), although such pathwayswere among the results with scores ZO < 1. The IMP bio-synthesis pathway as described in [49] utilizes FAICAR asan intermediate, in particular. However, most pathwaysfound by ReTrace take the shortcut ribose-5-phosphate →5-phospho-alpha-d-ribose 1-diphosphate → AICAR →FAICAR → IMP instead of the longer route via GAR.
In summary, a total of 1134, 400 and 206 result pathwaysutilized inosine, AMP and FAICAR, respectively, as theimmediate precursor to IMP.
ConclusionNumerous approaches have been developed for pathwayanalysis in metabolic networks. The two prominentframeworks are constraint-based modelling and graph-theoretic approaches, both having certain advantages overthe other. Constraint-based methods have been reportedto find biochemically more realistic pathways [33] but aredifficult to apply to large-scale models. On the otherhand, graph-theoretic path finding methods are applica-ble to very large networks, but are prone to return a largenumber of false positive, or irrelevant, pathways. In addi-tion, most graph-theoretic methods do not supportbranching pathways. In both frameworks, one has to dealwith the problem of correctly assigning the list of sidemetabolites, which is both non-trivial and context-dependent.
The method introduced in this paper, ReTrace, avoidsproblems with scalability while being able to find bio-chemically realistic, branching pathways. In contrast tomost constraint-based methods, ReTrace is applicable tovery large instances, involving genome-scale or larger met-abolic networks. In addition, no explicit side metabolitelist is required.
Similarly to ARM path finding [14], ReTrace operates onan atom-level representation of the metabolic network.We improve the ARM method by adding a support forbranching pathways. Moreover, our method is a generali-zation of the ARM method as we can simulate ARM by set-
ZO score distribution in pathways foundFigure 16ZO score distribution in pathways found. Left: Distribution of ZO score in pathways found for query glucose → IMP. Right: Distribution of pathway sizes. Green bars show the distribution of complete (ZO = 1) pathways.
0
50
100
150
200
250
300
350
400
450
500
0 0.1 0.2 0.3 0.4 0.5 0.6 0.7 0.8 0.9 1 1.1
Fre
quen
cy
Zo
0
20
40
60
80
100
120
140
5 10 15 20 25 30 35 40
Fre
quen
cy
Pathway size
AllComplete
Page 18 of 22(page number not for citation purposes)
BMC Systems Biology 2009, 3:103 http://www.biomedcentral.com/1752-0509/3/103
Page 19 of 22(page number not for citation purposes)
Representative result pathway for query glucose → IMPFigure 17Representative result pathway for query glucose → IMP. A representative result pathway for the query glucose → IMP which utilizes reactions commonly used in other result pathways. Glucose and IMP are color-coded green and yellow, respec-tively.
BMC Systems Biology 2009, 3:103 http://www.biomedcentral.com/1752-0509/3/103
Page 20 of 22(page number not for citation purposes)
Table 4: Frequently occuring enzymes in query glucose → IMP
Frequent enzymes in query glucose IMP
EC Frequency Name
2.7.1.1 0.827792 hexokinase
1.17.3.2 0.761296 xanthine oxidase
1.17.1.4 0.761296 xanthine dehydrogenase
2.7.1.61 0.759591 acyl-phosphate--hexose phosphotransferase
3.1.3.10 0.665814 glucose-1-phosphatase
2.7.1.62 0.665814 phosphoramidate--hexose phosphotransferase
2.7.1.42 0.665814 riboflavin phosphotransferase
2.7.1.41 0.665814 glucose-1-phosphate phosphodismutase
4.1.1.35 0.663257 UDP-glucuronate decarboxylase
1.1.1.- 0.663257 limonene-1,2-diol dehydrogenase
1.1.1.22 0.663257 UDP-glucose 6-dehydrogenase
5.3.1.9 0.651321 glucose-6-phosphate isomerase
3.6.1.9 0.607843 nucleotide diphosphatase
3.6.1.8 0.607843 ATP diphosphatase
3.6.1.45 0.607843 UDP-sugar diphosphatase
2.7.7.9 0.607843 UTP--glucose-1-phosphate uridylyltransferase
2.7.7.12 0.607843 UDP-glucose--hexose-1-phosphate uridylyltransferase
3.1.3.9 0.586530 glucose-6-phosphatase
3.1.3.58 0.586530 sugar-terminal-phosphatase
2.7.1.63 0.586530 polyphosphate--glucose phosphotransferase
2.7.1.2 0.586530 glucokinase
2.7.1.147 0.586530 ADP-specific glucokinase
2.7.1.142 0.586530 glycerol-3-phosphate--glucose phosphotransferase
5.3.1.5 0.567775 xylose isomerase
2.7.1.4 0.539642 fructokinase
3.5.3.- 0.519182 N-succinylarginine dihydrolase
3.5.2.- 0.519182 enamidase
2.4.2.7 0.508951 adenine phosphoribosyltransferase
Enzymes which occurred in more than half of the pathways found for the query glucose → IMP.
BMC Systems Biology 2009, 3:103 http://www.biomedcentral.com/1752-0509/3/103
ting ReTrace to find unbranched pathways only. Incontrast to MetaRoute [18] and Metabolic Pathfinding[19], ReTrace finds paths in the atom-level metabolic net-work, instead of using the indirect method of encodingmetabolite similarity into graph weights. This allowsReTrace to find pathways with net atom flow from sourcesto targets.
It should be noted that the method presented here alsogeneralizes our previous work [17], where we studiedbranching pathways in metabolic network level instead ofatom graphs. If we assign the set of target atoms to containall atoms of a metabolite instead of just atoms traced backfrom current targets, we effectively arrive at an algorithmsimilar to our previous feasible pathways algorithm. Incontrast to our previous work, the algorithm would oper-ate at atom graph level, however, arguably resulting inmore plausible results. We leave pursuing this topic asfuture work.
In this paper, we have demonstrated that ReTrace is ableto discover biochemically feasible alternative pathwaysfor complex metabolites in genome-scale networks. Fur-ther, our method has been applied to a biological prob-lem of validation of metabolic pathways in an organismlacking good-quality metabolic reconstruction, namelyTrichoderma reesei. As demonstrated in [36], the methodlends itself naturally to metabolic reconstruction when weutilize reaction scores from genomic evidence. In general,reaction scores provides a mechanism to easily incorpo-rate measurement data to guide the pathway search sup-ported by experimental data. This broadens theapplicability of ReTrace to a wide range of tasks. Forinstance, we could encode gene expression data in scoresto find pathways active in different conditions.
We also studied the properties of the atom graph con-structed from KEGG data. The pairwise distances betweenatoms were found to be significantly longer than in a pre-vious study [45]. In particular, we identified a largenumber of graph components, between which noexchange of atoms is possible. This observation warrantsa further study to find out whether the disconnectivitystems from errors in KEGG database, a biological phe-nomena, or both.
The availability and quality of atom mappings is of greatimportance to the method. Currently, methods forobtaining high-quality atom mappings are actively beinginvestigated by many groups, including ours. Fortunatelyfor applications demonstrated in this paper, we are mostlyable to ignore the problem of deciding between alterna-tive mappings stemming from apparently isomorphicfragments.
Authors' contributionsEP designed, analyzed and implemented the algorithm,performed the experiments and wrote the manuscript. PJand JR contributed to the development of the method andwriting the manuscript. PJ and EP analyzed the results ofthe glucose-IMP experiment. All authors have read andapproved the final version of the manuscript.
Additional material
AcknowledgementsWe would like to thank Ari Rantanen and Esko Ukkonen for their critical comments, and Mikko Arvas for discussion and support with the T. reesei genome. This work was supported by Academy of Finland grants 118653 (ALGODAN) and 118573 (White Biotechnology - Green Chemistry 2008-2013), and in part by the IST Programme of the European Community under PASCAL2 Network of Excellence, IST-2007-216886. This publica-tion only reflects the authors' views.
References1. Feist AM, Herrgård MJ, Thiele I, Reed JL, Palsson BO: Reconstruc-
tion of biochemical networks in microorganisms. Nat RevMicrobiol 2009, 7(2):129-143.
2. Kanehisa M, Araki M, Goto S, Hattori M, Hirakawa M, Itoh M,Katayama T, Kawashima S, Okuda S, Tokimatsu T, Yamanishi Y:KEGG for linking genomes to life and the environment.Nucleic Acids Res 2008, 36:D480-D484.
3. Caspi R, Foerster H, Fulcher C, Kaipa P, Krummenacker M, Laten-dresse M, Paley S, Rhee S, Shearer A, Tissier C, Walk T, Zhang P, KarpP: The MetaCyc Database of metabolic pathways andenzymes and the BioCyc collection of Pathway/GenomeDatabases. Nucleic Acids Res 2008, 36:D623-D631.
4. Lee DS, Burd H, Liu J, Almaas E, Wiest O, Barabási AL, Oltvai ZN,Kapatral V: Comparative genome-scale metabolic reconstruc-tion and flux balance analysis of multiple Staphylococcusaureus genomes identify novel anti-microbial drug targets. JBacteriol 2009, 191(12):4015-4024.
5. Blank LM, Lehmbeck F, Sauer U: Metabolic-flux and networkanalysis in fourteen hemiascomycetous yeasts. FEMS YeastResearch 2005, 5:545-558.
6. Apic G, Ignjatovic T, Boyer S, Russell R: Illuminating drug discov-ery with biological pathways. FEBS Letters 2005,579(8):1872-1877.
7. Rantanen A, Rousu J, Jouhten P, Zamboni N, Maaheimo H, UkkonenE: An analytic and systematic framework for estimating met-
Additional file 1ReTrace user guide and implementation notes. ReTrace implementa-tion details and user guide. A self-contained web site: unpack archive and open index.html in a web browser.Click here for file[http://www.biomedcentral.com/content/supplementary/1752-0509-3-103-S1.zip]
Additional file 2ReTrace results from experiments. Summary data and html output from ReTrace runs performed for the queries discussed in the section Results. A self-contained web site: unpack archive and open index.html in a web browser.Click here for file[http://www.biomedcentral.com/content/supplementary/1752-0509-3-103-S2.zip]
Page 21 of 22(page number not for citation purposes)
BMC Systems Biology 2009, 3:103 http://www.biomedcentral.com/1752-0509/3/103
abolic flux ratios from 13 C tracer experiments. BMC Bioinfor-matics 2008, 9:266.
8. Pharkya P, Burgard AP, Maranas CD: OptStrain: a computationalframework for redesign of microbial production systems.Genome Res 2004, 14(11):2367-2376.
9. Pitkänen E, Rantanen A, Rousu J, Ukkonen E: A computationalmethod for reconstructing gapless metabolic networks. InProceedings of the 2nd International Conference on BioinformaticsResearch and Development (BIRD'08) Volume 13. Communications inComputer and Information Science, Springer; 2008.
10. Karp P, Paley S, Romero P: The Pathway Tools Software. Bioin-formatics 2002, 18:S225-S232.
11. Price ND, Reed JL, Palsson BO: Genome-Scale Models Of Micro-bial Cells: Evaluating The Consequences Of Constraints.Nature Reviews Microbiology 2004, 2:886-897.
12. Kumar VS, Dasika MS, Maranas CD: Optimization based auto-mated curation of metabolic reconstructions. BMC Bioinfor-matics 2007, 8(212):.
13. Schuster S, Fell DA, Dandekar T: A general definition of meta-bolic pathways useful for systematic organization and analy-sis of complex metabolic networks. Nature Biotechnology 2000,18:326-332.
14. Arita M: Metabolic reconstruction using shortest paths. Simu-lation Practice and Theory 2000, 8:109-125.
15. Croes D, Couche F, Wodak SJ, van Helden J: Metabolic PathFind-ing: inferring relevant pathways in biochemical networks.Nucleic Acids Research 2005, 33:W326-W330.
16. Rahman SA, Advani P, Schunk R, Schrader R, Schomburg D: Meta-bolic pathway analysis web service (Pathway Hunter Tool atCUBIC). Bioinformatics 2005, 21(7):1189-1193.
17. Pitkänen E, Rantanen A, Rousu J, Ukkonen E: Finding FeasiblePathways in Metabolic Networks. Advances in Informatics: 10thPanhellenic Conference on Informatics (PCI 2005). Lecture Notes in Com-puter Science 3746 2005:123-133.
18. Blum T, Kohlbacher O: MetaRoute: fast search for relevantmetabolic routes for interactive network navigation and vis-ualization. Bioinformatics 2008, 24(18):.
19. Faust K, Croes D, van Helden J: Metabolic Pathfinding UsingRPAIR Annotation. Journal of Molecular Biology 2009, 388:390-414.
20. Planes FJ, Beasley JE: A critical examination of stoichiometricand path-finding approaches to metabolic pathways. Briefingsin Bioinformatics 2008, 9(5):422-436.
21. Lacroix V, Cottret L, Thebault P, Sagot MF: An introduction tometabolic networks and their structural analysis. IEEE Trans-actions on Computational Biology and Bioinformatics 2008, 5(4):594-617.
22. Terzer M, Stelling J: Large scale computation of elementaryflux modes with bit pattern trees. Bioinformatics 2008,24(19):2229-2235.
23. Hattori M, Okuno Y, Goto S, Kanehisa M: Development of achemical structure comparison method for integrated anal-ysis of chemical and genomic information in the metabolicpathways. Journal of the American Chemical Society 2003,125:11853-11865.
24. Wagner A, Fell DA: The small world inside large metabolic net-works. Proc R Soc Lond B 2001, 268(1478):1803-1810.
25. Croes D, Couche F, Wodak S, van Helden J: Inferring meaningfulpathways in weighted metabolic networks. J Mol Biol 2006,356:222-236.
26. Blum T, Kohlbacher O: Using Atom Mapping Rules for anImproved Detection of Relevant Routes in Weighted Meta-bolic Networks. Journal of Computational Biology 2008,15(6):565-576.
27. Kotera M, Hattori M, Oh MA, Yamamoto R, Komeno T, Yabuzaki J:RPAIR: a reactant-pair database representing chemicalchanges in enzymatic reactions. Genome Inf 2004, 15:P062.
28. Stelling J, Klamt S, Bettenbrock K, Schuster S, Gilles ED: Metabolicnetwork structure determines key aspects of functionalityand regulation. Nature 2002, 420(6912):190-193.
29. Küffner R, Zimmer R, Lengauer T: Pathway analysis in metabolicdatabases via differential metabolic display (DMD). Bioinfor-matics 2000, 16(9):825-836.
30. Klamt S, Gagneur J, von Kamp A: Algorithmic approaches forcomputing elementary modes in large biochemical reactionnetworks. IEE Proceedings Systems Biology 2005, 152(4):249-255.
31. von Kamp A, Schuster S: Metatool 5.0: fast and flexible elemen-tary modes analysis. Bioinformatics 2006, 22(15):1930-1931.
32. Schwarz R, Musch P, von Kamp A, Engels B, Schirmer H, Schuster S,Dandekar T: YANA - a software tool for analyzing flux modes,gene-expression and enzyme activities. BMC Bioinformatics2005, 6(135):.
33. de Figueiredo LF, Schuster S, Kaleta C, Fell DA: Can sugars be pro-duced from fatty acids? A test case for pathway analysistools. Bioinformatics 2008, 24(22):2615-2621.
34. Yen JY: Finding the K Shortest Loopless Paths in a Network.Management Science 1971, 17(11):712-716.
35. Eppstein D: Finding the k shortest paths. SIAM J Computing 1998,28(2):652-673.
36. Jouhten P, Pitkänen E, Pakula T, Saloheimo M, Penttilä M, MaaheimoH: 13C-metabolic flux ratio and novel carbon path analysesconfirmed that Trichoderma reesei uses primarily the respira-tive pathway also on the preferred carbon source glucose.2009 [http://www.biomedcentral.com/1752-0509/3/104].
37. Astikainen K, Holm L, Pitkänen E, Szedmak S, Rousu J: Towardsstructured output prediction of enzyme function. BMC pro-ceedings, BioMed Central Ltd 2008, 2:S2.
38. van Rossum G, FL D Jr, Eds: An Introduction to Python Network TheoryLtd; 2006.
39. Wiechert W, de Graaf AA: Bidirectional Reaction Steps in Met-abolic Networks: I. Modeling and Simulation of Carbon Iso-tope Labeling Experiments. Biotechnology and Bioengineering1997, 55:101-117.
40. Garey MR, Johnson DS: Computers and Intractability: A Guide to the The-ory of NP-Completeness W. H. Freeman; 1979.
41. Jiminez V, Marzal A: Computing the K Shortest Paths: a NewAlgorithm and an Experimental Comparison. In Algorithm Engi-neering LNCS, Springer-Verlag; 1999:15-29.
42. Pitkänen E, Åkerlund A, Rantanen A, Jouhten P, Ukkonen E:ReMatch: a web-based tool to construct, store and share sto-ichiometric metabolic models with carbon maps for meta-bolic flux analysis. Journal of Integrative Bioinformatics 2008,5(2):102.
43. Ma HW, Zeng AP: The connectivity structure, giant strongcomponent and centrality of metabolic networks. Bioinformat-ics 2003, 19(11):1423-1430.
44. Cormen TH, Leiserson CE, Rivest RL: Introduction to Algorithms TheMIT Press; 1990.
45. Arita M: The metabolic world of Escherichia coli is not small.PNAS 2004, 101(6):1543-1547.
46. Martinez D, Berka RM, Henrissat B, Saloheimo M, Arvas M, Baker SE,Chapman J, Chertkov O, Coutinho PM, Cullen D, Danchin EG, Grig-oriev IV, Harris P, Jackson M, Kubicek CP, Han CS, Ho I, Larrondo LF,de Leon AL, Magnuson JK, Merino S, Misra M, Nelson B, Putnam N,Robbertse B, Salamov AA, Schmoll M, Terry A, Thayer N, Wester-holm-Parvinen A, Schoch CL, Yao J, Barbote R, Nelson MA, DetterC, Bruce D, Kuske CR, Xie G, Richardson P, Rokhsar DS, Lucas SM,Rubin EM, Dunn-Coleman N, Ward M, Brettin TS: Genomesequencing and analysis of the biomass-degrading fungus Tri-choderma reesei. Nat Biotechnol 2008, 26:553-560.
47. Altschul SF, Madden TL, Schaffer AA, Zhang J, Zhang Z, Miller W, Lip-man DJ: Gapped BLAST and PSI-BLAST: a new generation ofprotein database search programs. Nucleic Acids Res 1997,25:3389-3402.
48. Consortium TU: The Universal Protein Resource (UniProt).Nucleic Acids Res 2007, 35:D193-197.
49. Hartman SC, Buchanan JM: Nucleic acids, purines, pyrimidines(nucleotide synthesis). Annu Rev Biochem 1959, 28:365-410.
50. Michal G, Ed: Biochemical Pathways: An Atlas of Biochemistry and Molec-ular Biology John Wiley & Sons, Inc; 1999.
Page 22 of 22(page number not for citation purposes)