Embed Size (px)
Citation preview
INDUSTRY PERFORMANCE ANALYSER FOR TOURISM (IPAT)Research and Pilot Study Noel Scott and Noreen Breakey
Research and Pilot Study
Technical Reports The technical report series present data and its analysis, meta-studies and conceptual studies, and are considered to be of value to industry, government and researchers. Unlike the Sustainable Tourism Cooperative Research Centre’s Monograph series, these reports have not been subjected to an external peer review process. As such, the scientific accuracy and merit of the research reported here is the responsibility of the authors, who should be contacted for clarification of any content. Author contact details are at the back of this report. National Library of Australia Cataloguing in Publication Data Scott, Noel. Industry performance analyser for tourism (IPAT) research and pilot study. Bibliography. ISBN 9781920965402. 1. Tourism - Research - Queensland. 2. Tourism - Queensland - Econometric models. 3. Tourism - Queensland - Evaluation. I. Breakey, Noreen. II. Cooperative Research Centre for Sustainable Tourism. III. Title. 338.4791 Copyright © CRC for Sustainable Tourism Pty Ltd 2008 All rights reserved. Apart from fair dealing for the purposes of study, research, criticism or review as permitted under the Copyright Act, no part of this book may be reproduced by any process without written permission from the publisher. All enquiries should be directed to the STCRC [[email protected].] First published in Australia in 2008 by CRC for Sustainable Tourism Pty Ltd. Printed in Australia (Gold Coast, Queensland). Cover designed by Sin Design.
ii
INDUSTRY PERFORMANCE ANALYSER FOR TOURISM (IPAT)
CONTENTS ABSTRACT_____________________________________________________________________________ v Acknowledgements _______________________________________________________________________ v SUMMARY _____________________________________________________________________________ vi CHAPTER 1 ISSUES IN TOURISM DESTINATION PERFORMANCE MEASUREMENT _________ 1 Information Systems _______________________________________________________________________ 1 CHAPTER 2 R-TAM – REGIONAL TOURISM ACTIVITY MONITOR _________________________ 2 Introduction______________________________________________________________________________ 2 Data Collection ___________________________________________________________________________ 3 Factors Influencing Data Collection ___________________________________________________________ 3 Findings ________________________________________________________________________________ 4 CHAPTER 3 THE IPAT SYSTEM - INDUSTRY PERFORMANCE ANALYSER FOR TOURISM ___ 5 Introduction______________________________________________________________________________ 5 Direct Data Entry _________________________________________________________________________ 5 Data Comparisons_________________________________________________________________________ 5 Role of RTOs ____________________________________________________________________________ 5 Design Flexibility _________________________________________________________________________ 6 Case study of the use of IPAT in the Australian Capital Territory ____________________________________ 6 Findings ________________________________________________________________________________ 6 CHAPTER 4 TRIAL OF IPAT IN QUEENSLAND____________________________________________ 7 Introduction______________________________________________________________________________ 7 Structure of Trial__________________________________________________________________________ 7 Objectives of Trial ________________________________________________________________________ 7 Timeline ________________________________________________________________________________ 7 RTO Data Survey _________________________________________________________________________ 8 Data Series and Specifications _______________________________________________________________ 9 Operational Specifications _________________________________________________________________ 10 Electronic Data Exchange__________________________________________________________________ 10 Seamless Transition from R-TAM to IPAT ____________________________________________________ 10 Statistical Validity of IPAT Data compared to R-TAM ___________________________________________ 11 Operator Training ________________________________________________________________________ 11 RTO Administration – time required__________________________________________________________ 11 Data Ownership _________________________________________________________________________ 11 Technical Software Specifications ___________________________________________________________ 11
Category Types ______________________________________________________________________ 11 Reporting ___________________________________________________________________________ 12 Other Changes made during the Trial _____________________________________________________ 12
CHAPTER 5 SOUTH BURNETT TRIAL __________________________________________________ 13 Reporting Wineries – South Burnett __________________________________________________________ 13
Example Individual Report – September 2006 – Operator Y Wines ______________________________ 13 Actual Data over time or Change Report – Operator Y and Region ______________________________ 14 Tabular Report _______________________________________________________________________ 15 Example Information Showing Trend Data _________________________________________________ 15
CHAPTER 6 CONCLUSIONS AND RECOMMENDATIONS _________________________________ 16 Recommendations________________________________________________________________________ 17 APPENDIX A: IPAT RESEARCH & PILOT PROJECT WITH TOURISM QLD FOR QLD RTOs __ 18 APPENDIX B: R-TAM SCOPE & COVERAGE FEBRUARY 2006 _____________________________ 21 APPENDIX C: SAMPLE R-TAM REPORT ________________________________________________ 23 APPENDIX D: DRAFT IPAT QUEENSLAND RTO PRICING MODEL ________________________ 24 APPENDIX E: IT DEVELOPMENT FOR QLD RTOs ________________________________________ 26 APPENDIX F: OUTLINE OF SURVEY ____________________________________________________ 27
iii

Research and Pilot Study APPENDIX G: IPAT TRAINING MANUAL & USER GUIDE_________________________________ 28 AUTHORS_____________________________________________________________________________ 33 List of Figures Figure 1: Uses of R-TAM by RTO managers (n=13) _____________________________________________ 2 Figure 2: Data collection screen for wineries ___________________________________________________ 10 Figure 3: Origin data – graphical_____________________________________________________________ 14 Figure 4: Trend data ______________________________________________________________________ 15 List of Tables Table 1: Destination information requirements___________________________________________________ 1 Table 2: Types of data collected in R-TAM or derived from data collected_____________________________ 3 Table 3: IPAT pilot timeline _________________________________________________________________ 7 Table 4: Type of data required by tourism operators in Queensland __________________________________ 8 Table 5: Regions, series, questions and frequency for data collection _________________________________ 9 Table 6: Individual monthly data for month September 2006_______________________________________ 13 Table 7: Regional monthly data for month September 2006 _______________________________________ 14 Table 8: Origin data – tabular _______________________________________________________________ 15 Table 9: Comparison of IPAT, R-TAM and the STA_____________________________________________ 16
iv
INDUSTRY PERFORMANCE ANALYSER FOR TOURISM (IPAT)
ABSTRACT
This report provides a summary of the findings of a pilot trial of the Industry Performance Analyser for Tourism (IPAT) by selected Regional Tourism Organisations in two regions of Queensland. The trial was undertaken to define, construct and test IPAT and to evaluate its success in order to develop a business case for a state–wide rollout. The trial involved specifying data requirements and evaluating the outcomes of the trial. The report is based on observations by the authors, technical reports and investigations prepared during the trial, the data output of the trial and interviews with participants. The project involved the evaluation of the web-based IPAT system as a tool for sharing data amongst tourism operators. The data collected would also provide a number of continuous readings of tourism activity in reporting regions and to provide an analysis of the data for tourism operators.
In this report IPAT is also compared to another data collection system R-TAM (Regional Tourism Activity Monitor) developed by Tourism Queensland.
Acknowledgements The Sustainable Tourism Cooperative Research Centre, established and supported under the Australian Government’s Cooperative Research Centre’s Program, funded this research.
The authors are grateful for the help and support they received in the preparation of this report. The IPAT project Steering Committee consisted of staff from Regional Tourism Organisations in
Queensland. They were Melinda Connolly, Tourism North Queensland, Gemma Dadswell, Brisbane Marketing, Narelle Duggan, South Burnett Local Government Association, Fabienne Rabbiosi, Gold Coast Tourism Bureau and Mathew Williams, The Whitsundays.
Tourism Queensland performed the role of project facilitator and also provided advice on the operation of the R-TAM data collection system. The project was supported by Hayley Lees, Suzanne Postma and Jane Mallam.
Noel Scott and Noreen Breakey of the University of Queensland, School of Tourism, provided support regarding the technical aspects of data collection and analysis, collected data from the participants on system performance and prepared the report.
A team comprising Mark Allen, Wayne McKinnon, Paula Quirk Russo and Paul Rutherford of Decipher Technologies provided technical support and training.
v
Research and Pilot Study
SUMMARY The market performance information available to tourism operators and managers of Regional Tourism Organisations for use in evaluating their relative performance is not considered adequate. Tourism operators individually have their own performance data available (ie hotels may have data on room night occupied per month) but this information is generally considered commercially sensitive. Thus, sharing of such data to enable the performance of an individual operator against others or to allow aggregate performance of the destination to be measured has been problematic.
This technical report provides a summary of the pilot implementation of Industry Performance Analyser for Tourism (IPAT) by selected Regional Tourism Organisations (RTOs) in Queensland. The report is based on observations by the authors, technical reports and investigations prepared during the trial, the data output of the trial, and interviews with participants in the trial conducted during and after the data collection period.
The first version of IPAT was developed by Dean Carson of Southern Cross University in collaboration with Australian Capital Tourism. The Intellectual Property rights are held by Sustainable Tourism Cooperative Research Centre and are licensed to Decipher. In this report, IPAT is compared to another data collection system R-TAM (Regional Tourism Activity Monitor) developed by Tourism Queensland in 1997 and used for data collection in various regions of Queensland between 1998 and 2006.
Objectives of Study The aim of this study was to examine IPAT as a tool for Regional Tourism Organisations (RTOs) in Queensland to use in collecting and sharing data with their members. The study involved developing and trialling the use of IPAT in two regions of Queensland and this report provides a technical summary and evaluation of that pilot implementation.
Methodology The technical summary and evaluation of IPAT is based on personal observations by the researchers, comments from the committee responsible for the trial and evaluative responses collected from operators involved in the trial as well its performance relative to the tool previously used called R-TAM. The IPAT project steering committee consisted of staff from RTOs in Queensland. Tourism Queensland performed the role of project facilitator and also provided advice on the operation of the R-TAM data collection system. The University of Queensland, School of Tourism, provided support regarding technical aspects of data collection and analysis, collected data from participants on system performance and prepared this report. Decipher Technologies provided program modifications and training.
The trial of IPAT was undertaken in the South Burnett region of Queensland and Tropical North Queensland. In the South Burnett region, eight wineries contributed data while in Tropical North Queensland a number of backpacker establishments used IPAT. It was planned to access data collected by the Queensland Hotels Association for five star hotels electronically but ultimately the Queensland Hotels Association data was not made available. Six operators who participated in the trial were interviewed by telephone. The response by operators in the trial is lower than was expected at the start of the trial and may be indicative of the difficulty of recruiting operators to participate.
Key Findings
• The results of this study indicate that IPAT is technically an excellent tool for the collection of either statistical or benchmarking data. A number of minor modifications have been suggested by respondents to improve the system related to the presentation of data in reports. While minor in technical terms, these modifications would improve the reporting and presentation ability of the solution. Some additional attention to the interface and reporting is recommended and a number of changes are suggested in the discussion section of this report.
• There are some differences in the approach to data collection between R-TAM and IPAT. R-TAM is intended to provide statistically reliable results. IPAT is designed to share data instantaneously among a group of operators. IPAT may be also used for statistical data analysis purposes in the same manner as R-TAM if the operators enrolled constitute over 50% or thereabouts of the capacity in a region (i.e. the data indicator is consistently green). The approach taken by IPAT allows administrators the ability to customise their data collection. This allows greater flexibility in data collection but may reduce comparability between regions.
• IPAT allows for faster reporting than R-TAM and is less expensive in direct costs but does require administration by RTO staff.
• This trial has also highlighted the importance of operator support for any regional data collection
vi

INDUSTRY PERFORMANCE ANALYSER FOR TOURISM (IPAT)
system. It provides evidence of the difficulty in recruiting operators to contribute to such a system and the workload involved in ongoing administration. These are not technical issues and are instead related to operator interest and motivation. At the time of writing this report, only limited aggregate data has been provided for evaluation from either of the series (wineries or backpackers) and the overall number of responses from operators has been low and is a limitation of this report.
Future Action In summary, the IPAT pilot has been technically successful but highlights the importance and difficulty of obtaining tourism operator support and the additional administrative resources required by RTOs. Its use should be considered by tourism regions and operators who wish to obtain cost effective performance data. It is also considered that the use of IPAT should not be restricted to tourism.
vii

Research and Pilot Study
viii
INDUSTRY PERFORMANCE ANALYSER FOR TOURISM (IPAT)
Chapter 1
ISSUES IN TOURISM DESTINATION PERFORMANCE MEASUREMENT
One of the tourism trends over the past decade has been the devolution of responsibility for management of tourism from central offices to a more distributed network. One advantage of such an approach is that tourism destination operators have a more active role in managing their own affairs, consistent with the local nature of tourism. A result of this trend is a need for resources, skills, knowledge and information at the same regional level for planning and management purposes.
Information Systems Effective management of tourism destinations requires a number of different types of ongoing information systems to be developed. Such systems are required for strategic planning, for operational planning and for performance measurement. These data types and their characteristics are explained in Table 1.
Table 1: Destination information requirements
Question Issues Data Strategy What do we want to do?
Developing the vision, five year objectives, policies and methods of operating.
International and domestic customer and business trends, competitor analysis, internal capability. Two important sources of information are the International Visitor Survey (IVS) and National Visitor Survey (NVS).
Operation How do we do it?
Setting objectives for target markets, product development, quality improvement on a one–two year time horizon, Market mix development, allocation and consequent objectives.
Brand and sales response per dollar per segment, leveragability of market segments, impact of events, impact of growth/decline of infrastructure. These are generally provided by models of visitation developed for a particular region.
Performance How did we do?
Evaluation of performance on key operational objectives for destination or market sector. Identification of the need for change in strategic objectives.
Visitors per segment, expenditure or other indicators of performance as determined by operational targets. This type of data is provided by IPAT and R-TAM
While every destination requires a system to provide data on which to assist in making strategic and
operational decisions and to evaluate performance, the design of a suitable system requires consideration of the magnitude of the task, the exact specifications of the data to be collected and the available resources (people and money). Importantly, RTOs are mostly small in numbers of employees and until recently had few statistical data collection skills and were without the ability to deploy sophisticated data collection and analysis systems. It is only in the past few years that some RTOs in Queensland have dedicated resources to data collection and analysis.
Within this context, a new data collection and analysis tool, IPAT is being tested as a means for RTOs to produce performance information by collecting data from their operators and aggregating it. The initial IPAT Research and Pilot Project description is provided in Appendix A.
In order to better understand this trial, the characteristics of IPAT, and the needs of the RTOs and their operators, the existing R-TAM data collection is first discussed in Chapter 2.
1
Research and Pilot Study
Chapter 2
R-TAM – REGIONAL TOURISM ACTIVITY MONITOR
Introduction In response to the decision to cut the scope of the Survey of Tourist Accommodation (STA) back from establishments with 5 or more rooms to establishments with 15 or more rooms, Tourism Queensland (TQ) developed R-TAM in 1997 to provide a monitor of tourism activity in a tourism region in a timely manner. R-TAM provides information that cannot be obtained from other sources such as the major ‘strategic studies’ - the International Visitor Survey (IVS) or National Visitor Survey (NVS). In particular, these national surveys cannot provide timely information at a small region or sub-regional level for particular types of tourism operators (i.e. backpacker hotels). Since R-TAM was introduced, the scope of the STA has been increased again although not permanently. Reinstatement of a permanent budget for the expansion of STA is a continuing topic of discussion between the Commonwealth and States.
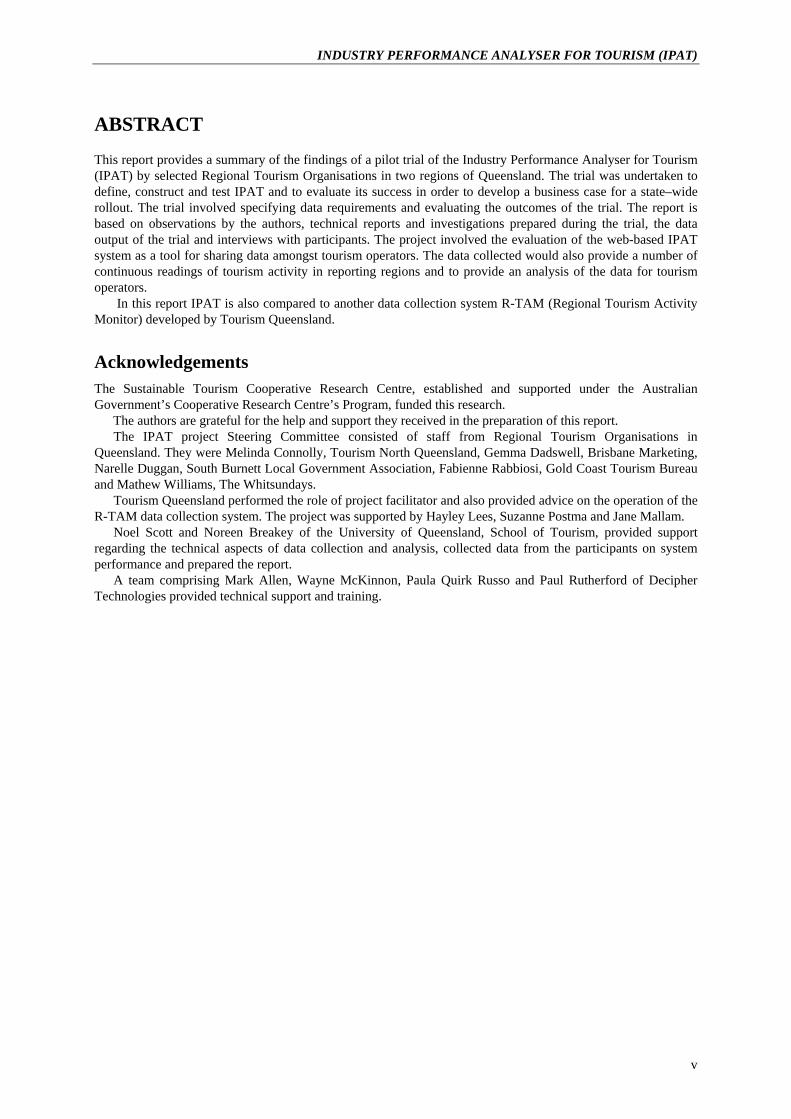
The purpose of R-TAM is to provide TQ with indicators of the industry’s performance, to provide RTOs with indicators of regional performance and to provide operators with an indication of business performance (as compared with the regional/sector average). It uses the most economical and informed source of data as its basis; the tourism operator. The uses of R-TAM data as indicated by RTO managers in a Partner Satisfaction Survey Report (September 2003) are shown in Figure 1.
Figure 1: Uses of R-TAM by RTO managers (n=13)
R-TAM is not one data series but collects data from several types of operators, including hotels, backpacker
lodges and tour operators in different regions. Because R-TAM covers many different types of operators, there are rules to determine which operator belongs in which series. This also means that the output from R-TAM is a number of data series that are independent of each other, much like the medical readouts in a hospital intensive care ward show different aspects of the health of a person. Together these R-TAM series provide a ‘picture’ of the health of the tourist destination they describe. However they cannot be ‘added up’ in the same way that tourist expenditure in a region can, as each series measures a different unit. To continue the health analogy, there is no purpose in comparing the heartbeat and blood pressure from two different people…it doesn’t work. For example an R-TAM series for five star hotels may count room nights while the series for boat charters would examine boat utilisation and since these two series are derived from visits from different market segments, comparisons between them are of little value.
Therefore the purpose of R-TAM is to provide a number of continuous readings of activity in a tourism
2
INDUSTRY PERFORMANCE ANALYSER FOR TOURISM (IPAT)
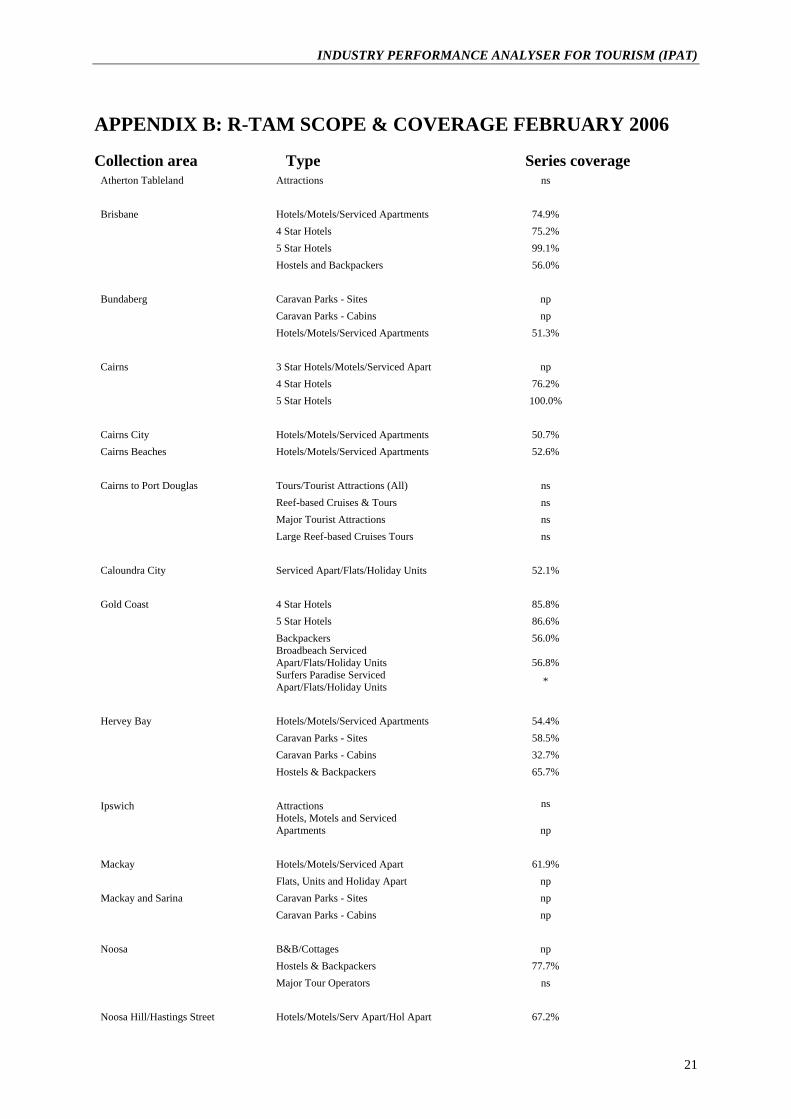
region by collecting data on the types of tourism available in each region. The R-TAM series collected or proposed for collection are shown in Appendix B. Since it was introduced, around 60 R-TAM series have been proposed or introduced with about 40 series active and published.
Data Collection In order to function, R-TAM requires an up-to-date list of operators in a region to be maintained. This sample frame is currently updated yearly by TQ and the RTOs and contains name, address, capacity, and other information. However, as not every operator participates in R-TAM, a minimum level of participation has been set for the publication of results in a series. Series are published if operators totalling at least 50% of the capacity of that type provide data. The coverage of each series as at February 2006 is also shown in Appendix B in the right hand column.
In R-TAM, data is reported by operators for each day of operation with returns sent to Office of Economic and Social Research (OESR) at the end of the month. While daily data is useful for examining the effect of events and festivals it can also be more difficult and time consuming for operators to produce. However one problem with reporting on monthly data is that months vary in length and so some adjustments may need to be made for any monthly data collections to compare between one month (January) and another month (February) for some types of data (say visitor nights).
Many types of data can be collected from operators, as shown in Table 2. The type of data collected is a key decision in any survey. The main point and the experience from R-TAM is KISS (Keep It Simple Steve). Essentially the issue is ‘what are you (or the operators) going to do with the data?’. Additionally, for many operators who provide management reports or who contribute to the STA, there are certain types of data that are easiest to provide. These are often types of data already used for performance measurement by management. It is harder to ask operators to provide information they do not already produce and use on a regular basis. The best data to collect is therefore that which is readily available to operators and data used for performance purposes.
Table 2: Types of data collected in R-TAM or derived from data collected
Type Data Comment Volume Number of passengers per
month/day Used for tours and attractions
Capacity Occupancy per month/day Used for all types of businesses. Can produce visitor numbers if capacity is known.
Efficiency Takings per unit of capacity per month
Called occupancy rate in hotels.
Derived Average length of stay Calculated for a hotel from occupancy rate, number of rooms, and the number of visitors
The experience from R-TAM data collection is that operators’ interest and willingness to contribute to a
survey varies over time. This is a critical issue and the basis for success of R-TAM or other similar surveys. The coverage of the responses from operators is shown in Appendix B. In February 2006, 41 different series were being collected in R-TAM with an average coverage of 61% of the reporting scope.
R-TAM is operated by TQ with the OESR providing support and reporting. The series are collected primarily for RTO regions but also for some Shires (e.g. Noosa and Caloundra), or defined area (e.g. Cairns City and Cairns Beaches).
Factors Influencing Data Collection R-TAM operates through the contribution of data by operators and this is its greatest strength and weakness. As mentioned above, over 50% of operators of a particular type in a region are required for publication of a series. One problem for R-TAM occurs when an operator does not provide a month’s data. This can delay the release of the report for that month while the operator is contacted. Contacting operators to ‘chase up’ returns is a major task. Currently, OESR make the initial follow-up contact but refer the matter to TQ if unsuccessful. The amount of time required to ‘chase up’ operators varies according to the type of operator and the number of operators in a series. ‘Chase up’ in general takes longer for smaller operators as larger operators will usually have resources
3
Research and Pilot Study dedicated to the task of data analysis and produce reports for their own purposes. There is some evidence to suggest that operator interest in R-TAM has declined based on the increase in the effort required by RTOs, TQ and OESR to ‘chase up’ operators.
‘Chasing up’ operators who do not report on time is a significant contributor to the cost of R-TAM. Collecting tourism information from operators requires dedicated resources and time. If not rigorously implemented over an extended period, tourism statistical data collection is of little value.
There are numerous reasons why tourism operators may not supply data. Operators sell their properties or contacts leave the organisation or take holidays which may impact on data availability. If the ‘chase up’ procedure is unsuccessful, then R-TAM requires removing the non-contributing operator from the previous month’s figures and recalculating the previous month’s total. This enables the month to month totals to be compared on the same basis. Further if the figures from the missing operator are subsequently provided after the reporting is completed then another round of recalculations is required. Thus, R-TAM has the ability to include data from previous periods but this leads to revisions of prior reports.
Data entry is another key issue in R-TAM. Around 60% of operators provide figures electronically. However, some 40% of operators provide faxed information which must be manually entered by OESR, another time consuming task and one which requires confidential handling of data. Confidentiality of data is one of the important reasons why OESR was chosen by TQ for the R-TAM contract.
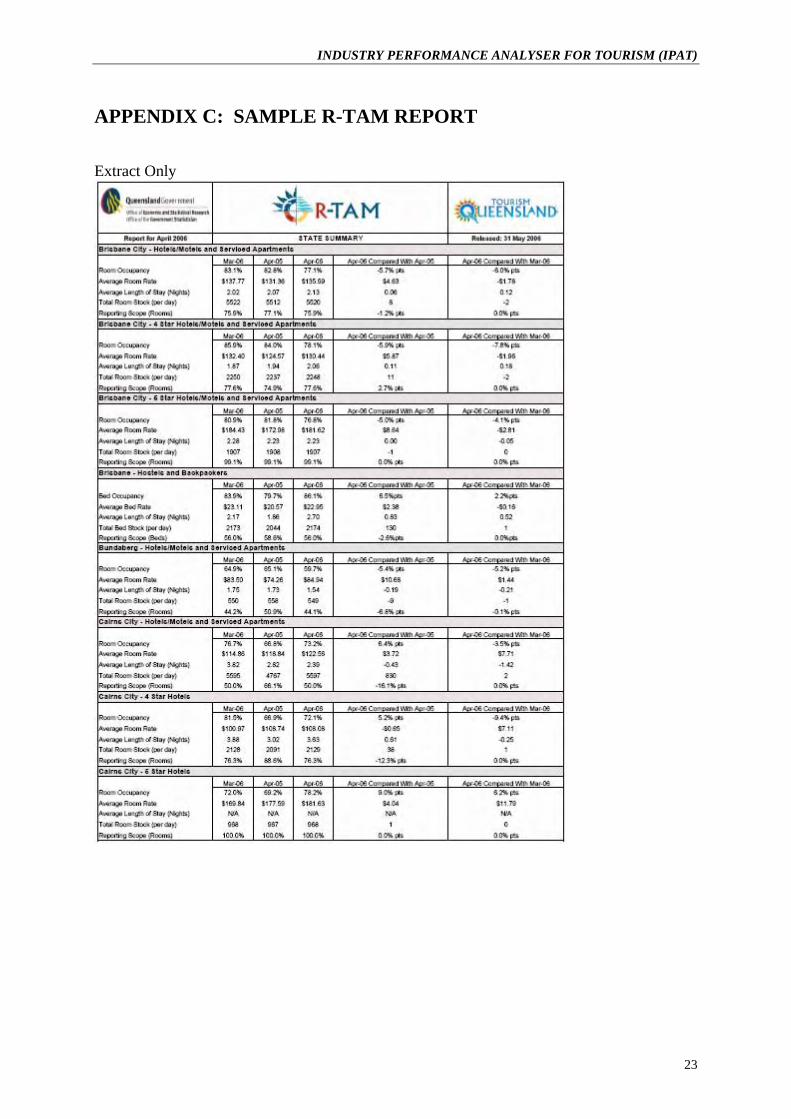
R-TAM reports are produced by TQ and this is another time consuming activity. R-TAM reporting is normally done around 4 to 5 weeks after the end of the month to allow for ‘chase up’ and recalculation. Two sets of reports are produced; one for each participating operator showing their individual results compared to the aggregate for the series, and the second report showing aggregate data for general usage. Thus one of the incentives for contributing to R-TAM is that operators get to see how they perform against the aggregate for the region for their type of business. In addition to the presentation of the data results, these R-TAM reports also provide a written description of the tourist activity for the month, such as providing explanations for peaks or troughs in the data presented. A sample R-TAM report is provided in Appendix C. While other sources of comparison data are available for some operators (i.e. STA data), R-TAM provides more timely data and also data for some operators who otherwise would have no comparisons (i.e. tours and attractions).
So how is R-TAM performing? RTO managers appear to believe that the information provided by R-TAM is useful. An R-TAM Satisfaction Study was conducted in September 2003 and reported that all RTO managers found the monthly R-TAM report useful or somewhat useful.
However cost is a key issue and the costs of R-TAM continue to increase. One cost increase is due to a removal of a subsidy by OESR. In addition, future operation of R-TAM would require upgrading of the existing R-TAM system software to improve efficiency at a cost estimated to be around $110,000 - $200,000. Further it is expected that costs within Tourism Queensland would increase in future due to costs for staff follow-up of operators increasing.
Findings In summary, R-TAM appears to have operated well in providing a monitor of tourism activity. However it relies on operator support (as they provide the most efficient means currently available to source the required data), is labour intensive due to input of faxed responses, and ‘chase up’ of operators, and would require significant further investment to continue. As a result R-TAM is to be discontinued at the end of December 2006.
4
INDUSTRY PERFORMANCE ANALYSER FOR TOURISM (IPAT)
Chapter 3
THE IPAT SYSTEM - INDUSTRY PERFORMANCE ANALYSER FOR TOURISM
Introduction IPAT is a tool for capturing and sharing performance data from tourism businesses and stands for Industry Performance Analyser for Tourism. IPAT is a commercial product developed by the Southern Cross University and ACT and then the Intellectual Property rights were bought by Sustainable Tourism Cooperative Research Centre (STCRC). The management rights are held by Decipher, a subsidiary of the STCRC. IPAT is currently in use in the Northern Territory and ACT and being investigated by other States.
IPAT is designed to enable sharing of information to produce aggregate information and trends as output, as well as individual operator trends. The sharing of data is an important feature of IPAT. It relies, as does R-TAM, on the contribution of data by individual operators. IPAT functions through operators entering data at regular intervals, such as daily or monthly. Once entered, the data may be shared with peers either individually or in aggregate (as agreed). IPAT reporting is fully automated and reports are available as soon as the data has been entered. Thus reporting is rapid so long as operators complete their data entry each reporting period.
Direct Data Entry IPAT has been designed to address some of the problems and issues that R-TAM has faced. Firstly, it is designed to allow data entry by operators directly. While R-TAM relied on email or faxed responses, IPAT is web-based. Operators who are involved in IPAT log onto an internet site using a user name and password and then key in the required data. The time taken to complete this task is similar to that needed to fill in a paper R-TAM form and send it in. IPAT is more ‘hands off’ than R-TAM (providing that the operators contribute data on time). Thus, like R-TAM, operator involvement and support is fundamental for IPAT to work.
Data Comparisons When the required number of operators have entered their data, reports may be produced that show comparisons between an individual operator’s performance data and their sector. In addition, IPAT allows sectors (i.e. backpacker hostels) in one region to compare their performance with those in other regions. Doing so however requires comparable data definitions to be used in each region. IPAT also provides the ability to define unlimited tourism business types (or sectors) including: commercial accommodation; bed and breakfast establishments; tour operators; attractions, wineries and visitor information centres, etc.
Role of RTOs Regional administration of IPAT is to be performed by RTOs. This will require RTO staff to perform some or all of the following functions depending on the data chosen to be collected.
• Maintaining series scope (annually) • Enrolling new operators • Maintaining the list of current participants • Encouraging ongoing participation • Training users in how to use the system • Performing ‘chase up’ • Performing manual data entry of previously entered incorrect data or faxed data (if accepted) • Providing regional summary reports if necessary • Educating their members on the benefits of the data.
Decipher Technologies is able to assist RTOs in these functions if required. The design of IPAT eliminates some of the tasks previously undertaken especially in the areas of data entry
and reporting. However, maintenance of data reliability and validity requires the RTOs administrators to be responsible for the quality of the data produced. Thus RTO administrators are required to educate members
5
Research and Pilot Study about the benefits of using the data, enrolling users and ensuring that users contribute data. All of these functions were undertaken in the IPAT pilot.
Design Flexibility IPAT, being a web based tool is more flexible than R-TAM. Performance data entered into IPAT can include visitor numbers, occupancy rates, income, expenditure, business expectations or any other categorical or interval variables. The ability to enter text data is also available. Questions can be added or removed as required.
Case study of the use of IPAT in the Australian Capital Territory A very instructive example of the operation of IPAT is provided by its implementation in Canberra, Australian Capital Territory (ACT) by the ACT Tourism Commission. In this destination IPAT is used to monitor and produce performance indicators for two sectors, wineries and attractions, with the number of visitors being the data used in each case. In the winery sector, 15 wineries are involved and each month the operators receive an email reminder with a link to the IPAT login. They click on the link and are taken to the IPAT site where they can enter in the number of visitors in the last month.
As soon as three of the 15 participants have keyed in data, those particular participants can see reports of their change in visitor numbers (say month on month, or year on year) and also the average growth for the participants who have provided their responses. As more operators enter in the data, then the average for the region becomes more reliable. After setup has been completed, the role of the RTO is focused only on encouraging participation.
Findings IPAT therefore appears to be a potentially useful program that may be implemented after the cessation of R-TAM. Its features include the:
• ability to be managed in a decentralised manner (that is, by RTOs) • ability to be easily modified and tailored to collect data appropriate for each region • speed of reporting • ability to provide data so that individual operators can compare their performance with aggregate results
for their regional sector.
6
INDUSTRY PERFORMANCE ANALYSER FOR TOURISM (IPAT)
Chapter 4
TRIAL OF IPAT IN QUEENSLAND
Introduction IPAT has been trialled in two regions of Queensland and this section provides the details of this trial and its results. This trial of IPAT involved specifying data requirements and adapting the existing IPAT software system to meet RTO needs, trialling this system and providing information for a business case for a State-wide rollout (if considered suitable).
Structure of Trial The trial was overseen by a subcommittee of five representatives of RTOs. Tourism Queensland staff provided project support. Representatives from the STCRC and Decipher provided technical assistance and modification of the IPAT system based on changes agreed with RTO representatives. Tourism Queensland (Jane Mallam) and The Whitsundays RTO Manager (Mathew Williams) agreed to report back to the RTO managers the results of the trial. A list of participants is provided in the Acknowledgements.
The first stage of the IPAT trial was to nominate two RTO representatives whose regions would be used as the locations for the trial. The two regions chosen for the trial were Tropical North Queensland (TNQ) and the South Burnett region. In TNQ, 5 star hotels and backpacker establishments were chosen for examination while in the South Burnett, wineries were selected. These data series cover small and large accommodation as well as small attractions and so represent a variety of different data collection tasks.
Objectives of Trial The TNQ 5 star establishments were chosen in order to test whether data already collected by the Queensland Hotels Association (QHA) could be transferred electronically to IPAT to avoid duplication of data to multiple sources and therefore respondent burden.
Other specific questions that were required to be answered as a result of the trial were: • Was it possible to get comparison historical data transferred to IPAT? • Was it possible for the operators involved in R-TAM to be automatically transferred to IPAT? • Was it possible to add an internet ‘pop up’ screen that would automatically prompt operators to key
in data? • How does the statistical validity of IPAT data compare with that produced by R-TAM?
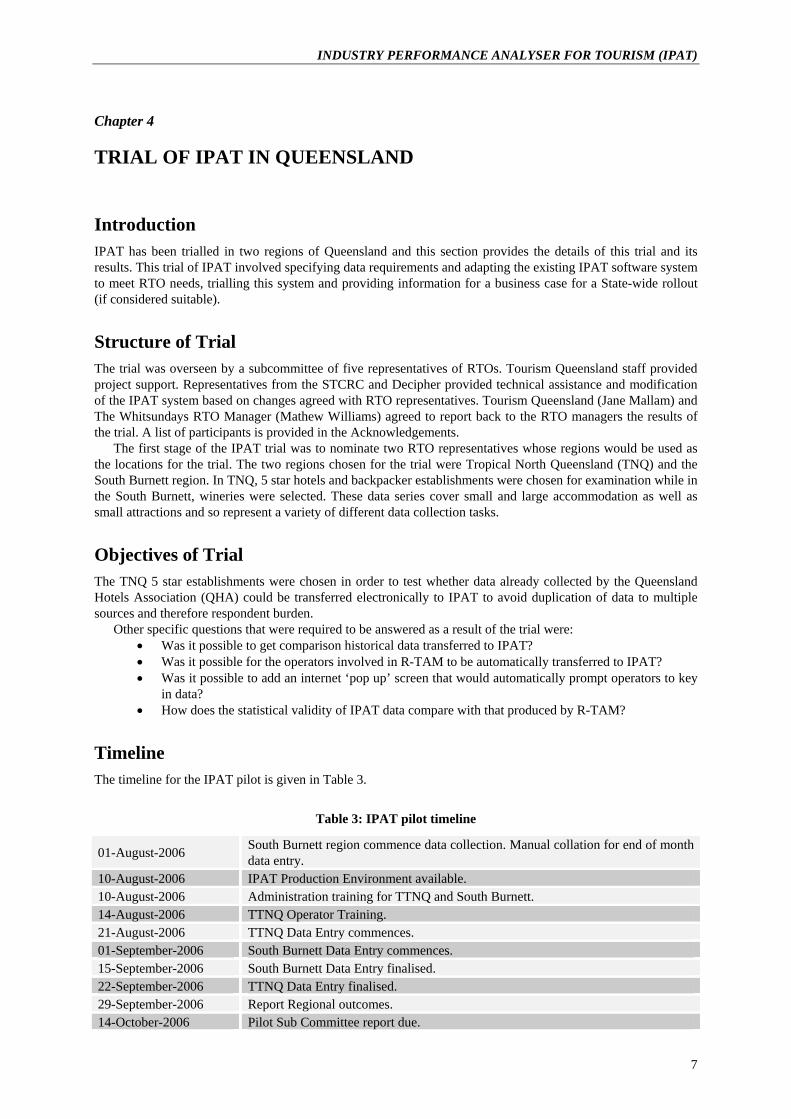
Timeline The timeline for the IPAT pilot is given in Table 3.
Table 3: IPAT pilot timeline
01-August-2006 South Burnett region commence data collection. Manual collation for end of month data entry.
10-August-2006 IPAT Production Environment available. 10-August-2006 Administration training for TTNQ and South Burnett. 14-August-2006 TTNQ Operator Training. 21-August-2006 TTNQ Data Entry commences. 01-September-2006 South Burnett Data Entry commences. 15-September-2006 South Burnett Data Entry finalised. 22-September-2006 TTNQ Data Entry finalised. 29-September-2006 Report Regional outcomes. 14-October-2006 Pilot Sub Committee report due.
7
Research and Pilot Study
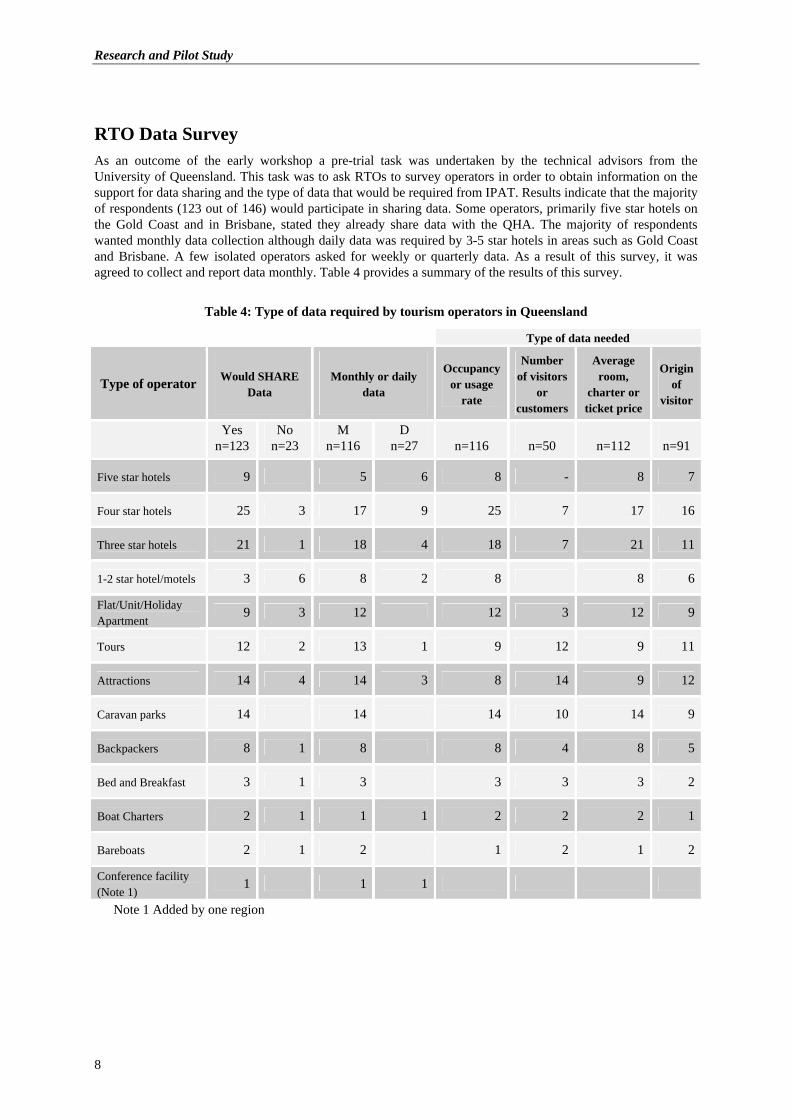
RTO Data Survey As an outcome of the early workshop a pre-trial task was undertaken by the technical advisors from the University of Queensland. This task was to ask RTOs to survey operators in order to obtain information on the support for data sharing and the type of data that would be required from IPAT. Results indicate that the majority of respondents (123 out of 146) would participate in sharing data. Some operators, primarily five star hotels on the Gold Coast and in Brisbane, stated they already share data with the QHA. The majority of respondents wanted monthly data collection although daily data was required by 3-5 star hotels in areas such as Gold Coast and Brisbane. A few isolated operators asked for weekly or quarterly data. As a result of this survey, it was agreed to collect and report data monthly. Table 4 provides a summary of the results of this survey.
Table 4: Type of data required by tourism operators in Queensland
Type of data needed
Type of operator
Would SHARE
Data
Monthly or daily
data
Occupancy or usage
rate
Number of visitors
or customers
Average room,
charter or ticket price
Origin of
visitor
Yes n=123
No n=23
M n=116
D n=27
n=116
n=50
n=112
n=91
Five star hotels 9 5 6 8 - 8 7
Four star hotels 25 3 17 9 25 7 17 16
Three star hotels 21 1 18 4 18 7 21 11
1-2 star hotel/motels 3 6 8 2 8 8 6
Flat/Unit/Holiday Apartment
9 3 12 12 3 12 9
Tours 12 2 13 1 9 12 9 11
Attractions 14 4 14 3 8 14 9 12
Caravan parks 14 14 14 10 14 9
Backpackers 8 1 8 8 4 8 5
Bed and Breakfast 3 1 3 3 3 3 2
Boat Charters 2 1 1 1 2 2 2 1
Bareboats 2 1 2 1 2 1 2
Conference facility (Note 1)
1 1 1
Note 1 Added by one region
8
INDUSTRY PERFORMANCE ANALYSER FOR TOURISM (IPAT)
Data Series and Specifications The IPAT trial planned to collect data from 5 star hotels and backpacker establishments in TNQ and wineries in the South Burnett creating three data series. It was originally planned that all five 5 star hotels in TNQ would be involved and data would be electronically sourced from QHA. The QHA already receive data from these 5 star hotels and it was thought that sourcing the required data electronically would avoid work for the hotel staff. The trial also involved backpacker establishments in TNQ. There were nine wineries that agreed to participate in the trial in the South Burnett and one dropped out leaving 8 participants.
The questions asked in the trial were selected by RTOs representatives in conjunction with operators and are provided in Table 5. In the trial, definitions for each data item were consistent with the definitions used by R-TAM.
Table 5: Regions, series, questions and frequency for data collection
Region and series Question Frequency Tropical North Queensland
1. What was your average room rate? Monthly Five Star hotels 2. What was your room rate? Monthly
1. How many bed nights did you sell? Monthly Backpacker 2. What was your average bed rate? Monthly
South Burnett
1. How many visitors did you have? Monthly 2. How many visitors were returning visitors? Monthly 3. How many visitors were on daytrips? Monthly 4. How many visitors were staying overnight? Monthly 5. What was the total number of visitors just passing through? Monthly 6. How many bottles of wine were sold? Monthly 7. What was the total number of international visitors? Monthly 8. What was the total number of domestic visitors? Monthly 9. What was the total number of visitors from QLD? Monthly 10. What was the total number of visitors from NSW? Monthly 11. What was the total number of visitors from VIC? Monthly 12. What was the total number of visitors from ACT? Monthly 13. What was the total number of visitors from TAS? Monthly 14. What was the total number of visitors from NT? Monthly 15. What was the total number of visitors from SA? Monthly
Wineries
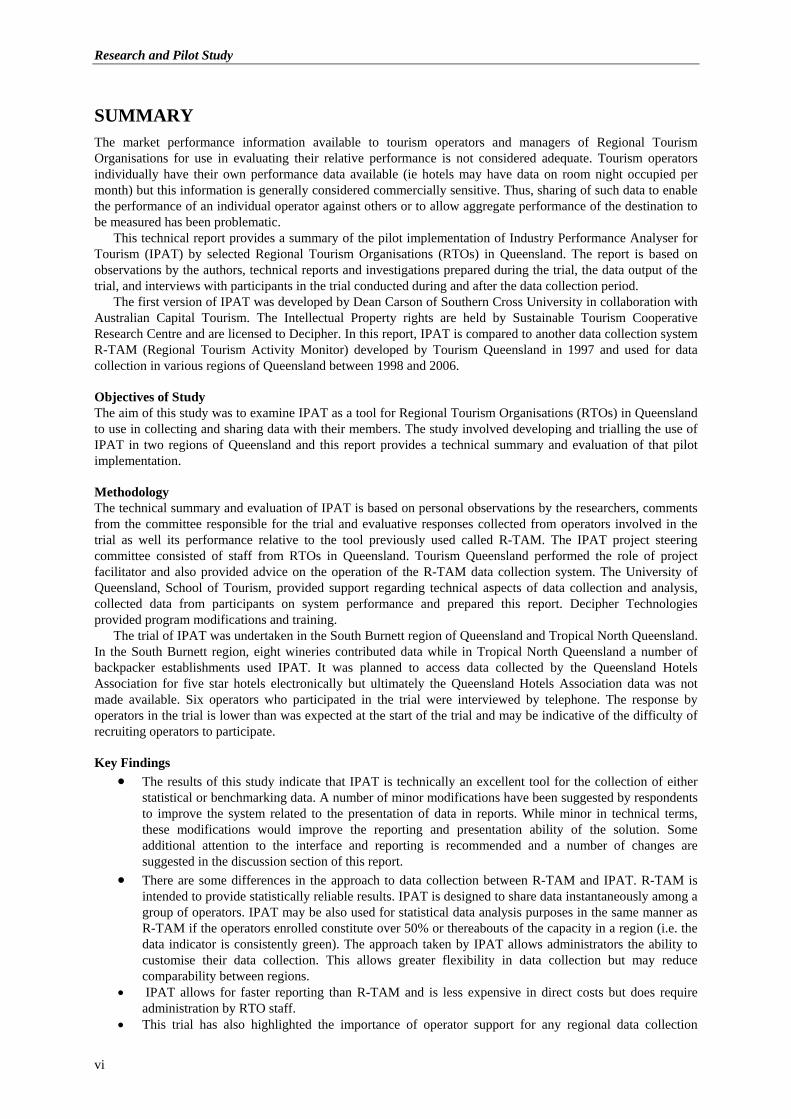
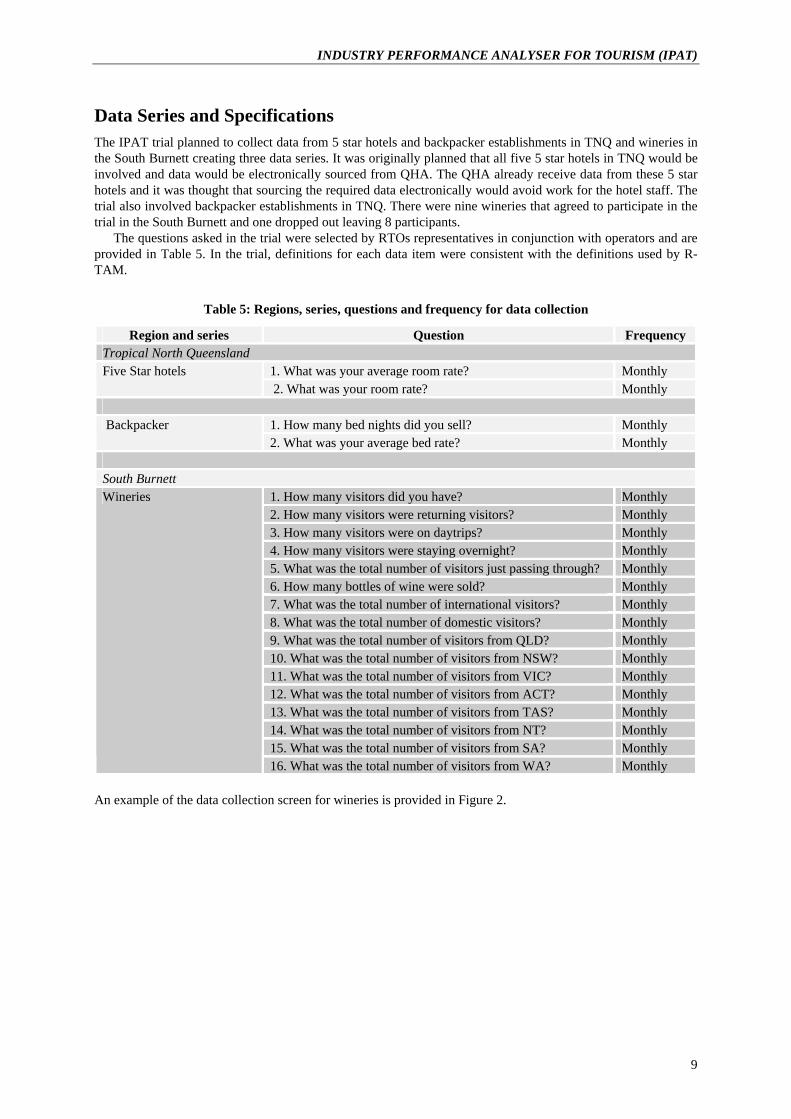
16. What was the total number of visitors from WA? Monthly An example of the data collection screen for wineries is provided in Figure 2.
9
Research and Pilot Study
Please enter the Reporting Month and Year and the shaded area in the daily sheets
Month: September Year 2006
Once the sheets are complete at the end of the month, the following results can be entered into the IPAT solution.
1 How many visitors did you have? 0
2 How many visitors were returning visitors? 0
3 How many visitors were on day trips? 0
4 How many visitors were staying overnight? 0
5 How many visitors were just passing through? 0
6 How many bottles of wine were sold? 0
7 Total Number of International visitors? 0
8 Total Number of Domestic visitors? 0
9 What was the total number of visitors from QLD? 0
10 What was the total number of visitors from NSW? 0
11 What was the total number of visitors from VIC? 0
12 What was the total number of visitors from ACT? 0
13 What was the total number of visitors from TAS? 0
14 What was the total number of visitors from NT? 0
15 What was the total number of visitors from SA? 0
16 What was the total number of visitors from WA? 0
IPATMonthly Totals
Figure 2: Data collection screen for wineries
Operational Specifications One important difference between R-TAM and IPAT is the role of the RTO. In IPAT, the RTO is the regional IPAT administrator and has overall responsibility. As a result RTOs were responsible for recruitment and training of operators and other aspects of the operation of the trial. During the trial, a number of issues were examined. These are discussed below.
Electronic Data Exchange At the beginning of the trial, it was proposed to examine the possibility of electronically accessing QHA data collected from 5 star hotels in Cairns rather than asking the hotels to re-enter this data in IPAT. During the trial, the QHA and Australian Hotels Association (AHA) were approached by representatives of Decipher Technologies. No resolution was reached on this issue at the time of writing this report.
Seamless Transition from R-TAM to IPAT At the beginning of the trial, it was planned to investigate whether R-TAM operator participations and their historical data records could be transferred to the IPAT system. Investigations determined that obtaining each record would require a separate signed agreement from each operator (current and past).
It was found possible to transfer aggregate statistical data for each series. However, this would only be useful if the operators involved in a series remained the same from R-TAM to IPAT.
10
INDUSTRY PERFORMANCE ANALYSER FOR TOURISM (IPAT)
Statistical Validity of IPAT Data compared to R-TAM During early discussions regarding IPAT, the statistical validity of the data was discussed. In R-TAM, data is reported in a series if over 50% of the capacity of the operators of that type in a region provides their data. Thus if there are 100, 3 star hotel rooms in a region then the operators who manage at least 50 rooms would be required to contribute their figures if data were to be released.
The IPAT system contains a feature to provide operators with an indication of the data ‘quality’ or reporting scope. This ‘stop light’ system shows a coloured indicator which changes colour to indicate the number of operators who have provided data and the coverage of operators participating as shown below:
Green - 3 or more operators and 50% or more of the operators enrolled (reporting scope). Amber - 3 or more operators and scope in under 50%. Red - under 3 operators: This cancels out the scope, so scope % is irrelevant. The difference between R-TAM and IPAT is due to the different approach to data collection used in each. R-
TAM is intended to provide statistical reliable results. IPAT is designed to share data among a group of operators instantaneously. IPAT may be also used for statistical data analysis purposes in the same manner as R-TAM if the operators enrolled constitute over 50% or thereabouts of the capacity in a region (i.e. the data indicator is consistently green).
Operator Training During the trial, Decipher staff developed a training website showing example data so that pilot participants could familiarise themselves with the operation of the IPAT system. This was a useful method of training and could be further developed. In addition a web-based tool called ‘Webex’ was used to provide a remote live demonstration of the capability and use of IPAT and this was very useful. Some information used as training material is provided in Appendix G.
RTO Administration - time required During the trial, there was speculation regarding the time involved in administering IPAT. The results from Tropical North Queensland suggest that the initial process of recruiting operators for IPAT, training, etc. would take 2-3 days per week for around 4 weeks. Thereafter administration was suggested to take around half a day a week. It may be expected that as the number of operators involved in IPAT increases, this time requirement will increase.
Data Ownership The issue of ownership of data was discussed during the pilot and it was agreed that the data collected in IPAT belongs to the operators who contribute it. However the aggregate data can be presented and distributed by the RTO.
Technical Software Specifications Most features of IPAT are straightforward. However two features were less obvious and are discussed here.
Category Types The IPAT system contains a feature that allows a particular series to be separated into particular categories of operators. RTOs can use Category Types to 'segment' operators within a single or range of Business Types to avoid creating Business Types for each and every reporting need. One example given was to report whether a business was on the mainland or located on an island. To better clarify this issue, if the requirement is for occasional reporting then this is a good method of avoiding the added cost and maintenance of creating numerous business types, however, if this is a core reporting requirement then a separate Business Type is Decipher's recommended method of setting up the system, i.e. Motels/Hotels & Serviced Apartments – Islands, Motels/Hotels & Serviced Apartments – Mainland.
Business Types provide greater flexibility in reporting and comparing data while Category Types are filters, enabling reporting, but lacking some of the comparison functionality of Business Types.
11

Research and Pilot Study
Reporting During the trial, RTOs representatives made comments about the format of reports produced by IPAT. It was considered that compared to R-TAM reports, IPAT charts were less easily interpreted. This issue remains unresolved as no comments were received on this from the two operators interviewed in this evaluation.
Further the pilot did not examine the reporting of IPAT results to a wider audience – for example RTO members generally.
Other Changes made during the Trial During the trial a number of modifications were made to IPAT software. These are shown in Appendix E.
12
INDUSTRY PERFORMANCE ANALYSER FOR TOURISM (IPAT)
Chapter 5
SOUTH BURNETT TRIAL
The results of the pilot were planned to be assessed in part through interviews with operators who participated. A survey (see Appendix F) was to be conducted by telephone and to involve an attempted contact with all participants. The survey was conducted in the weeks following the completion of the trial.
As at 10 October, eight wineries in the South Burnett region had participated in the trial and the backpacker establishments in TNQ were still considering entering data. Further, contact details for four wineries and two backpacker operators were provided to the consultant. Only five operators were able to be contacted by 11 October. Therefore this evaluation could only be based on five interviews.
Feedback from the two operators contacted in the South Burnett region indicated that no problems were experienced in using the system.
Participants provided suggestions which they felt would improve IPAT reporting. These include: • Ability to enter daily data on a weekly basis rather than only at the end of each month so as to minimise
the workload at the end of each month (TNQ). This function has subsequently been added to the IPAT system.
• IPAT will not produce reports unless it has a full month of data – an improvement would be to produce reports daily, that track daily occupancy and rates, which can then be aggregated into its monthly average so we can report month on month. This function is scheduled for addition to the IPAT system at the end of October 2006.
• Put $ in appropriate fields and remove decimal points from some fields so that only two are visible (e.g. total visitors) as it is not immediately clear what you are looking at in some of the tables. This function is scheduled for addition added to the IPAT system at the end of October 2006.
Reporting Wineries – South Burnett The wineries in the South Burnett entered monthly cellar door visitation data for September 2006. A range of wineries entered data and the following is a sample of the available reports. Note that the names of individual operator(s) in these reports have been removed to ensure confidentiality.
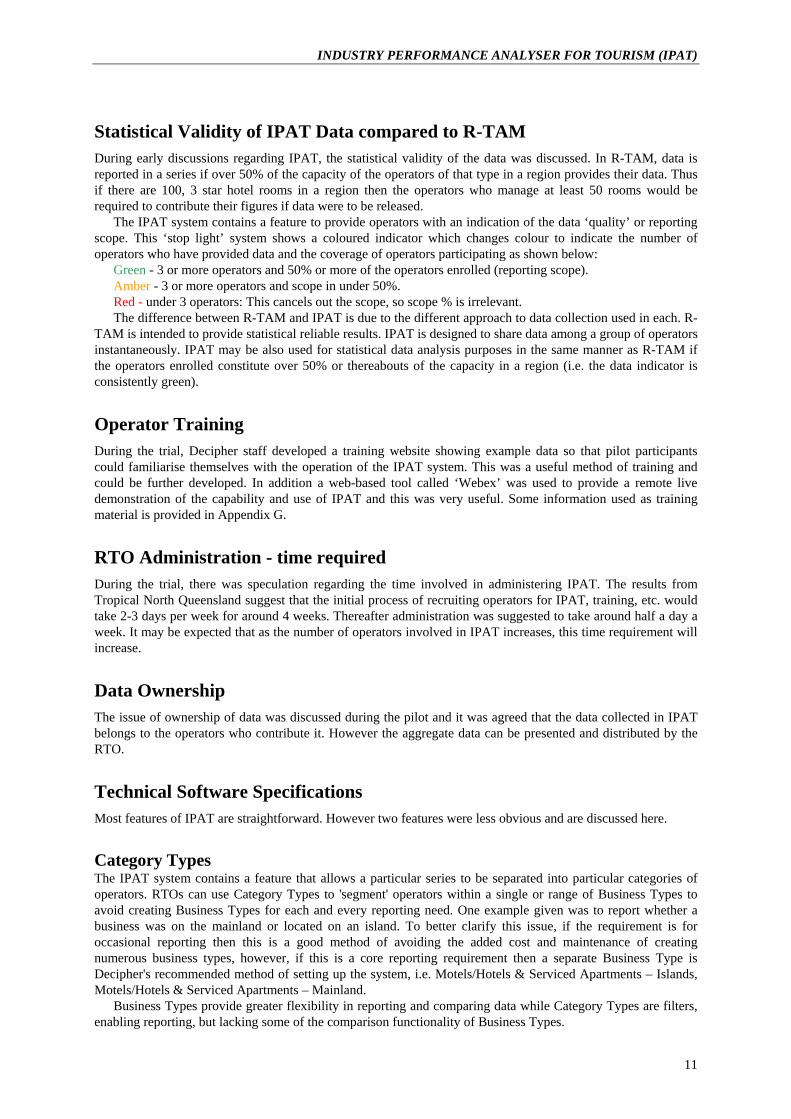
Example Individual Report – September 2006 – Operator Y Wines In this example only two questions have been selected; Number of Visitors and Bottles of Wine Sold. The ‘Change’ figures are blank due to the pilot only running for a single month.
Table 6: Individual monthly data for month September 2006
Variable Operator Y
Visitors 'Visitors' for Sept. 2006 369.00
Change in 'Visitors' from Aug. 2006
% Change in 'Visitors' year to date
% Change in 'Visitors' from Aug. 2006
% Change in 'Visitors' from Sept. 2005
Total of 'Visitors' year to date
% Change in 'Visitors' over the last 12 months
Bottles of wine sold 'Bottles of wine sold' for Sept. 2006 665.00
Change in 'Bottles of wine sold' from Aug. 2006
% Change in 'Bottles of wine sold' from Aug. 2006
% Change in 'Bottles of wine sold' from Sept. 2005
13
Research and Pilot Study
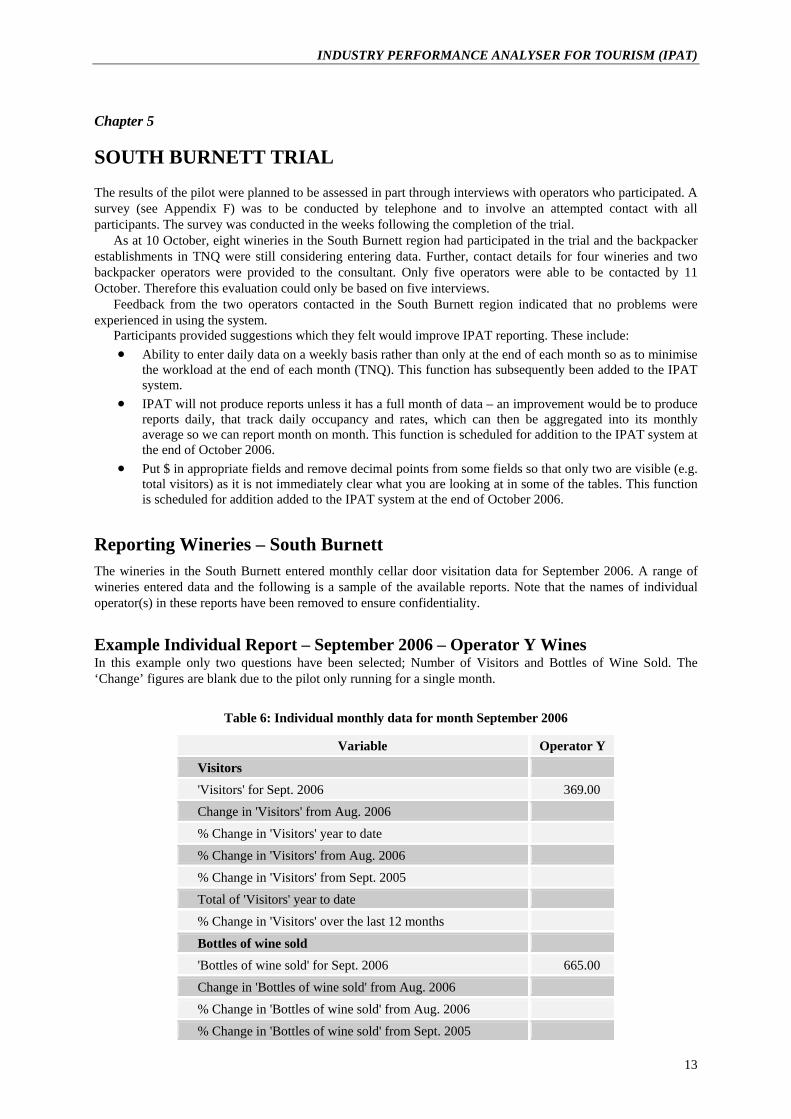
The following report uses the same selection but with the regional averages added. The number of data
entries has been reduced to demonstrate the statistical reliability measure. Thus the figure 324.25 (24%) is highlighted in red as this indicates that fewer than 50% of operators and less than three operators have contributed in this month.
Table 7: Regional monthly data for month September 2006
Variable Operator Y
South Burnett / Wineries Cellar Door (Region, Business Type)
Visitors 'Visitors' for Sept. 2006 369.00 324.25 (24%)
Change in 'Visitors' from Aug. 2006
% Change in 'Visitors' from Aug. 2006
% Change in 'Visitors' from Sept. 2005
Bottles of wine sold 'Bottles of wine sold' for Sept. 2006 665.00 414.25 (24%)
Change in 'Bottles of wine sold' from Aug. 2006
% Change in 'Bottles of wine sold' from Aug. 2006
% Change in 'Bottles of wine sold' from Sept. 2005 Statistical Reliability Indicators Used
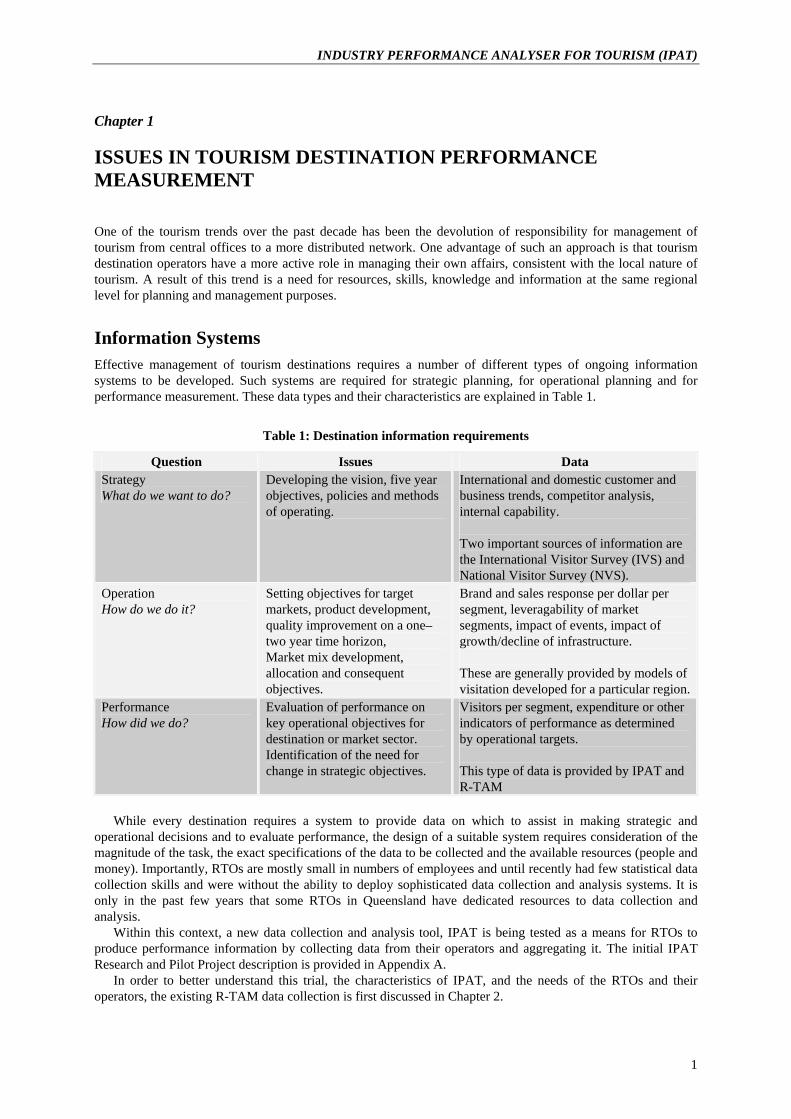
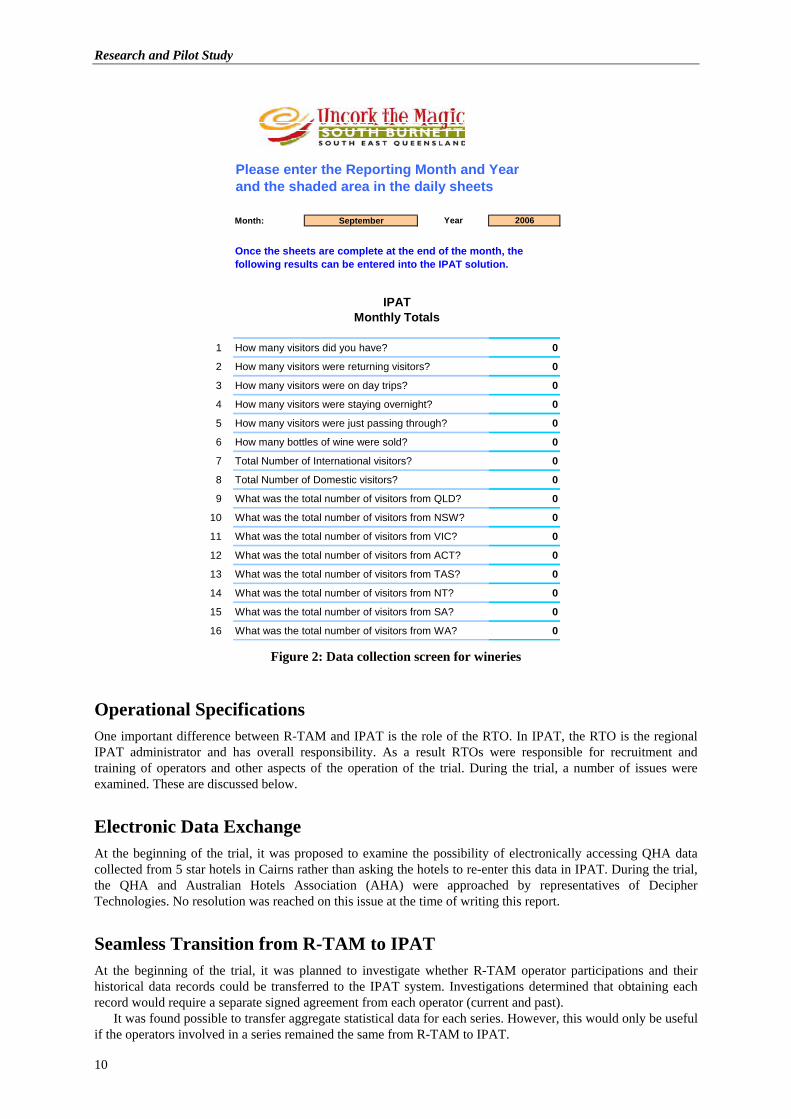
Actual Data over time or Change Report – Operator Y and Region The following report shows origin data for both Operator Y and the Region in both Graphical and Tabular formats. The selection shows Queensland and New South Wales Visitor Numbers. Note that because this trial has been for one month only – no historical data is shown in the graph.
Figure 3: Origin data - graphical
14
INDUSTRY PERFORMANCE ANALYSER FOR TOURISM (IPAT)
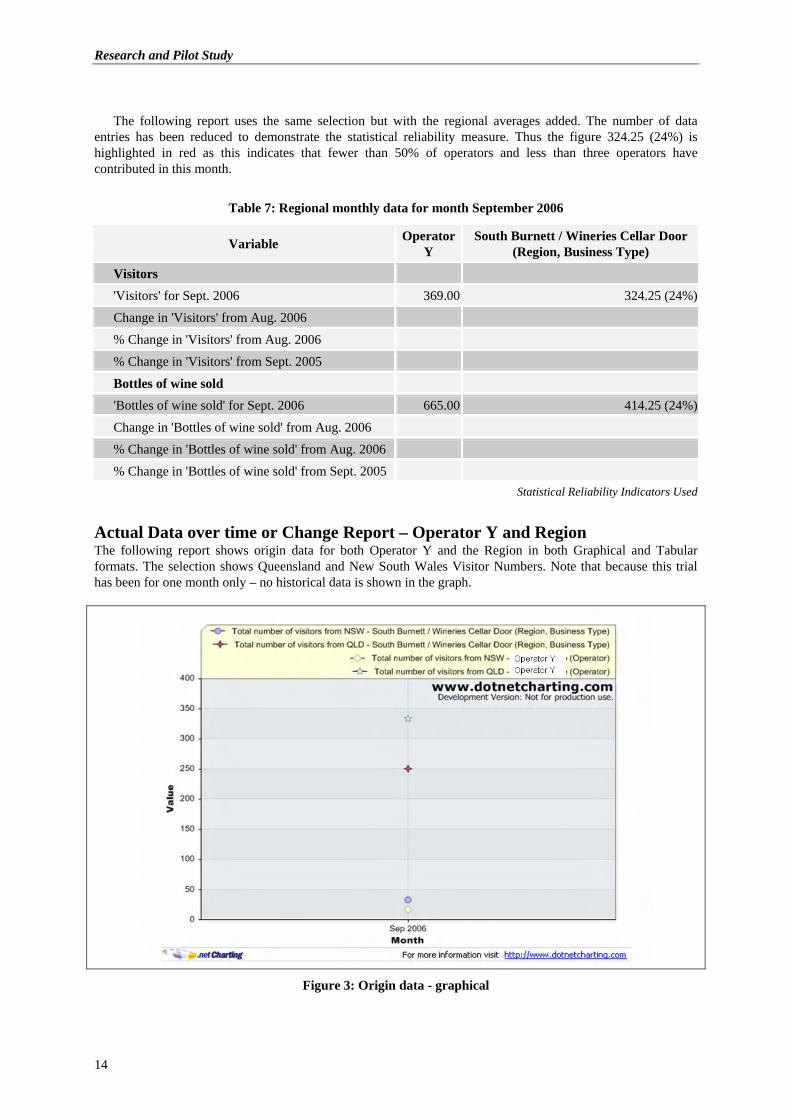
Tabular Report Once again the reports are only for a single month and so do not show trend data. IPAT does provide the ability to add historical data.
Table 8: Origin data - tabular
Month Total number of visitors from NSW
South Burnett / Wineries Cellar Door
(Region, Business Type)
Total number of visitors from QLD
South Burnett / Wineries Cellar Door
(Region, Business Type)
Total number of visitors from NSW
(Operator Y)
Total number of visitors from QLD
(Operator Y)
Sept. 2006 32.75 (24%) 250.50 (24%) 16.00 333.00
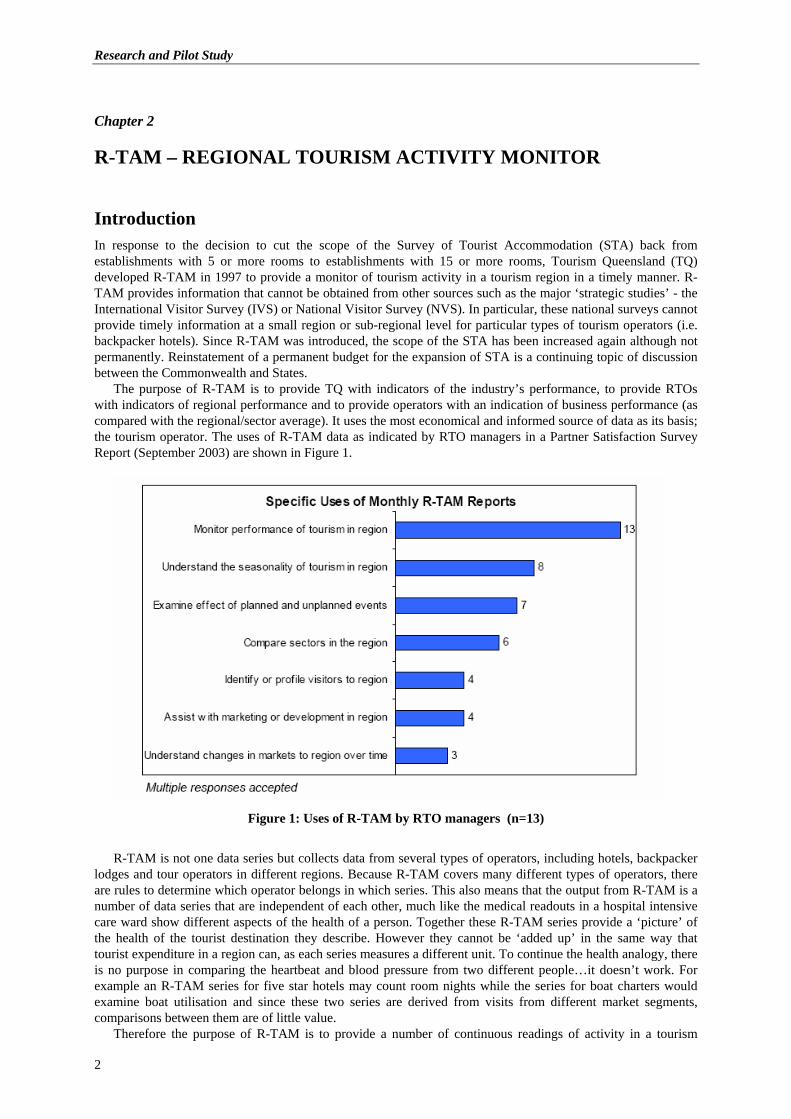
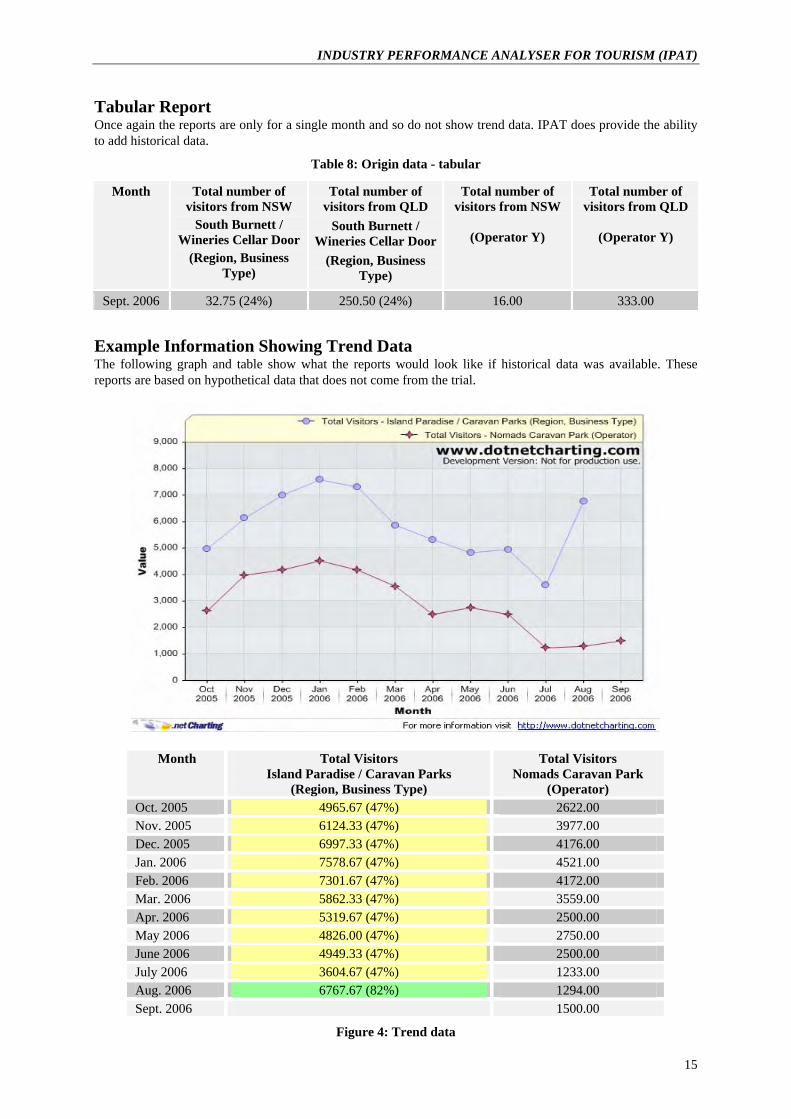
Example Information Showing Trend Data The following graph and table show what the reports would look like if historical data was available. These reports are based on hypothetical data that does not come from the trial.
Month Total Visitors Island Paradise / Caravan Parks
(Region, Business Type)
Total Visitors Nomads Caravan Park
(Operator) Oct. 2005 4965.67 (47%) 2622.00 Nov. 2005 6124.33 (47%) 3977.00 Dec. 2005 6997.33 (47%) 4176.00 Jan. 2006 7578.67 (47%) 4521.00 Feb. 2006 7301.67 (47%) 4172.00 Mar. 2006 5862.33 (47%) 3559.00 Apr. 2006 5319.67 (47%) 2500.00 May 2006 4826.00 (47%) 2750.00 June 2006 4949.33 (47%) 2500.00 July 2006 3604.67 (47%) 1233.00 Aug. 2006 6767.67 (82%) 1294.00 Sept. 2006 1500.00
Figure 4: Trend data
15
Research and Pilot Study Chapter 6
CONCLUSIONS AND RECOMMENDATIONS
So how did IPAT perform as a tool for tourism operators and regional tourism organisations?
In technical terms the pilot indicated that IPAT was an excellent tool for distributed collection of operator data. The results of the survey indicate operators who participated and were surveyed and RTO representatives considered IPAT technically an acceptable tool for data collection. It was considered to provide efficient and simple data entry and reporting. There were some suggestions by operators in the trial to improve the presentation of IPAT reports and the ease of data entry including the ability to add daily data weekly and also to mask decimals in reports. These changes have been made or are scheduled. However, it should be noted that this assessment is based on the operation of IPAT in two wineries in the South Burnett region and that it was too soon after the end of the first month for extensive comments on reports to be made by operators or RTO administrators. The respondent burden of IPAT is similar to that of R-TAM.
The implementation of IPAT in the South Burnett pilot appears to have gone smoothly. However there were problems experienced in gaining the support of backpacker operators in TNQ. Further issues arose in TNQ in accessing data from the Australian Hotel Association electronically. These problems do not appear at the time of writing to be technical issues connected to IPAT. In the case of five star hotels, the AHA has not yet provided a link to their system. In the case of backpacker operators in TNQ, it is possible they will agree to participate in future.
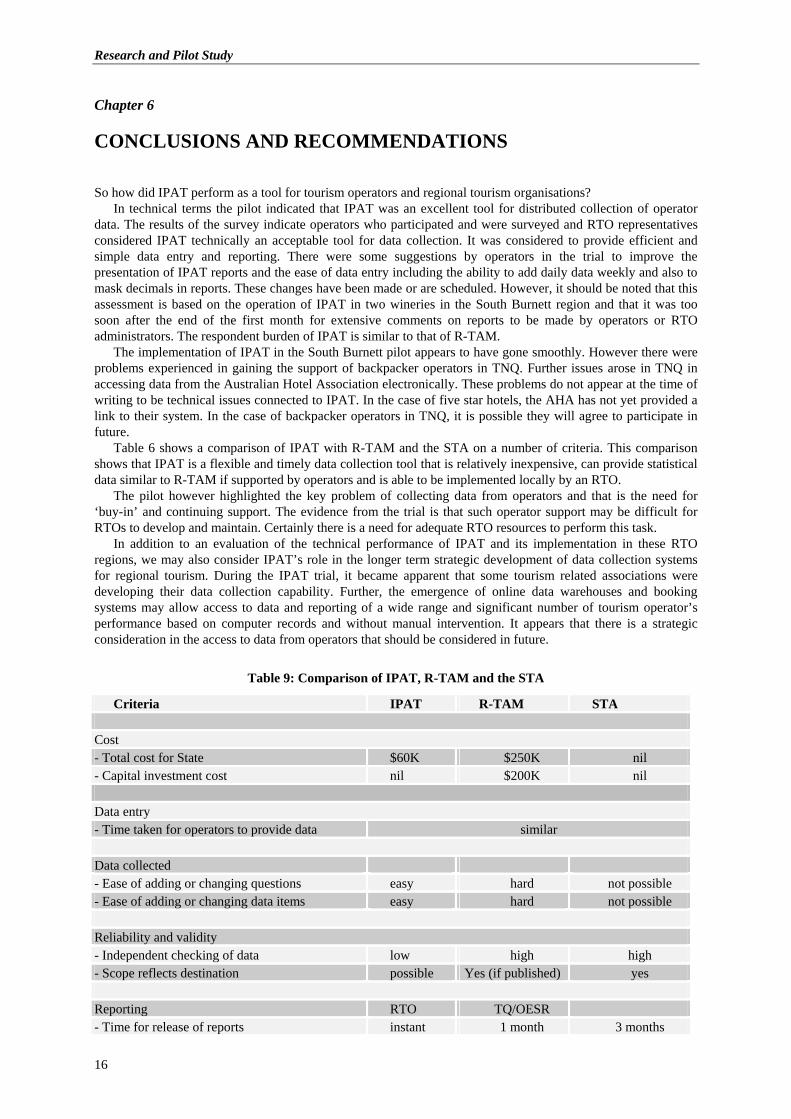
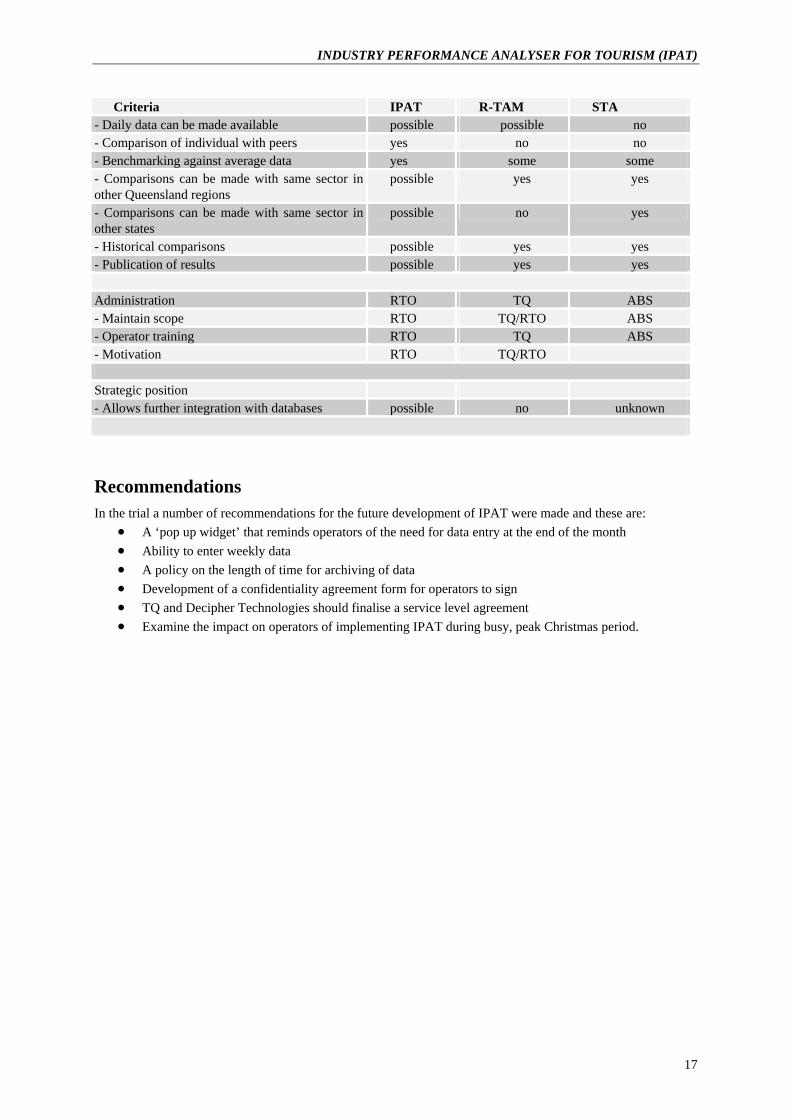
Table 6 shows a comparison of IPAT with R-TAM and the STA on a number of criteria. This comparison shows that IPAT is a flexible and timely data collection tool that is relatively inexpensive, can provide statistical data similar to R-TAM if supported by operators and is able to be implemented locally by an RTO.
The pilot however highlighted the key problem of collecting data from operators and that is the need for ‘buy-in’ and continuing support. The evidence from the trial is that such operator support may be difficult for RTOs to develop and maintain. Certainly there is a need for adequate RTO resources to perform this task.
In addition to an evaluation of the technical performance of IPAT and its implementation in these RTO regions, we may also consider IPAT’s role in the longer term strategic development of data collection systems for regional tourism. During the IPAT trial, it became apparent that some tourism related associations were developing their data collection capability. Further, the emergence of online data warehouses and booking systems may allow access to data and reporting of a wide range and significant number of tourism operator’s performance based on computer records and without manual intervention. It appears that there is a strategic consideration in the access to data from operators that should be considered in future.
Table 9: Comparison of IPAT, R-TAM and the STA
Criteria IPAT R-TAM STA Cost - Total cost for State $60K $250K nil - Capital investment cost nil $200K nil
Data entry - Time taken for operators to provide data similar
Data collected - Ease of adding or changing questions easy hard not possible - Ease of adding or changing data items easy hard not possible
Reliability and validity - Independent checking of data low high high - Scope reflects destination possible Yes (if published) yes
Reporting RTO TQ/OESR - Time for release of reports instant 1 month 3 months
16
INDUSTRY PERFORMANCE ANALYSER FOR TOURISM (IPAT)
Criteria IPAT R-TAM STA - Daily data can be made available possible possible no - Comparison of individual with peers yes no no - Benchmarking against average data yes some some - Comparisons can be made with same sector in other Queensland regions
possible yes yes
- Comparisons can be made with same sector in other states
possible no yes
- Historical comparisons possible yes yes - Publication of results possible yes yes
Administration RTO TQ ABS - Maintain scope RTO TQ/RTO ABS - Operator training RTO TQ ABS - Motivation RTO TQ/RTO
Strategic position - Allows further integration with databases possible no unknown
Recommendations In the trial a number of recommendations for the future development of IPAT were made and these are:
• A ‘pop up widget’ that reminds operators of the need for data entry at the end of the month • Ability to enter weekly data • A policy on the length of time for archiving of data • Development of a confidentiality agreement form for operators to sign • TQ and Decipher Technologies should finalise a service level agreement • Examine the impact on operators of implementing IPAT during busy, peak Christmas period.
17

Research and Pilot Study
APPENDIX A: IPAT RESEARCH & PILOT PROJECT WITH TOURISM QLD FOR QLD RTOS
The pilot program we are engaging in is to define, construct, and test IPAT (Industry Performance Analyser for Tourism) for take up by Queensland Regional Tourism Organisations (RTO). A steering committee of five RTOs plus Tourism Queensland (TQ) and STS will develop the prototype IPAT for RTOs off line via a series of meetings. Once this prototype is complete it will be deployed for field testing in one RTO region. All results and feedback will be communicated to the steering committee and other RTOs. Sustainable Tourism Cooperative Research Centre (STCRC) and TQ have agreed to provide funding and support (respectively). The take up or roll out by RTOs will be on strictly commercial terms. The business case including subscription costs, support services, warranties etc will be developed by Sustainable Tourism Services (STS) during the program in collaboration with the steering committee. If either STS or the RTOs believe that the final online product and its services are not suitable to progress than neither party is obligated to continue to offer or to utilise the IPAT service. Research Requirements The School of Tourism at the University of Queensland will provide advice on the development of IPAT as a tool for provision of timely volumetric data on regional and sectoral tourism. This advice will involve:
1. technical support for meetings with the reference group; 2. specification of data validation, reporting and other program requirements; 3. technical support during the trial; 4. evaluation of results (if required).
Existing IPAT The existing data collection program – Online Industry Performance Analyser – Tourism or IPAT is an online system for collecting data from tourism businesses, and reporting that data back to businesses in individual and aggregated form. IPAT can allow users to track individual performance over time, and to view and compare their performance against other operators or groups of operators within and across sectors. IPAT can currently service six tourism sectors: commercial accommodation; bed and breakfast establishments; tour operators; attractions; wineries and visitor information centres. Developing a business case for offering an upgraded IPAT as a commercial product It is proposed to examine the feasibility of developing IPAT as a commercial product to be offered to Queensland RTOs as a means of collecting data for their operators. The aim of this trial is to examine if a business case is possible. There is no guarantee that this business case will be feasible. Developing the IPAT upgrade specification In order to ensure that any upgrade to the existing IPAT program meets user specifications, it is proposed to discuss these requirements with a reference committee. This reference committee will consist of around 5 RTO managers. This committee will meet 3-5 times to discuss their expectations of the IPAT operation and output. From these meeting a specification for the output of the IPAT upgrade will be developed. Developing the program logic to support data input, validation and reporting Based on this specification, a set of data collection scenarios and information on the detailed implementation of the trial, develop
• a series of definitions for classifying of tourism businesses into groups (i.e. attraction, B+B, motel, hotel) as required.
18
INDUSTRY PERFORMANCE ANALYSER FOR TOURISM (IPAT)
• a specification of data required for the database (i.e. address, contact, telephone, room numbers, classification,
• a specification on operator, RTO and other reporting.
The trial In order to help develop this business case, it is proposed to trial the introduction of IPAT in one region over two months.
Validation Validation of results will involve
• Examination of the relationship between results and other data • Examination of the operator feedback.
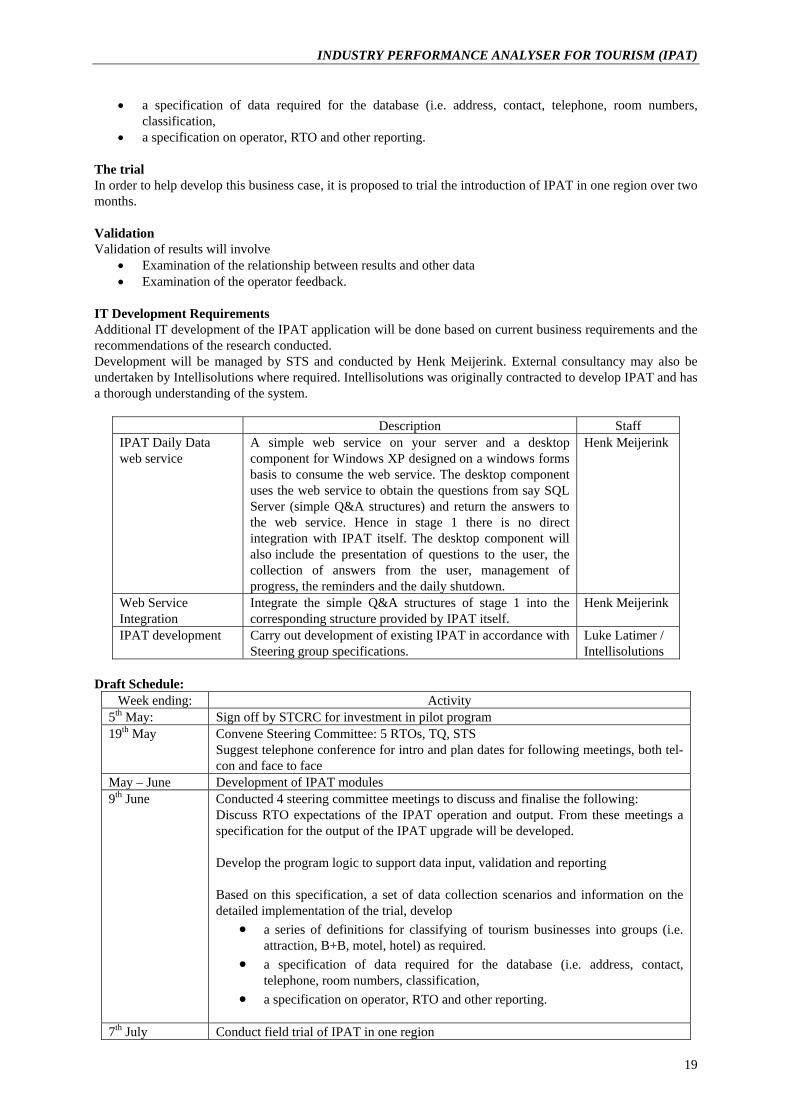
IT Development Requirements Additional IT development of the IPAT application will be done based on current business requirements and the recommendations of the research conducted. Development will be managed by STS and conducted by Henk Meijerink. External consultancy may also be undertaken by Intellisolutions where required. Intellisolutions was originally contracted to develop IPAT and has a thorough understanding of the system.
Description Staff IPAT Daily Data web service
A simple web service on your server and a desktop component for Windows XP designed on a windows forms basis to consume the web service. The desktop component uses the web service to obtain the questions from say SQL Server (simple Q&A structures) and return the answers to the web service. Hence in stage 1 there is no direct integration with IPAT itself. The desktop component will also include the presentation of questions to the user, the collection of answers from the user, management of progress, the reminders and the daily shutdown.
Henk Meijerink
Web Service Integration
Integrate the simple Q&A structures of stage 1 into the corresponding structure provided by IPAT itself.
Henk Meijerink
IPAT development Carry out development of existing IPAT in accordance with Steering group specifications.
Luke Latimer / Intellisolutions
Draft Schedule:
Week ending: Activity 5th May: Sign off by STCRC for investment in pilot program 19th May Convene Steering Committee: 5 RTOs, TQ, STS
Suggest telephone conference for intro and plan dates for following meetings, both tel-con and face to face
May – June Development of IPAT modules 9th June Conducted 4 steering committee meetings to discuss and finalise the following:
Discuss RTO expectations of the IPAT operation and output. From these meetings a specification for the output of the IPAT upgrade will be developed. Develop the program logic to support data input, validation and reporting Based on this specification, a set of data collection scenarios and information on the detailed implementation of the trial, develop
• a series of definitions for classifying of tourism businesses into groups (i.e. attraction, B+B, motel, hotel) as required.
• a specification of data required for the database (i.e. address, contact, telephone, room numbers, classification,
• a specification on operator, RTO and other reporting.
7th July Conduct field trial of IPAT in one region
19
Research and Pilot Study
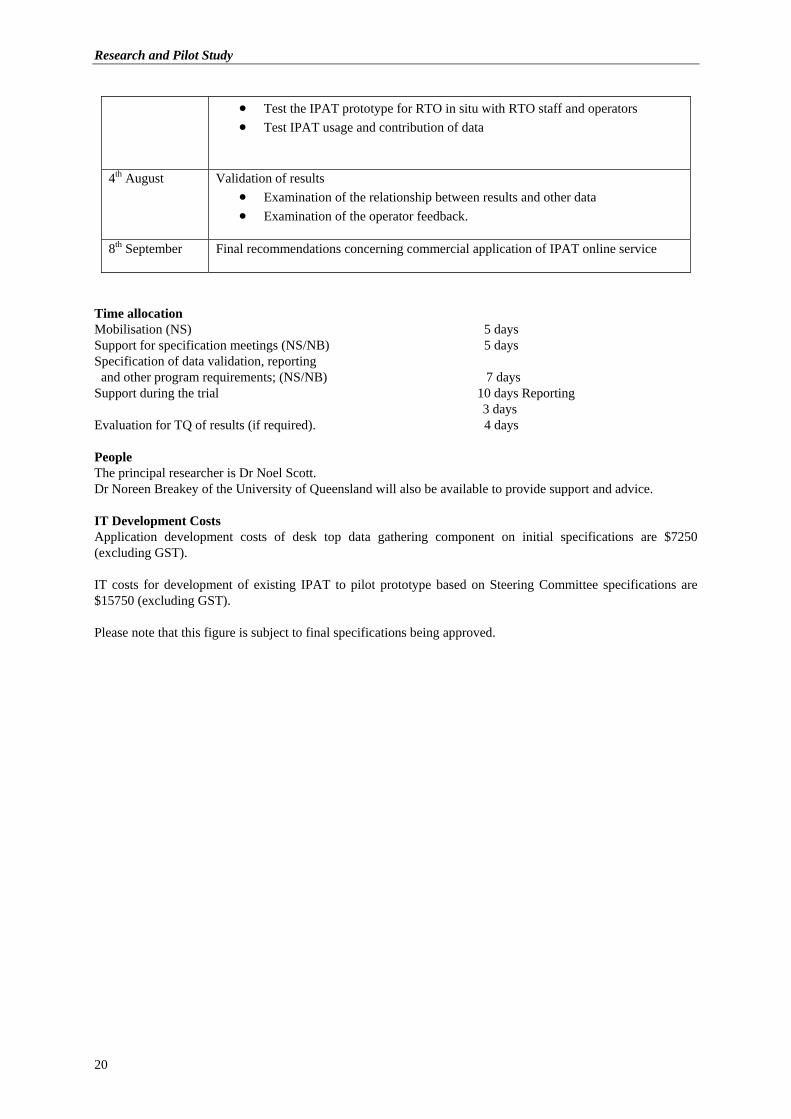
• Test the IPAT prototype for RTO in situ with RTO staff and operators • Test IPAT usage and contribution of data
4th August Validation of results • Examination of the relationship between results and other data • Examination of the operator feedback.
8th September Final recommendations concerning commercial application of IPAT online service
Time allocation Mobilisation (NS) 5 days Support for specification meetings (NS/NB) 5 days Specification of data validation, reporting and other program requirements; (NS/NB) 7 days Support during the trial 10 days Reporting 3 days Evaluation for TQ of results (if required). 4 days People The principal researcher is Dr Noel Scott. Dr Noreen Breakey of the University of Queensland will also be available to provide support and advice. IT Development Costs Application development costs of desk top data gathering component on initial specifications are $7250 (excluding GST). IT costs for development of existing IPAT to pilot prototype based on Steering Committee specifications are $15750 (excluding GST). Please note that this figure is subject to final specifications being approved.
20
INDUSTRY PERFORMANCE ANALYSER FOR TOURISM (IPAT)
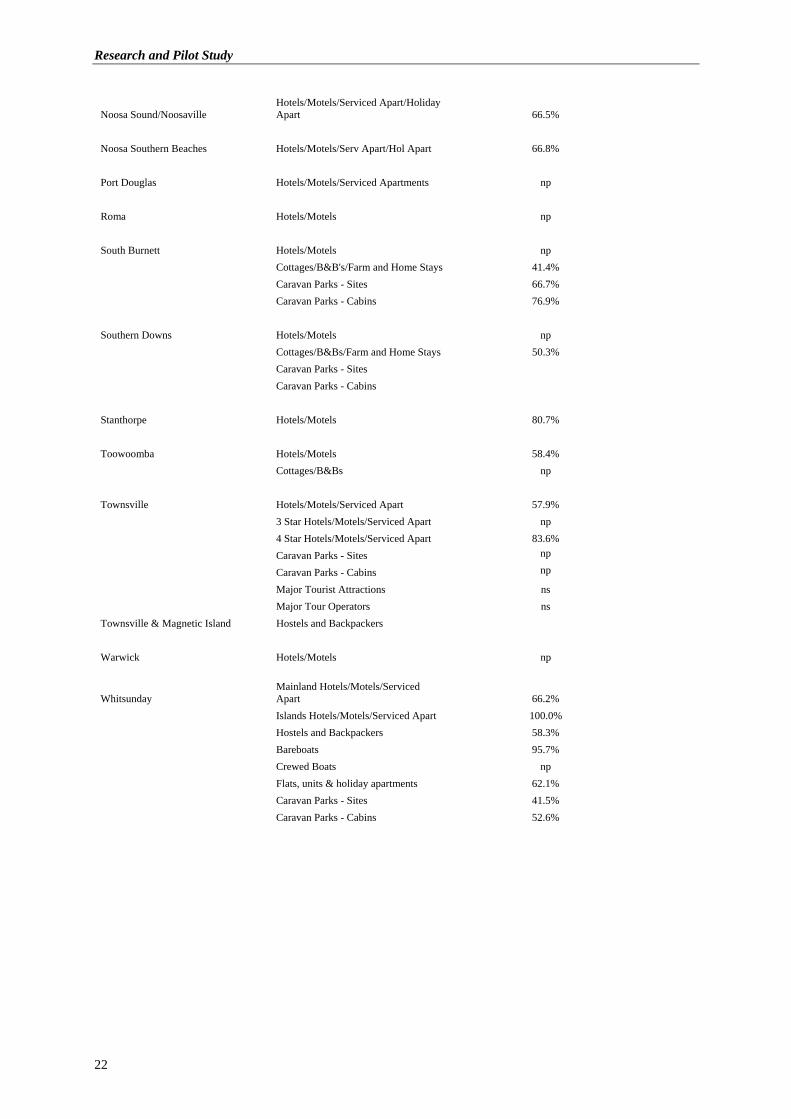
APPENDIX B: R-TAM SCOPE & COVERAGE FEBRUARY 2006
Collection area Type Series coverage Atherton Tableland Attractions ns Brisbane Hotels/Motels/Serviced Apartments 74.9% 4 Star Hotels 75.2% 5 Star Hotels 99.1% Hostels and Backpackers 56.0% Bundaberg Caravan Parks - Sites np Caravan Parks - Cabins np Hotels/Motels/Serviced Apartments 51.3% Cairns 3 Star Hotels/Motels/Serviced Apart np 4 Star Hotels 76.2% 5 Star Hotels 100.0% Cairns City Hotels/Motels/Serviced Apartments 50.7% Cairns Beaches Hotels/Motels/Serviced Apartments 52.6% Cairns to Port Douglas Tours/Tourist Attractions (All) ns Reef-based Cruises & Tours ns Major Tourist Attractions ns Large Reef-based Cruises Tours ns Caloundra City Serviced Apart/Flats/Holiday Units 52.1% Gold Coast 4 Star Hotels 85.8% 5 Star Hotels 86.6% Backpackers 56.0%
Broadbeach Serviced Apart/Flats/Holiday Units 56.8%
Surfers Paradise Serviced Apart/Flats/Holiday Units *
Hervey Bay Hotels/Motels/Serviced Apartments 54.4% Caravan Parks - Sites 58.5% Caravan Parks - Cabins 32.7% Hostels & Backpackers 65.7% Ipswich Attractions ns
Hotels, Motels and Serviced Apartments np
Mackay Hotels/Motels/Serviced Apart 61.9% Flats, Units and Holiday Apart np Mackay and Sarina Caravan Parks - Sites np Caravan Parks - Cabins np Noosa B&B/Cottages np Hostels & Backpackers 77.7% Major Tour Operators ns Noosa Hill/Hastings Street Hotels/Motels/Serv Apart/Hol Apart 67.2%
21
Research and Pilot Study
Noosa Sound/Noosaville Hotels/Motels/Serviced Apart/Holiday Apart 66.5%
Noosa Southern Beaches Hotels/Motels/Serv Apart/Hol Apart 66.8% Port Douglas Hotels/Motels/Serviced Apartments np Roma Hotels/Motels np South Burnett Hotels/Motels np Cottages/B&B's/Farm and Home Stays 41.4% Caravan Parks - Sites 66.7% Caravan Parks - Cabins 76.9% Southern Downs Hotels/Motels np Cottages/B&Bs/Farm and Home Stays 50.3% Caravan Parks - Sites Caravan Parks - Cabins Stanthorpe Hotels/Motels 80.7% Toowoomba Hotels/Motels 58.4% Cottages/B&Bs np Townsville Hotels/Motels/Serviced Apart 57.9% 3 Star Hotels/Motels/Serviced Apart np 4 Star Hotels/Motels/Serviced Apart 83.6% Caravan Parks - Sites np
Caravan Parks - Cabins np
Major Tourist Attractions ns Major Tour Operators ns Townsville & Magnetic Island Hostels and Backpackers Warwick Hotels/Motels np
Whitsunday Mainland Hotels/Motels/Serviced Apart 66.2%
Islands Hotels/Motels/Serviced Apart 100.0% Hostels and Backpackers 58.3% Bareboats 95.7% Crewed Boats np Flats, units & holiday apartments 62.1% Caravan Parks - Sites 41.5% Caravan Parks - Cabins 52.6%
22
INDUSTRY PERFORMANCE ANALYSER FOR TOURISM (IPAT)
APPENDIX C: SAMPLE R-TAM REPORT
Extract Only
23
Research and Pilot Study
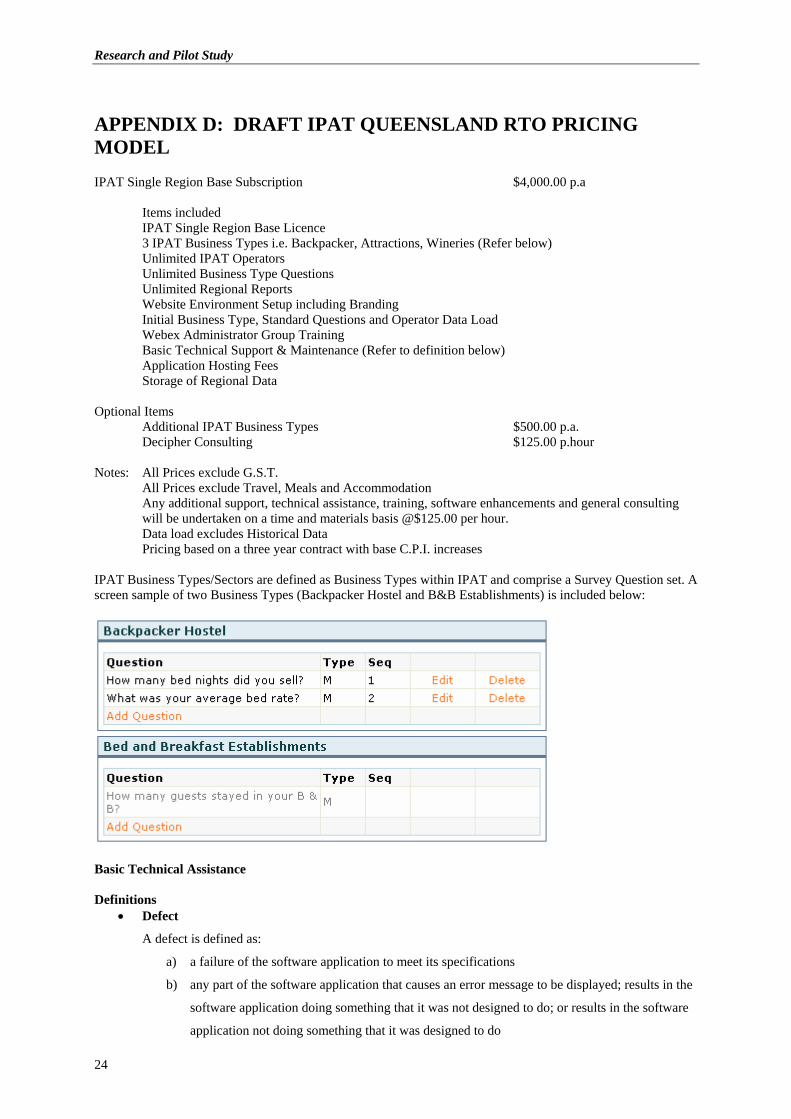
APPENDIX D: DRAFT IPAT QUEENSLAND RTO PRICING MODEL IPAT Single Region Base Subscription $4,000.00 p.a Items included IPAT Single Region Base Licence 3 IPAT Business Types i.e. Backpacker, Attractions, Wineries (Refer below) Unlimited IPAT Operators Unlimited Business Type Questions Unlimited Regional Reports Website Environment Setup including Branding Initial Business Type, Standard Questions and Operator Data Load Webex Administrator Group Training Basic Technical Support & Maintenance (Refer to definition below) Application Hosting Fees Storage of Regional Data Optional Items Additional IPAT Business Types $500.00 p.a. Decipher Consulting $125.00 p.hour Notes: All Prices exclude G.S.T. All Prices exclude Travel, Meals and Accommodation
Any additional support, technical assistance, training, software enhancements and general consulting will be undertaken on a time and materials basis @$125.00 per hour.
Data load excludes Historical Data Pricing based on a three year contract with base C.P.I. increases IPAT Business Types/Sectors are defined as Business Types within IPAT and comprise a Survey Question set. A screen sample of two Business Types (Backpacker Hostel and B&B Establishments) is included below:
Basic Technical Assistance Definitions
• Defect
A defect is defined as:
a) a failure of the software application to meet its specifications
b) any part of the software application that causes an error message to be displayed; results in the
software application doing something that it was not designed to do; or results in the software
application not doing something that it was designed to do
24
INDUSTRY PERFORMANCE ANALYSER FOR TOURISM (IPAT)
• Enhancement
An enhancement is defined as any modification, amendment, or addition to the software application.
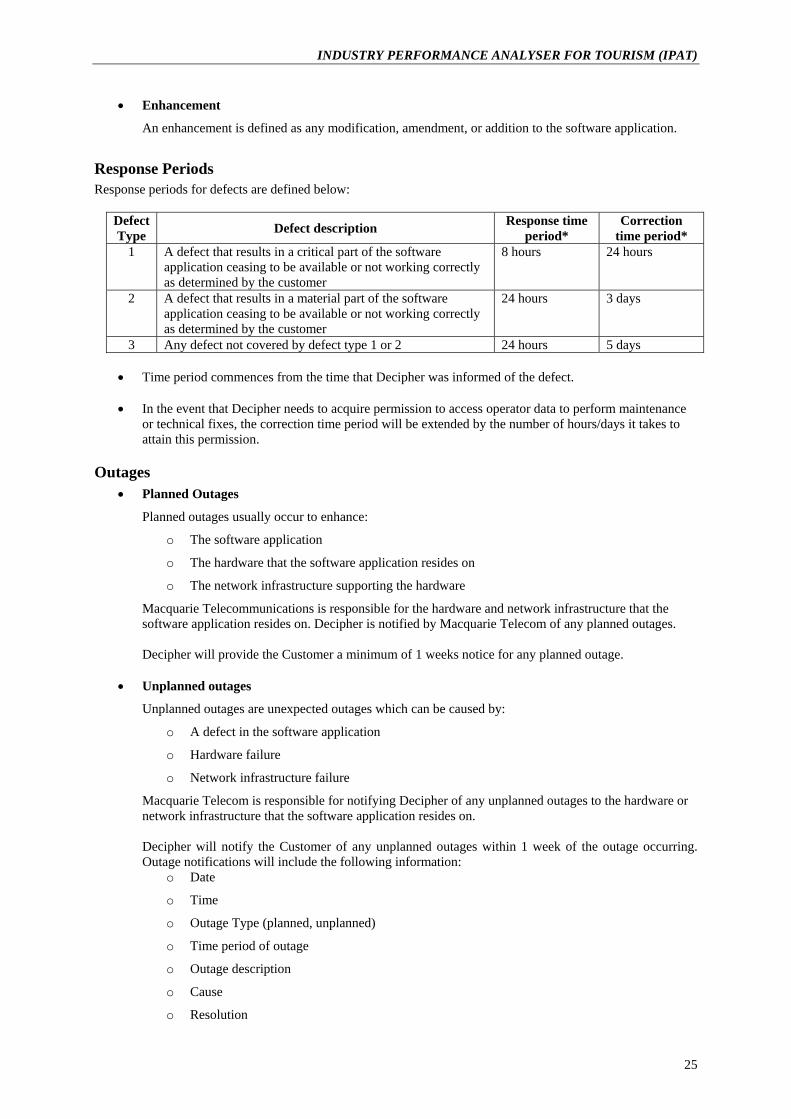
Response Periods Response periods for defects are defined below:
Defect Type Defect description Response time
period* Correction
time period* 1 A defect that results in a critical part of the software
application ceasing to be available or not working correctly as determined by the customer
8 hours 24 hours
2 A defect that results in a material part of the software application ceasing to be available or not working correctly as determined by the customer
24 hours 3 days
3 Any defect not covered by defect type 1 or 2 24 hours 5 days
• Time period commences from the time that Decipher was informed of the defect.
• In the event that Decipher needs to acquire permission to access operator data to perform maintenance or technical fixes, the correction time period will be extended by the number of hours/days it takes to attain this permission.
Outages • Planned Outages
Planned outages usually occur to enhance:
o The software application
o The hardware that the software application resides on
o The network infrastructure supporting the hardware
Macquarie Telecommunications is responsible for the hardware and network infrastructure that the software application resides on. Decipher is notified by Macquarie Telecom of any planned outages. Decipher will provide the Customer a minimum of 1 weeks notice for any planned outage.
• Unplanned outages
Unplanned outages are unexpected outages which can be caused by:
o A defect in the software application
o Hardware failure
o Network infrastructure failure
Macquarie Telecom is responsible for notifying Decipher of any unplanned outages to the hardware or network infrastructure that the software application resides on. Decipher will notify the Customer of any unplanned outages within 1 week of the outage occurring. Outage notifications will include the following information:
o Date
o Time
o Outage Type (planned, unplanned)
o Time period of outage
o Outage description
o Cause
o Resolution
25
Research and Pilot Study
APPENDIX E: IT DEVELOPMENT FOR QLD RTOS
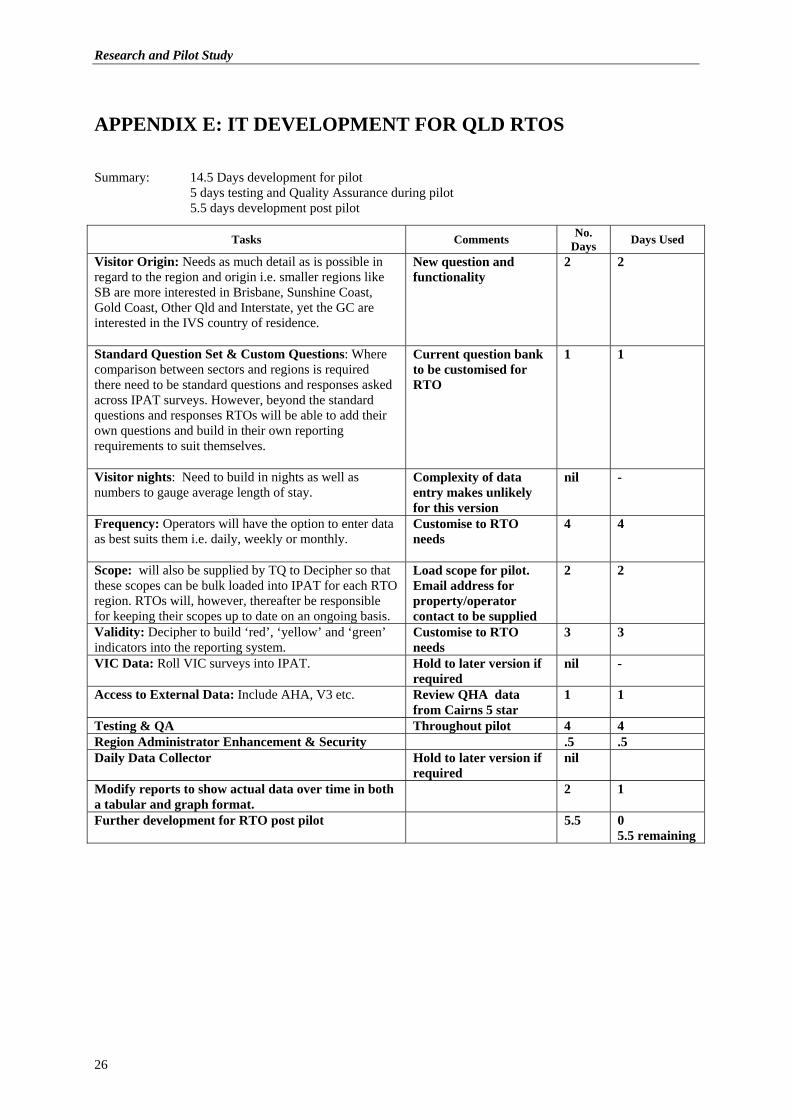
Summary: 14.5 Days development for pilot
5 days testing and Quality Assurance during pilot 5.5 days development post pilot
Tasks Comments No. Days Days Used
Visitor Origin: Needs as much detail as is possible in regard to the region and origin i.e. smaller regions like SB are more interested in Brisbane, Sunshine Coast, Gold Coast, Other Qld and Interstate, yet the GC are interested in the IVS country of residence.
New question and functionality
2 2
Standard Question Set & Custom Questions: Where comparison between sectors and regions is required there need to be standard questions and responses asked across IPAT surveys. However, beyond the standard questions and responses RTOs will be able to add their own questions and build in their own reporting requirements to suit themselves.
Current question bank to be customised for RTO
1 1
Visitor nights: Need to build in nights as well as numbers to gauge average length of stay.
Complexity of data entry makes unlikely for this version
nil -
Frequency: Operators will have the option to enter data as best suits them i.e. daily, weekly or monthly.
Customise to RTO needs
4 4
Scope: will also be supplied by TQ to Decipher so that these scopes can be bulk loaded into IPAT for each RTO region. RTOs will, however, thereafter be responsible for keeping their scopes up to date on an ongoing basis.
Load scope for pilot. Email address for property/operator contact to be supplied
2 2
Validity: Decipher to build ‘red’, ‘yellow’ and ‘green’ indicators into the reporting system.
Customise to RTO needs
3 3
VIC Data: Roll VIC surveys into IPAT. Hold to later version if required
nil -
Access to External Data: Include AHA, V3 etc. Review QHA data from Cairns 5 star
1 1
Testing & QA Throughout pilot 4 4 Region Administrator Enhancement & Security .5 .5 Daily Data Collector Hold to later version if
required nil
Modify reports to show actual data over time in both a tabular and graph format.
2 1
Further development for RTO post pilot 5.5 0 5.5 remaining
26

INDUSTRY PERFORMANCE ANALYSER FOR TOURISM (IPAT)
APPENDIX F: OUTLINE OF SURVEY
1. Introduction of survey and interviewer. Information about confidentiality of results. 2. Characteristics of participant and role in project
• Nature of involvement • Depth of involvement.
3. Satisfaction with aspects of IPAT implementation (Scale and open ended responses)
• Satisfaction with communication • Satisfaction with training • Satisfaction with program
o data entry o interface o results.
4. Any problems experienced and suggestions for improvement in IPAT. 5. Interest in continuing participation in IPAT.
27
Research and Pilot Study
APPENDIX G: IPAT TRAINING MANUAL & USER GUIDE
Welcome to IPAT Frequently Asked Questions General What is IPAT? IPAT is an online system for analysing the performance of the tourism industry. Operators entering data into the system will be able to track (and benchmark) their business performance against the average of operators in their sector or market. In turn, your region will be able to generate monthly reports, using aggregated data that monitor the health of the tourism industry across the region as well as by sector or market at regional and local levels. Who can participate in IPAT? IPAT is open to all tourism-related businesses. This includes accommodation providers, attractions, transport companies, tour operators, travel agents, business/conference venues, visitor information centres and wineries. The questions you are required to complete are tailored to suit your industry sector. How do I use the IPAT system? Contact your Regional Tourism Organisation to register. As an operator, you will receive a monthly reminder to enter your data. This will only take a few minutes of your time. You will immediately be able to access your individual data for analysis. Once three or more operators in your business sector have entered data, you will be able to compare your results for the sector as a whole. Your historical records will be maintained allowing you to compare past and present performance. How long will it take to complete the questions? The process of entering your data should take you no longer than five minutes. It is a basic four step process: 1) Click the IPAT link provided in your reminder email; 2) Login; 3) Enter your data; and, 4) Click submit. Once the information has been entered you will be able to access your data immediately for comparisons. CONTACTS Who do I contact for more information? For further information on IPAT, contact the IPAT administrator by emailing <<>> or contacting <<>> on (07) <<>>.
28

INDUSTRY PERFORMANCE ANALYSER FOR TOURISM (IPAT)
Who do I contact if the system isn’t working? If you run into technical difficulties please contact the IPAT administrator. The IPAT administrator is only available during business hours. Your email will be responded to within 48 hours. BENEFITS What are the benefits of participating in IPAT? Benefits of participating in IPAT include:
Quick indicator of trends in the industry through consistent and timely data about tourism at a regional and local level.
Allows for cross-sector comparisons. Measures the impact of positive and negative events as they occur and real-time tracking of
industry performance during critical periods (i.e. marketing campaigns or the impact of significant events).
Monitors recovery on a monthly basis. Benchmark your business. Addresses gaps in industry performance data of existing data collections.
Confidentiality Will my data remain confidential? We are acutely aware of the sensitive nature of the information and the need for confidentiality. All data collected will only be used at a top-line level and will not be disclosed to any third parties without your expressed consent. Is the business information I enter passed onto the Australian Taxation Office? The information you provide will not be passed onto the Australian Taxation Office or any other third party, unless otherwise advised by your business in writing to the IPAT administrator. Miscellaneous Do I have to pay a joining fee? It is free to join, contribute to IPAT and receive reports. Who is behind IPAT? IPAT is an innovation developed by the Sustainable Tourism Cooperative Research Centre, Australian Capital Tourism and the Australian Regional Tourism Research Centre.
29
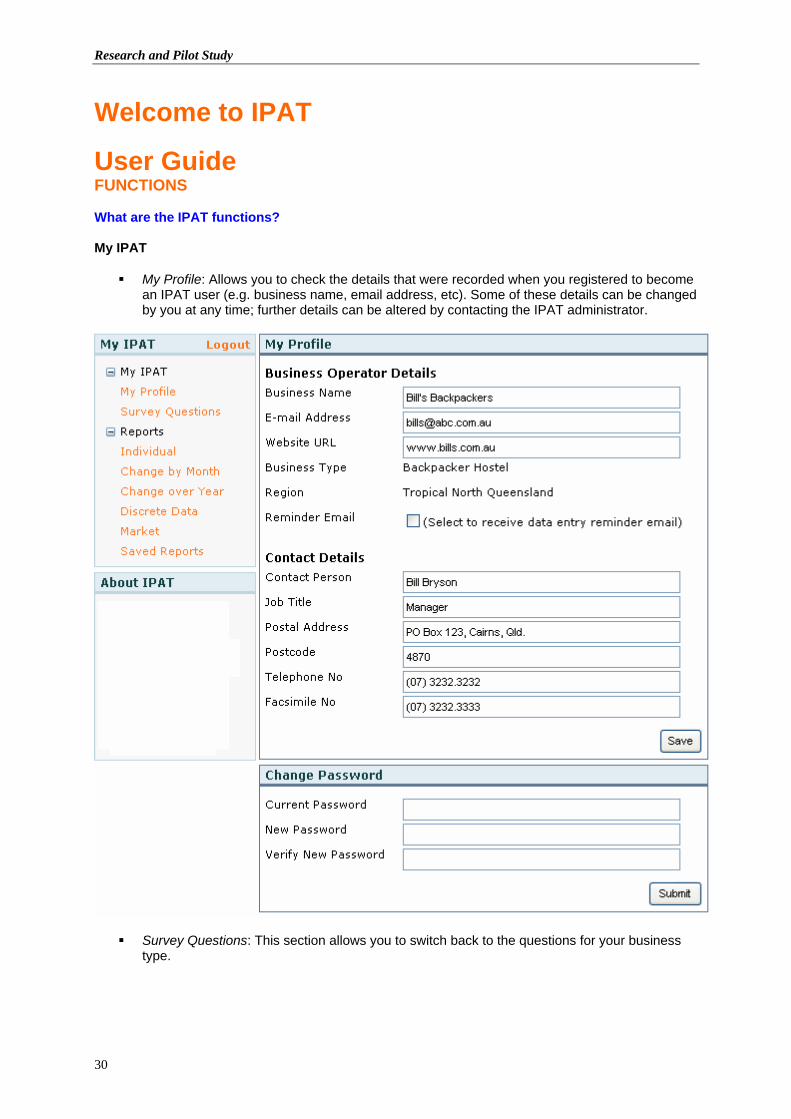
Research and Pilot Study
Welcome to IPAT
User Guide FUNCTIONS What are the IPAT functions? My IPAT
My Profile: Allows you to check the details that were recorded when you registered to become an IPAT user (e.g. business name, email address, etc). Some of these details can be changed by you at any time; further details can be altered by contacting the IPAT administrator.
Survey Questions: This section allows you to switch back to the questions for your business type.
30
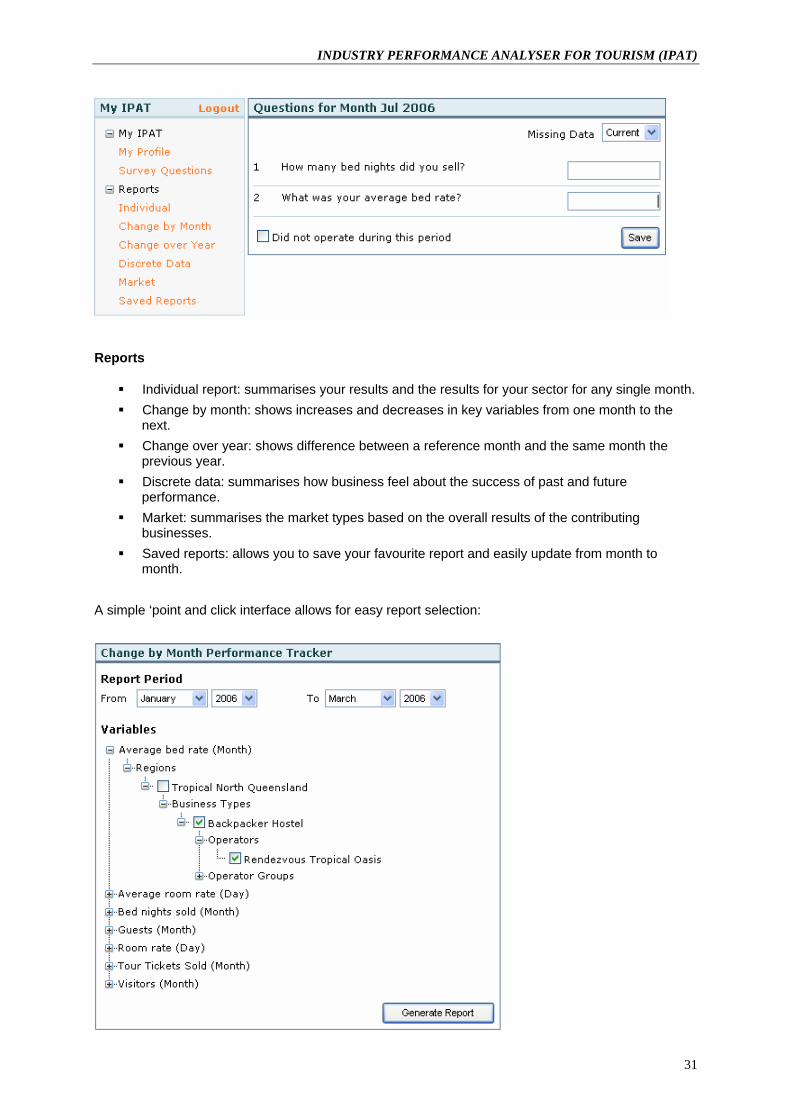
INDUSTRY PERFORMANCE ANALYSER FOR TOURISM (IPAT)
Reports
Individual report: summarises your results and the results for your sector for any single month. Change by month: shows increases and decreases in key variables from one month to the
next. Change over year: shows difference between a reference month and the same month the
previous year. Discrete data: summarises how business feel about the success of past and future
performance. Market: summarises the market types based on the overall results of the contributing
businesses. Saved reports: allows you to save your favourite report and easily update from month to
month. A simple ‘point and click interface allows for easy report selection:
31
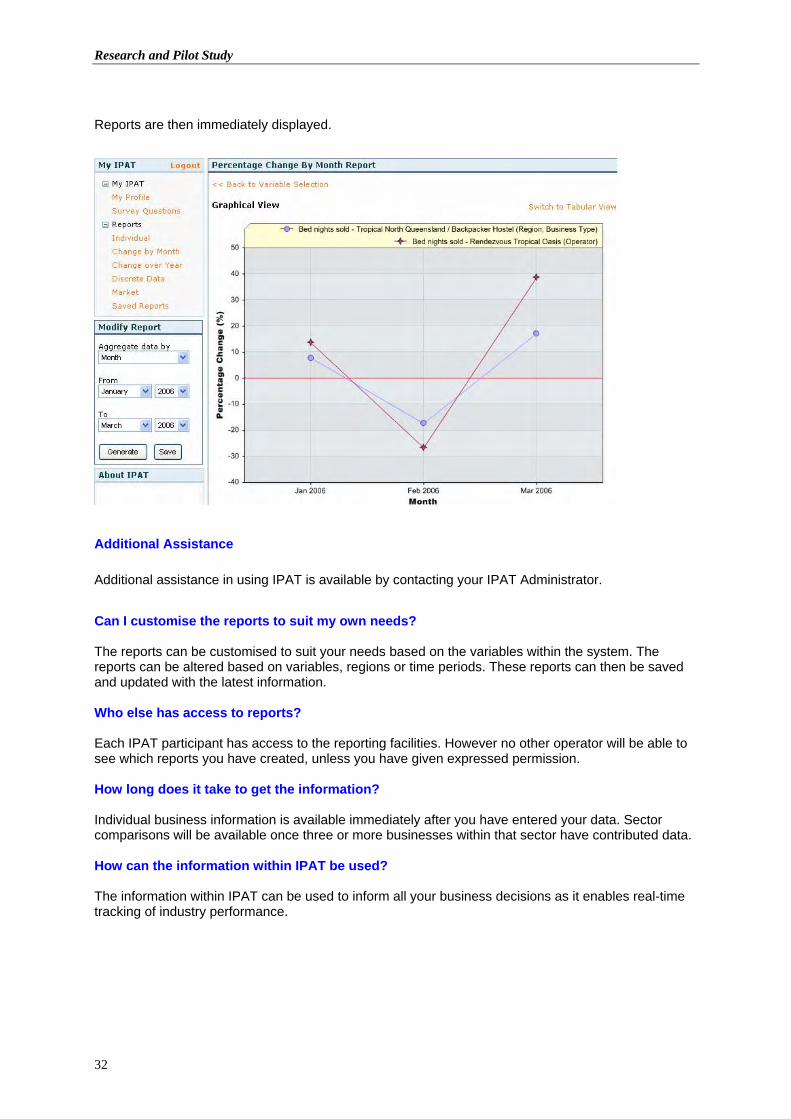
Research and Pilot Study Reports are then immediately displayed.
Additional Assistance Additional assistance in using IPAT is available by contacting your IPAT Administrator. Can I customise the reports to suit my own needs? The reports can be customised to suit your needs based on the variables within the system. The reports can be altered based on variables, regions or time periods. These reports can then be saved and updated with the latest information. Who else has access to reports? Each IPAT participant has access to the reporting facilities. However no other operator will be able to see which reports you have created, unless you have given expressed permission. How long does it take to get the information? Individual business information is available immediately after you have entered your data. Sector comparisons will be available once three or more businesses within that sector have contributed data. How can the information within IPAT be used? The information within IPAT can be used to inform all your business decisions as it enables real-time tracking of industry performance.
32

INDUSTRY PERFORMANCE ANALYSER FOR TOURISM (IPAT)
AUTHORS
Dr Noel Scott Noel Scott is a lecturer at the University of Queensland, School of Tourism. He has extensive experience as a senior manager and consultant in tourism, marketing and strategy development, having worked in a variety of marketing, research and policy positions within Tourism Queensland. Dr Scott lectures at undergraduate and postgraduate levels and has published extensively in areas as diverse as crises and disaster management in tourism, travel and tourism marketing, tourism research methods, destination image management and tourism from South East Asia. He has also managed or contributed to a number of the School's key industry consultations, including an Evaluation of Schoolies Week for the Queensland Government, Babyboomer drive tourism in Queensland and the Northern Territory, and Tourism Stakeholder Research for the Australian Sustainable Tourism Cooperative Research Centre. Dr Scott is currently involved in research in strategic destination management and marketing. Email: [email protected]
Dr Noreen Breakey Noreen Breakey is currently the co-coordinator of the undergraduate foundation course in the School of Tourism, University of Queensland. She is also the coordinator of the first year experience for students of the School's flagship program, the Bachelor of International Hotel and Tourism Management. Dr Breakey has more than a decade of industry experience, having worked in hotels and resorts throughout Australia and in the travel industry in the UK. Immediately prior to joining the School, Dr Breakey was a project officer with Tourism Queensland, working on Destination Management Plans for each region of Queensland. Her research interests are in sustainable visitor usage of the world's existing, developing, and potential tourism destinations and she recently completed her PhD in tourism destination development. Email: [email protected]
33

I n d u s t r y Pa r t n e r s u n I v e r s I t y Pa r t n e r s s P I n - O F F C O M P a n I e s
CrC for sustainable tourism Pty Ltd aBn 53 077 407 286Gold Coast CampusGriffith university Qldaustralia 4222
telephone: +61 7 5552 8172Facsimile: +61 7 5552 8171Chairman: Stephen GreggChief Executive: Ian KeanDirector of Research: Prof. David Simmons
Website: www.crctourism.com.au Bookshop: www.crctourism.com.au/bookshop email: [email protected]
COMMERCIALISE
RESEARCH And
dEVELOPMEnT
EdUCATIOn And
TRAInInG
UTILISE
COLLABORATION
CO
MM
UN
I CA
T I O N
I NN
OV
AT
IO
N
• Travel and tourism business• Academic researchers• Government regulators and policy makers
• New products, services and technologies• Uptake of research findings by business, government and academe• Improved business productivity• Industry-ready post-graduate students• Public good benefits for tourism destinations

The Sustainable Tourism Cooperative Research Centre
(STCRC) is established under the Australian Government’s
Cooperative Research Centres Program. STCRC is the
world’s leading scientific institution delivering research to
support the sustainability of travel and tourism – one of
the world’s largest and fastest growing industries.
Introduction
The STCRC has grown to be the largest, dedicated tourism
research organisation in the world, with $187 million
invested in tourism research programs, commercialisation
and education since 1997.
The STCRC was established in July 2003 under the
Commonwealth Government’s CRC program and is an
extension of the previous Tourism CRC, which operated
from 1997 to 2003.
Role and responsibilities
The Commonwealth CRC program aims to turn research
outcomes into successful new products, services and
technologies. This enables Australian industries to be more
efficient, productive and competitive.
The program emphasises collaboration between businesses
and researchers to maximise the benefits of research
through utilisation, commercialisation and technology
transfer.
An education component focuses on producing graduates
with skills relevant to industry needs.
STCRC’s objectives are to enhance:
• the contribution of long-term scientific
and technological research and innovation
to Australia’s sustainable economic and social
development;
• thetransferofresearchoutputsintooutcomesof
economic, environmental or social benefit to Australia;
• thevalueofgraduateresearcherstoAustralia;
• collaborationamongresearchers,betweenresearchers
and industry or other users; and efficiency in the use of
intellectual and other research outcomes.