Embed Size (px)
Citation preview

Real Estate Investment Trusts
Canaccord Genuity is the global capital markets group of Canaccord Genuity Group Inc. (CF : TSX | CF. : LSE)The recommendations and opinions expressed in this research report accurately reflect the research analyst's personal, independent and objective views about any and allthe companies and securities that are the subject of this report discussed herein.
Canadian Equity Research6 January 2016
Company Rating Price TargetAAR.UN-TSX Buy C$4.37 C$5.25AP.UN-TSX Hold C$31.57 C$35.50AX.UN-TSX Buy C$12.80 C$15.50BAM-NYSE Buy US$31.53 US$39.00BEI.UN-TSX Hold C$47.45 C$50.00BPY-NYSE Buy US$23.24 US$28.00CAR.UN-TSX Hold C$26.84 C$30.00CRR.UN-TSX Hold C$12.80 C$13.00D.UN-TSX Hold C$17.37 C$18.50↓
previous C$20.00DIR.UN-TSX Buy C$7.18 C$9.00DRG.UN-TSX Buy C$8.66 C$9.25↓
previous C$9.50DRM-TSX Buy C$7.27 C$10.00↓
previous C$12.00FCR-TSX Buy C$18.35 C$22.00GRT.UN-TSX Hold C$37.96 C$41.00HOT.UN-TSX Buy C$10.65 C$12.50IIP.UN-TSX Buy C$6.56 C$7.50KMP.UN-TSX Buy C$10.51 C$11.50NWH.UN-TSX
Hold C$8.93 C$9.15↑
previous C$8.75REI.UN-TSX Buy C$23.69 C$27.00↓
previous C$28.00RUF.U-TSXV Buy US$5.13 US$6.50SOT.UN-TSX Buy↑ C$7.05 C$7.50previous HoldShare/Unit Price as of 31 December 2015
Mark Rothschild | Analyst | Canaccord Genuity Corp. (Canada) | [email protected] | 1.416.869.7280Nilanjan Roy, CFA | Associate | Canaccord Genuity Corp. (Canada) | [email protected] | Nick Dukesz, CPA, CA, CFA | Associate | Canaccord Genuity Corp. (Canada) | [email protected] |
Industry Overview
2016 Real Estate OutlookStrong demand for real estate underpins attractive valuationsFor Canadian REITs, 2015 was a volatile year that started off strong and turned negativethrough the spring. While many REITs had positive returns, the overall sector was down4.6%, and REITs with significant exposure to Alberta posted the lowest returns.Assuming no material change in long-term interest rates or widening of credit spreads,we expect Canadian REITs to perform well in 2016, and we are forecasting total returnsof, on average, 19%. Of concern to us, the Canadian economy could soften further,and while interest rates would likely remain low, this could lead to a widening of creditspreads and lower values for equities.Overall, there are a number of factors supporting an optimistic outlook for REITs in 2016:1) The expectation is that long-term interest rates will not rise significantly in Canada; 2)Based on the current economic and interest-rate environment, we believe that cap ratesare likely to remain close to current levels; 3) The outlook for fundamentals is mixed andshould not be a major factor for most REITs; 4) Canadian REITs are trading at sizablediscounts to NAV and appear attractively valued relative to private market values andother yield-oriented investments; and, 5) Most REITs are well positioned with healthybalance sheets and reasonable payout ratios.REIT sector appears undervalued. Canadian REITs/REOCs under coverage are tradingat a discount to NAV of 13.6% (simple average), the largest discount since the financialcrisis. Historically, REITs have traded, on average, in line with NAV and at a +2.5%premium to NAV excluding the financial crisis (2008-2009). Should unit prices remainat current levels, we expect to see unit buybacks increase, and potentially a few REITtakeovers.Risks to our outlook. A material increase in the 10-year GoC bond yield or furtherwidening of credit spreads is the key risk to our outlook. That said, demand for realestate is quite strong and cap rates are likely to remain firm.Best investment ideas for 2016. Our best ideas present a mix of value and growthopportunities, and cross different asset classes. All of our top picks are currently tradingat significant discounts to NAV, which we believe supports unit prices even if internalgrowth is weaker than expected. For the most part, our top picks own high-quality andwell-located portfolios and should achieve stronger NOI growth over time. In addition,should the economy soften further, these portfolios should, for the most part, provemore defensive.Our top large cap picks are Brookfield Property Partners L.P. and First Capital RealtyInc., and our top small-mid cap picks are Dream Industrial REIT, Pure Industrial RealEstate Trust, and Pure Multi-Family REIT LP.Target price and rating changes. In conjunction with publishing our 2016 Real EstateOutlook, we are tweaking target prices for a number of REITs and we are upgrading ourrating for Slate Office REIT to BUY.
For important information, please see the Important Disclosures beginning on page 57 of this document.

2
Figure 1: Canadian real estate comp table
*Canaccord research coverage is currently suspended due to analyst maternity leave. Estimates reflect consensus estimates per FactSet.
**Core Canadian averages exclude BAM, BPY, DRM, and TCN, NA – Not applicable; R- Restricted; S – Under coverage suspension due to analyst maternity leave. MR – Mark Rothschild; JM – Jenny Ma
***US$ estimates converted to C$ utilizing an exchange rate of US$1.00=C$1.38
Source: FactSet, REIT/REOC Reports, Canaccord Genuity Estimates
Forecast Equity Annual Implied Utilized NAV per Prem 2016E 2017E
Price Target total market dist/ Current cap cap unit/ (disc) AFFO AFFO
REIT/REOC Ticker 31-Dec-15 price Rating return cap ($M) div yield rate rate share to NAV 2015E 2016E 2017E 2016E 2017E payout payout Analyst
DIVERSIFIED COMMERCIAL
Agellan Commercial REIT* ACR.un $8.84 S S S $207 $0.78 8.8% S S $11.69 (24.4%) $0.93 $0.96 $1.03 9.2x 8.6x 81% 75% JM
Artis AX.un $12.80 $15.50 BUY 29.5% $1,770 $1.08 8.4% 7.0% 6.50% $15.43 (17.1%) $1.32 $1.30 $1.29 9.9x 9.9x 83% 84% MR
Brookfield Property Partners (US$) BPY $23.24 $28.00 BUY 25.0% $16,561 $1.06 4.6% 5.9% 5.41% $28.81 (19.3%) $0.79 $0.99 $1.12 23.4x 20.7x 107% 94% MR
CREIT* REF.un $42.06 S S S $3,064 $1.80 4.3% S S $45.67 (7.9%) $2.60 $2.65 $2.78 15.9x 15.1x 68% 65% JM
Cominar* CUF.un $14.71 S S S $2,497 $1.47 10.0% S S $19.19 (23.4%) $1.53 $1.51 $1.56 9.7x 9.4x 97% 94% JM
Dream Global DRG.un $8.66 $9.25 BUY 16.1% $975 $0.80 9.2% 6.6% 6.25% $9.73 (11.0%) $0.65 $0.71 $0.78 12.3x 11.2x 113% 103% MR
H&R* HR.un $20.05 S S S $5,913 $1.35 6.7% S S $25.46 (21.3%) $1.62 $1.65 $1.70 12.2x 11.8x 82% 79% JM
Melcor REIT* MR.un $7.21 S S S $186 $0.68 9.4% S S $9.10 (20.8%) $0.82 $0.82 $0.84 8.8x 8.6x 82% 81% JM
Total / Weighted average 25.0% $31,174 5.8% 6.0% 5.55% (18.5%) 18.1x 16.5x 96% 88%
Average 23.5% 7.7% 6.5% 6.05% (18.1%) 12.7x 11.9x 89% 84%
INDUSTRIAL
Pure Industrial AAR.un $4.37 $5.25 BUY 27.3% $824 $0.31 7.1% 6.9% 6.20% $5.42 (19.3%) $0.35 $0.38 $0.39 11.4x 11.1x 81% 79% MR
Dream Industrial DIR.un $7.18 $9.00 BUY 35.1% $553 $0.70 9.7% 8.1% 6.85% $10.78 (33.4%) $0.80 $0.83 $0.86 8.6x 8.4x 84% 82% MR
Granite GRT.un $37.96 $41.00 HOLD 14.1% $1,785 $2.30 6.1% 9.3% 7.75% $47.68 (20.4%) $2.71 $2.84 $2.97 13.4x 12.8x 81% 78% MR
Total / Weighted average 21.2% $3,162 7.0% 8.5% 7.19% (22.4%) 12.0x 11.6x 82% 79%
Average 25.5% 7.7% 8.1% 6.93% (24.4%) 11.1x 10.8x 82% 80%
OFFICE
Allied Properties AP.un $31.57 $35.50 HOLD 17.2% $2,466 $1.50 4.8% 6.4% 6.25% $32.35 (2.4%) $1.75 $1.99 $2.16 15.9x 14.6x 76% 70% MR
Dream Office D.un $17.37 $18.50 HOLD 15.1% $1,963 $2.24 12.9% 7.5% 6.75% $22.99 (24.4%) $2.41 $2.23 $2.18 7.8x 8.0x 101% 103% MR
Slate Office REIT SOT.un $7.05 $7.50 BUY 17.0% $250 $0.75 10.6% 8.4% 7.75% $8.61 (18.1%) $0.81 $0.93 $0.93 7.6x 7.6x 81% 80% MR
Total / Weighted average 16.3% $4,679 8.5% 6.9% 6.54% (12.5%) 12.1x 11.5x 86% 84%
Average 16.5% 9.4% 7.4% 6.50% (15.0%) 10.4x 10.1x 86% 84%
RESIDENTIAL
Boardwalk BEI.un $47.45 $50.00 HOLD 9.7% $2,459 $2.04 4.3% 6.0% 5.40% $57.28 (17.2%) $3.12 $3.05 $3.08 15.5x 15.4x 67% 66% MR
CAP CAR.un $26.84 $30.00 HOLD 16.3% $3,209 $1.22 4.5% 5.2% 5.15% $27.20 (1.3%) $1.35 $1.46 $1.51 18.4x 17.8x 84% 81% MR
InterRent IIP.un $6.56 $7.50 BUY 17.9% $466 $0.23 3.5% 5.3% 5.25% $6.62 (0.9%) $0.29 $0.39 $0.46 16.7x 14.3x 59% 50% MR
Killam KMP.un $10.51 $11.50 BUY 15.1% $657 $0.60 5.7% 6.0% 5.85% $11.39 (7.7%) $0.65 $0.71 $0.75 14.7x 14.0x 84% 80% MR
Mainstreet* MEQ $30.07 S S S $310 $0.00 0.0% S S $49.87 (39.7%) $2.27 $2.33 $2.42 12.9x 12.4x 0% 0% JM
Northview Apartment* NVU.un $17.56 S S S $916 $1.63 9.3% S S $23.61 (25.6%) $2.07 $2.04 $2.13 8.6x 8.2x 80% 77% JM
Pure Multi-Family (US$) RUF.u $5.13 $6.50 BUY 34.0% $252 $0.38 7.3% 6.6% 6.00% $6.14 (16.5%) $0.39 $0.45 $0.47 11.3x 11.0x 83% 81% MR
Total / Weighted average 14.6% $8,269 4.9% 5.6% 5.34% (11.1%) 15.6x 15.1x 74% 71%
Average 18.6% 5.0% 5.8% 5.53% (15.5%) 14.0x 13.3x 65% 62%
RETAIL
SmartREIT* SRU.un $30.19 S S S $4,641 $1.65 5.5% S S $30.67 (1.6%) $1.99 $2.07 $2.13 14.6x 14.2x 80% 77% JM
Crombie CRR.un $12.80 $13.00 HOLD 8.5% $1,678 $0.89 7.0% 6.4% 6.40% $13.00 (1.5%) $0.94 $0.93 $0.95 13.8x 13.5x 96% 94% MR
CT REIT* CRT.un $13.00 S S S $2,464 $0.68 5.2% S S $12.15 7.0% $0.81 $0.86 $0.89 15.2x 14.6x 80% 76% JM
First Capital FCR $18.35 $22.00 BUY 24.6% $4,132 $0.86 4.7% 5.8% 5.50% $19.95 (8.0%) $0.93 $1.00 $1.05 18.4x 17.5x 86% 82% MR
RioCan REI.un $23.69 $27.00 BUY 19.9% $7,606 $1.41 6.0% 6.1% 5.75% $25.56 (7.3%) $1.57 $1.51 $1.51 15.7x 15.7x 94% 93% MR
Total / Weighted average 19.9% $20,521 5.6% 6.0% 5.75% (4.0%) 15.8x 15.4x 87% 85%
Average 17.7% 5.7% 6.1% 5.88% (2.3%) 15.5x 15.1x 87% 85%
HEALTH CARE/SENIORS
Chartwell* CSH.un $12.70 S S S $2,271 $0.55 4.3% S S $12.88 (1.4%) $0.72 $0.78 $0.81 16.4x 15.6x 71% 68% JM
NorthWest Healthcare NWH.un $8.93 $9.15 HOLD 11.4% $641 $0.80 9.0% 7.6% 7.50% $9.16 (2.5%) $0.73 $0.77 $0.81 11.6x 11.0x 104% 99% MR
Total / Weighted average 11.4% $2,912 5.4% 7.6% 7.50% (1.7%) 15.3x 14.6x 78% 75%
Average 11.4% 6.6% 7.6% 7.50% (2.0%) 14.0x 13.3x 87% 83%
LODGING
AHIP*** HOT.un $10.65 $12.50 BUY 25.8% $371 $0.90 8.5% 9.9% 9.15% $12.39 (14.0%) $1.10 $1.32 $1.47 8.1x 7.2x 68% 61% MR
InnVest* INN.un $5.13 S S S $683 $0.40 7.8% S S $5.42 (5.4%) $0.45 $0.50 $0.54 10.2x 9.5x 80% 74% JM
Total / Weighted average 25.8% $1,053 8.0% 9.9% 9.15% (8.4%) 9.5x 8.7x 76% 69%
Average 25.8% 8.1% 9.9% 9.15% (9.7%) 9.2x 8.3x 74% 67%
SPECIALTY REAL ESTATE
BAM (US$) BAM $31.53 $39.00 BUY 25.2% $31,016 $0.48 1.5% NA NA $30.96 1.9% NA NA NA NA NA NA NA MR
DREAM DRM $7.27 $10.00 BUY 37.6% $819 $0.00 0.0% NA NA $14.33 (49.3%) NA NA NA NA NA NA NA MR
Tricon* TCN $9.06 S S S $946 $0.24 2.6% NA NA $13.23 (31.5%) NA NA NA NA NA NA NA JM
**Core Canadian REIT/REOC coverage total / wtd averages 18.7% $55,208 6.3% 6.5% 6.0% (10.4%) 14.1x 13.7x 83% 81%
Coverage universe total / wtd averages 22.7% $104,550 4.5% NA NA (8.7%) NA NA NA NA
Diluted AFFO per unit/share
AFFO
multiple
Real Estate Investment TrustsIndustry Overview
6 January 2016 2

2
CANADIAN REAL ESTATE OUTLOOK FOR 2016
For Canadian REITs, 2015 was a volatile year that started off strong and turned
negative through the spring. While many REITs had positive returns, the overall sector
was down 4.6%, and REITs with significant exposure to Alberta posted the lowest
returns.
Assuming no material change in long-term interest rates or widening of credit spreads,
we expect Canadian REITs to perform well in 2016 and we are forecasting total
returns of, on average, 19%. Of concern to us, the Canadian economy could soften
further, and, while interest rates would likely remain low, could lead to a widening of
credit spreads and lower values for equities.
Overall, there are a number of factors supporting an optimistic outlook for REITs in
2016:
The expectation is that long-term interest rates will not rise significantly in
Canada. Economic growth has slowed, inflation is projected to be stable, and we
do not expect that the BoC will be in a position to increase short-term interest
rates in 2016. Therefore, the 10-year GoC bond yield is not expected to rise
significantly in 2016. However, there is a risk that long-term rates rise in Canada
along with U.S. rates, in spite of a lack of economic growth in Canada.
Based on the current economic and interest rate environment, we believe that
cap rates are likely to remain close to current levels. Investor demand for real
estate remained strong through 2015, and we expect this to continue in 2016.
Furthermore, the spread between cap rates and the 10-year GoC bond yield
remains wide at 448 bps. Therefore, even if there is a modest increase in long-
term interest rates, we do not expect cap rates to increase significantly in 2016.
The outlook for fundamentals is mixed and should not be a major factor for most
REITs. For the most part, REITs should generate modest internal growth resulting
in cash flow per unit growth, while those REITs with significant exposure to Alberta
will face pressure on their operating performance. In general, though, we do not
believe that fundamentals will be a major factor in how most REIT unit prices
perform in 2016. Rather, reflecting attractive valuations, we expect steady fund
flows into REITs which should drive unit prices higher.
Canadian REITs are trading at sizable discounts to NAV and appear attractively
valued relative to private market values and other yield-oriented investments.
Premiums/discounts to private market values: price to NAV. Based on our
estimates, Canadian REITs/REOCs under coverage are trading at a discount
to NAV of 13.6% (simple average), the biggest discount since the financial
crisis. Historically, REITs have traded, on average, in line with NAV and at a
+2.5% premium to NAV excluding the financial crisis (2008-2009). Should
unit prices remain at current levels, we expect to see unit buybacks increase,
and potentially a few REIT takeovers.
We believe that all else being equal, REITs should trade at a slight premium to
NAV to account for the diversification, liquidity, and management provided to
real estate investors. However, we do recognize that this gap can also narrow
through increasing cap rates, and not only through higher unit prices.
Real Estate Investment TrustsIndustry Overview
6 January 2016 3

3
Figure 2: Historical price to NAV for REITs/REOCs under coverage*
*Canaccord research coverage is currently suspended for a number of REITs/REOCs. NAV estimates for those REITs/REOCs used in this figure reflect consensus estimates per FactSet.
Source: FactSet, REIT/REOC Reports, Canaccord Genuity Estimates
Cash flow multiples. Currently, both the commercial and residential
REITs/REOCs under coverage are trading slightly lower than their respective
historical average forward AFFO multiples (Figure 3). While the fear of
widening credit spreads or higher long-term interest rates is likely to remain
on the minds of investors, REITs continue to present an attractive option for
retail investors for both exposure to commercial real estate as well as current
yield.
Figure 3: Weighted average price to forward AFFO multiple for REITs/REOCs under coverage
*Canaccord research coverage is currently suspended for a number of REITs/REOCs. AFFO estimates for those REITs/REOCs used in this figure reflect consensus estimates per FactSet..
Source: FactSet, REIT/REOC Reports, Canaccord Genuity Estimates
-6.3%
-19.3%
20.4%
-46.2%
12.6%
-10.2% -13.6%
-50.0%
-40.0%
-30.0%
-20.0%
-10.0%
0.0%
10.0%
20.0%
30.0%
40.0%D
ec-9
7
Jun
-98
De
c-9
8
Jun
-99
De
c-9
9
Jun
-00
De
c-0
0
Jun
-01
De
c-0
1
Jun
-02
De
c-0
2
Jun
-03
De
c-0
3
Jun
-04
De
c-0
4
Jun
-05
De
c-0
5
Jun
-06
De
c-0
6
Jun
-07
De
c-0
7
Jun
-08
De
c-0
8
Jun
-09
De
c-0
9
Jun
-10
De
c-1
0
Jun
-11
De
c-1
1
Jun
-12
De
c-1
2
Jun
-13
De
c-1
3
Jun
-14
De
c-1
4
Jun
-15
De
c-1
5
Global credit
crisis
Peak of
dotcom
Sale of EOP to
Blackstone (peak of
LBO cycle)Mean
reversion
Global credit
crisis
Peak of dotcom
bubble
Russian debt
crisis/LTCM
debacle
Sale of EOP to
Blackstone (peak of
LBO cycle)Mean
reversion
Taper
tantrum
Current NAV Prem / Disc -13.6%
Historical Average Prem / Disc -0.2%
Max NAV Premium 29.5%
Max NAV Discount -46.2%
17.5x17.0x
13.5x
20.3x 20.9x
15.4x
Commercial average since
2003, 14.2x
Residential average since
2003, 16.7x
5.0x
10.0x
15.0x
20.0x
25.0x
Q1
/0
3
Q3
/0
3
Q1
/0
4
Q3
/0
4
Q1
/0
5
Q3
/0
5
Q1
/0
6
Q3
/0
6
Q1
/0
7
Q3
/0
7
Q1
/0
8
Q3
/0
8
Q1
/0
9
Q3
/0
9
Q1
/1
0
Q3
/1
0
Q1
/1
1
Q3
/1
1
Q1
/1
2
Q3
/1
2
Q1
/1
3
Q3
/1
3
Q1
/1
4
Q3
/1
4
Q1
/1
5
Q3
/15
Commercial Residential Commercial average since 2003 Residential average since 2003
Real Estate Investment TrustsIndustry Overview
6 January 2016 4
4
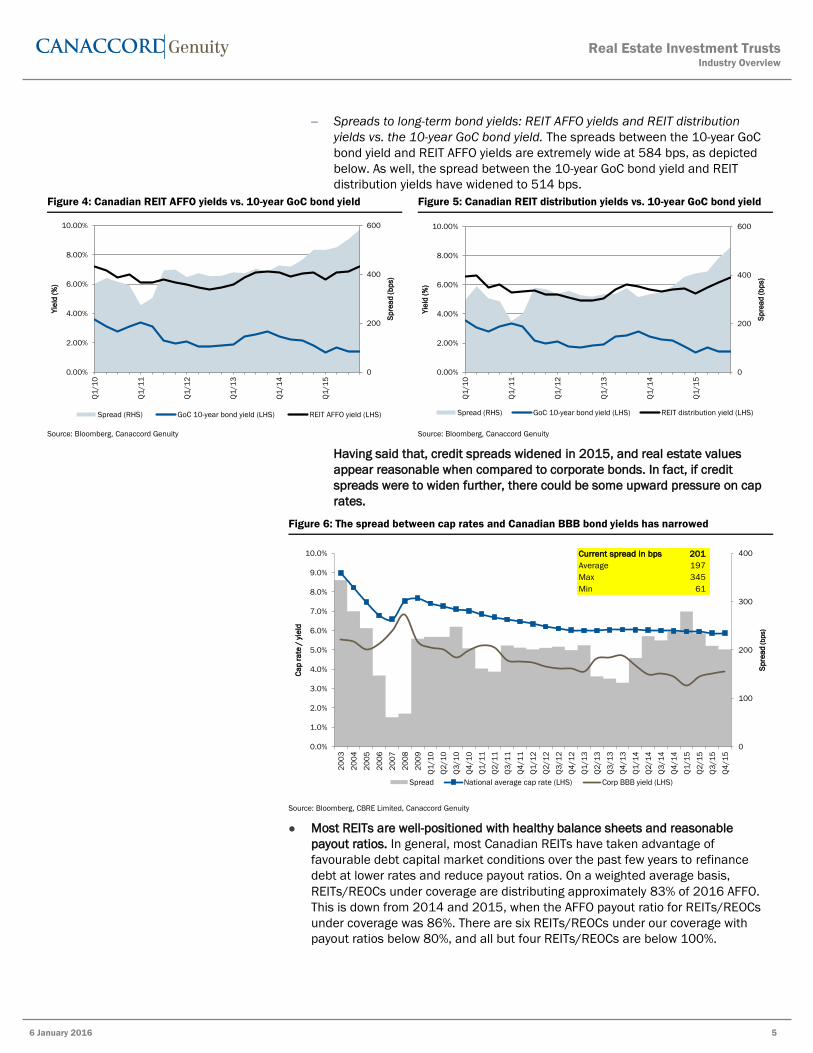
Spreads to long-term bond yields: REIT AFFO yields and REIT distribution
yields vs. the 10-year GoC bond yield. The spreads between the 10-year GoC
bond yield and REIT AFFO yields are extremely wide at 584 bps, as depicted
below. As well, the spread between the 10-year GoC bond yield and REIT
distribution yields have widened to 514 bps.
Figure 4: Canadian REIT AFFO yields vs. 10-year GoC bond yield Figure 5: Canadian REIT distribution yields vs. 10-year GoC bond yield
Source: Bloomberg, Canaccord Genuity Source: Bloomberg, Canaccord Genuity
Having said that, credit spreads widened in 2015, and real estate values
appear reasonable when compared to corporate bonds. In fact, if credit
spreads were to widen further, there could be some upward pressure on cap
rates.
Figure 6: The spread between cap rates and Canadian BBB bond yields has narrowed
Source: Bloomberg, CBRE Limited, Canaccord Genuity
Most REITs are well-positioned with healthy balance sheets and reasonable
payout ratios. In general, most Canadian REITs have taken advantage of
favourable debt capital market conditions over the past few years to refinance
debt at lower rates and reduce payout ratios. On a weighted average basis,
REITs/REOCs under coverage are distributing approximately 83% of 2016 AFFO.
This is down from 2014 and 2015, when the AFFO payout ratio for REITs/REOCs
under coverage was 86%. There are six REITs/REOCs under our coverage with
payout ratios below 80%, and all but four REITs/REOCs are below 100%.
0
200
400
600
0.00%
2.00%
4.00%
6.00%
8.00%
10.00%
Q1
/1
0
Q1
/1
1
Q1
/1
2
Q1
/1
3
Q1
/1
4
Q1
/1
5
Sp
rea
d (
bp
s)
Yie
ld (
%)
Spread (RHS) GoC 10-year bond yield (LHS) REIT AFFO yield (LHS)
0
200
400
600
0.00%
2.00%
4.00%
6.00%
8.00%
10.00%
Q1
/1
0
Q1
/1
1
Q1
/1
2
Q1
/1
3
Q1
/1
4
Q1
/1
5
Sp
rea
d (
bp
s)
Yie
ld (
%)
Spread (RHS) GoC 10-year bond yield (LHS) REIT distribution yield (LHS)
0
100
200
300
400
0.0%
1.0%
2.0%
3.0%
4.0%
5.0%
6.0%
7.0%
8.0%
9.0%
10.0%
20
03
20
04
20
05
20
06
20
07
20
08
20
09
Q1
/1
0
Q2
/1
0
Q3
/1
0
Q4
/1
0
Q1
/1
1
Q2
/1
1
Q3
/1
1
Q4
/1
1
Q1
/1
2
Q2
/1
2
Q3
/1
2
Q4
/1
2
Q1
/1
3
Q2
/1
3
Q3
/1
3
Q4
/1
3
Q1
/1
4
Q2
/1
4
Q3
/1
4
Q4
/1
4
Q1
/1
5
Q2
/1
5
Q3
/1
5
Q4
/1
5
Sp
rea
d(b
ps)
Ca
p r
ate
/ y
ield
Spread National average cap rate (LHS) Corp BBB yield (LHS)
Current spread in bps 201
Average 197
Max 345
Min 61
Real Estate Investment TrustsIndustry Overview
6 January 2016 5

5
Figure 7: Weighted average AFFO payout ratios for REITs/REOCs under coverage*
*2015-2017 AFFO payout ratio estimates assume current level of distributions
Source: FactSet, REIT/REOC reports, Canaccord Genuity Estimates
Most REIT management teams have placed an increased emphasis on
maintaining a strong balance sheet. Currently, 15 of the REITs/REOCs under
coverage have leverage under 50%, with leverage ratios ranging from 23% for
Granite REIT to 63% for NorthWest Healthcare Properties REIT.
For 2016, we are forecasting a weighted average total return of 19% from our
coverage universe. On an individual REIT/REOC basis, we are forecasting total
returns ranging from 38% for Dream Unlimited Corp. to 9% for Crombie REIT.
Figure 8: 2016 forecast REIT/REOC total returns to one-year target price
*Weighted average excludes BAM, BPY, and DRM
Source: FactSet, REIT/REOC Reports, Canaccord Genuity Estimates
89%
88%
89%
86%85%
86%86%
83%
81%
70%
75%
80%
85%
90%
95%
100%
2009 2010 2011 2012 2013 2014 2015E 2016E 2017E
38
%
35
%
34
%
30
%
27
%
26
%
25
%
25
%
25
%
21
%
20
%
19
%
18
%
17
%
17
%
16
%
16
%
15
%
15
%
14
%
11
%
10
%
9%
0%
5%
10%
15%
20%
25%
30%
35%
40%
DR
M
DIR
.un
RU
F.u
AX
.un
AA
R.u
n
HO
T.u
n
BA
M
BP
Y
FC
R
Sim
ple
Ave
rage
RE
I.u
n
We
igh
ted
Ave
rage
*
IIP
.un
AP
.un
SO
T.u
n
CA
R.u
n
DR
G.u
n
D.u
n
KM
P.u
n
GR
T.u
n
NW
H.u
n
BE
I.u
n
CR
R.u
n
Real Estate Investment TrustsIndustry Overview
6 January 2016 6

6
Modest cash flow growth expected in 2016
Aside from REITs with significant exposure to Alberta, fundamentals are for the most
part stable and should allow for modest cash flow growth. We expect Canadian
REITs/REOCs to post AFFO per unit growth of 3.2% in 2016 and 3.4% in 2017
(weighted average).
Expect modest internal growth from most REITs/REOCs. We expect most REITs to
grow same-property NOI through leasing activity and positive rental spreads on
expiring leases. However, for REITs/REOCs with significant exposure to Western
Canada, fundamentals have softened considerably due to the impact from the
drop in oil and commodity prices. We expect internal growth to be muted for these
REITs/REOCs due to downward pressure on occupancy and rental rates.
Development projects should be accretive. In the current low cap rate
environment, accretive acquisition opportunities are difficult to find. Therefore a
number of REITs have become more active in new development to drive FFO
growth.
Refinancing debt should continue to boost cash flow. Although much of the
interest expense savings from refinancing debt at lower rates has already been
achieved, there are still potential savings from refinancing debt at market rates.
Figure 9: Growth in AFFO per unit/share (weighted average for REITs/REOCs under coverage*)
*Excludes BAM, BPY, DRM, and TCN
**Canaccord research coverage is suspended for a number of REITs/REOCs. AFFO estimates used to calculate the weighted average year-over-
year growth rates for those REITs/REOCs reflect consensus estimates per FactSet.
Source: FactSet, REIT/REOC Reports, Canaccord Genuity Estimates
Risks to our 2016 outlook
In our view, there are a handful of risks which could lead to another year of negative
returns from Canadian REITs:
We believe that the most significant reason for the weak unit price performance in
2015 was the expectation that long-term interest rates would rise. Going forward,
the outlook for interest rates remains a concern, and could impact REIT unit
prices materially. To the extent U.S. economic growth drives the U.S. 10-year bond
yield higher, Canadian long-term interest rates could follow, in spite of a lack of
growth in Canada. Conversely, if the Canadian economy softens further, credit
spreads could widen, and even if interest rates remain low, real estate values
would likely decline.
3.2%
5.6%
8.6%
3.9%
-2.8%
0.1%
3.2%
7.0%
8.6%
3.9%
3.2% 3.2% 3.4%
-4.0%
-2.0%
0.0%
2.0%
4.0%
6.0%
8.0%
10.0%
'05 '06 '07 '08 '09 '10 '11 '12 '13 '14 '15E '16E '17E
Real Estate Investment TrustsIndustry Overview
6 January 2016 7

7
Figure 10: Month-end Canada and U.S. 10-year government bond yields since 1985
Source: Bloomberg, Thomson ONE, Canaccord Genuity
Less material, but also a factor, fundamentals have softened somewhat and the
pace of cash flow growth has declined. We are currently forecasting AFFO per unit
growth of 3.2% for 2016, and 3.4% for 2017. This compares with our January
2015 forecast of 5.5% growth in AFFO per unit for 2016.
With significant office development across Canada, it is possible that
fundamentals will continue to soften. There is new supply being developed in
Calgary, Edmonton, Toronto, and Vancouver, which could lead to increased
vacancy. Although less of a concern, there is also a large amount of industrial and
rental apartment space under development.
Figure 11: Office vacancy rate forecasts for select Canadian markets
Source: CBRE Limited, Canaccord Genuity
Consumer debt levels are relatively high and relatedly, the Canadian housing
market has been extremely strong for a number of years in both Toronto and
0.0%
2.0%
4.0%
6.0%
8.0%
10.0%
12.0%
14.0%Ja
n-8
5
Jan
-86
Jan
-87
Jan
-88
Jan
-89
Jan
-90
Jan
-91
Jan
-92
Jan
-93
Jan
-94
Jan
-95
Jan
-96
Jan
-97
Jan
-98
Jan
-99
Jan
-00
Jan
-01
Jan
-02
Jan
-03
Jan
-04
Jan
-05
Jan
-06
Jan
-07
Jan
-08
Jan
-09
Jan
-10
Jan
-11
Jan
-12
Jan
-13
Jan
-14
Jan
-15
Canada U.S.
Correlation 0.97603244
Current spread -88 bps
Average spread 50 bps
Max spread 258 bps
Min spread -88 bps
11.0%
9.5%10.7%
16.7%
10.7%
12.3%
18.1%
11.7%
13.0%
4.0%
8.0%
12.0%
16.0%
20.0%
Calgary Toronto Canada
2014 2015E 2016E
Real Estate Investment TrustsIndustry Overview
6 January 2016 8

8
Vancouver. A correction in housing prices, possibly as a result of an increase in
the five-year GoC bond yield, could negatively affect the Canadian economy.
Should the price of oil remain low for an extended period of time, the Canadian
economy could suffer. Specifically, those REITs with exposure to Alberta could
face additional pressure.
Changes to target prices
In conjunction with publishing our 2016 Real Estate Outlook, we are making several
changes to our target prices:
We are lowering our target price slightly for Dream Global REIT to C$9.25 (from
C$9.50), which equates to a 5% discount to NAV. The new target price, combined
with an annualized distribution per unit of $0.80, equates to a forecast total
return of 16%. While we expect the fundamental performance of the REIT’s assets
to be solid in 2016, we do not believe that the unit price will reach NAV in the
near-term.
We are reducing our target price for Dream Office REIT to C$18.50 (from
C$20.00), which equates to a 20% discount to NAV. The outlook for the Alberta
office market continues to weaken, and it is difficult to see a catalyst in the near
term. Additionally, with NOI poised to decline in 2016, and the increase in capex,
the likelihood of a distribution cut has increased materially.
We are lowering our target price for RioCan REIT to C$27.00 (from C$28.00),
which equates to a 5% premium to NAV. The new target price, combined with an
annualized distribution per unit of $1.41, equates to a forecast total return of
20%.
For NorthWest Healthcare Properties REIT, we are raising our target price to
C$9.15 (from C$8.75), which is in line with our NAV estimate. The new target
price, combined with an annualized distribution per unit of $0.80, equates to a
forecast total return of 11%.
Reflecting the softer housing market in both Saskatchewan and Alberta, we are
lowering our target price for Dream Unlimited Corp. to C$10.00 (from C$12.00).
Though cash flow should rise in 2016 from condo completions in Toronto,
investors are likely to remain cautious until there are some signs of improvement
in Western Canada housing.
Upgrading Slate Office REIT to a BUY
While suburban office fundamentals have softened, Slate Office REIT should grow
cash flow in 2016 as a result of acquisitions in 2015. In addition, the attractive 10.6%
current yield is fully covered by cash flow. The REIT’s units are currently trading at an
18% discount to NAV and only 7.6x our 2016 AFFO estimate, the lowest in our
coverage universe. While fundamentals have softened slightly and leverage is
relatively high, the REIT’s units provide solid value and we are therefore upgrading our
rating for Slate Office REIT from HOLD to BUY.
Real Estate Investment TrustsIndustry Overview
6 January 2016 9

9
Figure 12: Changes to target prices and ratings
*Canaccord research coverage is currently suspended. Estimates reflect consensus estimates per FactSet.
**US$ estimates converted to C$ utilizing an exchange rate of US$1.00=C$1.38
***Forecast total return for D.un assumes a distribution per unit cut to $1.50 (from $2.24)
Source: FactSet, REIT/REOC Reports, Canaccord Genuity Estimates
Pre-tax Prem Annual Forecast AFFO Target AFFO
Price NAV per (disc) dividend/ total multiple multiple
REIT/REOC 31-Dec-15 Old Current Old Current unit/share to NAV distribution return 2017E 2017E
DIVERSIFIED COMMERCIAL
ACR.un* $8.84 BUY S S $11.69 -24% $0.78 S 8.6x S
AX.un $12.80 BUY BUY $15.50 $15.43 -17% $1.08 30% 9.9x 12.0x
BPY (US$) $23.24 BUY BUY $28.00 $28.81 -19% $1.06 25% 20.7x 24.9x
REF.un* $42.06 HOLD S S $45.67 -8% $1.80 S 15.1x S
CUF.un* $14.71 HOLD S S $19.19 -23% $1.47 S 9.4x S
DRG.un $8.66 BUY BUY $9.50 $9.25 $9.73 -11% $0.80 16% 11.2x 11.9x
HR.un* $20.05 HOLD S S $25.46 -21% $1.35 S 11.8x S
MR.un* $7.21 S S $9.10 -21% $0.68 S 8.6x S
INDUSTRIAL
AAR.un $4.37 BUY BUY $5.25 $5.42 -19% $0.31 27% 11.1x 13.3x
DIR.un $7.18 BUY BUY $9.00 $10.78 -33% $0.70 35% 8.4x 10.5x
GRT.un $37.96 HOLD HOLD $41.00 $47.68 -20% $2.30 14% 12.8x 13.8x
OFFICE
AP.un $31.57 HOLD HOLD $35.50 $32.35 -2% $1.50 17% 14.6x 16.5x
D.un*** $17.37 HOLD HOLD $20.00 $18.50 $22.99 -24% $2.24 15% 8.0x 8.5x
SOT.un $7.05 HOLD BUY $7.50 $8.61 -18% $0.75 17% 7.6x 8.0x
RESIDENTIAL
BEI.un $47.45 HOLD HOLD t $50.00 $57.28 -17% $2.04 10% 15.4x 16.2x
CAR.un $26.84 HOLD HOLD $30.00 $27.20 -1% $1.22 16% 17.8x 19.9x
IIP.un $6.56 BUY BUY $7.50 $6.62 -1% $0.23 18% 14.3x 16.3x
KMP.un $10.51 HOLD BUY $11.50 $11.39 -8% $0.60 15% 14.0x 15.4x
MEQ* $30.07 BUY S S $49.87 -40% $0.00 S 12.4x S
NVU.un* $17.56 HOLD S S $23.61 -26% $1.63 S 8.2x S
RUF.u (US$) $5.13 BUY BUY $6.50 $6.14 -16% $0.38 34% 11.0x 14.0x
RETAIL
SRU.un* $30.19 HOLD S S $30.67 -2% $1.65 S 14.2x S
CRR.un $12.80 BUY HOLD $13.00 $13.00 -2% $0.89 9% 13.5x 13.7x
CRT.un* $13.00 HOLD S S $12.15 7% $0.68 S 14.6x S
FCR $18.35 HOLD BUY $22.00 $19.95 -8% $0.86 25% 17.5x 21.0x
REI.un $23.69 HOLD BUY $28.00 $27.00 $25.56 -7% $1.41 20% 15.7x 17.9x
HEALTH CARE/SENIORS
CSH.un* $12.70 HOLD S S $12.88 -1% $0.55 S 15.6x S
NWH.un $8.93 HOLD $8.75 $9.15 $9.16 -2% $0.80 11% 11.0x 11.3x
LODGING
HOT.un** $10.65 BUY BUY $12.50 $12.39 -14% $0.90 26% 7.2x 8.5x
INN.un* $5.13 HOLD S S $5.42 -5% $0.40 S 9.5x S
SPECIALTY REAL ESTATE
BAM (US$) $31.53 BUY BUY $39.00 $30.96 2% $0.48 25% NA NA
DRM $7.27 BUY BUY $12.00 $10.00 $14.33 -49% $0.00 38% NA NA
TCN* $9.06 BUY S S $13.23 -32% $0.24 S NA NA
Rating
Target
Price
Real Estate Investment TrustsIndustry Overview
6 January 2016 10

10
BEST INVESTMENT IDEAS FOR 2016
For 2016, our best ideas present a mix of value and growth opportunities and cross
different asset classes. All of our top picks are currently trading at significant
discounts to NAV, which we believe supports unit prices even if internal growth is
weaker than expected. For the most part, our top picks own high quality and well-
located portfolios and should achieve stronger NOI growth over time. In addition,
should the economy soften further, these portfolios should, for the most part, prove
more defensive.
Large caps
Brookfield Property Partners L.P.
First Capital Realty Inc.
Small-to-mid caps
Dream Industrial REIT
Pure Industrial Real Estate Trust
Pure Multi-Family REIT LP
Our investment thesis for each of our top picks is provided below
Large caps
Brookfield Property Partners L.P. (BPY : NYSE | US$23.24 | BUY, Target price
US$28.00)
Brookfield Property Partners L.P. (BPY) is a globally diversified company that owns and
operates high-quality office and retail assets (mostly through its 34% interest in
General Growth Properties (GGP : NYSE | Not Rated)), in addition to industrial and
multi-family assets. The portfolio is diversified across the U.S., Canada, Australia, and
the United Kingdom. BPY is externally managed by Brookfield Asset Management Inc.
Potential for significant NAV growth. We believe that there is potential for significant
cash flow and NAV per unit growth as new leases take effect and active development
and redevelopment projects are completed. In particular, we expect cash flow to
increase in the near term as tenants taking occupancy in Lower Manhattan begin
paying rent. Longer term, NAV per unit growth should come from: 1) increasing
occupancy; 2) marking expiring leases to market rents; and 3) completion of active
development and redevelopment projects.
Valuation and recommendation. Our US$28.00 target price is just below our NAV per
unit estimate of US$28.81. While we expect NAV to rise dramatically over the coming
years, the external management contract, along with BPY’s partnership structure, are
liabilities to many investors. BPY’s units currently trade at a 19.3% discount to NAV,
and combined with an annualized distribution of US$1.06 per unit, the forecast total
return is 25.0%.
First Capital Realty Inc. (FCR : TSX | C$18.35 | BUY, Target price C$22.00)
First Capital Realty Inc. (FCR) owns a high-quality portfolio of grocery-anchored
shopping centres located in major Canadian markets, with specific exposure to
Toronto (36% of fair value), Montreal (15%), Calgary (12%), and Vancouver (12%).
Expect sector-leading internal growth. Despite the challenging retail operating
environment, we expect FCR’s portfolio to perform well. The company’s portfolio is
Real Estate Investment TrustsIndustry Overview
6 January 2016 11

11
extremely well-located and is expected to maintain occupancy with increasing rental
rates.
Development pipeline should lead to cash flow per share growth. FCR has several
sizable development projects which are scheduled to be completed over the next few
years and should boost FFO per share significantly. Additionally, we expect the recent
change in management to lead to an increased focus on capital management and
FFO per share growth, which should lead to a higher multiple over time.
Valuation and recommendation. We utilize a cap rate of 5.50% to value FCR’s
portfolio, resulting in a NAV per share estimate of $19.95. Our target price of C$22.00
equates to a 10% premium to our NAV estimate and, combined with an annualized
dividend of $0.86 per share (4.7% current yield), equates to a 12-month forecast total
return of 24.6%.
SMALL-TO-MID CAPS
Dream Industrial REIT (DIR.un : TSX | C$7.18 | BUY, Target price C$9.00)
Dream Industrial REIT owns a portfolio of predominantly small-bay industrial
properties totaling 16.9 million sf located in primary and secondary markets across
Canada.
Healthy fundamentals should support modest NOI growth. Industrial fundamentals
remain healthy in most Canadian markets and we expect the REIT to maintain
occupancy while achieving modest rental rate increases on renewals, leading to
steady internal growth.
Attractive yield is fully covered by cash flow. Dream Industrial’s annualized distribution
of $0.70 per unit equates to a 9.7% current yield. Considering that the current payout
ratio is 84% (based on our 2016 AFFO estimate), we view this yield as extremely
attractive, especially when compared to corporate bonds.
Units are extremely undervalued. We utilize a 6.85% cap rate to value Dream
Industrial’s portfolio, resulting in a NAV per unit estimate of $10.78. The REIT’s units
currently trade at a dramatic 33.4% discount to NAV, or an implied cap rate of 8.1%.
In the near term, we expect the unit price to lag as investors are placing a discount on
externally managed REITs, and management has yet to take any action to narrow this
discount. However, we do not believe that this discount will persist through 2016
without some action taken. Our target price of C$9.00 is based on a ~15% discount to
NAV, and combined with the annualized distribution, equates to a 12-month forecast
total return of 35.1%.
Pure Industrial Real Estate Trust (AAR.UN : TSX | C$4.37 | BUY, Target price C$5.25)
Pure Industrial Real Estate Trust owns a portfolio of industrial properties comprising
17.4 million sf of GLA. The REIT’s properties are predominantly located in major
Canadian cities (Calgary, Edmonton, Toronto, and Vancouver) and include a portfolio
of FedEx properties in the U.S. (12% of GLA).
Investment highlights. With its high-quality portfolio, Pure Industrial is poised to
benefit from healthy industrial property fundamentals. Led by a strong and focused
management team, we expect steady, albeit modest, internal growth for the next few
years, which should lead to multiple expansion. The REIT entered the U.S. in 2014
through the acquisition of a portfolio of properties fully leased to FedEx. We expect the
REIT to continue growing in the U.S., although management has indicated that its U.S.
exposure should remain below 20%.
Real Estate Investment TrustsIndustry Overview
6 January 2016 12

12
The REIT’s Vaughan and New Jersey FedEx developments are now substantially
complete and should be income-producing in Q2/16, which should provide a boost to
cash flow. Further supporting growth, in order to leverage its platform and increase
the return on its properties, Pure Industrial has entered into a joint venture with a
Canadian institution which will allow it to earn fees on its properties while growing its
portfolio.
Valuation and recommendation. We utilize a 6.20% cap rate to value Pure Industrial’s
portfolio, resulting in a NAV per unit estimate of $5.42. Pure Industrial’s units are
currently trading at an implied cap rate of 6.9%, or a 19.3% discount to NAV. We
expect management to continue to focus on improving the REIT’s valuation through
divesting non-core assets and repurchasing units. We believe that a stronger pace of
internal growth will be crucial for the REIT to be awarded a premium valuation.
Combined with an annualized distribution of $0.31 per unit (7.1% current yield), our
target price implies a 12-month forecast total return of 27.3%.
Pure Multi-Family REIT LP (RUF.U : TSX-V | US$5.13 | BUY, Target price US$6.50)
Pure Multi-Family REIT LP owns a portfolio of high quality rental apartment properties
located mostly in Dallas-Fort Worth and other large cities in Texas and Arizona.
Strong fundamentals should drive internal growth. Fundamentals in the REIT’s core
markets are strong and we expect robust same-property NOI growth over the next few
years.
High-grading the portfolio. The REIT continues to execute on its strategy of growing the
portfolio while upgrading the quality of its assets. This is being conducted through
disposing older, class B properties in order to partly finance the acquisition of newer,
class A properties. While this results in some near-term dilution, higher quality
properties should maintain occupancy and produce stronger NOI growth over time.
Valuation and recommendation. We utilize a 6.00% cap rate to value Pure Multi-
Family’s portfolio, resulting in a NAV per unit of US$6.14. The REIT is currently trading
at an implied cap rate of 6.6%, or a 16.5% discount to NAV. On a cash flow multiples
basis, the REIT trades in line with Milestone Apartments REIT, although below most of
its Canadian peers. We expect the REIT’s relative valuation to improve as investors
realize the superior growth profile of Pure Multi-Family’s portfolio.
Combined with an annualized distribution of US$0.38 per unit (7.3% current yield),
our target price implies a 12-month forecast total return of 34.0%.
Real Estate Investment TrustsIndustry Overview
6 January 2016 13

13
2015 IN REVIEW
Canadian REITs returned -4.6% in 2015
For Canadian REITs, 2015 was a volatile year that started off strong and turned
negative through the spring. A weak December capped off an overall poor
performance from REITs for the year, and some REITs were down significantly. That
said, most of the worst-performing REITs had significant exposure to Alberta, and
excluding those REITs, we believe that the total return from the REIT sector was flat to
slightly positive.
Notwithstanding the weak performance, demand for direct property remained strong,
although fundamentals softened in some markets, Alberta in particular. For 2015,
Canadian REITs, as represented by the S&P/TSX Capped REIT Index, returned -4.6%.
Some of the major factors that impacted the sector were:
Long-term interest rates in Canada declined in 2015, but were volatile for most of
the year. The 10-year GoC bond yield declined 43 bps in Q1/15 from 1.79% on
December 31, 2014, to 1.36% on March 31, 2015. Since then, the yield was as
high as 1.91% in June; however, it declined over the latter half of the year and
settled at 1.39% at year-end, down 40 bps from the beginning of the year.
This was in contrast to the U.S. 10-year bond yield which was more stable and
over the course of 2015 increased 10 bps to 2.27%, as economic growth has
picked up in the U.S. Historically, the Canadian and U.S. 10-year bond yields have
tracked each other closely; however, the yields have exhibited some divergence
over the last few years.
Credit spreads rose steadily over the second half of 2015, and the spread
between Canadian cap rates and BBB corporate yields shrunk as a result. At
March 31, 2015, the spread was relatively wide at 280 bps. However, the spread
narrowed over the course of 2015 and was 201 bps at December 31, 2015,
essentially in line with the 10-year average. We believe that widening credit
spreads justify some of the weakness in the REIT market.
Oil prices continued to decline throughout 2015 and as a result the Canadian
economy was negatively impacted. According to the Bank of Canada, business
investment in the energy sector declined approximately 40% in 2015 and GDP
growth was negative in the first two quarters of 2015. Clearly, the weak
performance from Canadian REITs was partially driven by weaker fundamentals.
Office fundamentals weakened and the national vacancy rate increased from
10.7% at Q4/14 to 11.8% at Q3/15. In Alberta, the softening was most
significant. The Calgary office vacancy rate increased from 11.0% at Q4/14 to
15.5% at Q3/15, and in Edmonton from 11.3% at Q4/14 to 12.1% at Q3/15.
Store closures and the departure of Target drove vacancy higher for some retail
REITs and were the key topic of discussion in the retail sector in 2015. Internal
growth was negative for some retail REITs and is likely to remain negative in
2016.
Equity markets in general performed poorly, with the S&P/TSX Composite Index
posting a -8.3% return in 2015, below the -4.6% return from Canadian REITs.
Real Estate Investment TrustsIndustry Overview
6 January 2016 14

14
Figure 13: The S&P/TSX Capped REIT Index returned -4.6% in 2015
Source: Bloomberg, Canaccord Genuity
Long-term interest rates were volatile in 2015
The 10-year GoC bond yield declined 40 bps over the course of 2015; however, there
were some periods of volatility during the year. In Q1/15, long-term interest rates
declined and Canadian REITs performed well, returning +8.0% and outperforming the
S&P/TSX Composite which returned +2.6%. However, the 10-year GoC bond yield rose
33 bps during Q2/15, and consequently Canadian REITs returned -5.0% during the
quarter.
In the latter half of the year, long-term yields fell 42 bps to bottom out at 1.26% in
August 2015 before settling at 1.39% at December 31, 2015. Notwithstanding the
declining 10-year bond yield, the Canadian REIT index retreated 7.0% in the second
half of 2015 as the magnitude of the economic slowdown due to the decline in oil
prices became more evident. Additionally, concerns of a rise in long-term interest
rates due to the impending rate hike by the U.S. Federal Reserve weighed on the
Canadian real estate sector.
7.4%
25.9%
14.0%
25.3% 24.7%
-5.7%
-38.3%
55.3%
22.6% 21.7% 17.0%
-5.5%
10.4%
-4.6%
-60.0%
-40.0%
-20.0%
0.0%
20.0%
40.0%
60.0%
20
02
20
03
20
04
20
05
20
06
20
07
20
08
20
09
20
10
20
11
20
12
20
13
20
14
20
15
Real Estate Investment TrustsIndustry Overview
6 January 2016 15

15
Figure 14: S&P/TSX Capped REIT Index – 2015 performance
Source: Bloomberg, Canaccord Genuity
During 2015, Canadian REITs lagged other yield-oriented equity investments. The REIT
Index’s -4.6% total return underperformed the S&P/TSX Capped Utilities Index (-2.7%),
S&P/TSX Capped Financials Index (-3.0%), and S&P/TSX Capped Telecommunications
Services Index (+6.0%).
Figure 15: 2015 total returns for Canadian REITs, other yield-oriented sectors, and the broad market
Source: Bloomberg, Canaccord Genuity
In 2015, Canadian underperformed both U.S. REITS and the Global REIT Index
While the U.S. economy continued to strengthen, concerns of a rise in long-term
interest rates weighed on U.S. REITs in 2015. However, the MSCI U.S. REIT Index
outperformed Canadian REITs and returned a modest +2.5% for 2015. Meanwhile,
the Asian REIT index declined 7.2% whereas the European REIT index increased 4.2%.
The Global REIT index posted a total return of -0.4%.
1.2%
1.4%
1.6%
1.8%
2.0%
-12.0%
-6.0%
0.0%
6.0%
12.0%
Jan
-15
Fe
b-1
5
Ma
r-1
5
Ap
r-1
5
Ma
y-1
5
Jun
-15
Jul-1
5
Au
g-1
5
Se
p-1
5
Oct-
15
No
v-1
5
De
c-1
5
GoC 10-year bond yield (RHS) S&P/TSX Capped REIT Index (LHS)
S&P/TSX Composite Index (LHS)
-8.3%
-4.6%
-3.0% -2.7%
2.5%
6.0%
-10.0%
-5.0%
0.0%
5.0%
10.0%
S&P/TSX Composite
Index
S&P/TSX Capped REIT
Index
S&P/TSX Capped
Financials Index
S&P/TSX Capped
Utilities Index
MSCI U.S. REIT Index S&P/TSX Capped
Telecommunications
Services Index
Real Estate Investment TrustsIndustry Overview
6 January 2016 16

16
Figure 16: 2015 total returns for global REIT indices
Source: Bloomberg, Canaccord Genuity
Best and worst performing REITs in 2015
During 2015, the best performing Canadian REIT/REOC in our coverage was Amica
Mature Lifestyles Inc., which delivered a total return of +176% as a result of its
acquisition by BayBridge Seniors Housing Corp.
In 2015, 18 REITs/REOCs within our coverage universe (of 34) posted positive total
returns, with Amica Mature Lifestyles Inc. (+176% total return), SmartREIT (+17%),
and Pure Multi-Family REIT LP (+16%) being the top performers.
The strong performance from Amica Mature Lifestyles Inc. was driven by its
acquisition by Baybridge Seniors Housing Corp. at a 113% premium to Amica’s
share price.
Pure Multi-Family REIT LP has posted strong internal growth with same-property
NOI increasing 8.5% in the first three quarters of 2015. Fundamentals in the
REIT’s core Texas markets remain strong and cash flow growth is expected to
continue.
SmartREIT has posted healthy cash flow growth, partially due to the accretive
SmartCentres acquisition in Q2/15 which increased leverage. As well, despite a
challenging environment for retail landlords, SmartREIT maintained high
occupancy.
The worst performing REIT/REOCs in our coverage were Dream Unlimited Corp. (-
25%), Dream Office REIT (-24%), and Mainstreet Equity Corp. (-21%) as all three have
significant exposure to Alberta and investors became concerned about the impact of
softening fundamentals on cash flow and asset values. In fact, the six worst-
performing REITs/REOCs in 2015 all had significant exposure to Alberta or other
energy-focused regions such as Saskatchewan and the Territories.
-7.2%
-4.6%
-0.4%
2.5%
4.2%
-10.0%
-7.5%
-5.0%
-2.5%
0.0%
2.5%
5.0%
NAREIT Asia REIT
Index
S&P/TSX Capped
REIT Index
NAREIT Global
REIT Index
MSCI U.S. REIT
Index
NAREIT Europe
REIT Index
Real Estate Investment TrustsIndustry Overview
6 January 2016 17

17
Figure 17: 2015 total returns for REITs/REOCs under coverage*
*Excludes Amica Mature Lifestyle Inc. which returned +176%
**Canaccord research coverage is currently suspended
Source: FactSet, Canaccord Genuity
17%16% 16%
13%12% 12% 11% 11%
10% 8%
6% 6% 6% 5% 5%3% 3%
-2% -2% -3%-4% -4% -5%
-6%-7% -8%
-12%-14%
-17%
-18%-20%
-21%
-24% -25%
-30%
-20%
-10%
0%
10%
20%
SR
U.u
n*
*
RU
F.u
HO
T.u
n
IIP
.un
CS
H.u
n*
*
CA
R.u
n
CR
T.u
n*
*
AC
R.u
n*
*
DR
G.u
n
KM
P.u
n
BP
Y
TC
N*
*
CR
R.u
n
NW
H.u
n
AA
R.u
n
FC
R
SO
T.u
n
HR
.un
**
AX
.un
GR
T.u
n
RE
F.u
n*
*
BA
M
S&
P/TS
X C
ap
pe
d R
EIT
In
de
x
RE
I.u
n
DIR
.un
INN
.un
**
AP
.un
CU
F.u
n*
*
MR
.un
**
BE
I.u
n
NV
U.u
n*
*
ME
Q*
*
D.u
n
DR
M
Real Estate Investment TrustsIndustry Overview
6 January 2016 18

18
OUR OUTLOOK FOR 2016
We expect Canadian REITs to perform well in 2016 and we are forecasting total
returns of, on average, 19%. That said, we are concerned about widening credit
spreads, and recognize that an increase in long-term interest rates would be negative
for the sector.
There are a number of factors supporting our optimistic outlook for the REIT sector:
The expectation is that long-term interest rates will not rise significantly in
Canada;
Based on the current economic and interest-rate environment, we believe that
cap rates are likely to remain close to current levels;
The outlook for fundamentals is mixed and should not be a major factor for most
REITs;
Canadian REITs are trading at sizable discounts to NAV and appear attractively
valued relative to private market values and other yield-oriented investments; and,
Most REITs are well-positioned with healthy balance sheets and reasonable
payout ratios.
THE EXPECTATION IS THAT LONG-TERM INTEREST RATES WILL NOT RISE
SIGNIFICANTLY IN CANADA
During 2015, long-term bond yields dropped as economic growth slowed in Canada.
At year-end, the 10-year GoC bond yield was 1.39%, 40 bps below the 2014 year-end
bond yield of 1.79%.
Figure 18: In 2015, the 10-year GoC bond yield declined by 40 bps
Source: Bloomberg, Canaccord Genuity
In the U.S., both economic output and employment growth have been healthy and the
U.S. Federal Reserve raised its key interest rate by 25 bps in December 2015 with
further hikes likely in 2016. As the move to raise rates was widely anticipated, long-
term bond yields increased modestly in 2015, with the U.S. 10-year bond yield rising
10 bps to 2.27% at the end of the year. According to Bloomberg, economists are
predicting that the 10-year bond yield will increase by approximately 60 bps in Canada
and 50 bps in the U.S. in 2016, to a median forecast of 2.8% for the U.S. 10-year and
2.0% for the Canada 10-year (Figure 19).
-6%
0%
6%
12%
18%
24%
1.20%
1.60%
2.00%
2.40%
2.80%
Jan
-14
Fe
b-1
4
Ma
r-1
4
Ap
r-1
4
Ma
y-1
4
Jun
-14
Jul-1
4
Au
g-1
4
Se
p-1
4
Oct-
14
No
v-1
4
De
c-1
4
Jan
-15
Fe
b-1
5
Ma
r-1
5
Ap
r-1
5
Ma
y-1
5
Jun
-15
Jul-1
5
Au
g-1
5
Se
p-1
5
Oct-
15
No
v-1
5
De
c-1
5
10-yr GoC bond yield (LHS) S&P/TSX Capped REIT Index (RHS)
20152014
Real Estate Investment TrustsIndustry Overview
6 January 2016 19

19
Figure 19: Canada and U.S. 10-year bond yields (2004 – 2016F)
Source: Bloomberg, Canaccord Genuity
In Canada, however, the economic outlook is more uncertain. Most economic
indicators point to long-term interest rates remaining relatively stable:
The slowdown in the energy sector resulted in GDP contracting modestly in the
first two quarters of 2015. Since then, there has been a pickup in economic
growth, and the BoC expects 1.1% growth in real GDP for the full-year 2015. For
2016, the BoC expects real GDP growth of +2.0%, below forecast real GDP growth
in the U.S. of +2.6% in 2016.
Figure 20: GDP growth forecasts for Canada and the United States
Source: Bank of Canada, Canaccord Genuity
Inflation, as measured by core CPI, has been stable and according to the BoC is
expected to remain close to 2.0% for 2016 and 2017 (see Figure 21), which is
well within the BoC’s targeted 1-3% range. According to the BoC, a “significant
portion” of the measured inflation in 2015 was due to the depreciation of the
Canadian dollar which resulted in increased prices for imported goods.
2.0%
2.8%
1.0%
2.0%
3.0%
4.0%
5.0%
6.0%
7.0%
20
00
20
01
20
02
20
03
20
04
20
05
20
06
20
07
20
08
20
09
20
10
20
11
20
12
20
13
20
14
20
15
20
16
F
Canada U.S.
2.4%
1.1%
2.0%
2.5%2.4%
2.5%2.6%
2.5%
0.0%
1.0%
2.0%
3.0%
4.0%
2014 2015F 2016F 2017F
Canada United States
Real Estate Investment TrustsIndustry Overview
6 January 2016 20

20
Figure 21: Canadian inflation as measured by total and core CPI
Source: Bank of Canada, Canaccord Genuity
Essentially, economic growth has slowed, inflation is projected to be stable, and we do
not expect that the BoC will be in a position increase short-term interest rates in
2016. Therefore, the 10-year GoC bond yield is not expected to rise significantly in
2016.
That said, U.S. and Canadian long-term bond yields have historically been highly
correlated and it is likely that an increase in long-term yields in the U.S. will lead to a
corresponding rise in Canadian long-term yields. However, given the significant
divergence in the economic outlooks for the two countries, it appears reasonable to
expect that long-term interest rates in Canada will remain relatively low.
BASED ON THE CURRENT ECONOMIC AND INTEREST RATE ENVIRONMENT, WE
BELIEVE THAT CAP RATES ARE LIKELY TO REMAIN CLOSE TO CURRENT LEVELS
Investor demand for real estate remained strong through 2015, and we see this
continuing in 2016. Furthermore, the spread between cap rates and the 10-year GoC
bond yield is wide. Therefore, even if there is a modest increase in long-term interest
rates, we do not expect cap rates to increase significantly in 2016.
While REIT unit prices slumped in 2015 in part due to concerns over rising interest
rates, private market demand for real estate was strong. According to CBRE, the
national average cap rate in Canada dropped 11 bps in 2015 to 5.88% at Q4/15 as
investor appetite for high-quality assets remained strong. A few notable portfolio
transactions in 2015 were:
Regal Lifestyle Communities Inc., a seniors housing operator, was acquired by
Health Care REIT, Inc. and Revera Inc. for $764 million at a 6.1% cap rate.
CAP REIT acquired a portfolio of 16 apartment properties located in Montreal for
$502 million at a cap rate of 4.5%. The portfolio consisted of 3,661 suites and
194,000 sf of commercial space.
Boardwalk REIT sold its Windsor portfolio to a private REIT for $136 million at a
cap rate of 5.4%. The portfolio consisted of high-rise and low-rise apartment
complexes and townhouses totaling 1,685 units.
-2.0%
-1.0%
0.0%
1.0%
2.0%
3.0%
4.0%
5.0%
Jan
-95
Jan
-96
Jan
-97
Jan
-98
Jan
-99
Jan
-00
Jan
-01
Jan
-02
Jan
-03
Jan
-04
Jan
-05
Jan
-06
Jan
-07
Jan
-08
Jan
-09
Jan
-10
Jan
-11
Jan
-12
Jan
-13
Jan
-14
20
15
F
20
16
F
20
17
F
Core CPI Total CPI
Real Estate Investment TrustsIndustry Overview
6 January 2016 21

21
Brookfield Canada Office Properties sold the HSBC building located at 70 York
Street in downtown Toronto to Anbang Insurance, a Chinese insurance company,
for $110 million at a cap rate of ~4.3%.
Real estate continues to gain popularity among institutional asset managers, which
puts downward pressure on cap rates. In our view, this is in part due to the attractive
and stable yields generated by real estate in a continued low interest rate
environment. Going forward, with long-term interest rates expected to remain low and
fundamentals supporting NOI growth for most property types, demand for quality
properties should remain strong, and cap rates are unlikely to rise.
Spread between cap rates and GoC bond yield remains close to all-time high
Although cap rates have steadily compressed over the last several years, long-term
interest rates have dropped at a more rapid pace, which has widened the spread
between cap rates and long-term bond yields. Currently, the national average cap rate
(excluding hotels) is 5.88% whereas the yield on the 10-year GoC bond is 1.39%,
equating to a spread of 448 bps.
Figure 22: Spread between national average cap rate and long-term bond yield
Source: Bloomberg, CBRE Limited, Canaccord Genuity
However, the spread is somewhat less attractive when considering credit spreads. In
fact, credit spreads rose in 2015, and the spread between cap rates and BBB
corporate yields narrowed. At March 31, 2015, the spread was relatively wide at 280
bps, suggesting that if long-term interest rates rose modestly, cap rates would have a
wide cushion. However, as credit spreads widened through 2015, the spread
narrowed, and was 201 bps at December 31, 2015, essentially in line with the 10-
year average. Therefore, there could be upward pressure on cap rates if long-term
interest rates (or credit spreads) rise significantly.
(150)
(50)
50
150
250
350
450
550
0.0%
1.0%
2.0%
3.0%
4.0%
5.0%
6.0%
7.0%
8.0%
9.0%
10.0%
11.0%
12.0%
19
90
19
91
19
92
19
93
19
94
19
95
19
96
19
97
19
98
19
99
20
00
20
01
20
02
20
03
20
04
20
05
20
06
20
07
20
08
20
09
Q1
/1
0
Q2
/1
0
Q3
/1
0
Q4
/1
0
Q1
/1
1
Q2
/1
1
Q3
/1
1
Q4
/1
1
Q1
/1
2
Q2
/1
2
Q3
/1
2
Q4
/1
2
Q1
/1
3
Q2
/1
3
Q3
/1
3
Q4
/1
3
Q1
/1
4
Q2
/1
4
Q3
/1
4
Q4
/1
4
Q1
/1
5
Q2
/1
5
Q3
/1
5
Q4
/1
5
Sp
rea
d in
bp
s
Ca
p r
ate
/ y
ield
Spread (RHS) National average cap rate (LHS) 10-year GoC yield (LHS)
Current spread in bps 448
Average 327
Max 459
Min (104)
Real Estate Investment TrustsIndustry Overview
6 January 2016 22

22
Figure 23: The spread between cap rates and Canadian BBB bond yields has narrowed
Source: Bloomberg, CBRE Limited, Canaccord Genuity
Healthy demand for quality real estate supports current real estate values
Demand for real estate investment has remained strong and cap rates continue to
compress, with the national average cap rate declining 11 bps over the first three
quarters of 2015. Assuming no material spike in long-term interest rates or widening
of credit spreads, we expect cap rates to hold steady in 2016.
Figure 24: Cap rates in major CMAs (2008 – 2015)
Source: CBRE Limited, Canaccord Genuity
THE OUTLOOK FOR FUNDAMENTALS IS MIXED AND SHOULD NOT BE A MAJOR
FACTOR FOR MOST REITS
For the most part, REITs should generate modest internal growth resulting in cash flow
per unit growth, while those REITs with significant exposure to Alberta will face
pressure on their operating performance. In general though, we do not believe that
fundamentals will be a major factor in how most REIT unit prices perform in 2016.
Rather, reflecting attractive valuations, we expect steady fund flows into REITs which
should drive unit prices higher.
Office fundamentals have softened with the national vacancy rate expected to
increase from 12.3% in 2015E to 13.0% at the end of 2016 according to CBRE.
0
100
200
300
400
0.0%
1.0%
2.0%
3.0%
4.0%
5.0%
6.0%
7.0%
8.0%
9.0%
10.0%
20
03
20
04
20
05
20
06
20
07
20
08
20
09
Q1
/1
0
Q2
/1
0
Q3
/1
0
Q4
/1
0
Q1
/1
1
Q2
/1
1
Q3
/1
1
Q4
/1
1
Q1
/1
2
Q2
/1
2
Q3
/1
2
Q4
/1
2
Q1
/1
3
Q2
/1
3
Q3
/1
3
Q4
/1
3
Q1
/1
4
Q2
/1
4
Q3
/1
4
Q4
/1
4
Q1
/1
5
Q2
/1
5
Q3
/1
5
Q4
/1
5
Sp
rea
d(b
ps)
Ca
p r
ate
/ y
ield
Spread (RHS) National average cap rate (LHS) Corp BBB yield (LHS)
Current spread in bps 201
Average 197
Max 345
Min 61
5.0%
5.5%
6.0%
6.5%
7.0%
7.5%
8.0%
8.5%
Q3
/0
8
Q1
/0
9
Q3
/0
9
Q1
/1
0
Q3
/1
0
Q1
/1
1
Q3
/1
1
Q1
/1
2
Q3
/1
2
Q1
/1
3
Q3
/1
3
Q1
/1
4
Q3
/1
4
Q1
/1
5
Q3
/1
5
Ca
p r
ate
Calgary Edmonton Toronto Vancouver Montreal National avg.
Real Estate Investment TrustsIndustry Overview
6 January 2016 23

23
With more than 17.5 million sf of office space currently under construction
(equating to 4% of existing inventory), we expect further pressure on office
fundamentals.
In Toronto, fundamentals have been mostly stable, with vacancy up 40 bps to
9.9% at Q3/15 from 9.5% at Q4/14. However there is a clear divergence between
the downtown market, where demand is strong, and the suburban market where
vacancy is now at an 11-year high at 15.1%. For the most part, we are not
expecting same-property revenue growth from office portfolios, with Allied
Properties REIT’s portfolio being the notable exception. Allied’s 2015 results were
negatively impacted by vacancies in its Western Canada portfolio and lower
tenant recoveries. However, we believe internal growth should pick up in 2016 as
leasing activity in the REIT’s downtown Toronto properties has been healthy.
Industrial fundamentals remained steady in 2015 and are expected to improve in
2016, driven by increasing demand for logistics and distribution space. Although
there is currently 23.3 million sf of new space under construction (1.3% of total
inventory), we understand that a large portion of this space is pre-leased and as a
result should not impact fundamentals. CBRE expects the national average net
rental rate to increase 2.2% in 2016 to $6.59 psf, and the availability rate to
remain flat at 5.8%.
Retail fundamentals were challenged in 2015 due to elevated vacancy levels.
Online sales continue to take market share away from bricks and mortar retailers,
and a number of retail store closures in 2015 negatively impacted occupancy
rates.
Residential fundamentals were mixed in 2015. According to CMHC, the national
vacancy rate increased 50 bps year-over-year to 3.3% in October 2015. However,
the increase stemmed mostly from lower net migration to the resource-producing
regions whereas residential fundamentals remained strong in British Columbia
and Ontario and are improving in Atlantic Canada.
Lodging fundamentals improved in both Canada and the U.S. in 2015, a trend
which is expected to continue through 2016. Improved hotel demand, coupled
with stable supply, should drive higher revenue per available room (RevPAR) and
cash flow growth. Demand has been helped by the weak Canadian dollar, which is
resulting in increased travel within and to Canada.
Property market fundamentals by asset class and market are discussed in greater
detail in an Appendix on page 49.
CANADIAN REITS ARE TRADING AT SIZABLE DISCOUNTS TO NAV AND APPEAR
ATTRACTIVELY VALUED RELATIVE TO PRIVATE MARKET VALUES AND OTHER YIELD-
ORIENTED INVESTMENTS
In our view, Canadian REITs are attractively valued under most valuation metrics, as
detailed below:
Premiums/discounts to private market values: implied cap rates and price to NAV;
Cash flow multiples;
Implied cap rates as compared to long-term bond yields and BBB corporate bond
yields; and,
Canadian REITs continue to offer generous yields compared to other high-yielding
equities.
Net asset value – Canadian REITs/REOCs are trading at a sizable discount
The demand for real estate investment remains strong and cap rates compressed
slightly in 2015. However REIT unit prices have been soft due to concerns of rising
interest rates and lower rental income expectations particularly for properties located
in Western Canada. Currently, REITs/REOCs under coverage are trading at an implied
cap rate of 6.4% on a weighted average basis, unchanged since the end of 2014.
Real Estate Investment TrustsIndustry Overview
6 January 2016 24

24
Figure 25: Historical average implied cap rate for REITs/REOCs under coverage
Source: FactSet, REIT/REOC Reports, Canaccord Genuity Estimates
Based on our estimates, Canadian REITs/REOCs under coverage are trading at a
discount to NAV of 13.6% (simple average), the biggest discount since the financial
crisis. Historically, REITs have traded, on average, in line with NAV and at a +2.5%
premium to NAV excluding the financial crisis (2008-2009). We believe that, all else
being equal, REITs should trade at a slight premium to NAV to account for the
diversification, liquidity, and management provided to real estate investors. However,
we do recognize that this gap can also narrow through increasing cap rates, and not
only through higher unit prices.
Figure 26: Historical price to NAV for REITs/REOCs under coverage*
*Canaccord research coverage is currently suspended for a number of REITs/REOCs. NAV estimates for those REITs/REOCs used in this figure reflect consensus estimates per FactSet.
Source: FactSet, REIT/REOC Reports, Canaccord Genuity Estimates
While most REITs are trading well below NAV, the range is wide and a few are actually
trading above NAV. The company trading at the biggest discount to NAV is Dream
Unlimited Corp. which is heavily exposed to both Saskatchewan and Alberta. Its
portfolio is comprised of a number of different assets although its largest investments
8.9%
8.2%7.5%
7.3%7.2%7.3%6.8%6.8%
6.3%6.3%6.5%6.5%6.3%6.1%6.0%6.1%6.0%
6.3%6.6%6.5%6.4%6.3%6.4%6.4%
6.1%6.3%6.4%6.4%
0.0%
2.0%
4.0%
6.0%
8.0%
10.0%Q
1/0
9
Q2
/0
9
Q3
/0
9
Q4
/0
9
Q1
/1
0
Q2
/10
Q3
/1
0
Q4
/1
0
Q1
/1
1
Q2
/1
1
Q3
/1
1
Q4
/1
1
Q1
/1
2
Q2
/1
2
Q3
/1
2
Q4
/1
2
Q1
/1
3
Q2
/1
3
Q3
/1
3
Q4
/1
3
Q1
/14
Q2
/1
4
Q3
/1
4
Q4
/1
4
Q1
/1
5
Q2
/1
5
Q3
/1
5
Q4
/1
5
-6.3%
-19.3%
20.4%
-46.2%
12.6%
-10.2% -13.6%
-50.0%
-40.0%
-30.0%
-20.0%
-10.0%
0.0%
10.0%
20.0%
30.0%
40.0%
De
c-9
7
Jun
-98
De
c-9
8
Jun
-99
De
c-9
9
Jun
-00
De
c-0
0
Jun
-01
De
c-0
1
Jun
-02
De
c-0
2
Jun
-03
De
c-0
3
Jun
-04
De
c-0
4
Jun
-05
De
c-0
5
Jun
-06
De
c-0
6
Jun
-07
De
c-0
7
Jun
-08
De
c-0
8
Jun
-09
De
c-0
9
Jun
-10
De
c-1
0
Jun
-11
De
c-1
1
Jun
-12
De
c-1
2
Jun
-13
De
c-1
3
Jun
-14
De
c-1
4
Jun
-15
De
c-1
5
Global credit
crisis
Peak of
dotcom
Sale of EOP to
Blackstone (peak of
LBO cycle)Mean
reversion
Global credit
crisis
Peak of dotcom
bubble
Russian debt
crisis/LTCM
debacle
Sale of EOP to
Blackstone (peak of
LBO cycle)Mean
reversion
Taper
tantrum
Current NAV Prem / Disc -13.6%
Historical Average Prem / Disc -0.2%
Max NAV Premium 29.5%
Max NAV Discount -46.2%
Real Estate Investment TrustsIndustry Overview
6 January 2016 25

25
consist of land in Regina, Saskatoon, and Calgary. Demand for new housing in these
markets has declined considerably, and the near-term outlook is soft.
Brookfield Asset Management Inc. is trading at a 2% premium to NAV, the largest in
our coverage universe (excluding CT REIT for which research coverage is currently
suspended). The company is focusing on growing its fee-bearing capital which stood at
US$94.7 billion as of September 30, 2015. Moreover, BAM is aggressively marketing
new funds with the goal of raising a total of US$23 billion in new capital over the next
24 months. As management fees earned on this capital base rise, cash flows and NAV
are poised to increase significantly.
Figure 27: Premium/discount to NAV for REITs/REOCs under coverage
*Canaccord research currently suspended. NAV estimates reflect consensus estimates per FactSet.
Source: FactSet, REIT/REOC Reports, Canaccord Genuity Estimates
REITs/REOCs are trading slightly below their historical AFFO multiple
Currently, both the commercial and residential REITs/REOCs under coverage are
trading slightly lower than their respective historical average forward AFFO multiples.
Canadian commercial REITs/REOCs are, on average, trading at 13.5x forward
AFFO, below the historical average of 14.2x.
Canadian residential REITs/REOCs are, on average, trading at 15.4x forward
AFFO, lower than the historical average of 16.7x.
While the fear of widening credit spreads or higher long-term interest rates is likely to
remain on the mind of investors, REITs continue to present an attractive option for
retail investors for both exposure to real estate as well as current yield. We note that
Canadian REIT portfolios are larger, the management teams are more experienced
and in many cases deeper, the portfolios are of a higher quality, and the balance
sheets are more conservative than in prior years.
-49
%
-40
%
-33
%
-32
%
-26
%
-24
%
-24
%
-23
%
-21
%
-21
%
-20
%
-19
%
-19
%
-18
%
-17
%
-17
%
-16
%
-14
%
-13
%
-11
%
-11
% -8%
-8%
-8%
-7% -5
% -2%
-2%
-2%
-2%
-1%
-1%
-1%
2%
7%
-60%
-50%
-40%
-30%
-20%
-10%
0%
10%
20%
DR
M
ME
Q*
DIR
.un
TC
N*
NV
U.u
n*
D.u
n
AC
R.u
n*
CU
F.u
n*
HR
.un
*
MR
.un
*
GR
T.u
n
BP
Y
AA
R.u
n
SO
T.u
n
BE
I.u
n
AX
.un
RU
F.u
HO
T.u
n
Co
mm
. a
vg.
Re
s.
avg.
DR
G.u
n
FC
R
RE
F.u
n*
KM
P.u
n
RE
I.u
n
INN
.un
*
NW
H.u
n
AP
.un
SR
U.u
n*
CR
R.u
n
CS
H.u
n*
CA
R.u
n
IIP
.un
BA
M
CR
T.u
n*
Real Estate Investment TrustsIndustry Overview
6 January 2016 26

26
Figure 28: Weighted average forward price to AFFO multiple for REITs/REOCs under coverage
*Canaccord research coverage is currently suspended for a number of REITs/REOCs. AFFO estimates for those REITs/REOCs used in this figure reflect consensus estimates per FactSet.
Source: FactSet, REIT/REOC Reports, Canaccord Genuity Estimates
The REITs/REOCs trading at the lowest AFFO multiples are mostly those with exposure
to office properties and/or to Alberta. Within our coverage universe, Slate Office REIT,
Dream Office REIT, and American Hotel Income Properties REIT LP trade at the lowest
2016 AFFO multiples.
Slate Office REIT trades at 7.6x 2016E AFFO. In our view, the low multiple reflects
the recent increase in exposure to the office market and higher leverage.
Dream Office REIT trades at 7.8x 2016E AFFO as the REIT is likely to face
declining cash flow due to its significant exposure to the Western Canada office
market (40% of NOI).
American Hotel Income Properties REIT LP trades at 8.1x 2016E AFFO. We believe
the low multiple is due to the REIT’s relatively small market cap, unique asset
class, as well as earnings volatility in 2015. However, as the outlook for hotel
fundamentals is healthy, we expect multiple expansion over time.
17.5x17.0x
13.5x
20.3x 20.9x
15.4x
Commercial average since
2003, 14.2x
Residential average since
2003, 16.7x
5.0x
10.0x
15.0x
20.0x
25.0x
Q1
/0
3
Q3
/0
3
Q1
/0
4
Q3
/0
4
Q1
/0
5
Q3
/0
5
Q1
/0
6
Q3
/0
6
Q1
/0
7
Q3
/0
7
Q1
/0
8
Q3
/0
8
Q1
/0
9
Q3
/0
9
Q1
/1
0
Q3
/1
0
Q1
/1
1
Q3
/1
1
Q1
/1
2
Q3
/1
2
Q1
/1
3
Q3
/1
3
Q1
/1
4
Q3
/1
4
Q1
/1
5
Q3
/1
5
Commercial Residential Commercial average since 2003 Residential average since 2003
Real Estate Investment TrustsIndustry Overview
6 January 2016 27

27
Figure 29: 2016E AFFO multiples for commercial REITs/REOCs under coverage
*Canaccord research currently suspended. AFFO estimates reflect consensus estimates per FactSet.
Source: FactSet, REIT/REOC Reports, Canaccord Genuity Estimates
Figure 30: 2016E AFFO multiples for residential REITs/REOCs under coverage
* Canaccord research currently suspended. AFFO estimates reflect consensus estimates per FactSet.
Source: FactSet, REIT/REOC Reports, Canaccord Genuity Estimates
Canadian REITs offer generous yields when compared to investment grade bonds
We believe that a more valuable metric is the spread between REIT yields to BBB
yields, which takes into account credit spreads. Corporate bond yields increased
modestly during 2015 due to widening credit spreads. However, a decline in REIT unit
prices pushed REIT yields upwards and caused the spread between REIT yields and
Canadian 10-year BBB bond yields to increase 57 bps over the course of 2015 to 267
bps.
7.6x 7.8x 8.1x8.6x 8.8x
9.2x9.7x 9.9x 10.2x
11.4x 11.6x12.2x 12.3x
13.4x 13.5x 13.8x14.6x
15.2x15.7x 15.9x 15.9x
16.4x
18.4x
23.4x
0.0x
5.0x
10.0x
15.0x
20.0x
25.0x
SO
T.u
n
D.u
n
HO
T.u
n
DIR
.un
MR
.un
*
AC
R.u
n*
CU
F.u
n*
AX
.un
INN
.un
*
AA
R.u
n
NW
H.u
n
HR
.un
*
DR
G.u
n
GR
T.u
n
Co
mm
. a
vg.
CR
R.u
n
SR
U.u
n*
CR
T.u
n*
RE
I.u
n
RE
F.u
n*
AP
.un
CS
H.u
n*
FC
R
BP
Y
8.6x
11.3x
12.9x
14.7x15.4x 15.5x
16.7x
18.4x
0.0x
5.0x
10.0x
15.0x
20.0x
25.0x
NV
U.u
n*
RU
F.u
ME
Q*
KM
P.u
n
Re
s.
avg.
BE
I.u
n
IIP
.un
CA
R.u
n
Real Estate Investment TrustsIndustry Overview
6 January 2016 28

28
Figure 31: Canadian REIT distribution yields versus 10-year BBB corporate yields
Source: Bloomberg, Canaccord Genuity
The spread between the average Canadian REIT AFFO yield and the 10-year GoC bond
yield continued to rise in 2015. The spread is currently 584 bps, which is the highest
level in the last five years (Figure 32). Similarly, the spread between the average
Canadian REIT distribution yield and long-term bond yields has widened as REIT unit
prices declined in 2015. Currently, the spread is 514 bps, a level last observed in mid-
2009 (Figure 33).
Figure 32: Canadian REIT AFFO yields versus 10-year GoC. yield Figure 33: Canadian REIT distribution yields versus 10-year GoC yield
Source: Bloomberg, Canaccord Genuity Source: Bloomberg, Canaccord Genuity
With the decline in REIT unit prices, distribution yields are at multi-year highs. It
appears that investors are either expecting an increase in long-term interest rates or
continued softening in fundamentals. From our coverage, almost every REIT is well
positioned to maintain distributions through some economic softening. Further, we
expect distribution increases from a number of REITs over the next 12 months (more
later). Notwithstanding these risks, investors continue to take advantage of the
relatively high yields in real estate investments. Fund flows into real estate equities
(excluding reinvested distributions) have increased significantly over the first 11
months of 2015 at +$228 million, compared to +$26 million for the full-year 2014
(Figure 34).
0
50
100
150
200
250
300
0%
2%
4%
6%
8%
10%
Jan
-10
Jul-1
0
Jan
-11
Jul-1
1
Jan
-12
Jul-1
2
Jan
-13
Jul-1
3
Jan
-14
Jul-1
4
Jan
-15
Jul-1
5
Sp
rea
d (
bp
s)
Yie
ld (
%)
Spread (RHS) Average REIT distribution yield (LHS) CAN 10-Yr BBB Yield (LHS)
0
200
400
600
0.00%
2.00%
4.00%
6.00%
8.00%
10.00%
Q1
/1
0
Q1
/1
1
Q1
/1
2
Q1
/1
3
Q1
/1
4
Q1
/1
5
Sp
rea
d (
bp
s)
Yie
ld (
%)
Spread (RHS) GoC 10-year bond yield (LHS) REIT AFFO yield (LHS)
0
200
400
600
0.00%
2.00%
4.00%
6.00%
8.00%
10.00%
Q1
/1
0
Q1
/1
1
Q1
/1
2
Q1
/1
3
Q1
/1
4
Q1
/1
5
Sp
rea
d (
bp
s)
Yie
ld (
%)
Spread (RHS) GoC 10-year bond yield (LHS) REIT distribution yield (LHS)
Real Estate Investment TrustsIndustry Overview
6 January 2016 29

29
Figure 34: Fund flows into Canadian real estate equities ($ millions)
Source: Investment Funds Institute of Canada, Canaccord Genuity
Canadian REITs continue to offer higher yields compared to other yield-oriented
investments
The S&P/TSX Capped REIT Index is currently yielding 6.5%, a 150 bp premium to the
S&P/TSX Capped Utilities Index, which yields 5.0%. On average, the S&P/TSX Capped
REIT Index yield is 199 bps higher than the average of the Telecommunication
Services, Utilities, and Financials indices, 309 bps higher than the yield provided by
the broader market, and 514 bps higher than the 10-year GoC bond (Figure 35).
Figure 35: Current yield on for Canadian sector indices and the 10-year GoC bond
Source: Bloomberg, Canaccord Genuity
On a weighted average basis, Canadian REITs/REOCs under coverage are currently
yielding 6.3%. Canadian REITs/REOCs continue to provide compelling yields, with a
third of REITs/REOCs under coverage yielding greater than 8%.
0
500
1,000
1,500
2,000
2,500
3,000
3,500
4,000
(60)
(40)
(20)
0
20
40
60
80
100
Jan
-08
Ap
r-0
8
Jul-0
8
Oct-
08
Jan
-09
Ap
r-0
9
Jul-0
9
Oct-
09
Jan
-10
Ap
r-1
0
Jul-1
0
Oct-
10
Jan
-11
Ap
r-1
1
Jul-1
1
Oct-
11
Jan
-12
Ap
r-1
2
Jul-1
2
Oct-
12
Jan
-13
Ap
r-1
3
Jul-1
3
Oct-
13
Jan
-14
Ap
r-1
4
Jul-1
4
Oct-
14
Jan
-15
Ap
r-1
5
Jul-1
5
Oct-
15
To
tal n
et
asse
ts a
t m
on
th e
nd
Fu
nd
flo
ws (
inclu
din
g r
ein
ve
ste
d d
ivid
en
ds)
Total net assets (RHS) Total fund flows (LHS)
6.5%
5.0%
4.5%4.2%
3.4%
1.4%
0.0%
1.0%
2.0%
3.0%
4.0%
5.0%
6.0%
7.0%
S&P/TSX
Capped REIT
Index
S&P/TSX
Capped Utilities
Index
S&P/TSX
Capped
Telecom Index
S&P/TSX
Capped
Financials
Index
S&P/TSX
Composite
Index
10-yr GoC bond
Real Estate Investment TrustsIndustry Overview
6 January 2016 30

30
Figure 36: Distribution/dividend yields for the REITs/REOCs under coverage
* Canaccord research currently suspended
**Weighted average of REITs/REOCs excludes BAM, BPY, DRM, and TCN
Source: FactSet, Canaccord Genuity Estimates
MOST REITS ARE WELL-POSITIONED WITH HEALTHY BALANCE SHEETS AND
REASONABLE PAYOUT RATIOS
In general, most Canadian REITs have taken advantage of favourable debt capital
market conditions over the past few years to refinance debt at lower rates and reduce
payout ratios. On a weighted average basis, REITs/REOCs under coverage are
distributing approximately 83% of 2016E AFFO. This is down from 2014 and 2015,
when the payout ratio for REITs/REOCs under coverage was 86% of AFFO.
Figure 37: AFFO payout ratios are forecast to decline*
*2015-2017 AFFO payout ratio estimates assume current level of distributions
Source: FactSet, REIT/REOC Reports, Canaccord Genuity Estimates
0.0
%
0.0
%
1.5
%
2.6
% 3.5
% 4.3
%
4.3
%
4.3
%
4.5
%
4.6
%
4.7
%
4.8
%
5.2
%
5.5
%
5.7
%
6.0
%
6.1
%
6.3
%
6.7
%
7.0
%
7.1
%
7.3
%
7.8
% 8.4
%
8.5
%
8.8
%
9.0
%
9.2
%
9.3
%
9.4
%
9.7
%
10
.0%
10
.6%
12
.9%
0%
5%
10%
15%
ME
Q*
DR
M
BA
M
TC
N*
IIP
.un
RE
F.u
n*
BE
I.u
n
CS
H.u
n*
CA
R.u
n
BP
Y
FC
R
AP
.un
CR
T.u
n*
SR
U.u
n*
KM
P.u
n
RE
I.u
n
GR
T.u
n
Wtd
. a
vg.*
*
HR
.un
*
CR
R.u
n
AA
R.u
n
RU
F.u
INN
.un
*
AX
.un
HO
T.u
n
AC
R.u
n*
NW
H.u
n
DR
G.u
n
NV
U.u
n*
MR
.un
*
DIR
.un
CU
F.u
n*
SO
T.u
n
D.u
n89%
88%
89%
86%85%
86%86%
83%
81%
70%
75%
80%
85%
90%
95%
100%
2009 2010 2011 2012 2013 2014 2015E 2016E 2017E
Real Estate Investment TrustsIndustry Overview
6 January 2016 31

31
For the REITs/REOCs under coverage, 2016E AFFO payout ratios range from 59% for
InterRent REIT to 113% for Dream Global REIT (of note, Mainstreet Equity Corp. does
not pay a dividend).
On a weighted average basis, the 2016 AFFO payout ratio is 83%, with six
REITs/REOCs below 80%, and all but four REITs/REOCs are below 100%.
Figure 38: 2016E AFFO payout ratios**
*Canaccord research currently suspended. AFFO estimates reflect consensus estimates per FactSet.
**Excludes BAM, DRM, and TCN
Source: FactSet, REIT/REOC Reports, Canaccord Genuity Estimates
Most REIT management teams have placed an increased emphasis on maintaining a
strong balance sheet. Currently, 15 of the REITs under coverage have leverage under
50%, with leverage ratios ranging from 23% for Granite REIT to 63% for NorthWest
Healthcare Properties REIT.
Figure 39: Leverage ratios (including convertible debentures as debt) as at quarter-end Q3/15
*Canaccord research currently suspended.
Excludes BAM, DRM, and TCN
Source: REIT/REOC Reports, Canaccord Genuity Estimates
0%
59
% 67
%
68
%
68
%
71
% 76
%
80
%
80
%
80
%
80
%
81
%
81
%
81
%
81
%
82
%
82
%
83
%
83
%
83
%
84
%
84
%
84
%
86
% 94
%
96
%
97
%
10
1%
10
4%
10
7%
11
3%
0%
10%
20%
30%
40%
50%
60%
70%
80%
90%
100%
110%
120%
ME
Q*
IIP
.un
BE
I.u
n
RE
F.u
n*
HO
T.u
n
CS
H.u
n*
AP
.un
CR
T.u
n*
SR
U.u
n*
INN
.un
*
NV
U.u
n*
SO
T.u
n
AC
R.u
n*
AA
R.u
n
GR
T.u
n
HR
.un
*
MR
.un
*
RU
F.u
Wtd
. a
vg.
AX
.un
CA
R.u
n
KM
P.u
n
DIR
.un
FC
R
RE
I.u
n
CR
R.u
n
CU
F.u
n*
D.u
n
NW
H.u
n
BP
Y
DR
G.u
n
23
%
35
%
38
%
39
%
41
%
43
%
44
%
45
%
45
%
46
%
47
%
48
%
49
%
49
%
49
%
50
%
50
%
51
%
51
%
52
%
52
%
52
%
52
%
52
%
54
%
54
%
55
%
58
% 62
%
63
%
0%
20%
40%
60%
80%
GR
T.u
n
AP
.un
RE
F.u
n*
BE
I.u
n
CS
H.u
n*
RE
I.u
n
FC
R
D.u
n
SR
U.u
n*
ME
Q*
HR
.un
*
CR
T.u
n*
DR
G.u
n
AX
.un
AA
R.u
n
CA
R.u
n
HO
T.u
n
NV
U.u
n*
IIP
.un
MR
.un
*
BP
Y
DIR
.un
CR
R.u
n
AC
R.u
n*
RU
F.u
CU
F.u
n*
KM
P.u
n
INN
.un
*
SO
T.u
n
NW
H.u
n
Real Estate Investment TrustsIndustry Overview
6 January 2016 32

32
Modest cash flow growth expected in 2016
Aside from REITs with significant exposure to Alberta, we believe that fundamentals
are for the most part stable and should lead to modest cash flow growth. We expect
Canadian REITs/REOCs to post average AFFO per unit growth of 3.2% in 2016 and
3.4% in 2017 (weighted average).
Expect modest internal growth from most REITs/REOCs. We expect most REITs to
grow same-property NOI through leasing activity and positive rental spreads on
expiring leases. However, for REITs/REOCs with significant exposure to Western
Canada, fundamentals have softened considerably due to the impact from the
drop in oil and commodity prices. We expect internal growth to be muted for these
REITs/REOCs due to downward pressure on occupancy and rental rates.
Development projects should be accretive. In the current low cap rate
environment, accretive acquisition opportunities are difficult to find. Therefore a
number of REITs have become more active in new development to drive FFO
growth.
Refinancing debt should continue to boost cash flow. Although much of the
interest expense savings from refinancing debt at lower rates has already been
achieved, there are still potential savings from refinancing debt at market rates.
Figure 40: Growth in AFFO per unit/share (weighted average for REITs/REOCs under coverage*)
*Excludes BAM, BPY, DRM, and TCN
**Canaccord research coverage is suspended for a number of REITs/REOCs. AFFO estimates used to calculate the weighted average year-over-
year growth rates for those REITs/REOCs reflect consensus estimates per FactSet.
Source: FactSet, REIT/REOC Reports, Canaccord Genuity Estimates
The following table highlights our estimates of FFO and AFFO per diluted unit/share
for REITs/REOCs under coverage.
3.2%
5.6%
8.6%
3.9%
-2.8%
0.1%
3.2%
7.0%
8.6%
3.9%
3.2% 3.2% 3.4%
-4.0%
-2.0%
0.0%
2.0%
4.0%
6.0%
8.0%
10.0%
'05 '06 '07 '08 '09 '10 '11 '12 '13 '14 '15E '16E '17E
Real Estate Investment TrustsIndustry Overview
6 January 2016 33

33
Figure 41: Forecast FFO per unit/share and AFFO per unit/share growth
*Canaccord research is currently suspended. Estimates reflect consensus estimates per FactSet
**US$ estimates converted to C$ using an exchange rate of US$1.00=C$1.38
Source: FactSet, Canaccord Genuity Estimates
REITs/REOCs with highest expected cash flow growth in 2016
From the large cap REITs/REOCs, we expect the strongest 2016 AFFO per unit/share
growth from Brookfield Property Partners L.P. (+26%) and Allied Properties REIT
(+13%). From the small cap REITs/REOCs, we expect the strongest growth from
InterRent REIT (+38%), American Hotel Income Properties REIT LP (+20%), and Pure
Multi-Family REIT LP (+15%):
REIT/REOC 2015E 2016E 2017E 2016E 2017E 2015E 2016E 2017E 2016E 2017E
DIVERSIFIED COMMERCIAL
ACR.un* $1.23 $1.29 $1.36 5.0% 5.7% $0.93 $0.96 $1.03 3.6% 7.7%
AX.un $1.50 $1.49 $1.49 -0.5% -0.1% $1.32 $1.30 $1.29 -1.9% -0.4%
BPY (US$) $1.17 $1.36 $1.48 16.6% 8.7% $0.79 $0.99 $1.12 26.4% 13.1%
REF.un* $3.03 $3.09 $3.17 1.8% 2.8% $2.60 $2.65 $2.78 1.9% 4.8%
CUF.un* $1.79 $1.77 $1.80 -1.2% 2.2% $1.53 $1.51 $1.56 -1.1% 3.3%
DRG.un $0.77 $0.81 $0.88 5.9% 8.6% $0.65 $0.71 $0.78 8.0% 10.0%
HR.un* $1.91 $1.93 $1.97 1.4% 1.9% $1.62 $1.65 $1.70 1.7% 3.4%
MR.un* $1.00 $1.00 $1.02 0.4% 2.0% $0.82 $0.82 $0.84 0.5% 1.6%
INDUSTRIAL
AAR.un $0.39 $0.43 $0.44 8.4% 2.3% $0.35 $0.38 $0.39 9.8% 2.5%
DIR.un $0.95 $1.00 $1.02 4.8% 2.1% $0.80 $0.83 $0.86 4.5% 2.9%
GRT.un $3.39 $3.54 $3.67 4.5% 3.8% $2.71 $2.84 $2.97 4.9% 4.5%
OFFICE
AP.un $2.17 $2.38 $2.55 10.0% 7.1% $1.75 $1.99 $2.16 13.5% 8.5%
D.un $2.81 $2.77 $2.73 -1.6% -1.5% $2.41 $2.23 $2.18 -7.5% -1.9%
SOT.un $1.04 $1.12 $1.13 8.0% 0.4% $0.81 $0.93 $0.93 14.0% 0.5%
RESIDENTIAL
BEI.un $3.56 $3.51 $3.53 -1.6% 0.8% $3.12 $3.05 $3.08 -2.0% 0.8%
CAR.un $1.64 $1.76 $1.81 7.2% 3.1% $1.35 $1.46 $1.51 8.1% 3.4%
IIP.un $0.36 $0.47 $0.54 32.1% 14.3% $0.29 $0.39 $0.46 37.5% 17.0%
KMP.un $0.80 $0.84 $0.88 6.2% 4.4% $0.65 $0.71 $0.75 9.9% 4.8%
MEQ* $2.68 $2.80 $2.91 4.3% 4.1% $2.27 $2.33 $2.42 2.6% 4.0%
NVU.un* $2.42 $2.40 $2.50 -0.9% 4.0% $2.07 $2.04 $2.13 -1.3% 4.3%
RUF.u (US$) $0.45 $0.51 $0.53 13.1% 2.9% $0.39 $0.45 $0.47 15.2% 2.9%
RETAIL
SRU.un* $2.10 $2.20 $2.25 4.5% 2.6% $1.99 $2.07 $2.13 4.3% 2.7%
CRR.un $1.12 $1.11 $1.14 -0.7% 2.6% $0.94 $0.93 $0.95 -1.1% 2.0%
CRT.un* $1.04 $1.07 $1.10 3.8% 2.8% $0.81 $0.86 $0.89 5.8% 4.3%
FCR $1.05 $1.11 $1.16 6.0% 4.2% $0.93 $1.00 $1.05 7.0% 5.1%
REI.un $1.75 $1.68 $1.68 -3.9% 0.0% $1.57 $1.51 $1.51 -4.1% 0.3%
HEALTH CARE/SENIORS
CSH.un* $0.78 $0.84 $0.88 7.3% 5.1% $0.72 $0.78 $0.81 8.6% 4.8%
NWH.un $0.86 $0.94 $0.98 9.8% 4.0% $0.73 $0.77 $0.81 5.0% 5.0%
LODGING
HOT.un** $1.27 $1.51 $1.70 19.1% 12.3% $1.10 $1.32 $1.47 19.6% 12.1%
INN.un* $0.61 $0.67 $0.71 9.2% 5.9% $0.45 $0.50 $0.54 11.1% 8.1%
SPECIALTY REAL ESTATE
BAM (US$) $1.47 $1.78 $1.92 21.1% 7.8% NA NA NA NA NA
DRM (EPS) $1.50 $1.33 $1.41 -11.8% 6.1% NA NA NA NA NA
TCN* (EPS) $0.75 $0.62 $0.73 -17.5% 18.7% NA NA NA NA NA
FFO per unit/sh growth Diluted AFFO per unit/share AFFO per unit/sh growthDiluted FFO per unit/share
Real Estate Investment TrustsIndustry Overview
6 January 2016 34

34
Brookfield Property Partners L.P. has several drivers of cash flow growth for the
next few years, in our view. The most significant and immediate driver is rent
commencement at its properties in Lower Manhattan as tenants take occupancy.
BPY should also benefit from marking leases to market upon expiry and from
leveraging its active development/redevelopment pipeline.
We expect Allied Properties REIT to post healthy cash flow growth in the near term
as it completes development and redevelopment projects. Demand for space in
Allied’s core King West market remains strong and should offset some of the
softness in the REIT’s Western Canadian markets.
InterRent REIT’s portfolio is primarily concentrated in Ontario where residential
fundamentals are healthy. Going forward, we expect the REIT to achieve strong
cash flow per unit growth through raising rental rates, increasing operating
efficiencies, and from stabilizing the 442-suite Bell Street redevelopment
property.
Due to healthy hotel fundamentals in the U.S., we expect improvement in
American Hotel Income Properties REIT LP’s operating metrics, which should lead
to growth in same-property NOI and FFO. The REIT can also grow accretively
through both acquisitions and property expansions.
Pure Multi-Family REIT LP’s portfolio of high-quality apartment properties is
primarily located in large markets in Texas where fundamentals are strong. We
expect the REIT to generate robust same-property NOI growth over the next few
years, driving cash flows and NAV higher.
2016E AFFO per unit/share growth for the remaining REITs/REOCs under coverage is
expected to range from +14% to -8% (Figure 42).
Figure 42: 2016E AFFO per unit/share growth forecast
*Canaccord research coverage is currently suspended. Estimates reflect FactSet consensus estimates.
Source: FactSet, Canaccord Genuity Estimates
Distribution growth should continue in 2016
While REIT unit prices have been soft, fundamentals are steady for most REITs. We
believe that the expected cash flow per unit growth in 2016 should allow for a number
of REITs/REOCs to increase distributions/dividends over the next 12 months.
38%
26%
20%
15%14%13%
11%10%10% 9% 8% 8% 7% 6% 5% 5% 4% 4% 4% 3% 2% 2%0%
-1% -1% -1% -2% -2%-4%
-8%
-15%
0%
15%
30%
45%
IIP
.un
BP
Y
HO
T.u
n
RU
F.u
SO
T.u
n
AP
.un
INN
.un
*
KM
P.u
n
AA
R.u
n
CS
H.u
n*
CA
R.u
n
DR
G.u
n
FC
R
CR
T.u
n*
NW
H.u
n
GR
T.u
n
DIR
.un
SR
U.u
n*
AC
R.u
n*
ME
Q*
RE
F.u
n*
HR
.un
*
MR
.un
*
CR
R.u
n*
CU
F.u
n*
NV
U.u
n*
AX
.un
BE
I.u
n
RE
I.u
n
D.u
n
Real Estate Investment TrustsIndustry Overview
6 January 2016 35

35
As detailed in our latest Quarterly Distributions Monitor publication, there are six
REITs/REOCs that we expect will increase distributions over the next 12 months:
Brookfield Asset Management Inc., Brookfield Property Partners L.P., CAP REIT,
Granite REIT, InterRent REIT, and Pure Industrial Real Estate Trust.
Changes to target prices
In conjunction with publishing our 2016 Real Estate Outlook, we are making several
changes to our target prices:
We are lowering our target price slightly for Dream Global REIT to C$9.25 (from
C$9.50), which equates to a 5% discount to NAV. The new target price, combined
with an annualized distribution per unit of $0.80, equates to a forecast total
return of 16%. While we expect the fundamental performance of the REIT’s assets
to be solid in 2016, we do not believe that the unit price will reach NAV in the
near-term.
We are reducing our target price for Dream Office REIT to C$18.50 (from
C$20.00), which equates to a 20% discount to NAV. The outlook for the Alberta
office market continues to weaken, and it is difficult to see a catalyst in the near-
term. Additionally, with NOI poised to decline in 2016, and the increase in capex,
the likelihood of a distribution cut has increased materially.
We are lowering our target price for RioCan REIT to C$27.00 (from C$28.00),
which equates to a 5% premium to NAV. The new target price, combined with an
annualized distribution per unit of $1.41, equates to a forecast total return of
20%.
For NorthWest Healthcare Properties REIT, we are raising our target price to
C$9.15 (from C$8.75), which is in line with our NAV estimate. The new target
price, combined with an annualized distribution per unit of $0.80, equates to a
forecast total return of 11%.
Reflecting the softer housing market in both Saskatchewan and Alberta, we are
lowering our target price for Dream Unlimited Corp. to C$10.00 (from C$12.00).
Though cash flow should rise in 2016 from condo completions in Toronto,
investors are likely to remain cautious until there are some signs of improvement
in Western Canada housing.
Upgrading Slate Office REIT to a BUY
While suburban office fundamentals have softened, Slate Office REIT should grow
cash flow in 2016 as a result of acquisitions in 2015. In addition, the attractive 10.6%
current yield is fully covered by cash flow. The REIT’s units are currently trading at an
18% discount to NAV and only 7.6x our 2016 AFFO estimate, the lowest in our
coverage universe. While fundamentals have softened slightly, and leverage is
relatively high, the REIT’s units provide solid value and we are therefore upgrading our
rating for Slate Office REIT from HOLD to BUY.
Real Estate Investment TrustsIndustry Overview
6 January 2016 36

36
Figure 43: Changes to target prices and ratings
*Canaccord research coverage is currently suspended. Estimates reflect FactSet consensus estimates
**US$ estimates converted to C$ using an exchange rate of US$1.00=C$1.38
***Forecast total return for D.un assumes a distribution cut to $1.50 (from $2.24)
Source: FactSet, REIT/REOC Reports, Canaccord Genuity Estimates
For 2016, we are forecasting a weighted average total return of 19% from our
coverage universe. On an individual REIT/REOC basis, we are forecasting total returns
ranging from a high of 38% for Dream Unlimited Corp. to 9% for Crombie REIT.
Pre-tax Prem Annual Forecast AFFO Target AFFO
Price NAV per (disc) dividend/ total multiple multiple
REIT/REOC 31-Dec-15 Old Current Old Current unit/share to NAV distribution return 2017E 2017E
DIVERSIFIED COMMERCIAL
ACR.un* $8.84 BUY S S $11.69 -24% $0.78 S 8.6x S
AX.un $12.80 BUY BUY $15.50 $15.43 -17% $1.08 30% 9.9x 12.0x
BPY (US$) $23.24 BUY BUY $28.00 $28.81 -19% $1.06 25% 20.7x 24.9x
REF.un* $42.06 HOLD S S $45.67 -8% $1.80 S 15.1x S
CUF.un* $14.71 HOLD S S $19.19 -23% $1.47 S 9.4x S
DRG.un $8.66 BUY BUY $9.50 $9.25 $9.73 -11% $0.80 16% 11.2x 11.9x
HR.un* $20.05 HOLD S S $25.46 -21% $1.35 S 11.8x S
MR.un* $7.21 S S $9.10 -21% $0.68 S 8.6x S
INDUSTRIAL
AAR.un $4.37 BUY BUY $5.25 $5.42 -19% $0.31 27% 11.1x 13.3x
DIR.un $7.18 BUY BUY $9.00 $10.78 -33% $0.70 35% 8.4x 10.5x
GRT.un $37.96 HOLD HOLD $41.00 $47.68 -20% $2.30 14% 12.8x 13.8x
OFFICE
AP.un $31.57 HOLD HOLD $35.50 $32.35 -2% $1.50 17% 14.6x 16.5x
D.un*** $17.37 HOLD HOLD $20.00 $18.50 $22.99 -24% $2.24 15% 8.0x 8.5x
SOT.un $7.05 HOLD BUY $7.50 $8.61 -18% $0.75 17% 7.6x 8.0x
RESIDENTIAL
BEI.un $47.45 HOLD HOLD t $50.00 $57.28 -17% $2.04 10% 15.4x 16.2x
CAR.un $26.84 HOLD HOLD $30.00 $27.20 -1% $1.22 16% 17.8x 19.9x
IIP.un $6.56 BUY BUY $7.50 $6.62 -1% $0.23 18% 14.3x 16.3x
KMP.un $10.51 HOLD BUY $11.50 $11.39 -8% $0.60 15% 14.0x 15.4x
MEQ* $30.07 BUY S S $49.87 -40% $0.00 S 12.4x S
NVU.un* $17.56 HOLD S S $23.61 -26% $1.63 S 8.2x S
RUF.u (US$) $5.13 BUY BUY $6.50 $6.14 -16% $0.38 34% 11.0x 14.0x
RETAIL
SRU.un* $30.19 HOLD S S $30.67 -2% $1.65 S 14.2x S
CRR.un $12.80 BUY HOLD $13.00 $13.00 -2% $0.89 9% 13.5x 13.7x
CRT.un* $13.00 HOLD S S $12.15 7% $0.68 S 14.6x S
FCR $18.35 HOLD BUY $22.00 $19.95 -8% $0.86 25% 17.5x 21.0x
REI.un $23.69 HOLD BUY $28.00 $27.00 $25.56 -7% $1.41 20% 15.7x 17.9x
HEALTH CARE/SENIORS
CSH.un* $12.70 HOLD S S $12.88 -1% $0.55 S 15.6x S
NWH.un $8.93 HOLD $8.75 $9.15 $9.16 -2% $0.80 11% 11.0x 11.3x
LODGING
HOT.un** $10.65 BUY BUY $12.50 $12.39 -14% $0.90 26% 7.2x 8.5x
INN.un* $5.13 HOLD S S $5.42 -5% $0.40 S 9.5x S
SPECIALTY REAL ESTATE
BAM (US$) $31.53 BUY BUY $39.00 $30.96 2% $0.48 25% NA NA
DRM $7.27 BUY BUY $12.00 $10.00 $14.33 -49% $0.00 38% NA NA
TCN* $9.06 BUY S S $13.23 -32% $0.24 S NA NA
Rating
Target
Price
Real Estate Investment TrustsIndustry Overview
6 January 2016 37

37
Figure 44: 2016 forecast REIT/REOC total returns to one-year target price
*Weighted average excludes BAM, BPY, and DRM
Source: FactSet, REIT/REOC Reports, Canaccord Genuity Estimates
By asset class, we expect the highest returns in 2016 from the specialty real estate
REOCs (comprised of BAM and DRM) with a weighted average forecast total return of
26%, followed by diversified commercial at 25% and industrial at 21% (Figure 45).
Figure 45: 2016 forecast REIT/REOC total returns by sector (weighted averages)
*Weighted average excludes BAM, BPY, and DRM
Source: FactSet, REIT/REOC Reports, Canaccord Genuity Estimates
38
%
35
%
34
%
30
%
27
%
26
%
25
%
25
%
25
%
21
%
20
%
19
%
18
%
17
%
17
%
16
%
16
%
15
%
15
%
14
%
11
%
10
%
9%
0%
5%
10%
15%
20%
25%
30%
35%
40%
DR
M
DIR
.un
RU
F.u
AX
.un
AA
R.u
n
HO
T.u
n
BA
M
BP
Y
FC
R
Sim
ple
Ave
rage
RE
I.u
n
We
igh
ted
Ave
rage
*
IIP
.un
AP
.un
SO
T.u
n
CA
R.u
n
DR
G.u
n
D.u
n
KM
P.u
n
GR
T.u
n
NW
H.u
n
BE
I.u
n
CR
R.u
n
26% 25%
21%20%
19%
16%
15%
0%
5%
10%
15%
20%
25%
30%
Sp
ecia
lty
rea
l e
sta
te
Div
ers
ifie
d
co
mm
erc
ial
Ind
ustr
ial
Re
tail
We
igh
ted
ave
rage
Off
ice
Re
sid
en
tia
l
Real Estate Investment TrustsIndustry Overview
6 January 2016 38

38
KEY CONCERNS FOR 2016
In our view, there are a handful of risks which could lead to a year of negative returns
from Canadian REITs:
We believe that one of the key reasons for the weak performance from REITs in
2015 was the concern that long-term interest rates would rise. Going forward, the
outlook for interest rates will remain a key concern, and could impact REIT unit
prices materially. To the extent U.S. economic growth drives the U.S. 10-year bond
yield higher, Canadian long-term interest rates could follow, in spite of a lack of
growth in Canada.
Less material, but also a factor, fundamentals have softened somewhat and the
pace of cash flow growth has declined. We are currently forecasting AFFO per unit
growth of 3.2% for 2016, and 3.4% for 2017. This compares with our January
2015 forecast of 5.5% growth in AFFO per unit for 2016.
With significant office development across Canada, it is possible that
fundamentals will continue to soften. There is new supply being developed in
Calgary, Edmonton, Toronto, and Vancouver, which could lead to increased
vacancy. Although less of a concern, there is a large amount of industrial and
rental apartment space under development.
Consumer debt levels are relatively high and relatedly, the Canadian housing
market has been extremely strong for a number of years in both Toronto and
Vancouver. A correction in housing prices, possibly as a result of an increase in
the five-year bond yield, could negatively affect the Canadian economy
Should the price of oil remain low for an extended period of time, the Canadian
economy could suffer. Specifically, those REITs with exposure to Alberta could
face additional pressure.
Key concern #1: Long-term interest rates could increase in 2016 in spite of a soft
Canadian economy
In our view, the performance from Canadian REITs was disappointing in 2015 due to
concerns of an increase in Canadian long term interest rates. Going forward, there is a
possibility that long-term interest rates in Canada could increase in tandem with U.S.
interest rates, even if economic growth in Canada is modest. This could lead to an
increase in cap rates, and drive real estate values lower as the negative impact of
higher cap rates would not be adequately mitigated by growth in rental rates.
Strong correlation between Canada and U.S. long-term interest rates. The Canada and
U.S. 10-year government bond yields have historically been highly correlated with
each other, with a correlation coefficient of 0.98 over the last 30 years (Figure 46).
Real Estate Investment TrustsIndustry Overview
6 January 2016 39

39
Figure 46: Month-end Canada and U.S. 10-year government bond yields since 1985
Source: Bloomberg, ThomsonONE, Canaccord Genuity
However, we note that recently there has been some divergence between Canadian
and U.S. long-term interest rates. While the average spread between U.S. and Canada
10-year bond yields over the last 30 years has been +50 bps, the current spread is -
88 bps. In our view, this is likely because U.S. economic growth has been stronger,
whereas the Canadian economy has softened due to the oil price collapse.
Considering the spread between Canadian and U.S. bond yields is already abnormally
wide, we believe Canadian long-term interest rates could rise in lockstep with U.S.
long-term interest rates, without corresponding economic growth in Canada. This is a
key risk for the Canadian real estate sector. Alternatively, the divergence between the
two bond yields could continue, and Canadian long-term interest rates only rise when
the economy returns to healthy GDP growth.
The U.S. Federal Reserve recently increased short-term interest rates, which is likely to
drive long-term rates higher as well. The consensus estimate is for a 50 bp increase in
the U.S. 10-year bond yield in 2016.
0.0%
2.0%
4.0%
6.0%
8.0%
10.0%
12.0%
14.0%Ja
n-8
5
Jan
-86
Jan
-87
Jan
-88
Jan
-89
Jan
-90
Jan
-91
Jan
-92
Jan
-93
Jan
-94
Jan
-95
Jan
-96
Jan
-97
Jan
-98
Jan
-99
Jan
-00
Jan
-01
Jan
-02
Jan
-03
Jan
-04
Jan
-05
Jan
-06
Jan
-07
Jan
-08
Jan
-09
Jan
-10
Jan
-11
Jan
-12
Jan
-13
Jan
-14
Jan
-15
Canada U.S.
Correlation 0.97603244
Current spread -88 bps
Average spread 50 bps
Max spread 258 bps
Min spread -88 bps
Real Estate Investment TrustsIndustry Overview
6 January 2016 40

40
Figure 47: Canada vs. U.S. 10-year government bond yields have diverged over the last few years
Source: Bloomberg, ThomsonONE, Canaccord Genuity
Rising long-term interest rates could result in upward pressure on cap rates
Cap rates have generally followed the same course as long-term interest rates and
have been steadily declining since the early 1990s. However, in the scenario that
there is a material spike in interest rates, especially if there is no corresponding
economic growth, there would likely be upward pressure on cap rates. The following
chart depicts the average impact to our NAV estimates of 25 bp and 50 bp increases
to our utilized cap rates, all else equal. A 25 bp increase in cap rates would result in a
7.9% weighted average drop in our NAV estimates for REITs/REOCs under coverage,
whereas a 50 bp increase in cap rates would result in a 15.2% drop.
-100 bps
-80 bps
-60 bps
-40 bps
-20 bps
0 bps
20 bps
40 bps
60 bps
80 bps
100 bps
1.0%
1.5%
2.0%
2.5%
3.0%
3.5%
4.0%
Jan
-09
Ap
r-0
9
Jul-0
9
Oct-
09
Jan
-10
Ap
r-1
0
Jul-1
0
Oct-
10
Jan
-11
Ap
r-1
1
Jul-1
1
Oct-
11
Jan
-12
Ap
r-1
2
Jul-1
2
Oct-
12
Jan
-13
Ap
r-1
3
Jul-1
3
Oct-
13
Jan
-14
Ap
r-1
4
Jul-1
4
Oct-
14
Jan
-15
Ap
r-1
5
Jul-1
5
Oct-
15
Spread (RHS) Canada (LHS) U.S. (LHS)
Real Estate Investment TrustsIndustry Overview
6 January 2016 41

41
Figure 48: Sensitivity of sector NAV to changes in utilized cap rates
Source: Canaccord Genuity Estimates
In the chart below, we detail the impact of a 50 bp increase in the utilized cap rate on
each individual REIT/REOC under coverage. Generally, REITs/REOCs which are more
highly levered and which are currently valued at lower cap rates are more sensitive to
increases in cap rates. The impact for REITs/REOCs under coverage ranges from a
21% decline in our NAV estimate for Brookfield Property Partners to a 7% decline for
Granite REIT.
Figure 49: NAV sensitivity to a 50 bp increase in utilized cap rates
Source: Canaccord Genuity Estimates
Key concern #2: Further softening in real estate fundamentals could put pressure
on cash flow growth
Cash flow per unit growth for Canadian REITs has been below expectations in 2015.
At the beginning of 2015, we expected weighted average AFFO per unit growth of
5.5% for REITs/REOCs under coverage. However, fundamentals for certain asset
classes and geographies have softened, and our current 2015 estimate for average
-7.9%
-15.2%
-28.3%-30.0%
-20.0%
-10.0%
0.0%
+25 bps +50 bps +100 bps
-21%
-20% -19%
-17%-17% -17% -16%
-16% -15% -15% -15% -15% -14% -14% -14%
-11% -11%
-10%
-7%
-25.0%
-20.0%
-15.0%
-10.0%
-5.0%
0.0%
BP
Y
IIP
.un
KM
P.u
n
CA
R.u
n
AX
.un
D.u
n
CR
R.u
n
DR
G.u
n
NW
H.u
n
SO
T.u
n
FC
R
BE
I.u
n
DIR
.un
AA
R.u
n
RU
F.u
RE
I.u
n
AP
.un
HO
T.u
n
GR
T.u
n
Real Estate Investment TrustsIndustry Overview
6 January 2016 42

42
AFFO per unit/share growth is 3.2% with eight REITs/REOC expected to post negative
year-over-year cash flow per unit growth for 2015.
Figure 50: 2015E AFFO per unit/share growth for Canadian REITs/REOCs
*Canaccord research currently suspended. AFFO estimates reflect consensus estimates per FactSet.
**Excludes BAM, DRM, and TCN
Source: REIT/REOC Reports, Canaccord Genuity Estimates
Looking forward to 2016, we expect further softening in fundamentals for some asset
classes and geographies. Among real estate asset classes, the office sector remains
the most vulnerable as there is an elevated amount of incoming supply. According to
CBRE data, there is significant office space construction in Calgary, Edmonton, and
Vancouver (Figure 51). As of Q3/15, office space under construction represented
8.8% of existing inventory in Calgary, 8.3% in Edmonton, and 4.8% in Vancouver (4.0%
nationally).
In Vancouver, though the proportion of office space inventory under construction is
higher than the national average, we do not expect fundamentals to deteriorate
significantly as CBRE expects leasing activity to be healthy in 2016 due to strong
demand for real estate from the tech and professional services sectors. However, in
Calgary and Edmonton, there is an estimated 7.6 million sf in office development that
is under construction which is expected to come on line in 2016 and 2017. The
incoming supply is likely to have a material impact on vacancy and rental rates over
the next few years, especially if oil prices remain depressed and absorption is weak.
-12
.8%
-10
.4%
-5.6
%
-4.5
%
-4.1
% -1.5
%
-1.3
%
-0.3
%
0.2
%
1.2
%
2.1
%
2.3
%
2.9
%
3.0
%
3.1
%
4.2
%
4.7
%
5.5
%
6.3
%
6.7
% 9.8
%
10
.8%
11
.0%
11
.2%
12
.0%
12
.5%
13
.1%
14
.5% 17
.7%
25
.4%
-20%
-15%
-10%
-5%
0%
5%
10%
15%
20%
25%
30%
DR
G.u
n
BP
Y
NW
H.u
n
RE
F.u
n*
D.u
n
HR
.un
*
CS
H.u
n*
AP
.un
CA
R.u
n
HO
T.u
n
RE
I.u
n
CU
F.u
n*
RU
F.u
NV
U.u
n*
GR
T.u
n
CR
R.u
n
DIR
.un
AX
.un
FC
R
BE
I.u
n
CR
T.u
n*
AC
R.u
n*
SR
U.u
n*
MR
.un
*
AA
R.u
n
IIP
.un
ME
Q*
KM
P.u
n
INN
.un
*
SO
T.u
n
Real Estate Investment TrustsIndustry Overview
6 January 2016 43

43
Figure 51: Office space under construction as a percentage of current inventory – Q3/15
Source: CBRE Limited, Canaccord Genuity
Some of the larger properties slated to be completed in the next two years are
Brookfield Place in Calgary (1.4 million sf to be completed in 2017) and Bay Adelaide
East in Toronto (1.0 million sf to be completed in 2016). Details of downtown office
developments currently under construction in Calgary and Toronto are provided in the
following table.
In downtown Calgary, there are five office development projects underway totaling
3.8 million sf. On average, the developments are 67% pre-leased, with completion
scheduled for 2016 to 2018.
In downtown Toronto, there are five office development projects underway totaling
3.6 million sf. On average, the developments are 71% pre-leased, with completion
scheduled for 2016 to 2017.
Figure 52: Summary of downtown office developments currently under construction in Calgary and Toronto
Source: CBRE Limited, Canaccord Genuity
Demand for office space declined in 2015 with negative 1.7 million sf of space
absorbed nationally, in the first three quarters of 2015. Although CBRE expects
absorption to be positive in 2016, it is expected to total only 2.8 million sf,
significantly lower than the 6.8 million sf of new office space expected to come on-line
in 2016. As a result, CBRE expects the national vacancy rate to increase from 12.3%
in 2015 to 13.0% (Figure 53) in 2016.
0.0% 0.4% 0.4% 0.6%
2.5%
3.4%4.0% 4.0%
4.8%
8.3%8.8%
0.0%
2.5%
5.0%
7.5%
10.0%
Win
nip
eg
Ott
aw
a
Wa
terl
oo
Re
gio
n
Lo
nd
on
Mo
ntr
ea
l
To
ron
to
Na
tio
na
l
Ha
lifa
x
Va
nco
uve
r
Ed
mo
nto
n
Ca
lga
ry
CALGARY TORONTO
Project Developer GLA (sf) Occupancy Pre-leased Project Developer GLA (sf) Occupancy Pre-leased
City Centre Cadillac Fairview 810,000 2016 87% Bay Adelaide Centre East Brookfield Properties 1,017,826 2016 67%
Eau Claire Tower Oxford Properties 615,000 2016 77% Globe and Mail Centre First Gulf Corporation 462,000 2016 94%
707 Fifth Street Manulife 564,000 2017 44% One York Menkes Developments 800,000 2016 76%
Brookfield Place - East Tower Brookfield Properties 1,400,000 2017 71% 100 Adelaide Street West Oxford Properties 905,720 2017 86%
Telus Sky Telus/Allied/Westbank 430,000 2018 36% Daniels Waterfront Daniels Capital 398,000 2017 14%
Total/average 3,819,000 67% Total/average 3,583,546 71%
Real Estate Investment TrustsIndustry Overview
6 January 2016 44

44
Figure 53: National office vacancy rates (2014 – 2016E)
Source: CBRE Limited, Canaccord Genuity
Although there is significant industrial space under construction, we believe this is
less of a concern since much of the space is built-to-suit. As of September 30, 2015,
industrial space under construction in Calgary totaled 3.2% of current inventory (~4.1
million square feet), 3.2% in Vancouver (~5.8 million square feet), and 2.8% in
Edmonton (~3.1 million square feet). This compares to the national average of 1.3%.
Figure 54: Industrial space under construction as a percentage of current inventory – Q3/15
Source: CBRE Limited, Canaccord Genuity
Rising unemployment due to cutbacks in the energy sector and increasing rental
apartment inventory levels are expected to weigh on rental apartment fundamentals
in Calgary and Edmonton. CBRE expects the vacancy rate in both of these markets to
increase over the next two years and rental rate growth is expected to be much slower
than the high growth rates witnessed in recent years.
However, the softness in Alberta should be mostly offset by strength in Ontario and
British Columbia, where economic growth is expected to pick up. In our view, the risk
of softening rental apartment fundamentals is more apparent for REITs/REOCs with
significant exposure to Alberta, Saskatchewan, and other energy-focused regions.
11.0% 11.3%
9.5%10.7%
16.7%
12.2%
10.7%
12.3%
18.1%
16.2%
11.7%
13.0%
4.0%
8.0%
12.0%
16.0%
20.0%
Calgary Edmonton Toronto Canada
2014 2015E 2016E
0.1%0.2% 0.2% 0.3% 0.3%
1.2%1.3%
1.7%
2.8%
3.2% 3.2%
0.0%
1.0%
2.0%
3.0%
4.0%
Win
nip
eg
Ott
aw
a
Mo
ntr
ea
l
Wa
terl
oo
Re
gio
n
Lo
nd
on
To
ron
to
Na
tio
na
l
Ha
lifa
x
Ed
mo
nto
n
Va
nco
uve
r
Ca
lga
ry
Real Estate Investment TrustsIndustry Overview
6 January 2016 45

45
Figure 55: Rental apartment units under construction in Calgary and Edmonton
Source: Canada Mortgage and Housing Corporation, Canaccord Genuity
Key concern #3: Consumer debt levels relative to disposable income are at an all-
time high
Consumer debt levels have risen steadily over the past 25 years, supported by
appreciating asset prices. The current household debt-to-disposable income ratio is a
record 167% (according to Statistics Canada). Housing prices in Canada have risen
rapidly over the past several years, and a number of brokers and research firms
(including CMHC, the IMF, and Royal LePage) have recently warned of overvaluation in
the Canadian housing market.
A significant increase in the five-year GoC bond yield and/or a material correction in
housing prices could cause widespread deleveraging, which would negatively impact
consumer spending and consequently the Canadian economy.
Figure 56: The Canadian household debt-to-disposable income ratio is currently at a record high
Source: Statistics Canada, Canaccord Genuity
Key concern #4: Persistent low oil prices could continue to adversely impact the
Canadian economy, Alberta in particular
The oil price decline has adversely impacted the Canadian economy, particularly in the
energy-producing provinces of Alberta and Saskatchewan where there have been
382546
975 953
1,384
2,267
378
847
2,0752,371
2,7883,040
0
1,000
2,000
3,000
4,000
Dec-2010 Dec-2011 Dec-2012 Dec-2013 Dec-2014 Nov-2015
Calgary Edmonton
0%
20%
40%
60%
80%
100%
120%
140%
160%
180%
19
91
19
92
19
93
19
94
19
95
19
96
19
97
19
98
19
99
20
00
20
01
20
02
20
03
20
04
20
05
20
06
20
07
20
08
20
09
20
10
20
11
20
12
20
13
20
14
20
15
Real Estate Investment TrustsIndustry Overview
6 January 2016 46

46
material declines in retail sales and employment levels. One of the hardest-hit real
estate markets is the Calgary office market. Per CBRE data in mid-2015, the oil and
gas sector accounted for 8.5% of total employment and 75%-85% of downtown office
space in Calgary. Not surprisingly, the office vacancy rate has increased 450 bps and
rental rates have declined 17.0% in the first three quarters of 2015. Residential real
estate fundamentals have also been impacted, with the vacancy rate in Edmonton
and Calgary increasing year-over-year by 250 bps and 390 bps respectively, at
October 2015 (CMHC data).
A number of REITs/REOCs under our coverage have material exposure to energy
markets in Western Canada. We continue to be cautious of these REITs/REOCs. In our
view, the REITs with the shortest lease terms and greatest exposure to Alberta are
most at risk of being negatively impacted by a weaker Alberta economy as indicated in
the following chart (Figure 57).
Figure 57: Exposure to Alberta/Western Canada (percentage of NOI or assets) vs. weighted average lease term to expiry (years) as at Q3/15
Source: REIT/REOC reports, Canaccord Genuity
Boardwalk REIT’s portfolio of rental apartment properties is materially exposed to
Alberta, with 68% of NOI generated from the province. We expect the pace of
internal growth to turn negative in 2016 as market rental rates are trending
downwards and vacancy is on the rise. However in the near term, the impact on
FFO per unit should be partly offset by unit buybacks and interest expense savings
from refinancing maturing debt at lower interest rates.
Approximately 40% of Dream Office REIT’s NOI is generated from Western
Canada. Elevated vacancy levels and downward pressure on rental rates resulted
in same-property NOI growth turning negative in Q3/15. Given the weakening
office fundamentals across the country and especially in Calgary, we expect the
pressure on internal growth to remain and do not see a catalyst for the units in
the near term.
Artis REIT has material exposure to Alberta (35% of Q3/15 NOI). Not surprisingly,
internal growth for the Canadian portfolio was -1.6% in Q3/15. However, in our
view the REIT is better prepared to handle the current downturn in Alberta as
compared to the previous downturn following the financial crisis in 2008/2009,
MR.UN
MEQ
BEI.UN
AX.UN
D.UN
DIR.UN REF.UNFCR
HR.UNAAR.UN CRT.UN
INN.UN
NVU.UN
AP.UN
CRR.UN
REI.UN
CAR.UN
GRT.UN
CUF.UNSRU.UNCSH.UN
RUF.U
KMP.UN
IIP.UN
HOT.UN DRG.UN
NWH.un
ACR.UN
0%
10%
20%
30%
40%
50%
60%
70%
80%
90%
100%
0.0 2.0 4.0 6.0 8.0 10.0 12.0 14.0
Pe
rce
nta
ge
exp
osu
re t
o A
lbe
rta
/ W
este
rn C
an
ad
a
Weighted average lease term to expiry (years)
Real Estate Investment TrustsIndustry Overview
6 January 2016 47

47
due to a lower payout ratio, reduced leverage, and fewer lease expiries from the
Calgary office market.
Furthermore, strong performance from the U.S. portfolio and the strengthening
U.S. dollar have boosted the REIT’s cash flow, more than offsetting the weakness
in the Canadian portfolio and the Alberta properties in particular. As fundamentals
in its U.S. markets remain strong, we expect continued NOI growth from the REIT’s
portfolio.
Real Estate Investment TrustsIndustry Overview
6 January 2016 48

48
APPENDIX – PROPERTY FUNDAMENTALS
Office
Canadian office fundamentals weakened in 2015 as growth in supply outpaced
demand. For the first three quarters of the year, demand for office space softened
and absorption totaled -1.7 million sf, compared to +3.0 million sf for full-year 2014.
This, combined with the 4.2 million sf of new space delivered to the Canadian market
(as of Q3/15), resulted in a 110 bp increase in the national vacancy rate, from 10.7%
at Q4/14 to 11.8% at Q3/15. Over the same period, rental rates have stayed flat
according to CBRE, as a 17.0% decline in the average class A net rental rate in
Calgary completely offset increases in most other major markets. We believe that net
effective rental rates have actually declined as leasing costs have been rising in some
markets.
Figure 58: National office market snapshot
Source: CBRE Limited, Canaccord Genuity
Looking ahead to 2016, CBRE expects fundamentals to remain mixed. As of Q3/15,
there was 17.5 million sf of office space under construction, which is above the 10-
year average of 14.7 million sf. Furthermore, many companies, especially in Alberta,
are reducing their office space footprints in an effort to be more efficient, which could
result in sustained low absorption and keep downward pressure on occupancy rates.
However, there are several bright spots in the Canadian office market. CBRE expects
office fundamentals to remain healthy in Vancouver as demand for real estate from
the tech and professional sectors should offset weakness in the resource sector. Also,
CBRE expects above-average economic growth in Atlantic Canada which should
enable office market fundamentals to improve. CBRE’s latest forecast has the
national office vacancy rate increasing 70 bps in 2016, from 12.3% at year-end 2015
to 13.0% at year-end 2016 (Figure 59).
(3.0)
(2.0)
(1.0)
0.0
1.0
2.0
3.0
4.0
5.0
0%
3%
6%
9%
12%
15%
Q2
20
02
Q4
20
02
Q2
20
03
Q4
20
03
Q2
20
04
Q4
20
04
Q2
20
05
Q4
20
05
Q2
20
06
Q4
20
06
Q2
20
07
Q4
20
07
Q2
20
08
Q4
20
08
Q2
20
09
Q4
20
09
Q2
20
10
Q4
20
10
Q2
20
11
Q4
20
11
Q2
20
12
Q4
20
12
Q2
20
13
Q4
20
13
Q2
20
14
Q4
20
14
Q2
20
15
Millio
n s
qu
are
fe
et
Va
ca
ncy
rate
Absorption (LHS) Construction completions (LHS) Vacancy rate (RHS)
Real Estate Investment TrustsIndustry Overview
6 January 2016 49

49
Figure 59: CBRE’s office vacancy rate forecasts
Source: CBRE Limited, Canaccord Genuity
On a geographical basis, fundamentals softened in most markets; however, the
imbalance between supply and demand has been most prevalent in the Calgary
market.
Fundamentals in Calgary have weakened significantly over the past year.
Absorption for the first three quarters of 2015 was -2.3 million sf, while a
significant 1.7 million sf of new supply was delivered to the market. As a result,
vacancy increased 450 bps from 11.0% in Q4/14 to 15.5% in Q3/15.
Furthermore, the overall office class A average net rental rate dropped 17.0%
from $28.22 psf in Q4/14 to $23.41 psf in Q3/15. In our view, the net effective
rental rate is probably much lower, and in some cases negative, as landlords are
forced to offer increased incentives to attract tenants.
According to CBRE, fundamentals will weaken further in the near term as large
development projects are completed. As of Q3/15, there was 5.5 million sf of
office space under construction (8.8% of existing supply) which is expected to
come on-line in 2016-2017. In 2016, CBRE forecasts the Calgary office vacancy
rate rising to 18.1%.
CBRE expects further negative pressure in the downtown office market of
Calgary. Vacancy is expected to increase (CBRE data) from 16.3% in 2015 to
18.4% in 2016 as 620,000 sf of new supply is delivered to the market and
net absorption is expected to be negative.
The suburban office market in Calgary is expected to hold up better than the
downtown market. According to CBRE, vacancy is expected to increase 20 bps
from 17.5% in 2015 to 17.7% in 2016 despite 440,000 sf of new supply
entering the market in 2016.
In Edmonton, fundamentals have also softened considerably. Absorption was
essentially flat for the first three quarters of 2015 and vacancy increased 80 bps
from 11.3% in Q4/14 to 12.1% in Q3/15, as 253,000 sf of new office space was
delivered to the market. The development pipeline is quite significant, with 2.0
million sf of office space currently under construction (8.3% of existing supply).
CBRE expects leasing activity to be soft over the next few years as tenants wait for
new office space to come on line before making long-term commitments. The
Edmonton office vacancy rate is expected to rise dramatically by 400 bps in 2016
to 16.2%.
10.1%
15.1%
12.3%
11.1%
15.4%
13.0%
4.0%
6.0%
8.0%
10.0%
12.0%
14.0%
16.0%
18.0%
Downtown vacancy rate Suburban vacancy rate Overall vacancy rate
2013 2014 2015E 2016E
Real Estate Investment TrustsIndustry Overview
6 January 2016 50

50
In Toronto, though absorption was slightly positive over the first three quarters of
2015 at 185,000 sf, it was outpaced by the 1.1 million sf of new supply delivered
to the market. As a result, the vacancy rate increased 40 bps to 9.9% at Q3/15
from 9.5% at Q4/14.
For 2016, CBRE expects the vacancy rate to rise to 11.7%.
Figure 60: Overall office vacancy rate forecasts for select Canadian markets
Source: CBRE Limited, Canaccord Genuity
Figure 61: Elevated levels of office construction remains a concern in Western Canada
Source: CBRE Limited, Canaccord Genuity
Industrial
Industrial fundamentals were strong for the most part in 2015 as demand for logistics
and distribution space drove positive leasing activity. Absorption over the first three
quarters of 2015 was +8.9 million sf, despite Target’s vacancy from three distribution
centres totaling 3.1 million sf. The availability rate increased marginally from 5.4% at
Q4/14 to 5.6% at Q3/15, as 12.8 million sf in new completions outweighed the
positive absorption. Meanwhile, average net rent increased by a healthy 5.3% from
$6.06 psf at Q4/14 to $6.38 psf at Q3/15.
11.0% 11.3%
9.5%10.7%
16.7%
12.2%
10.7%
12.3%
18.1%
16.2%
11.7%
13.0%
4.0%
8.0%
12.0%
16.0%
20.0%
Calgary Edmonton Toronto Canada
2014 2015E 2016E
0.0% 0.4% 0.4% 0.6%
2.5%
3.4%4.0% 4.0%
4.8%
8.3%8.8%
0.0%
2.5%
5.0%
7.5%
10.0%
Win
nip
eg
Ott
aw
a
Wa
terl
oo
Re
gio
n
Lo
nd
on
Mo
ntr
ea
l
To
ron
to
Na
tio
na
l
Ha
lifa
x
Va
nco
uve
r
Ed
mo
nto
n
Ca
lga
ry
Real Estate Investment TrustsIndustry Overview
6 January 2016 51

51
Figure 62: National industrial market snapshot
Source: CBRE Limited, Canaccord Genuity
According to CBRE, industrial fundamentals are expected to remain stable in 2016,
with the availability rate forecast to be flat and net rental rates forecast to rise 2.2%.
Although the improving Canadian manufacturing outlook, weaker Canadian dollar, and
strengthening U.S. economy support the industrial sector, we have yet to see a
material improvement in fundamentals.
Figure 63: Industrial fundamentals (2014-2016E)
Source: CBRE Limited, Canaccord Genuity
Retail
Retail fundamentals were challenged by the departure of Target and store closures of
a number of other retailers including Future Shop, Mexx, and Jacob. According to
CBRE, only 30-40% of the space vacated by Target was backfilled as at October 2015,
which was much lower than CBRE’s initial expectations. We highlight Cominar REIT,
H&R REIT, Morguard REIT, and RioCan REIT as REITs that had material exposure to
the Target leases.
Additionally, online sales continue to take market share away from bricks and mortar
retailers. At mid-year 2015, the retail vacancy rate was 4.0%, up 50 bps from year-end
2014 (CBRE data). Looking ahead, CBRE expects some downward pressure on rental
0%
2%
4%
6%
8%
10%
(10)
(5)
-
5
10
15
20
25
Q2
20
02
Q4
20
02
Q2
20
03
Q4
20
03
Q2
20
04
Q4
20
04
Q2
20
05
Q4
20
05
Q2
20
06
Q4
20
06
Q2
20
07
Q4
20
07
Q2
20
08
Q4
20
08
Q2
20
09
Q4
20
09
Q2
20
10
Q4
20
10
Q2
20
11
Q4
20
11
Q2
20
12
Q4
20
12
Q2
20
13
Q4
20
13
Q2
20
14
Q4
20
14
Q2
20
15
Ava
ila
bilit
y ra
te
Millio
n s
qu
are
fe
et
Absorption (LHS) Under construction (LHS) Availability rate (RHS)
$6.09
$6.45
$6.59
5.4%
5.8% 5.8%
4.0%
4.4%
4.8%
5.2%
5.6%
6.0%
$5.80
$6.00
$6.20
$6.40
$6.60
$6.80
2014 2015E 2016E
Ava
ila
bilit
y ra
te
Ne
t re
nta
l ra
te (
$ p
sf)
Net rental rate (LHS) Availibility rate (RHS)
Real Estate Investment TrustsIndustry Overview
6 January 2016 52

52
rates although vacancy should not exceed 5.5%. We believe some retail REITs will
struggle to generate internal growth in the near term until the vacancies are re-filled.
Residential
According to CMHC’s Fall 2015 Rental Market Report, the national rental apartment
vacancy rate rose 50 bps year-over-year to 3.3% at October 2015 from 2.8% at
October 2014. Further, rental rate growth slowed to +2.0% year-over-year in October
2015, compared to +3.9% in the year-ago period. While fundamentals have noticeably
softened, we note that there is a clear bifurcation geographically. Residential
fundamentals in British Columbia and Ontario remain healthy, whereas fundamentals
in Alberta and Saskatchewan have deteriorated significantly.
Figure 64: The national rental apartment vacancy rate is trending higher
Source: Canada Mortgage and Housing Corporation, Canaccord Genuity
In Vancouver, demand for rental apartments remained healthy on the back of
strong employment and positive net migration to the city. According to CMHC,
rental rates grew +4.3% year-over-year in October 2015, higher than the national
average growth rate of +2.9%. Also, the vacancy rate continued to decline and
was just 0.8% at October 2015, down 20 bps year-over-year.
In Toronto, rental market fundamentals remained stable as an increase in
population especially amongst the younger age groups that are more likely to rent,
coupled with a decrease in the affordability of house ownership, led to continued
demand for rental apartments. This was partly offset by increased supply in rental
condominiums. According to CMHC, the vacancy rate remained unchanged at
1.6% and year-over-year rental rate growth was +3.4% in October 2015.
In Alberta, rental demand has been negatively impacted by job losses in the
energy industry and lower net migration. As a result, fundamentals have softened
considerably and to a much greater extent than was initially forecast by CMHC in
its Q4/15 Housing Market Outlook:
In Calgary, the vacancy rate increased from 1.4% at October 2014 to 5.3% at
October 2015. Rental rate growth was essentially flat year-over year at +0.8%
in October 2015, which is a significant departure from the +6.4% year-over-
year growth rate observed in October 2014.
In Edmonton, the rental apartment vacancy rate increased to 4.2% in October
2015 from 1.7% in October 2014. The pace of rental growth slowed
considerably with the average rental rate rising +2.2% year-over-year as at
1.6%
1.1%
1.7%
2.2%
2.7% 2.7%2.6% 2.6%
2.2%
2.8%2.6%
2.2%
2.6%2.7% 2.8%
3.3%
0.0%
1.0%
2.0%
3.0%
4.0%
2000 2001 2002 2003 2004 2005 2006 2007 2008 2009 2010 2011 2012 2013 2014 2015
Real Estate Investment TrustsIndustry Overview
6 January 2016 53

53
October 2015, compared to the +6.1% year-over-year growth posted in
October 2014.
In Montreal, fundamentals weakened slightly due to lower net migration as well as
stiffer competition from rental condominiums. According to CMHC, the vacancy
rate increased from 3.4% at October 2014 to 4.0% at October 2015 and rental
rates grew +1.8% over the same period. On a same-property basis, however,
rental rates remained unchanged year-over-year, suggesting that the rise in
overall rental rates was a function of the new supply.
In Halifax, the rental apartment vacancy rate unexpectedly decreased to 3.4% at
October 2015 from 3.8% in the year-ago period. Previously, CMHC had been
forecasting a rise in the vacancy rate to 4.1% due to the completion of 1,250
rental apartment units, the second largest annual increase in the past 20 years
(according to CMHC). However the market has been boosted by migratory gains as
fewer people are moving to Western Canada. Further, the aging population has
been fueling demand for rental apartments.
Rental rate growth in Halifax was +4.3% year-over-year, although this was mostly
due to newly constructed apartment buildings which carry higher rents. On a
same-property basis, the growth was a more modest +1.7%.
Figure 65: Vacancy rate trends in major markets across Canada
Source: Canada Mortgage and Housing Corporation, Canaccord Genuity
Lodging
Since hotels have substantial operating leverage, in an environment where lodging
fundamentals are improving there is an outsized positive impact on net income and
cash flows. Currently, the weak Canadian dollar is resulting in higher travel within and
to Canada, driving higher demand for accommodation. Moreover, the economic
recovery in the U.S. remains very supportive of lodging fundamentals, and key hotel
operating metrics such as occupancy, average daily rate (ADR), and revenue per
available room (RevPAR) are forecast by PwC and PKF Consulting to improve further.
Canadian lodging operating metrics forecast to surpass previous highs in 2016
According to PKF Consulting, fundamentals for the Canadian lodging sector are
forecast to improve significantly, as illustrated in Figure 66:
Occupancy is anticipated to increase to 65% in 2016, up 100 bps from 64% in
2015 and up 600 bps from a low of 58% in 2009;
1.0%
1.7%
1.4%
3.4%3.0%
1.6%
2.6%
3.4%
9.0%
3.8%
2.8%
0.8%
4.2%
5.3%
6.5%
5.4%
1.6%
3.4%
4.0%
8.5%
3.4% 3.3%
0.0%
2.0%
4.0%
6.0%
8.0%
10.0%
Vancouver Edmonton Calgary Saskatoon Regina Toronto Ottawa Montreal Saint John Halifax Canada
Oct-14 Oct-15
Real Estate Investment TrustsIndustry Overview
6 January 2016 54

54
ADR is forecast to increase from $143 in 2015 to $146 in 2016 (4.4% year-over-
year increase in 2015 and 2.1% year-over-year increase in 2016); and,
RevPAR is forecast to increase from $91 in 2015 to $96 in 2016 (year-over-year
increase of 3.4% in 2015 and 5.5% in 2016), up from the pre-recessionary high of
$83 in 2007 and 2008.
Figure 66: Occupancy, ADR, and RevPAR for the Canadian lodging sector
Source: PKF Consulting, Canaccord Genuity
U.S. lodging metrics to chart new highs
Lodging fundamentals in the U.S. have improved considerably since 2010, and
looking ahead, hotel fundamentals are forecast to maintain the positive trajectory in
2016, according to PwC’s Hospitality Directions U.S. (November 2015), as illustrated
in Figure 67:
Occupancy is expected to remain flat at 65.6% in 2016 (up 240 bps from a pre-
recession high of 63.2% in 2006), after a 120 bp increase in 2015 to 65.6% from
64.4% in 2014.
ADR is forecast to increase to US$127 in 2016, a 5.8% increase from US$120 in
2015.
RevPAR is forecast to increase to US$83 in 2016, a 5.1% increase from US$79 in
2015.
Figure 67: Occupancy, ADR, and RevPAR for the U.S. lodging sector (US$)
Source: PwC Hospitality Directions U.S., November 2015, Canaccord Genuity
$7
3
$7
5 $8
0
$8
3
$8
3
$7
3
$7
7
$7
8
$8
0
$8
3 $8
8
$9
1 $9
6
$1
17
$1
19 $1
24
$1
27
$1
31
$1
25
$1
28
$1
27
$1
29
$1
33
$1
37
$1
43
$1
46
62% 63%65% 65% 63%
58%60% 61% 62%
63% 64% 64% 65%
0%
10%
20%
30%
40%
50%
60%
70%
$0
$20
$40
$60
$80
$100
$120
$140
$160
2004 2005 2006 2007 2008 2009 2010 2011 2012 2013 2014 2015F 2016F
RevPAR (LHS) ADR (LHS) Occupancy (RHS)
$5
3
$5
7
$6
2
$6
6
$6
4
$5
4
$5
6
$6
1
$6
5
$6
8 $7
4 $7
9
$8
3
$8
6 $9
1 $9
8
$1
04
$1
07
$9
8
$9
8
$1
02
$1
06
$1
10
$1
15
$1
20
$1
27
61.3%63.0% 63.2% 62.8% 59.8%
54.6%
57.6% 60.0% 61.4% 62.2%64.4% 65.6% 65.6%
0.0%
10.0%
20.0%
30.0%
40.0%
50.0%
60.0%
70.0%
$0
$20
$40
$60
$80
$100
$120
$140
20
04
20
05
20
06
20
07
20
08
20
09
20
10
20
11
20
12
20
13
20
14
20
15
F
20
16
F
RevPAR (LHS) ADR (LHS) Occupancy (RHS)
Real Estate Investment TrustsIndustry Overview
6 January 2016 55

55
Seniors housing
Long-term fundamentals in the seniors housing sector are trending positively. Demand
from the baby boomer generation should increase over the coming years and further
drive vacancy lower. Over the last four years, the seniors population in Canada has
increased at a CAGR of +4.4% as compared to the overall population growth rate of
+1.1%. Reflecting the healthy fundamentals, over the first nine months of 2015
Chartwell Retirement Residences posted a 140 bp year-over-year increase in its
weighted average same-property occupancy rate.
Figure 68: Seniors population in Canada is growing
Source: Statistics Canada, Canaccord Genuity
Not surprisingly, there has been increased investment interest in the seniors housing
sector with some significant transactions occurring in 2015, including:
The sale of Regal Lifestyle Communities Inc. to Welltower Inc. and Revera, Inc. for
$764 million (6.1% cap rate);
The sale of Amica Mature Lifestyles Inc. to Baybridge Seniors Housing Inc. for
$578 million; and,
Over $587 million of announced or completed acquisitions of seniors housing
assets by Chartwell Retirement Residences since the beginning of Q3/15.
According to CBRE, cap rates for high quality seniors housing assets declined by 75-
100 bps in 2015 with average cap rates currently in the sub-7% range.
5.0 5.25.4
5.65.8
14.4%14.9%
15.3%15.7%
16.1%
0.0%
2.0%
4.0%
6.0%
8.0%
10.0%
12.0%
14.0%
16.0%
18.0%
2.0
3.0
4.0
5.0
6.0
7.0
2011 2012 2013 2014 2015
% o
f to
tal p
op
ula
tio
n
Se
nio
rs p
op
ula
tio
n (
milllio
ns)
Seniors population (65+) Seniors population (% of total population)
Real Estate Investment TrustsIndustry Overview
6 January 2016 56

Appendix: Important Disclosures
Analyst CertificationEach authoring analyst of Canaccord Genuity whose name appears on the front page of this research hereby certifies that (i) therecommendations and opinions expressed in this research accurately reflect the authoring analyst’s personal, independent andobjective views about any and all of the designated investments or relevant issuers discussed herein that are within such authoringanalyst’s coverage universe and (ii) no part of the authoring analyst’s compensation was, is, or will be, directly or indirectly, related to thespecific recommendations or views expressed by the authoring analyst in the research.Analysts employed outside the US are not registered as research analysts with FINRA. These analysts may not be associated persons ofCanaccord Genuity Inc. and therefore may not be subject to the FINRA Rule 2241 and NYSE Rule 472 restrictions on communicationswith a subject company, public appearances and trading securities held by a research analyst account.Compendium ReportThis report covers six or more subject companies and therefore is a compendium report and Canaccord Genuity and itsaffiliated companies hereby direct the reader to the specific disclosures related to the subject companies discussed in thisreport, which may be obtained at the following website (provided as a hyperlink if this report is being read electronically) http://disclosures.canaccordgenuity.com/EN/Pages/default.aspx; or by sending a request to Canaccord Genuity Corp. Research, Attn:Disclosures, P.O. Box 10337 Pacific Centre, 2200-609 Granville Street, Vancouver, BC, Canada V7Y 1H2; or by sending a requestby email to [email protected]. The reader may also obtain a copy of Canaccord Genuity’s policies and proceduresregarding the dissemination of research by following the steps outlined above.
Distribution of Ratings:Global Stock Ratings (as of 01/06/16)Rating Coverage Universe IB Clients
# % %Buy 585 62.63% 31.79%Hold 261 27.94% 13.03%Sell 30 3.21% 3.33%Speculative Buy 58 6.21% 58.62%
934* 100.0%*Total includes stocks that are Under ReviewCanaccord Genuity Ratings SystemBUY: The stock is expected to generate risk-adjusted returns of over 10% during the next 12 months.
HOLD: The stock is expected to generate risk-adjusted returns of 0-10% during the next 12 months.
SELL: The stock is expected to generate negative risk-adjusted returns during the next 12 months.
NOT RATED: Canaccord Genuity does not provide research coverage of the relevant issuer.“Risk-adjusted return” refers to the expected return in relation to the amount of risk associated with the designated investment or therelevant issuer.Risk QualifierSPECULATIVE: Stocks bear significantly higher risk that typically cannot be valued by normal fundamental criteria. Investments in thestock may result in material loss.General Disclosures“Canaccord Genuity” is the business name used by certain wholly owned subsidiaries of Canaccord Genuity Group Inc., includingCanaccord Genuity Inc., Canaccord Genuity Limited, Canaccord Genuity Corp., and Canaccord Genuity (Australia) Limited, an affiliatedcompany that is 50%-owned by Canaccord Genuity Group Inc.The authoring analysts who are responsible for the preparation of this research are employed by Canaccord Genuity Corp. a Canadianbroker-dealer with principal offices located in Vancouver, Calgary, Toronto, Montreal, or Canaccord Genuity Inc., a US broker-dealerwith principal offices located in New York, Boston, San Francisco and Houston, or Canaccord Genuity Limited., a UK broker-dealer withprincipal offices located in London (UK) and Dublin (Ireland), or Canaccord Genuity (Australia) Limited, an Australian broker-dealer withprincipal offices located in Sydney and Melbourne.The authoring analysts who are responsible for the preparation of this research have received (or will receive) compensation based upon(among other factors) the Corporate Finance/Investment Banking revenues and general profits of Canaccord Genuity. However, such
Real Estate Investment TrustsIndustry Overview
6 January 2016 57

authoring analysts have not received, and will not receive, compensation that is directly based upon or linked to one or more specificCorporate Finance/Investment Banking activities, or to recommendations contained in the research.Canaccord Genuity and its affiliated companies may have a Corporate Finance/Investment Banking or other relationship with the issuerthat is the subject of this research and may trade in any of the designated investments mentioned herein either for their own accountor the accounts of their customers, in good faith or in the normal course of market making. Accordingly, Canaccord Genuity or theiraffiliated companies, principals or employees (other than the authoring analyst(s) who prepared this research) may at any time havea long or short position in any such designated investments, related designated investments or in options, futures or other derivativeinstruments based thereon.Some regulators require that a firm must establish, implement and make available a policy for managing conflicts of interest arising asa result of publication or distribution of research. This research has been prepared in accordance with Canaccord Genuity’s policy onmanaging conflicts of interest, and information barriers or firewalls have been used where appropriate. Canaccord Genuity’s policy isavailable upon request.The information contained in this research has been compiled by Canaccord Genuity from sources believed to be reliable, but (with theexception of the information about Canaccord Genuity) no representation or warranty, express or implied, is made by Canaccord Genuity,its affiliated companies or any other person as to its fairness, accuracy, completeness or correctness. Canaccord Genuity has notindependently verified the facts, assumptions, and estimates contained herein. All estimates, opinions and other information containedin this research constitute Canaccord Genuity’s judgement as of the date of this research, are subject to change without notice and areprovided in good faith but without legal responsibility or liability.Canaccord Genuity’s salespeople, traders, and other professionals may provide oral or written market commentary or trading strategiesto our clients and our proprietary trading desk that reflect opinions that are contrary to the opinions expressed in this research.Canaccord Genuity’s affiliates, principal trading desk, and investing businesses may make investment decisions that are inconsistentwith the recommendations or views expressed in this research.This research is provided for information purposes only and does not constitute an offer or solicitation to buy or sell any designatedinvestments discussed herein in any jurisdiction where such offer or solicitation would be prohibited. As a result, the designatedinvestments discussed in this research may not be eligible for sale in some jurisdictions. This research is not, and under nocircumstances should be construed as, a solicitation to act as a securities broker or dealer in any jurisdiction by any person or companythat is not legally permitted to carry on the business of a securities broker or dealer in that jurisdiction. This material is prepared forgeneral circulation to clients and does not have regard to the investment objectives, financial situation or particular needs of anyparticular person. Investors should obtain advice based on their own individual circumstances before making an investment decision.To the fullest extent permitted by law, none of Canaccord Genuity, its affiliated companies or any other person accepts any liabilitywhatsoever for any direct or consequential loss arising from or relating to any use of the information contained in this research.For Canadian Residents:This research has been approved by Canaccord Genuity Corp., which accepts sole responsibility for this research and its disseminationin Canada. Canaccord Genuity Corp. is registered and regulated by the Investment Industry Regulatory Organization of Canada (IIROC)and is a Member of the Canadian Investor Protection Fund. Canadian clients wishing to effect transactions in any designated investmentdiscussed should do so through a qualified salesperson of Canaccord Genuity Corp. in their particular province or territory.For United States Persons:Canaccord Genuity Inc., a US registered broker-dealer, accepts responsibility for this research and its dissemination in the United States.This research is intended for distribution in the United States only to certain US institutional investors. US clients wishing to effecttransactions in any designated investment discussed should do so through a qualified salesperson of Canaccord Genuity Inc. Analystsemployed outside the US, as specifically indicated elsewhere in this report, are not registered as research analysts with FINRA. Theseanalysts may not be associated persons of Canaccord Genuity Inc. and therefore may not be subject to the FINRA Rule 2241 and NYSERule 472 restrictions on communications with a subject company, public appearances and trading securities held by a research analystaccount.For United Kingdom and European Residents:This research is distributed in the United Kingdom and elsewhere Europe, as third party research by Canaccord Genuity Limited,which is authorized and regulated by the Financial Conduct Authority. This research is for distribution only to persons who are EligibleCounterparties or Professional Clients only and is exempt from the general restrictions in section 21 of the Financial Services andMarkets Act 2000 on the communication of invitations or inducements to engage in investment activity on the grounds that it is beingdistributed in the United Kingdom only to persons of a kind described in Article 19(5) (Investment Professionals) and 49(2) (High NetWorth companies, unincorporated associations etc) of the Financial Services and Markets Act 2000 (Financial Promotion) Order 2005(as amended). It is not intended to be distributed or passed on, directly or indirectly, to any other class of persons. This material is not fordistribution in the United Kingdom or elsewhere in Europe to retail clients, as defined under the rules of the Financial Conduct Authority.For Jersey, Guernsey and Isle of Man Residents:This research is sent to you by Canaccord Genuity Wealth (International) Limited (CGWI) for information purposes and is not to beconstrued as a solicitation or an offer to purchase or sell investments or related financial instruments. This research has been producedby an affiliate of CGWI for circulation to its institutional clients and also CGWI. Its contents have been approved by CGWI and we are
Real Estate Investment TrustsIndustry Overview
6 January 2016 58

providing it to you on the basis that we believe it to be of interest to you. This statement should be read in conjunction with your clientagreement, CGWI's current terms of business and the other disclosures and disclaimers contained within this research. If you are in anydoubt, you should consult your financial adviser.CGWI is licensed and regulated by the Guernsey Financial Services Commission, the Jersey Financial Services Commission and the Isleof Man Financial Supervision Commission. CGWI is registered in Guernsey and is a wholly owned subsidiary of Canaccord Genuity GroupInc.For Australian Residents:This research is distributed in Australia by Canaccord Genuity (Australia) Limited ABN 19 075 071 466 holder of AFS Licence No234666. To the extent that this research contains any advice, this is limited to general advice only. Recipients should take into accounttheir own personal circumstances before making an investment decision. Clients wishing to effect any transactions in any financialproducts discussed in the research should do so through a qualified representative of Canaccord Genuity (Australia) Limited. CanaccordGenuity Wealth Management is a division of Canaccord Genuity (Australia) Limited.For Singapore Residents:This research is distributed pursuant to 32C of the Financial Advisers under an arrangement between each of the Canaccord Genuityentities that publish research and Canaccord Genuity Singapore Pte. Ltd who is an exempt financial adviser under section 23(1)(d) ofthe Financial Advisers Act. This research is only intended for persons who fall within the definition of accredited investor, expert investoror institutional investor as defined under section 4A of the Securities and Futures Act. It is not intended to be distributed or passed on,directly or indirectly, to any other class of persons. Recipients of this report can contact Canaccord Genuity Singapore Pte. Ltd. (ContactTel: +65 6854 6150) in respect of any matters arising from, or in connection with, the research.For Hong Kong Residents:This research is distributed in Hong Kong by Canaccord Genuity (Hong Kong) Limited which is licensed by the Securities and FuturesCommission. This research is only intended for persons who fall within the definition of professional investor as defined in the Securitiesand Futures Ordinance. It is not intended to be distributed or passed on, directly or indirectly, to any other class of persons. Recipients ofthis report can contact Canaccord Genuity (Hong Kong) Limited. (Contact Tel: +852 3919 2561) in respect of any matters arising from, orin connection with, this research.Additional information is available on request.Copyright © Canaccord Genuity Corp. 2016. – Member IIROC/Canadian Investor Protection Fund
Copyright © Canaccord Genuity Limited. – Member LSE, authorized and regulated by the Financial Conduct Authority.
Copyright © Canaccord Genuity Inc. . – Member FINRA/SIPC
Copyright © Canaccord Genuity (Australia) Limited. – Participant of ASX Group, Chi-x Australia and of the NSX. Authorized and regulatedby ASIC.
All rights reserved. All material presented in this document, unless specifically indicated otherwise, is under copyright to CanaccordGenuity Corp., Canaccord Genuity Limited, Canaccord Genuity Inc or Canaccord Genuity Group Inc. None of the material, nor its content,nor any copy of it, may be altered in any way, or transmitted to or distributed to any other party, without the prior express writtenpermission of the entities listed above.
Real Estate Investment TrustsIndustry Overview
6 January 2016 59