Embed Size (px)
Citation preview
INDUSTRY ANALYSIS:
Marine Transportation
December 2012
Sponsored by:

Marine transportation has long been the dominant support of global trade. From its modest origins as Egyptian coastal sail
ships around 3,200 BC to the Spanish galleons that plied across the Atlantic and Pacific oceans between the 15th and 18th
centuries, marine vessels have facilitated the global exchange of goods and paved the establishment of maritime routes that
gave birth to many of the major economic centers that we know today. And as transportation technology evolved over the
years as an industry, marine vessels’ role in global trade has further expanded and continues to integrate markets across
geographies.
Today, the marine transportation industry remains a crucial pillar of the global economy. The importance of maritime trans-
portation can be put into perspective by the fact that almost 90 percent of goods traded across borders are transported
across the oceans and seas of the world.
In the U.S., the marine transportation industry accounts for approximately 80 percent of shipments by weight and 40 percent
by cargo value. Given its strategic importance to international trade, the marine transportation industry is considered the life
blood of the global economy, for without it intercontinental trade of manufactured goods and raw materials would simply
not be possible.
Market Structure. The marine transportation industry consists of companies engaged in marine and inland water transpor-
tation services primarily for freight. The industry includes deep sea freight and cargo, barge, inland water, vessel chartering,
and other freight transportation operations. The marine transportation industry excludes passenger cruise lines, ferry and
fresh water commuter transportation, and recreational charter and sightseeing boat services.
There are basically three large international categories of marine transport companies: (1) tanker companies, which carry
“wet” cargoes that are often energy-related, as in crude oil or liquefied natural gas (LNG), but could also be cooking oil or
a variety of other liquid cargoes; (2) dry-bulk companies, which, as the name implies, carry dry cargoes of a wide variety,
such as grains, scrap metals, coal, or ores; and (3) container companies, which carry anything that can be put into a standard
freight container. There are also some smaller categories, such as companies that operate vessels with a limited geographic
range, such as barges, tugboats and riverboats of various kinds. Other types of ocean-going vessels exist, including roll-on/
roll-off ferries, passenger ships, partial containerships, refrigerated cargo boats, barge carriers, and specialized cargo ships.
It was not until fairly recently that many marine transport companies were publicly traded. Most were privately held, many
of them by Greek, Italian, and Scandinavian owners, frequently multi-generational families. The large U.S. investment banks,
however, discovered shipping companies as major users of capital, and flooded the industry with cash, much of which was
highly leveraged. Investors also see marine transportation as a beneficiary of globalization, as opposed to many industries
that find it hard to compete with companies from low-wage countries. One of the main results has been that there are now a
wide variety of small-cap shipping companies.
Market Leaders. The major global players in the marine transportation industry based on annual revenue as of 2011 are A.P.
Moller-Maersk of Denmark ($60.23 billion), Nippon Yusen Kabushuki Kaisha of Japan ($22.92 billion), Mitsui O.S.K. Lines,
Ltd. of Japan ($18.19 billion), Kuehne & Nagel International AG of Switzerland ($18.33 billion), Kawasaki Kisen Kaisha Ltd. of
Japan ($12.32 billion), and Hanjin Shipping Holdings Co. Ltd. of South Korea ($8.58 billion).
Industry Overview
INDUSTRY ANALYSIS
Marine Transportation
December 2012 | 2

Revenue Drivers. The marine transportation industry tends to follow boom-and-bust patterns. In good times, there is an
over-building of new vessels. This move tends to create an over-supply of carrying capacity that brings rates down. Put sim-
ply, when there are lots of carriers with empty ships, rates drop. When an over-supply persists, rates plunge, causing weaker
companies out of business. This may create an even larger surplus of vessels as fleets are liquidated. Eventually, the drop-off
in new ship production reduces the supply of ships compared to demand, and when demand rises again the mismatch causes
prices to spike.
Cost Structure. Similar to any other transport industry, marine transportation costs are affected by numerous factors and
vary according to the size of the vessel and distances. The marine transportation industry is both labor- and capital-inten-
sive, with the principal expenses being the costs and maintenance of ships, salaries, equipment, and fuel. The costs of ships
are the major fixed cost of this industry, as is the interest paid on the debt to finance these purchases. Labor cost is among the
top expenses, which include ship captains, deck officers or mates, engineers, licensed seamen, oilers, and cooks. Fuel is also
among the largest expenses, which depend on the vessel’s age, size and average distance.
Latest Activities. The global financial crisis in 2007-2009 took its toll on the maritime transportation industry as economies
worldwide deteriorated, consequently slowing down demand for maritime shipments. The industry initially felt the brunt of
the financial crisis in 2008 when global revenue fell 1.7 percent to $340.4 billion from 2007’s $346.3 billion. It was in 2009,
however, when the industry hit an all-time low as it saw its revenue slid by as much as 12.1 percent to $299.3 billion. The con-
traction in industry revenue was due to decreased seaborne trade volumes amid contraction in export volumes as a result
of drop in demand for consumer goods and slowdown in industrial production in major world economies. The industry was
also affected by low energy demand in the oil trade sector, primarily from the developed nations. Oil demand fell sharply in
Japan and the U.S., thereby affecting the global demand for oil. Given the seaborne trade volumes, prices of new marine ves-
sels have fallen dramatically. Prices of brand-new, generic dry-bulk carrier, for example, have fallen to as low as $30 million.
At the top of the market, buyers paid almost $100 million for a similar ship. The prices of used ships have likewise plummeted
by as much as 60 percent.
In 2010, global seaborne trade bounced back reporting an increase in general cargo and coal transport. Industry revenue in
2010 reportedly reached $376.9 billion, representing a compound annual growth rate (CAGR) of 0.6 percent between 2006
and 2010. This is a significant increase from the revenue reported in 2009.
In 2011, global industry revenue exceeded the $400-billion mark and is expected to increase further to reach $511.8 billion by
the end of 2015. Growth will be driven by developing countries in the Asia-Pacific region encouraged by continued industrial
development, expansion in commercial operations of business organizations, and increase in trade activities. Developments
in China are particularly noteworthy with regard to the supply of and demand for ships and shipping services. On the de-
mand side, Chinese containerized exports make up a quarter of the world total. On the supply side, Chinese shipping com-
panies are among the fastest growing. Between 2008 and 2009, China overtook Germany as the third largest ship-owning
country, Japan as the No. 2 shipbuilding country, and India as the busiest ship recycling country. Aside from China, India and
the Middle East are expected to offer immense opportunities fuelled by population growth, rising urbanization, economic
growth, increasing cargo hubs, deregulation, and rising inter-regional trade. Architectural improvements in container ships
for superior maneuverability on bendy rivers on the world’s major shipping lanes and ports, also bodes well for maritime
transportation.
December 2012 | 3
INDUSTRY ANALYSIS
Marine Transportation
Global issues from world trade, to terrorism, to climate change, and environmental issues, impact the marine transportation
industry. Challenges and threats, amid trends and opportunities follow:
• Emerging Economies Shift Marine Routes – Economic development of emerging countries has led to the shifting of
marine routes, which are no longer just Transatlantic but also South-South. Moreover, the industry is witnessing a
major concentration around Asia. Trade between Africa and China has also increased, as demonstrated by the strategy
of the Chinese shipping agents China Ocean Shipping Company and CSCL China Shipping Container Lines. Africa is
also reinforcing its links with South America (i.e. Angola-Brazil and Senegal-Brazil). Moreover, the expansion of South–
South trade, enabled by more South–South investments, also helped boost the import demand of developing countries
as new markets that offer goods at more competitive prices become accessible (e.g. growth in container trade from
China to West Africa to the detriment of Europe). This trend is likely to continue and vary with shifting patterns of com-
parative advantages (e.g. higher labor costs in China as compared with other emerging economies in Asia and Africa).
The construction of megaports, which feature large container terminal facilities and advanced port infrastructure for
docking and storage, in emerging economies also illustrate the heightened profile of Asia, Latin America, and Africa in
terms of global trade.
•
• Increasing oil consumption in emerging economies is also influencing marine routes, with China and India emerging
as major oil importers, and West Africa and more recently Brazil with its latest offshore oil finds, as growing major ex-
porters. These developments are already altering the patterns of shipping globally, and trends in oil trade are shifting,
as illustrated by growth in tanker ton-mile demand. In 2010, oil tanker demand measured in ton-miles was estimated
to have grown by 2.2 percent after declining by 1.9 per cent in 2009. Much of the said demand came from China with
its oil demand expanding by an impressive 10.4 percent in 2010. In 2011, China was one of the few major economies to
continue trafficking in Iranian oil, helping support tanker traffic.
•
• Climate Change Opens New Marine Routes – The melting of the Arctic ice triggered by climate change could open up
new marine routes (northwest and northeast passages). Projections of sea ice loss suggest that the Arctic Ocean will
likely be free of summer sea ice sometime between 2060 and 2080, while another estimate puts this date at 2030. The
melting of the Arctic ice would ease maritime travel as this would lessen the need of going through the Suez Canal in
Egypt or the Panama Canal in Panama. Traversing the Arctic region, for example, will be 7,000 kilometers (km) less to
ship goods from China to Europe, and 3,000 km less from the German port of Hamburg to Vancouver on the Pacific
coast of Canada. These shortened journeys will cut fuel and shipping costs dramatically, which will consequently lower
down international trading costs. For instance, transporting a shipping container from Yokohama in Japan to northern
Europe through Alaska’s Aleutian Islands in the Arctic region will only cost about $500, while moving the same con-
tainer between the same points through the Suez Canal in Egypt costs about $1,500.
•
• The economic viability of this new route, however, implies the resolution of problems of sovereignty between the Arctic
countries and the international community. The five Arctic coastal states – Canada, Denmark (of which Greenland is a
territory), Norway, Russia, and the U.S. – are in the process of preparing Arctic territorial claims for submission to the
Commission on the Limits of the Continental Shelf. The Russian claim to the enormous underwater Lomonosov Ridge,
if accepted, would reportedly grant Russia nearly one-half of the Arctic area. There are also four other unresolved Arctic
territorial disputes.
December 2012 | 4
Industry Trends
INDUSTRY ANALYSIS
Marine Transportation
• Maritime Piracy Continues to Threaten Industry – Piracy in the high seas have now moved from the Asian region to
Somalia in East Africa, and more recently to the western African region in the Gulf of Guinea. Of the 439 piracy attacks
recorded by the International Maritime Bureau (IMB) in 2011, 275 took place off Somalia on the east coast and in the Gulf
of Guinea on the west coast of Africa. According to the IMB, Somali pirate attacks were predominantly concentrated
within the cross roads of the Arabian Sea and the Gulf of Aden. However, 2011 marked the first hijacking by Somali
pirates of an anchored vessel from within the territorial waters of a foreign State – namely, Oman – highlighting the
need for ports and vessels at anchorages in the region to be vigilant. The IMB also noted an increase in piracy incidence
Nigeria and Benin as continuing piracy hotspots, with 10 attacks reported in Nigeria, including two hijackings. The IMB
warned that this number is not representative of the real threat of Nigeria piracy. Underreporting of attacks in Nigeria
continues to be a cause for concern, and IMB states that it is aware of at least another 34 unreported incidents in Nige-
rian waters.
•
• In order to guarantee the security of supplies, operators have not hesitated to reconsider certain traditional passages
like the Suez Canal. Diverting marine routes can limit the risks of exposure to piracy, but can generate significant ad-
ditional costs: according to the latest report by the African Development Bank, if one third of the ships coming from Asia
sailed around Africa via the Cape of Good Hope, additional costs relating to the extended journey to Europe would stand
at about $7.5 billion per year. Moreover, pirate attacks are moving away from the coast into international waters, which
is encouraging operators to consider sailing at over 300 miles from the shore, in areas with no established sovereignty.
It then becomes difficult for States to prevent acts of piracy in international waters. That being said, the European Union
(Operation Atlanta), the North Atlantic Treaty Organization (Operation Ocean Shield), and the U.S. (Combined Task
Force 151 in the Indian Ocean) are attempting to provide defensive solutions to these problems. These solutions will
likely remain in force, given the prospective scenarios envisaged: the number of acts of piracy could double by 2016, at
a total cost of between $13 billion and $15 billion as of 2014.
•
• Europe Debt Crisis Affects Industry – The debt crisis in Europe has forced many banks to shed dollar-denominated as-
sets such as ship and trade finance loans to meet tougher capital rules imposed on euro zone lenders. This development
has led to tighter bank financing and is forcing many industry players to find alternate sources of funding.
•
• In a recent survey conducted by international law firm Norton Rose, 42 percent of respondents from the marine trans-
portation industry said a lack of finance was the greatest threat to their businesses. UniCredit, Italy’s largest bank by
assets, is scaling down its ship financing operations to boost its capital reserves. Media reports have also indicated that
Lloyds Banking Group aimed to sell its $10 billion portfolio of shipping loans. France’s two biggest listed banks, Societe
Generale and BNP Paribas, also plan to exit or shrink non-core businesses such as shipping, according to bank memos.
In response to the credit squeeze, industry players are turning to other sources for fill the funding gap. In the same sur-
vey conducted by Norton Rose, almost a third of respondents in the survey, 31 percent, expected their primary source
of funding over the next two years to come from private equity, and 18 percent said it would come from export credit
agencies. Nevertheless, 43 percent still expected their primary source of funding to come from bank debt over the next
two years. The survey also found 55 percent believed their key priority was to maintain cash reserves and secure fund-
ing lines, with 56 percent planning joint ventures or mergers over the coming year.
•
• The total financing required by the marine transportation industry over the next two years is expected to be around
$130 billion to $150 billion according to investment bank Standard Chartered. And with European banks becoming more
risk averse due to the debt crisis in the region, European industry players are likely to suffer a considerable funding gap.
December 2012 | 5
INDUSTRY ANALYSIS
Marine Transportation
December 2012 | 6
• Environmental Impact – Although marine transportation is considered to be among the most environment friendly
means of shipping goods, the industry still finds itself a subject of environmental issues. Recent oil spills have prompted
the European Union (EU) to speed up the phase-out of single hull tankers, just one year after a prior agreement with the
International Maritime Organization (IMO), and the IMO followed under EU pressure. These new rules create an op-
portunity for owners of double hull tankers, but mostly represent an additional expense for industry players. New IMO
regulations for managing ballast water, responsible for spreading invasive species, will bring substantial new costs for
the industry. New IMO emissions standards have taken effect, but newer EU and California proposals will likely tighten
standards and cause multiple standards for a greater number of areas.
•
• The marine industry has established a bi-national, voluntary program called Green Marine that aims to improve partici-
pants’ environmental performance beyond regulatory compliance. Participants are taking concrete actions to improve
their record in eight key environmental areas. Their results are independently verified by a third party and shared pub-
licly to demonstrate their commitment to the environment. In October 2011, the Royal Bank of Canada and the Supply
Chain & Logistics Association of Canada released a report that identifies environmental sustainability as a key issue
faced by the country. The report highlighted environmental sustainability issues within the shipping, air, road, rail and
truck transportation industries, and how distribution and transportation companies can enhance competitiveness in an
increasingly global business environment. In terms of marine transportation, the report praised the shipping sector for
its ability to mass transport goods with substantial energy efficiency.
•
• However, the marine mode as a whole still has a significant environmental impact. Marine transport uses heavier fuels
which emit more sulphur oxides, nitrogen oxides and particulate matter when burned. International marine shipping,
along with aviation are the only two industries not covered by the 1997 Kyoto Protocol because their greenhouse gas
emissions (GHG) cannot be pinned down to a particular country. The report added that despite no emission-reduction
targets, industry players are proactively working together for a cleaner marine mode to minimize other emissions and
to prepare for potential future GHG regulation. Among the shipping industry’s self-regulation efforts is the Emissions
Control Area that will be implemented in North America in 2012. The report added that shipping companies such as
Maersk Line have introduced new ships which are able to cut GHG emissions by 50 percent. The report is the second in
a series aimed at helping leaders of Canadian organizations better understand the risks and benefit from the business
opportunities presented by the environmental sustainability challenge.
•
• Technological Innovations – Today’s marine transportation companies operate in an era exemplified by advances in
technology, automation, and software. On the Maritime Management System organizational front, two trends are wor-
thy of note: process approach and management system integration. A process approach to compliance, standards, and
maintenance is exemplified by process ownership and organization of information based on company-defined themes
that reference requirements in a matrix. Process ownership is assigned to a specific individual and differentiated from
organizational responsibility by department or title. When combined with a process approach, adaptive management
system integration allows a single management system structure to handle multiple requirements such as regulatory,
standards, maintenance and training. This eliminates the need for separate systems. This also provides maritime com-
panies with a framework that scales to meet new requirements.
INDUSTRY ANALYSIS
Marine Transportation
December 2012 | 7
• The emergence of a National Electrical Manufacturers Association (NEMA) based “black box” is also expected to have an
impact on maritime maintenance management and planning. This technology can be utilized to collect engine related
data from sensors and send this information to a software management system. The display of these data may be via the
onboard Vessel Management System viewed on a vessel-based desktop, laptop, tablet, or smart phone, or in hardcopy.
Data may also be managed by Port Engineers on a web-based shore-side portal for planned maintenance activities.
Through this system human entry error stemming from pen, and paper based logs may be reduced by automating the
data flow to a software system. Other technological trends in the industry include cloud-based and interactive Maritime
Management System software that allow marine transportation companies to customize systems according to their
needs and operations and adapt with changing business needs in the industry.
•
• Free Trade Agreements to Benefit Industry – The surge of free trade agreements (FTAs) has been beneficial to the
marine transportation industry. As of November 2011, there have been some 505 regional FTAs, counting goods and
services notifications separately, according to the World Trade Organization (WTO). In the U.S. three FTAs have been
ratified in 2011 – Colombia, Panama, and South Korea. The South Korea deal, the biggest for the U.S. since the North
American Free Trade Agreement in 1994, removes duties on almost two-thirds of American farm exports, and phases
out tariffs on more than 95 percent of industrial and consumer exports within five years. The establishment of these
FTAs is expected to increase international movement of cargo and shipments, which will consequently drive the need
to expand transportation capacity, benefitting players in the marine transportation industry.
•
• Mergers & Acquisitions – Players in the marine transportation industry have long utilized mergers and acquisitions as a
means to expand and rationalize business operations, create significant economies of scale, reduce costs, and minimize
financial risks. M&As also offer strategic advantages for players who intend to establish their presence in a business
segment they may not already have a presence in. Below are some of the most notable M&A deals in the marine trans-
portation industry in 2012:
- In July 2012, LNG shipping company Golar LNG said it will sell its interests in the Nusantara Regas Satu floating
storage and re-gasification unit (FSRU) to its subsidiary Golar LNG Partners LP for $385 million.
- In July 2012, China’s Mingde Heavy Industries has signed an agreement with U.S.-based Cambridge Energy Group
to jointly develop liquefied natural gas vessels. Both companies plan to build up to five LNG carriers with options
for four more.
- In June 2012, Norwegian oil and gas company Statoil ASA said it has signed a deal to buy a floating production,
storage and offloading unit from Maersk for an undisclosed figure.
- In May 2012, Dutch shipbuilding firm Damen Shipyards has acquired the shares of Swedish ship repair and main-
tenance yard Oskarshamnsvarvet in Oskarshamn for an undisclosed sum.
- In May 2012, Bulk Handling USA, an affiliate of Oiltanking Holding Americas, has signed an agreement to acquire
US United Bulk Terminal (UBT), a subsidiary of United Maritime Group (UMG). The aggregate purchase price is
expected to be about $215 million in cash.
- In April 2012, Damen Shipyards has acquired French ship repair yard Sobrena as part of its long-term strategy to
expand its repair services. Damen has not disclosed the value of the transaction.
- In February 2012, Russia’s United Shipbuilding (USC) has acquired 79.33 percent of the Vyborg shipbuilding plant
in the country’s north-west for $61.8 million.
INDUSTRY ANALYSIS
Marine Transportation
The information in this section covers a broader industry than the rest of this report.
Global issues and trends affect the marine industry, encompassing globalization of world economies, new security measures
to combat terrorism, and new environmental regulations. These issues create business initiatives that industry players must
consider for growth and survival. Pursuing, and not pursuing, these initiatives come with risks to companies in the industry.
Business initiatives for the marine industry fall across four areas: strategy, service and support, compliance, and financial
management. Strategy business initiatives refer to new methods used by some marine companies that reduce the industry’s
reliance on high fixed costs and will lead to further consolidation. They also stress the importance of serving clients globally,
leading to global expansion and partnerships.
Service and support initiatives explain necessary reforms to pricing strategies and improved uses of technology in order for
the industry to become more flexible and serve its customers better. Compliance initiatives outline lobbying efforts needed
to help mold future regulations, both security and environmental, and stress the importance of complying with these regula-
tions. Financial management business initiatives refer to the importance of keeping fixed costs under control, and to have an
active currency-hedging program in an industry that deals with multiple currencies.
The marine industry is a cyclical industry, relying on the state of the global economy. In order for industry players to stabilize
revenue and earnings, companies need to reduce their reliance on high fixed costs. Companies can achieve this by leasing
more ships and outsourcing more ground-handling services. But more importantly, they can change their business models
to become complete distribution services companies, performing customs brokerage, freight forwarding, logistics, and sup-
ply chain management.
Large companies are more likely to benefit from these measures to reduce fixed cost reliance, and utilize modern manage-
ment techniques to view revenue on a risk-adjusted basis, leading to new pricing strategies for contracts that serve custom-
ers better and share risks with customers. Newly consolidated companies are using their professional skills as a competitive
advantage in this fragmented industry. Opportunities for further acquisitions exist, and it will become necessary for some
small companies to become acquired in order to survive. Economies of scale that come with size will become more impor-
tant as the high costs of security and environmental regulations continue to grow.
Globalization is a fact of life, and world trade will only continue to grow as markets continue to open with free trade agree-
ments and WTO negotiations. Companies need to provide shipping services worldwide to serve the global needs of their
clients. The only way to economically provide this complete global service is through partnerships and alliances to help fill
in geographic holes. Alliances also help to complete boatloads for shipping routes, as opposed to two companies shipping
half boatloads for the same route.
The marine industry is by nature a global business. Shipping companies often have owners from one country, headquarters
in a second, are flagged in a third, and ship to many other countries. Having a global mindset is critical for this industry. Many
of the acquisition opportunities are dispersed around the world, and expanding to global locations should be part of global
strategies. Opening routes to global ports is also part of a global expansion strategy.
December 2012 | 8
Business Initiatives and Risks
Strategy
INDUSTRY ANALYSIS
Marine Transportation
Components of Strategy business initiatives include:
• Redefine the business model;
• Pursue growth through acquisitions;
• Pursue growth through partnerships and alliances; and
• Pursue growth through global expansion.
The following tables outline risks associated with these Strategy business initiatives.
December 2012 | 9
Strategic Operational
• Ineffectivebusinessmodel/positioningstrategy• Newdistributioninitiativeresultsinchannelconflicts• Newgeographicinitiativeleadstoregulatoryandpolitical
exposures• Internationalinitiativeleadstoexpropriationandcurrencyand
convertibilityrisks• Failureofacquisitions,jointventures,oralliances• Liabilityassumedbycontract
• Businessinitiativefailsfromlackofqualifiedhumancapital• Inefficientoperationsrenderinitiativeunprofitable• Oversizedoverheadrendersinitiativeunprofitable• Liabilityassumedbycontract• Theft/fraudbyemployees
Financial Hazard
• Infrequentdebtmaturitystructure,dueinlargeamounts• Currencyfluctuationscauseearningsvolatilityinhomecurrency• Counterpartydefaultonsettlements• Inadequatecashflowtosupportdailyoperations• Lowbankborrowingcapacity/inadequatelinesofcredit• Off-balancesheetliabilitiesandcommitmentslargerthan
expected• Interestraterisecausesincreasedcostofcapital• Highdemandelasticityofunitsales• Highlyleveragedcapitalstructurecausesburdensomeinterest
paymentsordefault
• Lawsuitsarisingfromcontractdisputes• Lawsuitsarisingfromperformanceornon-performanceof
professionalservices• Lawsuitsbyshareholdersarisingfromerrorsoromissionsof
directorsorofficers
Many large companies in the marine industry are viewing revenue from a risk-adjusted basis, and are finding that many
contracts that appeared to be lucrative are not when considering the inherent risk that the company is assuming. Industry
players need to change their relationship with customers by changing their pricing strategies offered in contracts. For ex-
ample, companies can offer discounts for customers that agree to a minimum space guarantee, in effect having a penalty
for no-shows. Companies could also offer a discount for shipments they can interrupt, effectively making a premium for
shipments that must not be interrupted. Furthermore, marine shipping companies need to use information technology that
both improves efficiency and provides more information to customers. The former would improve on-time arrivals and the
latter can provide customers with more control over their shipments. These initiatives will serve clients’ needs better and
help share the risk of certain contracts.
Components of the Service and Support business initiative include:
• Develop and improve customer relationship management programs; and
• Implement technology to improve the efficiency and effectiveness of customer service areas.
Service and Support
INDUSTRY ANALYSIS
Marine Transportation
The following tables outline risks associated with the Service and Support business initiative.
December 2012 | 10
Strategic Operational
• Newproduct/servicefailsinthemarket• Ineffectivebusinessmodel/positioningstrategy• Businessinitiativedamagescompany’sreputation• Inadequateorineffectualallocationofresources• Liabilityassumedbycontract
• Businessinitiativefailsfromlackofqualifiedhumancapital• Inefficientoperationsrenderinitiativeunprofitable• Customersatisfactionsuffersfrompoorserviceandsupport• Breakdowninsupplychaincauseproduction/serviceirregularities• Inadequateinformationprocessingsystemscreateinefficiencies
Financial Hazard
• Counterpartydefaultonsettlements• Inadequatecashflowtosupportdailyoperations• Lowbankborrowingcapacity/inadequatelinesofcredit• Highdemandelasticityofunitsales
• Lawsuitsarisingfromcontractdisputes• Lawsuitsbyshareholdersarisingfromerrorsoromissionsofdirectors
orofficers
ComplianceThe marine industry needs to lobby international organizations such as the WTO and IMO, governments such as the U.S., and
economic unions such as the E.U., in order to ensure that legislation and regulation are in line with industry realities. Free
trade is important to increase demand for marine services, and lobbying the WTO and governments is essential to ensure the
continued opening of markets and to keep shipping a relatively open global service. Terrorism and piracy present security
issues that need to be handled. These regulations can benefit the industry by creating safer shipping facilities and ships, but
regulations need to be realistic and workable. Furthermore, the marine industry needs governments and the U.N. to take ac-
tion against pirates to help reduce this threat.
Environmental regulations, such as requirements for double hull tanker use and ballast water management systems are
expensive, but are here to stay. The industry needs to lobby the IMO, the E.U., and governments to create reasonable require-
ments. Furthermore, lobbying efforts should focus on encouraging ports of refuge for distressed ships, which will signifi-
cantly lessen the environmental damage, and litigation, resulting from accidents.
Influencing new regulations are not enough. Complying with these regulations is also imperative. Failure to follow security
regulations and certain environmental regulations can result in denial of entry, delaying delivery of shipments. Furthermore,
failure to comply with environmental regulations that result in accidents can cause a large litigation liability. Regulations can
and often do differ between countries and regions, and with U.N. agreements, which makes complying with these regulations
complicated. Professional compliance reviews and empowered officers are necessary to diligently follow such regulations.
Companies need to have security procedures that go beyond IMO requirements in order to protect themselves from piracy
and terrorism.
Components of Compliance business initiatives include:
• Lobby governments to achieve desired regulatory outcomes; and
• Review compliance procedures to ensure compliance to regulations.
INDUSTRY ANALYSIS
Marine Transportation
December 2012 | 11
The following tables outline risks associated with these Compliance business initiatives.
Strategic Operational
• Businessinitiativedamagescompany’sreputation• Newgeographicinitiativeleadstoregulatoryand
politicalexposures• Inadequateorineffectualallocationofresources• Liabilityassumedbycontract
• Businessinitiativefailsfromlackofqualifiedhumancapital• Inefficientoperationsrenderinitiativeunprofitable• Inadequatesupportcauseproducts/servicestofail• Inadequateproductioncapacitytosupportinitiative• Customersatisfactionsuffersfrompoorserviceandsupport• Breakdowninsupplychaincauseproduction/serviceirregularities• Complianceproceduresbreakdowncreatesliabilityexposure• Lackoftrainingcausesmisuseofcompanyassets• Breakdownofinternalcontrols
Financial Hazard
• Declineincreditrating• Inadequatecashflowtosupportdailyoperations• Lowbankborrowingcapacity/inadequatelinesof
credit• Off-balancesheetliabilitiesandcommitments
largerthanexpected
• Facilities,equipment,dataorinventorydamagedordestroyedbyfire,explosionorcatastrophe
• Goodsdamagedintransit• Workersinjuredduringcourseofemployment• Theft,robberyorfraudbythirdparties• Lawsuitsarisingfromperformanceornon-performanceofprofessional
services• Lawsuitsarisingfromemployment-relatedactivities• Lawsuitsbyshareholdersarisingfromerrorsoromissionsofdirectorsor
officers• Lawsuitsarisingfromstorage,transportationordisposalofhazardous
substances
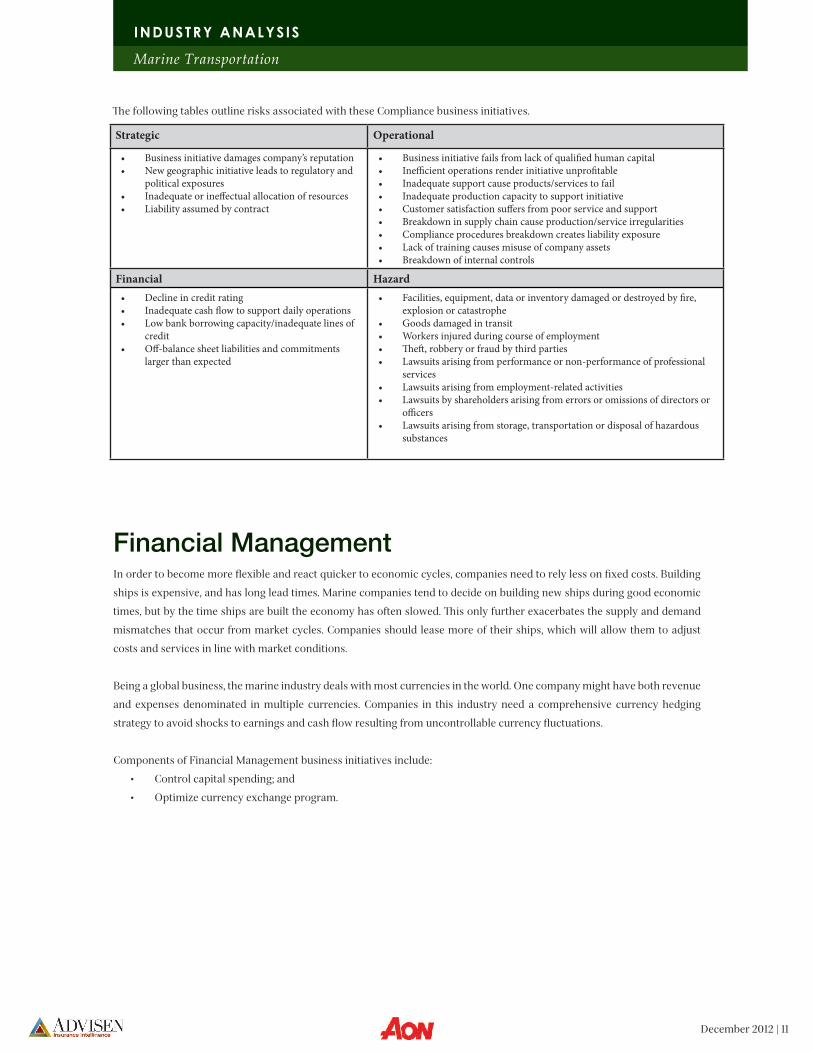
Financial ManagementIn order to become more flexible and react quicker to economic cycles, companies need to rely less on fixed costs. Building
ships is expensive, and has long lead times. Marine companies tend to decide on building new ships during good economic
times, but by the time ships are built the economy has often slowed. This only further exacerbates the supply and demand
mismatches that occur from market cycles. Companies should lease more of their ships, which will allow them to adjust
costs and services in line with market conditions.
Being a global business, the marine industry deals with most currencies in the world. One company might have both revenue
and expenses denominated in multiple currencies. Companies in this industry need a comprehensive currency hedging
strategy to avoid shocks to earnings and cash flow resulting from uncontrollable currency fluctuations.
Components of Financial Management business initiatives include:
• Control capital spending; and
• Optimize currency exchange program.
INDUSTRY ANALYSIS
Marine Transportation
December 2012 | 12
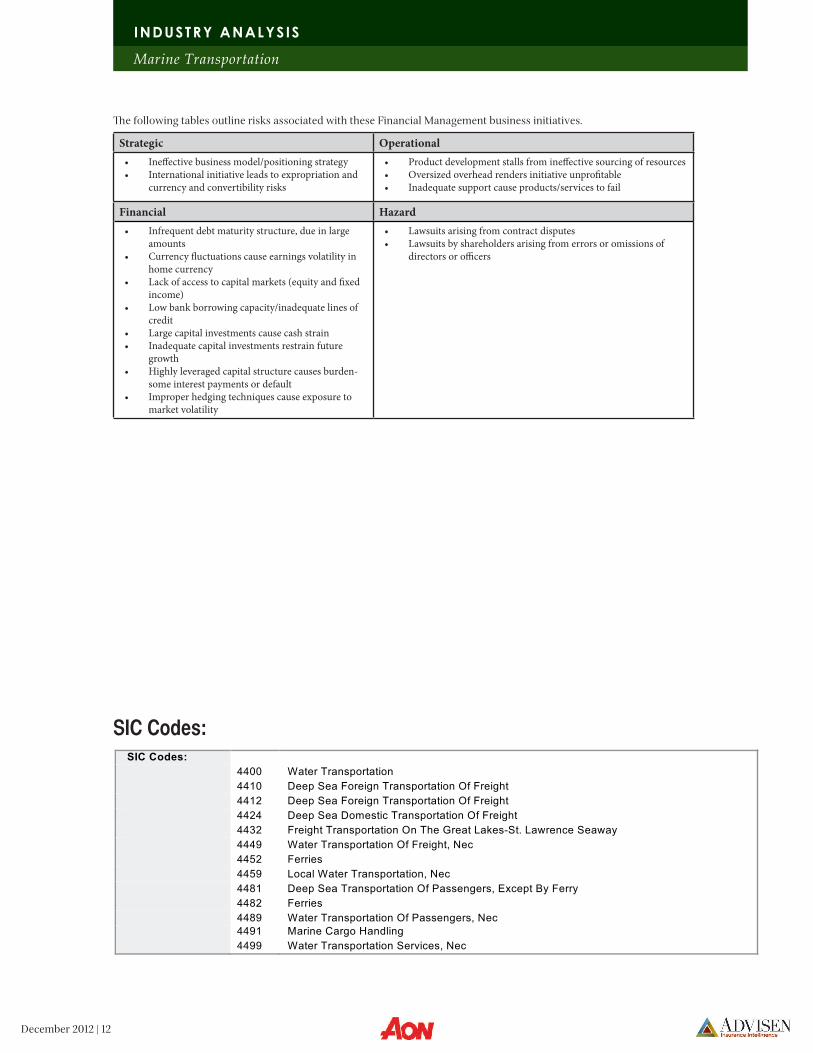
The following tables outline risks associated with these Financial Management business initiatives.
Strategic Operational
• Ineffectivebusinessmodel/positioningstrategy• Internationalinitiativeleadstoexpropriationand
currencyandconvertibilityrisks
• Productdevelopmentstallsfromineffectivesourcingofresources• Oversizedoverheadrendersinitiativeunprofitable• Inadequatesupportcauseproducts/servicestofail
Financial Hazard
• Infrequentdebtmaturitystructure,dueinlargeamounts
• Currencyfluctuationscauseearningsvolatilityinhomecurrency
• Lackofaccesstocapitalmarkets(equityandfixedincome)
• Lowbankborrowingcapacity/inadequatelinesofcredit
• Largecapitalinvestmentscausecashstrain• Inadequatecapitalinvestmentsrestrainfuture
growth• Highlyleveragedcapitalstructurecausesburden-
someinterestpaymentsordefault• Improperhedgingtechniquescauseexposureto
marketvolatility
• Lawsuitsarisingfromcontractdisputes• Lawsuitsbyshareholdersarisingfromerrorsoromissionsof
directorsorofficers
SIC Codes: SIC Codes:
4400 Water Transportation
4410 Deep Sea Foreign Transportation Of Freight
4412 Deep Sea Foreign Transportation Of Freight
4424 Deep Sea Domestic Transportation Of Freight
4432 Freight Transportation On The Great Lakes-St. Lawrence Seaway
4449 Water Transportation Of Freight, Nec
4452 Ferries
4459 Local Water Transportation, Nec
4481 Deep Sea Transportation Of Passengers, Except By Ferry
4482 Ferries
4489 Water Transportation Of Passengers, Nec
4491 Marine Cargo Handling
4499 Water Transportation Services, Nec
INDUSTRY ANALYSIS
Marine Transportation
December 2012 | 13
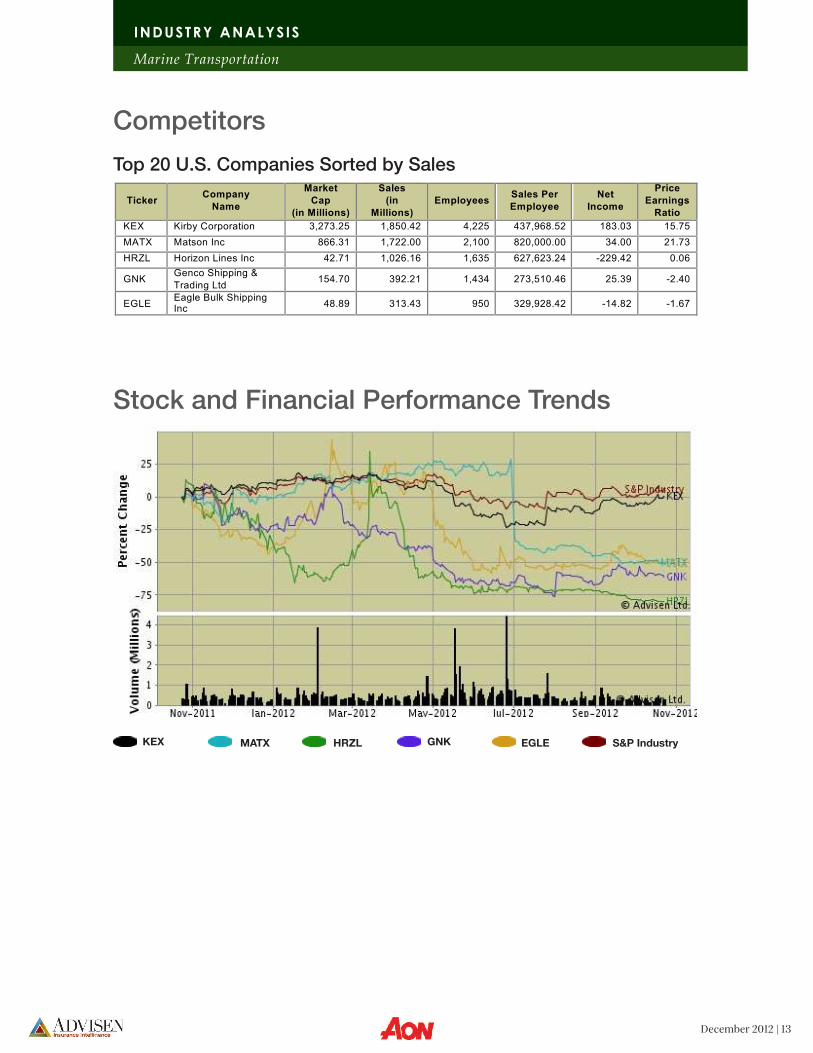
Competitors
Stock and Financial Performance Trends
Top 20 U.S. Companies Sorted by Sales
KEX MATX HRZL GNK EGLE S&P Industry
Ticker Company
Name
Market
Cap
(in Millions)
Sales
(in
Millions) Employees
Sales Per
Employee Net
Income
Price
Earnings
Ratio KEX Kirby Corporation 3,273.25 1,850.42 4,225 437,968.52 183.03 15.75
MATX Matson Inc 866.31 1,722.00 2,100 820,000.00 34.00 21.73
HRZL Horizon Lines Inc 42.71 1,026.16 1,635 627,623.24 -229.42 0.06
GNK Genco Shipping &
Trading Ltd 154.70 392.21 1,434 273,510.46 25.39 -2.40
EGLE Eagle Bulk Shipping Inc
48.89 313.43 950 329,928.42 -14.82 -1.67
INDUSTRY ANALYSIS
Marine Transportation
December 2012 | 14
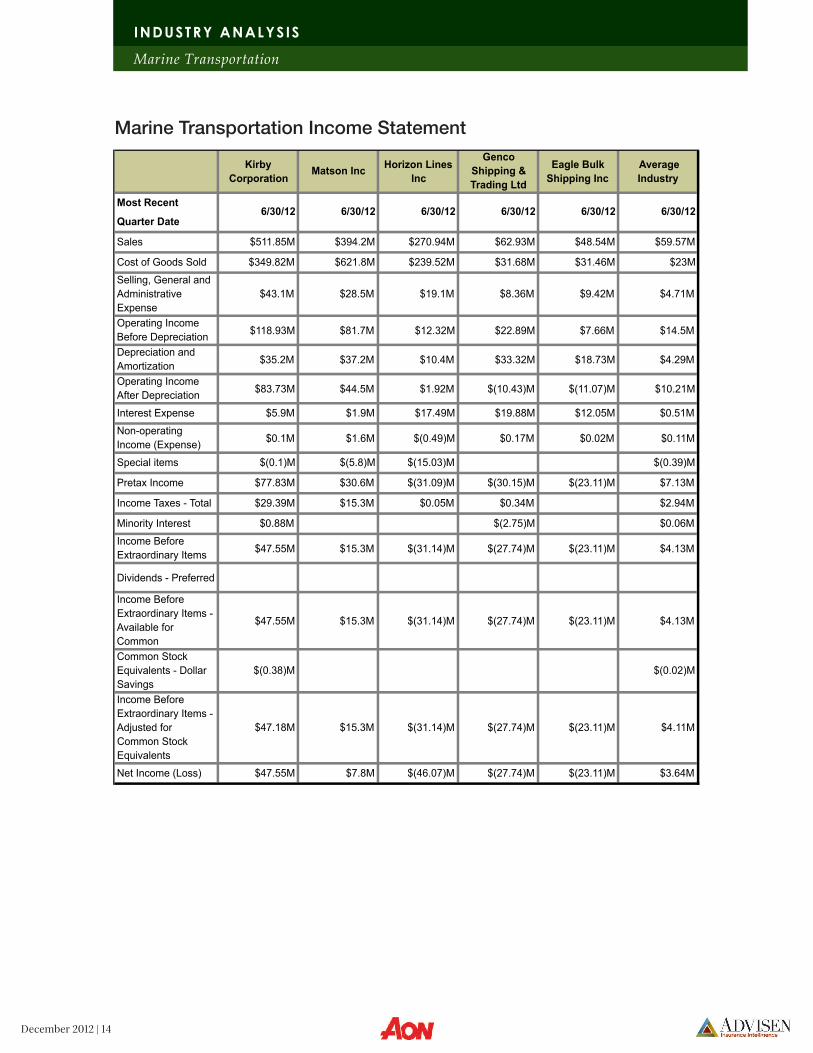
Marine Transportation Income Statement
Kirby
CorporationMatson Inc
Horizon Lines
Inc
Genco
Shipping &
Trading Ltd
Eagle Bulk
Shipping Inc
Average
Industry
Most Recent
Quarter Date
Sales $511.85M $394.2M $270.94M $62.93M $48.54M $59.57M
Cost of Goods Sold $349.82M $621.8M $239.52M $31.68M $31.46M $23M
Selling, General and
Administrative
Expense
$43.1M $28.5M $19.1M $8.36M $9.42M $4.71M
Operating Income
Before Depreciation$118.93M $81.7M $12.32M $22.89M $7.66M $14.5M
Depreciation and
Amortization$35.2M $37.2M $10.4M $33.32M $18.73M $4.29M
Operating Income
After Depreciation$83.73M $44.5M $1.92M $(10.43)M $(11.07)M $10.21M
Interest Expense $5.9M $1.9M $17.49M $19.88M $12.05M $0.51M
Non-operating
Income (Expense)$0.1M $1.6M $(0.49)M $0.17M $0.02M $0.11M
Special items $(0.1)M $(5.8)M $(15.03)M $(0.39)M
Pretax Income $77.83M $30.6M $(31.09)M $(30.15)M $(23.11)M $7.13M
Income Taxes - Total $29.39M $15.3M $0.05M $0.34M $2.94M
Minority Interest $0.88M $(2.75)M $0.06M
Income Before
Extraordinary Items$47.55M $15.3M $(31.14)M $(27.74)M $(23.11)M $4.13M
Dividends - Preferred
Income Before
Extraordinary Items -
Available for
Common
$47.55M $15.3M $(31.14)M $(27.74)M $(23.11)M $4.13M
Common Stock
Equivalents - Dollar
Savings
$(0.38)M $(0.02)M
Income Before
Extraordinary Items -
Adjusted for
Common Stock
Equivalents
$47.18M $15.3M $(31.14)M $(27.74)M $(23.11)M $4.11M
Net Income (Loss) $47.55M $7.8M $(46.07)M $(27.74)M $(23.11)M $3.64M
6/30/12 6/30/12 6/30/12 6/30/12 6/30/12 6/30/12
INDUSTRY ANALYSIS
Marine Transportation
December 2012 | 15
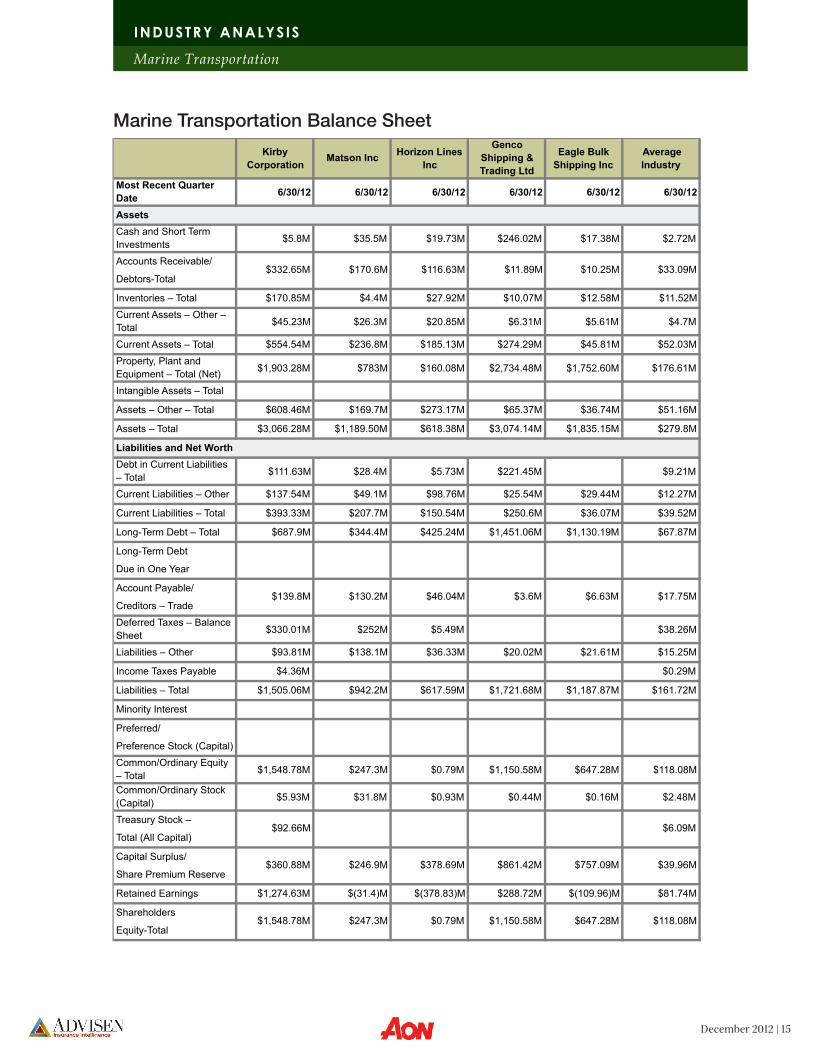
Marine Transportation Balance Sheet
INDUSTRY ANALYSIS
Marine Transportation
Kirby
CorporationMatson Inc
Horizon Lines
Inc
Genco
Shipping &
Trading Ltd
Eagle Bulk
Shipping Inc
Average
Industry
Most Recent Quarter
Date6/30/12 6/30/12 6/30/12 6/30/12 6/30/12 6/30/12
Cash and Short Term
Investments$5.8M $35.5M $19.73M $246.02M $17.38M $2.72M
Accounts Receivable/
Debtors-Total
Inventories – Total $170.85M $4.4M $27.92M $10.07M $12.58M $11.52M
Current Assets – Other –
Total$45.23M $26.3M $20.85M $6.31M $5.61M $4.7M
Current Assets – Total $554.54M $236.8M $185.13M $274.29M $45.81M $52.03M
Property, Plant and
Equipment – Total (Net)$1,903.28M $783M $160.08M $2,734.48M $1,752.60M $176.61M
Intangible Assets – Total
Assets – Other – Total $608.46M $169.7M $273.17M $65.37M $36.74M $51.16M
Assets – Total $3,066.28M $1,189.50M $618.38M $3,074.14M $1,835.15M $279.8M
Debt in Current Liabilities
– Total$111.63M $28.4M $5.73M $221.45M $9.21M
Current Liabilities – Other $137.54M $49.1M $98.76M $25.54M $29.44M $12.27M
Current Liabilities – Total $393.33M $207.7M $150.54M $250.6M $36.07M $39.52M
Long-Term Debt – Total $687.9M $344.4M $425.24M $1,451.06M $1,130.19M $67.87M
Long-Term Debt
Due in One Year
Account Payable/
Creditors – Trade
Deferred Taxes – Balance
Sheet$330.01M $252M $5.49M $38.26M
Liabilities – Other $93.81M $138.1M $36.33M $20.02M $21.61M $15.25M
Income Taxes Payable $4.36M $0.29M
Liabilities – Total $1,505.06M $942.2M $617.59M $1,721.68M $1,187.87M $161.72M
Minority Interest
Preferred/
Preference Stock (Capital) – Total
Common/Ordinary Equity
– Total$1,548.78M $247.3M $0.79M $1,150.58M $647.28M $118.08M
Common/Ordinary Stock
(Capital)$5.93M $31.8M $0.93M $0.44M $0.16M $2.48M
Treasury Stock –
Total (All Capital)
Capital Surplus/
Share Premium Reserve
Retained Earnings $1,274.63M $(31.4)M $(378.83)M $288.72M $(109.96)M $81.74M
Shareholders
Equity-Total$1,548.78M $247.3M $0.79M $1,150.58M $647.28M $118.08M
$360.88M $246.9M $378.69M $861.42M $757.09M $39.96M
$92.66M $6.09M
$139.8M $130.2M $46.04M $3.6M $6.63M $17.75M
Liabilities and Net Worth
Assets
$332.65M $170.6M $116.63M $11.89M $10.25M $33.09M
December 2012 | 16
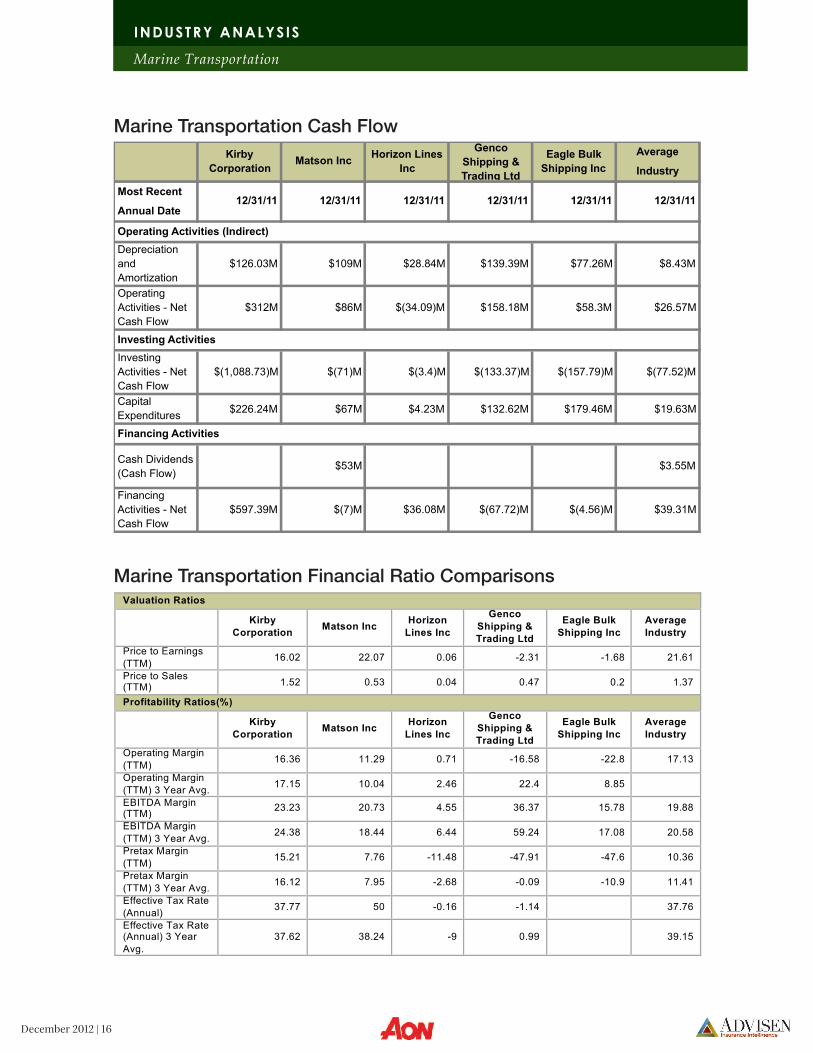
Marine Transportation Cash Flow
Marine Transportation Financial Ratio Comparisons
Average
Industry
Most Recent
Annual Date
Depreciation
and
Amortization
$126.03M $109M $28.84M $139.39M $77.26M $8.43M
Operating
Activities - Net
Cash Flow
$312M $86M $(34.09)M $158.18M $58.3M $26.57M
Investing
Activities - Net
Cash Flow
$(1,088.73)M $(71)M $(3.4)M $(133.37)M $(157.79)M $(77.52)M
Capital
Expenditures$226.24M $67M $4.23M $132.62M $179.46M $19.63M
Cash Dividends
(Cash Flow)$53M $3.55M
Financing
Activities - Net
Cash Flow
$597.39M $(7)M $36.08M $(67.72)M $(4.56)M $39.31M
Operating Activities (Indirect)
Investing Activities
Financing Activities
12/31/11 12/31/11 12/31/11 12/31/11 12/31/11 12/31/11
Kirby
CorporationMatson Inc
Horizon Lines
Inc
Genco
Shipping &
Trading Ltd
Eagle Bulk
Shipping Inc
Valuation Ratios
Kirby
Corporation Matson Inc
Horizon
Lines Inc
Genco
Shipping &
Trading Ltd
Eagle Bulk
Shipping Inc
Average
Industry
Price to Earnings
(TTM) 16.02 22.07 0.06 -2.31 -1.68 21.61
Price to Sales (TTM)
1.52 0.53 0.04 0.47 0.2 1.37
Profitability Ratios(%)
Kirby
Corporation Matson Inc
Horizon
Lines Inc
Genco
Shipping &
Trading Ltd
Eagle Bulk
Shipping Inc
Average
Industry
Operating Margin
(TTM) 16.36 11.29 0.71 -16.58 -22.8 17.13
Operating Margin
(TTM) 3 Year Avg. 17.15 10.04 2.46 22.4 8.85
EBITDA Margin (TTM)
23.23 20.73 4.55 36.37 15.78 19.88
EBITDA Margin
(TTM) 3 Year Avg. 24.38 18.44 6.44 59.24 17.08 20.58
Pretax Margin
(TTM) 15.21 7.76 -11.48 -47.91 -47.6 10.36
Pretax Margin
(TTM) 3 Year Avg. 16.12 7.95 -2.68 -0.09 -10.9 11.41
Effective Tax Rate
(Annual) 37.77 50 -0.16 -1.14 37.76
Effective Tax Rate (Annual) 3 Year
Avg.
37.62 38.24 -9 0.99 39.15
INDUSTRY ANALYSIS
Marine Transportation
December 2012 | 17
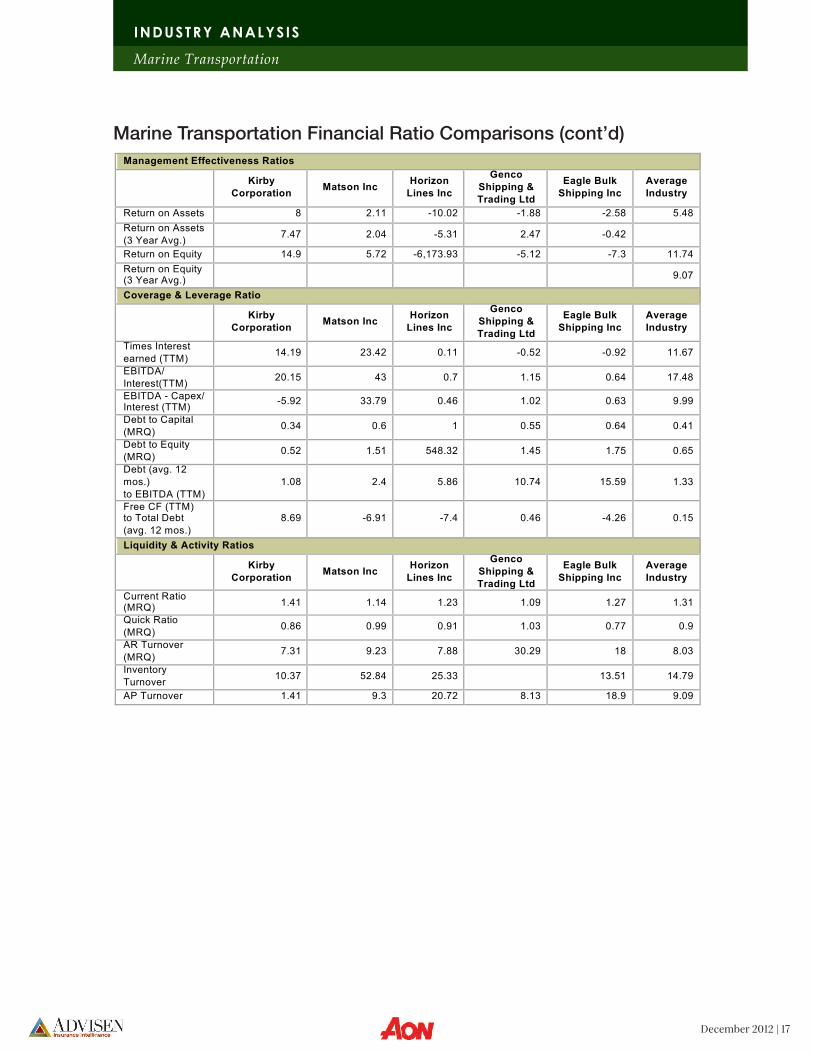
Marine Transportation Financial Ratio Comparisons (cont’d)
Management Effectiveness Ratios
Kirby
Corporation Matson Inc
Horizon
Lines Inc
Genco
Shipping &
Trading Ltd
Eagle Bulk
Shipping Inc
Average
Industry
Return on Assets 8 2.11 -10.02 -1.88 -2.58 5.48
Return on Assets
(3 Year Avg.) 7.47 2.04 -5.31 2.47 -0.42
Return on Equity 14.9 5.72 -6,173.93 -5.12 -7.3 11.74
Return on Equity (3 Year Avg.)
9.07
Coverage & Leverage Ratio
Kirby
Corporation Matson Inc
Horizon
Lines Inc
Genco
Shipping &
Trading Ltd
Eagle Bulk
Shipping Inc
Average
Industry
Times Interest
earned (TTM) 14.19 23.42 0.11 -0.52 -0.92 11.67
EBITDA/
Interest(TTM) 20.15 43 0.7 1.15 0.64 17.48
EBITDA - Capex/ Interest (TTM)
-5.92 33.79 0.46 1.02 0.63 9.99
Debt to Capital
(MRQ) 0.34 0.6 1 0.55 0.64 0.41
Debt to Equity
(MRQ) 0.52 1.51 548.32 1.45 1.75 0.65
Debt (avg. 12
mos.)
to EBITDA (TTM)
1.08 2.4 5.86 10.74 15.59 1.33
Free CF (TTM) to Total Debt
(avg. 12 mos.)
8.69 -6.91 -7.4 0.46 -4.26 0.15
Liquidity & Activity Ratios
Kirby
Corporation Matson Inc
Horizon
Lines Inc
Genco
Shipping &
Trading Ltd
Eagle Bulk
Shipping Inc
Average
Industry
Current Ratio (MRQ)
1.41 1.14 1.23 1.09 1.27 1.31
Quick Ratio
(MRQ) 0.86 0.99 0.91 1.03 0.77 0.9
AR Turnover
(MRQ) 7.31 9.23 7.88 30.29 18 8.03
Inventory
Turnover 10.37 52.84 25.33 13.51 14.79
AP Turnover 1.41 9.3 20.72 8.13 18.9 9.09
INDUSTRY ANALYSIS
Marine Transportation
December 2012 | 18
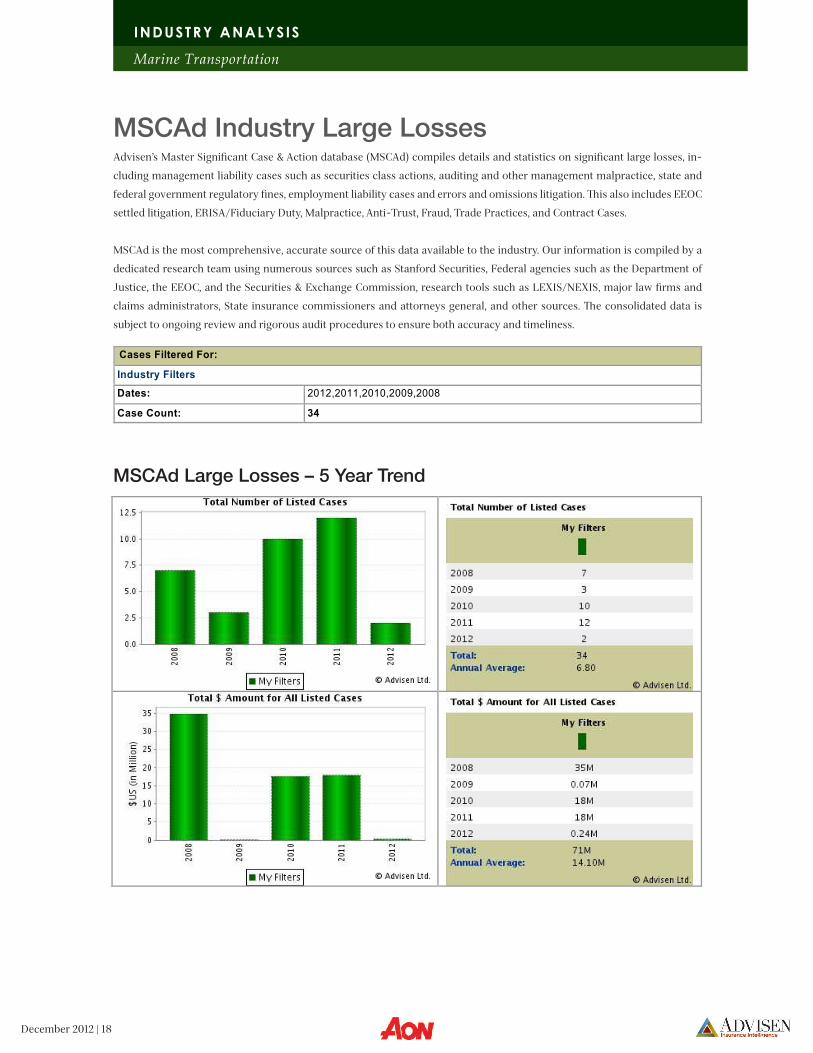
MSCAd Industry Large LossesAdvisen’s Master Significant Case & Action database (MSCAd) compiles details and statistics on significant large losses, in-
cluding management liability cases such as securities class actions, auditing and other management malpractice, state and
federal government regulatory fines, employment liability cases and errors and omissions litigation. This also includes EEOC
settled litigation, ERISA/Fiduciary Duty, Malpractice, Anti-Trust, Fraud, Trade Practices, and Contract Cases.
MSCAd is the most comprehensive, accurate source of this data available to the industry. Our information is compiled by a
dedicated research team using numerous sources such as Stanford Securities, Federal agencies such as the Department of
Justice, the EEOC, and the Securities & Exchange Commission, research tools such as LEXIS/NEXIS, major law firms and
claims administrators, State insurance commissioners and attorneys general, and other sources. The consolidated data is
subject to ongoing review and rigorous audit procedures to ensure both accuracy and timeliness.
Cases Filtered For:
Industry Filters
Dates: 2012,2011,2010,2009,2008
Case Count: 34
MSCAd Large Losses – 5 Year Trend
INDUSTRY ANALYSIS
Marine Transportation
December 2012 | 19
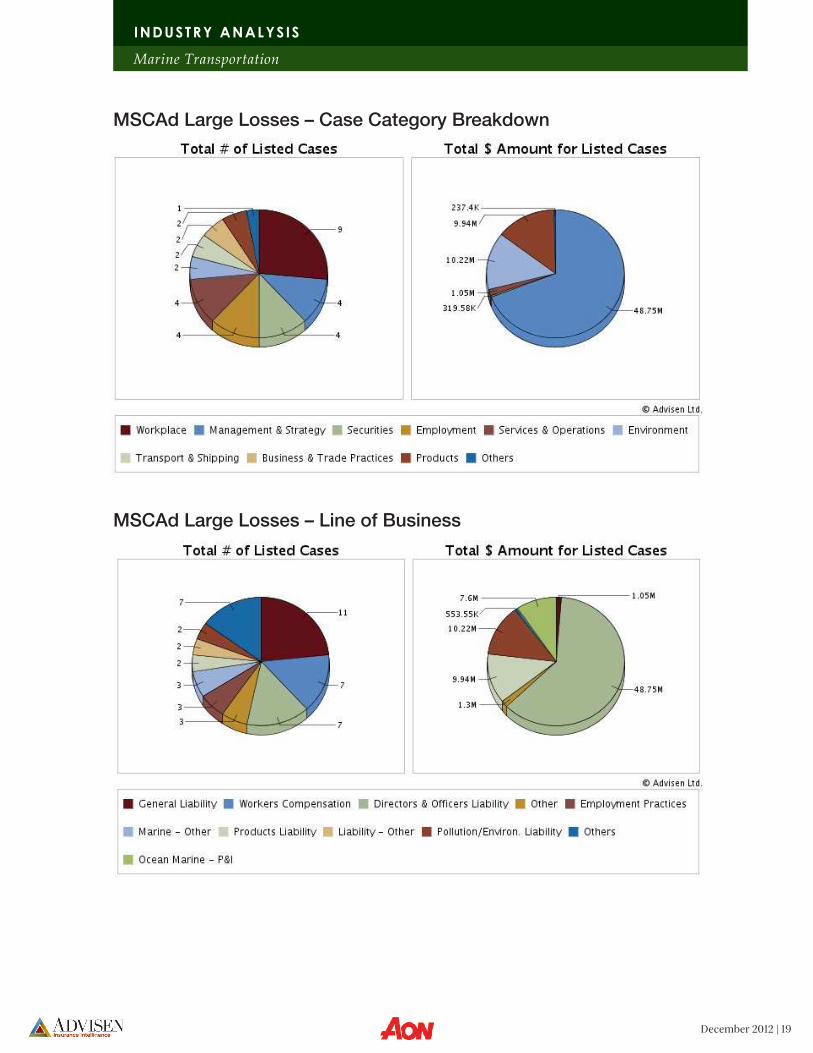
MSCAd Large Losses – Case Category Breakdown
MSCAd Large Losses – Line of Business
INDUSTRY ANALYSIS
Marine Transportation
December 2012 | 20
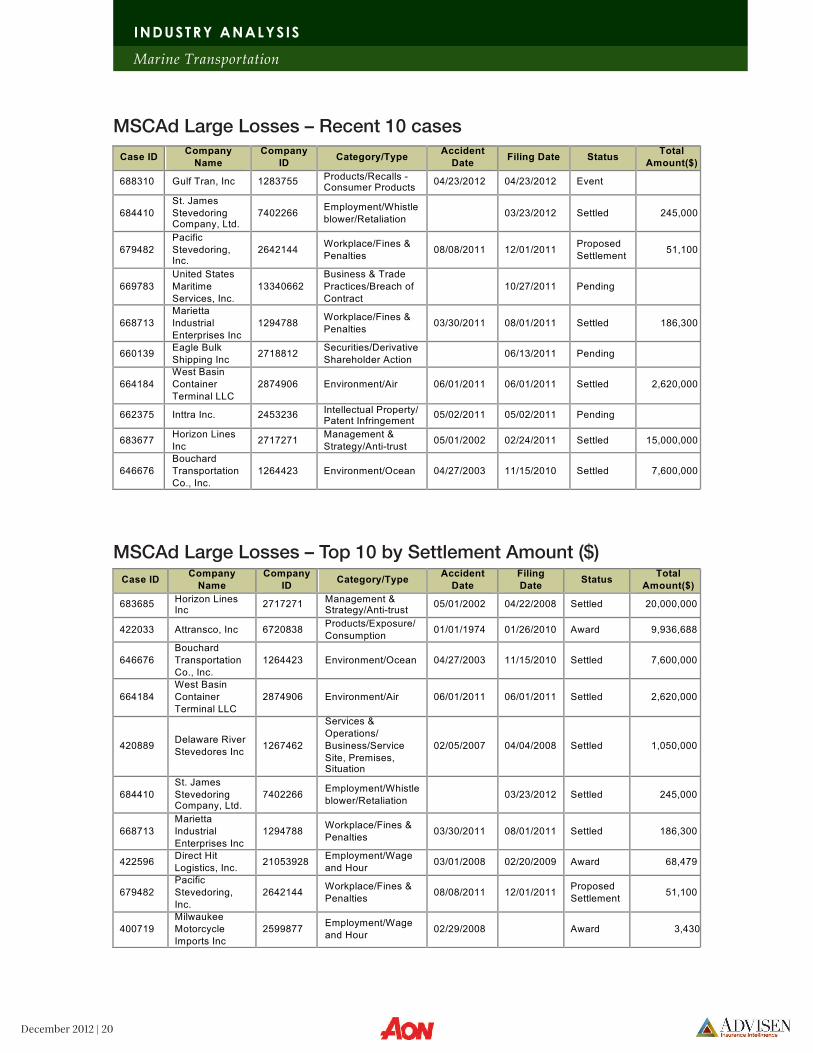
MSCAd Large Losses – Recent 10 cases
MSCAd Large Losses – Top 10 by Settlement Amount ($)
Case ID Company
Name
Company
ID Category/Type
Accident
Date Filing Date Status
Total
Amount($)
688310 Gulf Tran, Inc 1283755 Products/Recalls - Consumer Products
04/23/2012 04/23/2012 Event
684410
St. James
Stevedoring Company, Ltd.
7402266 Employment/Whistle
blower/Retaliation 03/23/2012 Settled 245,000
679482
Pacific
Stevedoring, Inc.
2642144 Workplace/Fines &
Penalties 08/08/2011 12/01/2011
Proposed
Settlement 51,100
669783
United States
Maritime
Services, Inc.
13340662
Business & Trade
Practices/Breach of
Contract
10/27/2011 Pending
668713
Marietta
Industrial
Enterprises Inc
1294788 Workplace/Fines &
Penalties 03/30/2011 08/01/2011 Settled 186,300
660139 Eagle Bulk
Shipping Inc 2718812
Securities/Derivative
Shareholder Action 06/13/2011 Pending
664184
West Basin
Container
Terminal LLC
2874906 Environment/Air 06/01/2011 06/01/2011 Settled 2,620,000
662375 Inttra Inc. 2453236 Intellectual Property/ Patent Infringement
05/02/2011 05/02/2011 Pending
683677 Horizon Lines
Inc 2717271
Management &
Strategy/Anti-trust 05/01/2002 02/24/2011 Settled 15,000,000
646676
Bouchard
Transportation
Co., Inc.
1264423 Environment/Ocean 04/27/2003 11/15/2010 Settled 7,600,000
Case ID Company
Name
Company
ID Category/Type
Accident
Date
Filing
Date Status
Total
Amount($)
683685 Horizon Lines Inc
2717271 Management & Strategy/Anti-trust
05/01/2002 04/22/2008 Settled 20,000,000
422033 Attransco, Inc 6720838 Products/Exposure/
Consumption 01/01/1974 01/26/2010 Award 9,936,688
646676
Bouchard
Transportation
Co., Inc.
1264423 Environment/Ocean 04/27/2003 11/15/2010 Settled 7,600,000
664184
West Basin
Container
Terminal LLC
2874906 Environment/Air 06/01/2011 06/01/2011 Settled 2,620,000
420889 Delaware River
Stevedores Inc 1267462
Services &
Operations/
Business/Service
Site, Premises, Situation
02/05/2007 04/04/2008 Settled 1,050,000
684410
St. James
Stevedoring Company, Ltd.
7402266 Employment/Whistle
blower/Retaliation 03/23/2012 Settled 245,000
668713
Marietta
Industrial
Enterprises Inc
1294788 Workplace/Fines &
Penalties 03/30/2011 08/01/2011 Settled 186,300
422596 Direct Hit
Logistics, Inc. 21053928
Employment/Wage
and Hour 03/01/2008 02/20/2009 Award 68,479
679482
Pacific
Stevedoring,
Inc.
2642144 Workplace/Fines &
Penalties 08/08/2011 12/01/2011
Proposed
Settlement 51,100
400719
Milwaukee
Motorcycle
Imports Inc
2599877 Employment/Wage
and Hour 02/29/2008 Award 3,430
INDUSTRY ANALYSIS
Marine Transportation
December 2012 | 21
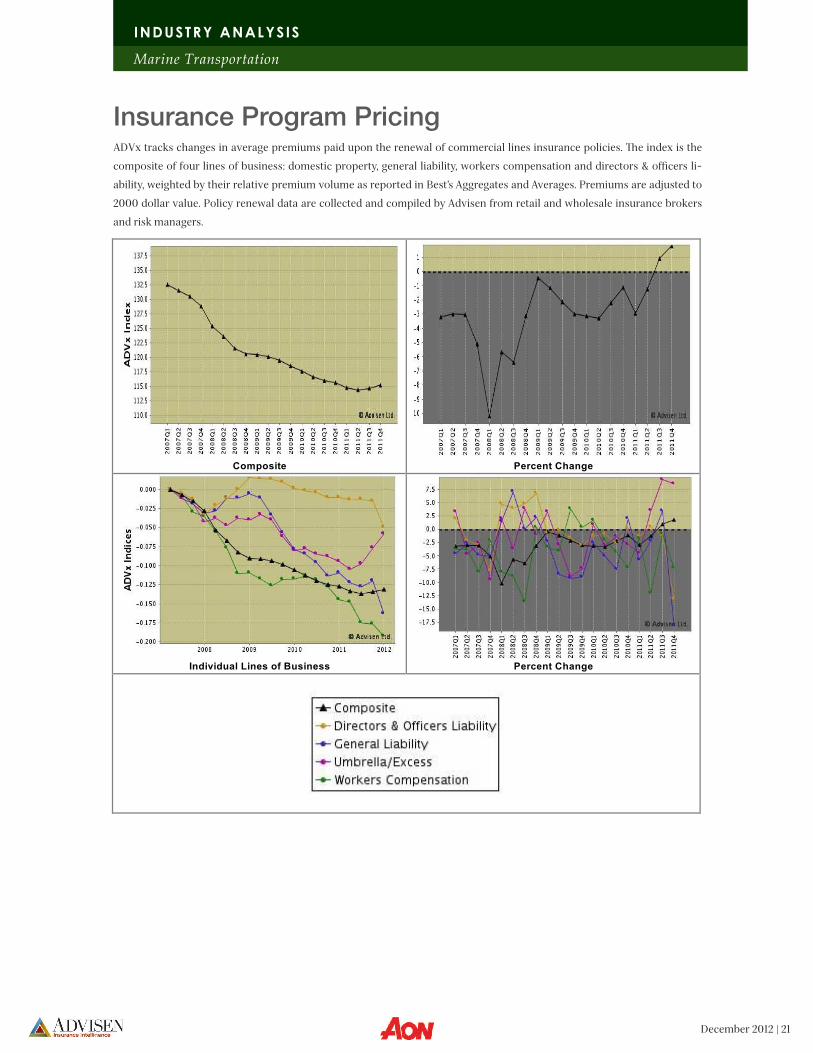
ADVx tracks changes in average premiums paid upon the renewal of commercial lines insurance policies. The index is the
composite of four lines of business: domestic property, general liability, workers compensation and directors & officers li-
ability, weighted by their relative premium volume as reported in Best’s Aggregates and Averages. Premiums are adjusted to
2000 dollar value. Policy renewal data are collected and compiled by Advisen from retail and wholesale insurance brokers
and risk managers.
Insurance Program Pricing
Composite
Percent Change
Individual Lines of Business
Percent Change
INDUSTRY ANALYSIS
Marine Transportation
Recent Industry News of Top 5 Competitors
Kirby Corp Reaffirms Q3 2012 EPS Guidance-Conference Call2012-09-20Kirby Corp reaffirmed its third-quarter 2012 guidance and expects earnings per share (EPS) to be in the range of $0.87 to $0.97. According to I/B/E/S Estimates, analysts are expecting the Company to report EPS of 0.90 for the third quarter of 2012.
Kirby Corp Reaffirms FY 2012 EPS Guidance; Signs Agreement To Acquire Allied Transportation Company2012-09-04Kirby Corp announced that for fiscal 2012, it remains in the $3.50 to $3.70 per share range. According to I/B/E/S Estimates, analysts are expecting the Company to report EPS of $3.64 for fiscal 2012. The Company also announced that it has entered into an agreement to purchase the assets of Allied Transportation Company (Allied), a subsidiary of Allied Marine Industries, and two affiliated companies. The purchase will be financed through Kirby’s revolving credit facility. Kirby received the con-sent and commitment from participating banks to increase its unsecured revolving credit facility from $250 million to $325 million. The closing of the Allied transaction is expected to occur in the late third or early fourth quarter of 2012 and is subject to certain conditions, including expiration of the required waiting period under the Hart-Scott-Rodino Act.
Kirby Corporation Issues Q3 2012 EPS Guidance In Line With Analysts’ Estimates; Raises Low End Of Prior FY 2012 EPS Guidance To A Range In Line With Analysts’ Estimates2012-07-25Kirby Corporation announced that for the third quarter of 2012, it expects earnings per share (EPS) to be in the range of $0.87 to $0.97 per share. For fiscal 2012, it expects earnings per share (EPS) to be in the range of $3.50 to $3.70. According to I/B/E/S Estimates, analysts are expecting the Company to report EPS of 0.90 for the third quarter of 2012; EPS of $3.56 for fiscal 2012.
Alexander & Baldwin Holdings Inc Completes Separation Of Land And Transportation Businesses2012-06-29Alexander & Baldwin Holdings Inc announced that it has completed on June 29, 2012 its previously announced plan to sepa-rate its land and transportation businesses into two stand-alone, publicly traded companies. The land business will operate under the name Alexander & Baldwin, Inc. (A&B) and, beginning on July 2, will trade on the New York Stock Exchange under the ticker symbol ALEX. The transportation business will operate under the name Matson, Inc. (Matson) and, also beginning on July 2, will trade on the New York Stock Exchange under the ticker symbol MATX. Stanley Kuriyama, current president and chief executive officer of Alexander & Baldwin, Inc., will continue in his role as CEO of A&B and will also become its chairman. Matthew Cox, current president of Matson, Inc., will assume the role of Matson’s chief executive officer.
Horizon Lines, Inc. Names Sam Woodward As President And Chief Executive Officer2012-06-07Horizon Lines, Inc. announced that Sam Woodward has joined the Company as President and Chief Executive Officer (CEO) and has been appointed to the Company’s Board of Directors, effective June 7, 2012. Mr. Woodward succeeds Stephen H. Fraser, who has served as interim President and CEO since March 2011, and who will also step down from the Company’s Board of Directors, effective June 7, 2012.
Horizon Lines, Inc. Announces Chairman Change-Form 8-K2012-04-16Horizon Lines, Inc. reported in its Form 8-K that effective April 9, 2012 Mr. Mandl resigned as the Chairman of the Board of the Company, and the Board appointed Jeffrey A. Brodsky as Mr. Mandl’s replacement.
INDUSTRY ANALYSIS
Marine Transportation
December 2012 | 22
Horizon Lines, Inc. Reaches Settlement With Opt Outs In Puerto Rico Antitrust Litigation2011-11-29Horizon Lines, Inc. announced that it has entered into a settlement agreement with all of the remaining significant shippers who opted out of the Puerto Rico direct purchaser antitrust class action settlement. Horizon Lines agreed to settle with these shippers at a total cost to Horizon Lines of $13.75 million in exchange for full release of all antitrust claims. Under the terms of the settlement agreement, Horizon Lines will make a payment of $5.75 million within 10 business days of the November 23, 2011, effective date, a payment of $4.0 million by June 30, 2012, and a final payment of $4.0 million by December 24, 2012. The agreement effectively resolves claims related to class action lawsuits that were filed against Horizon Lines in 2008 on behalf of customers who purchased domestic ocean shipping services from Horizon Lines and other ocean carriers in the Puerto Rico tradelane between May 2002 and April 2008. Horizon Lines entered into a settlement agreement with the class in June 2009, which received final court approval in September 2011. Some shippers opted out of the class settlement, and Horizon has previously announced settlement with a number of them. Today’s announcement resolves claims of all the remaining significant opt outs.
Genco Shipping & Trading Limited Completes Common Stock Offering2012-02-28Genco Shipping & Trading Limited announced that it has successfully completed its previously announced public offer-ing of 7,500,000 shares of newly issued common stock. Gross proceeds of the offering were approximately $53.25 million. Genco intends to use its net proceeds from the offering for general corporate purposes. Morgan Stanley & Co. LLC, Deutsche Bank Securities Inc. and Jefferies & Company, Inc. were joint book-running managers for the offering, and Credit Agricole Securities (USA) Inc., DNB Markets, Inc., DVB Capital Markets LLC, Knight Capital Americas, L.P. and SEB Enskilda were co-managers for the offering.
Genco Shipping & Trading Limited Prices Common Stock Offering2012-02-23Genco Shipping & Trading Limited announced the pricing of its public offering of common stock. The offering was made pursuant to Genco’s registration statement (including a prospectus and related prospectus supplement for the offering). Total gross proceeds from the offering will be approximately $53.25 million, exclusive of any proceeds attributable to the un-derwriters’ possible exercise of their option to purchase shares of common stock described below. The offering is expected to close on February 28, 2012, subject to the satisfaction of customary closing conditions. Genco intends to use the net proceeds from the offering for general corporate purposes. Genco agreed to sell 7,500,000 shares of common stock at a public offer-ing price of $7.10 per share. In connection with the offering, Genco granted the underwriters a 30-day option to purchase up to an additional 1,125,000 shares of common stock. Morgan Stanley & Co. LLC, Deutsche Bank Securities Inc. and Jefferies & Company, Inc. are acting as joint book-running managers for the offering, and Credit Agricole Securities (USA) Inc., DNB Markets, Inc., DVB Capital Markets LLC, Knight Capital Americas, L.P. and SEB Enskilda are acting as co-managers for the offering.
Genco Shipping & Trading Limited Announces Common Stock Offering2012-02-22Genco Shipping & Trading Limited announced that it has commenced a public offering of common stock. Genco plans to of-fer, subject to market and other conditions, $50 million in shares of its common stock. Genco intends to use the net proceeds from the offering for general corporate purposes. Genco expects to grant the underwriters 30 day options to purchase up to an additional $7.5 million in shares of common stock offered by Genco. Morgan Stanley and Co. LLC, Deutsche Bank Securi-ties Inc., and Jefferies & Company, Inc. are acting as joint book-running managers for the offering.
Eagle Bulk Shipping Inc. Announces Chief Financial Officer Transition2012-07-11Eagle Bulk Shipping Inc. (the Company) announced that Adir Katzav, formerly Director of Financial Reporting, has been promoted to Chief Financial Officer. Mr. Katzav succeeds Mr. Alan S. Ginsberg, who has advised the Company of his decision to pursue other professional interests. To facilitate an orderly transition, Mr. Ginsberg has agreed to oversee a transition of his responsibilities through mid-August of this year.
INDUSTRY ANALYSIS
Marine Transportation
December 2012 | 23


