Embed Size (px)
Citation preview

___________________________________________________________________________
2013/SCSC/WKSP1/017
Indonesian Experience in Assessing Green Building Performance
Submitted by: Indonesia
Workshop on Sharing Experiences in the Design and Implementation of Green
Building Codes Lima, Peru
5-7 March 2013
3/4/2013
1
Indonesia’s Experience in Assessing Green Building Performance
Name: Totok SulistiyantoCompany: PT. Narama MandiriEmail: [email protected]: ASHRAE, GBCI, FKMHE, IAFBI, PII, KNI‐WEC.
Sharing Experiences in the Design and Implementation of Green Building Codes A Joint APEC-ASEAN Workshop 5-7 March 2013, Lima - Peru
Forestry, Peat, Agriculture
680 million Ton
Energy Sector 30 million TonWastes 48 million Ton
Industry and Transport 9 million Ton
Through new renewable energy development and energy conservation implementation in all
sector
President Commitment in G‐20 Pittsburgh and COP15 to reduce greenhouse gasses emission by 2020
26%(767 Mill. Ton)
41%(1,210 Mill Ton)
Domesticefforts
Domestic efforts and international
support
National Commitment On Reducing GHG
Source: DGNREEC – Ministry of Energy and Mineral Resources, 2012

3/4/2013
2
A. Legal Instruments:Law No. 28 of 2002 concerning BuildingsLaw No. 32 year 2009 on Environmental Protection and ManagementLaw No. 30 year 2007 on EnergyNational Action Plan on GHGs Emission Reduction (Draft of Presidential Regulation on RAN-GRK), Nationally Appropriate Mitigation Actions (NAMAs) of Energy Sector
B. Fiscal Instruments:Incentive for implementation of energy conservation program (Government Regulation No.70/2009 on Energy ConservationExemption of import tax, set-up price and subsidy allocation from fossil energy to newrenewable energy (based on “Green Paper” developed by Ministry of Economy)
C. Institutional Instrument:MEMR as Energy Authority, Permen ESDM No. 12, 13, 14 – 2012Ministry of Environment (including climate change mitigation), Permen LH No. 8 - 2010Ministry of Public WorksRelated institutions, Inpres No. 013 – 2011, Pergub DKI Jakarta No. 38 - 2012Carbon Market Authority
D. Financial Instruments:Unilateral (National/regional government budget, Private sector’s CSR)Donor Countries’ support (Bilateral/Multilateral)Carbon Market (such as. CDM)Green Financing
Policy Instrument
Source: DGNREEC – Ministry of Energy and Mineral Resources, 2012
SECTOR 1990 1995 2000 2005 2009 2010 2015 2020 2025Commercial 6.22 12.06 19.22 24.82 29.09 27.20 46.18 69.64 116.73Household 46.00 56.39 87.96 89.07 81.50 84.50 112.88 139.27 161.63Transportation 76.18 105.87 139.18 178.45 226.58 300.60 461.79 598.86 754.26Industry 119.58 176.63 262.52 302.22 329.68 327.20 405.35 584.93 763.24
TOTAL 247.98 350.95 508.88 594.56 666.85 739.50 1026.20 1392.70 1795.85Note: 1 TOE = 7.33 BOE
TransportationHousehold
Commercial
Industry
2020
ENERGY CONSERVATION (17%)
9%
1026Mill. BOE
43%
42%
7%
2162Mill. BOE
1796Mill. BOE
739Mill. BOE
1393Mill. BOE
Transportation
HouseholdCommercial
Industry
BAU
4
194.6
140.5
951.4
875.7
Policy Direction for Energy Users
Source: DGNREEC – Ministry of Energy and Mineral Resources, 2012

3/4/2013
3
Oil42%
Coal34%
Gas21%
NRE3%
Oil20%
Coal33%
Gas30%
NRE17%
Oil30%
Coal22%
Gas23%
NRE25%
Coal,30.7%
Gas, 21.0%
Oii, 43.9%
NRE,4.4%
NRE
Gas
Coal
Oil
21 %30,7 %
43,9%
4,4 %
NRE
Gas
Coal
Oil
2010* 2015 20202025
ENERGY CONSERVATION(33,85%)
ENERGY DIVERSIFICATION
BAU**
Source: *Projection 2010, DEN 2010-2025, **BAU Ditjen EBTKE
PERPRES 5/2006 VISION 25/25
25 %
22 %
30 %
23 %
41.7%
20,6%
34.6%
3,1%
4300 Mil. BOE
2852Mil.BOE
1131,3 Mil.BOE
3200 Mil.BOE
20%
30%
33%
17%
Policy Direction for Energy Supply
As a Governor commitment from C40 programme in Seoul 2008 Part of Jakarta regulatory reform to achieve 30% CO2 reduction in 2030
This regulation will be regularly reviewed to achieve better performance
Jakarta Province Green Buildings CodeNo 38 2012
3/4/2013
4
Recommendation
from other institution
Recommendation
from other institution
Recommen‐dation from
other institution
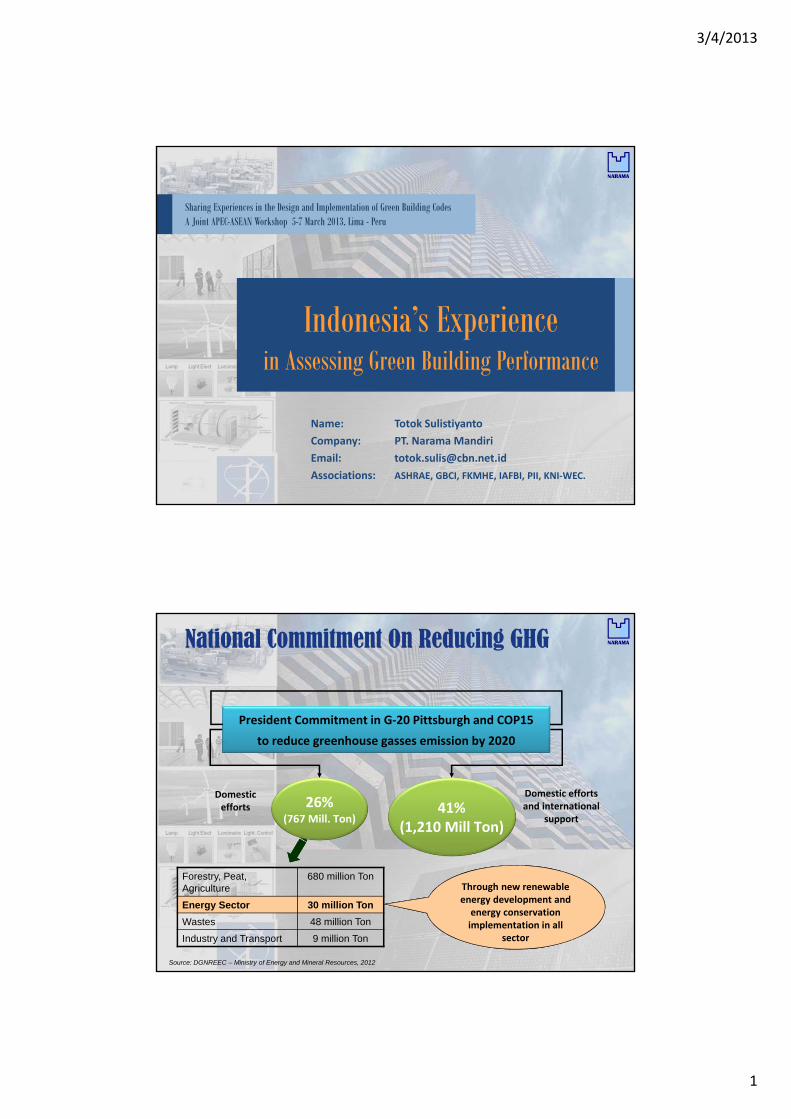
Mandating Green Buildings Code through: 1) Building Permit and 2) Occupancy Permit
design
construction
operationBuilding Permit
OccupancyPermit2, 3....n
Collaborate with other institutionsfor domestic and overseas trainingprogram
Incorporating green buildings concepts into building inpector training curriculum
Building Inspector ProgramOccupancyPermit 1
7
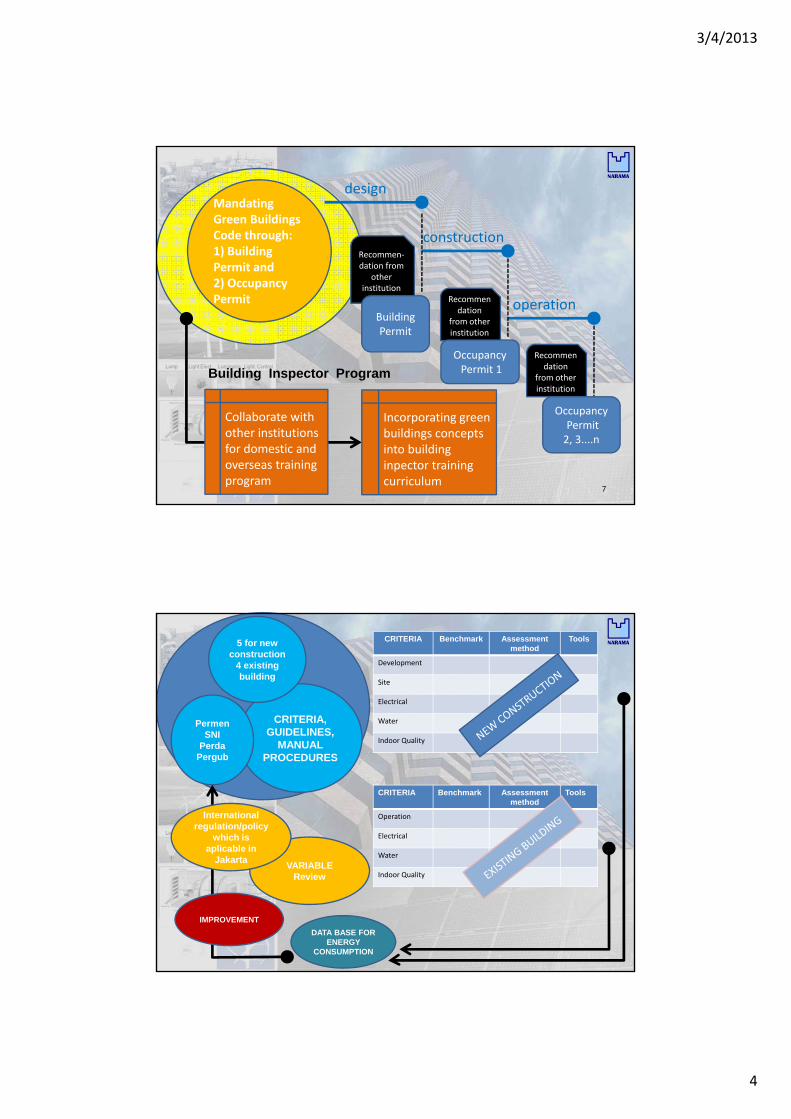
CRITERIA,GUIDELINES,
MANUAL PROCEDURES
5 for new construction
4 existing building
PermenSNI
PerdaPergub
CRITERIA Benchmark Assessment method
Tools
Development
Site
Electrical
Water
Indoor Quality
CRITERIA Benchmark Assessment method
Tools
Operation
Electrical
Water
Indoor QualityVARIABLE
Review
International regulation/policy
which is aplicable in
Jakarta
DATA BASE FOR ENERGY
CONSUMPTION
IMPROVEMENT

3/4/2013
5
GBCI is Emerging Member and representing World Green Building Council (WGBC) in Indonesia
GBCI is Emerging Member and representing World Green Building Council (WGBC) in Indonesia
Starting by 7 initiator
Established : February 2009 by 50 core founder : individu professionals:o Developer, designer, architect, building &
facility management, contractor, supplier etc with architects, mechanical & electrical engineer, interior desinger, landscape background etc.
Then 21 company join as “corporate founding member”
Currently GBCI has 120 corporate member
Not for profit organization
Green Building Council Indonesia

3/4/2013
6
“Ensuring Indonesia’s
Sustainable Future”
GBC Indonesia’s Mission
Promote & Stewardsmarket transformationPromote & Stewardsmarket transformation
Educate the industry & publicEducate the industry & public
Forumsfor Industry dialogForumsfor Industry dialog
Builds CommunityBuilds Community
Provides tools & expertiseProvides tools & expertise
Green Building Council Indonesia
Energy Efficiency and Refrigerant
(7 criterias + 1 bonus, 26 points + 5 bonus points)
25,74%
Water Conservation(7 criterias, 21 points)
20,79%
Indoor Air Healthand Comfort
(8 criterias, 10 points)9,9%
Appropiate Site Development
(8 criterias, 17 points) 16,83 %
Material Resources and Cycle
(7 criterias, 14 points)13,86%
BuildingEnvironment Management
(8 criterias, 13 points)12,87%
TOTAL : 46 CRITERIAS 101 POINTS
Launched June, 2010*Update to 1.1 version: February 2012
Greenship New Building Version 1.1
3/4/2013
7
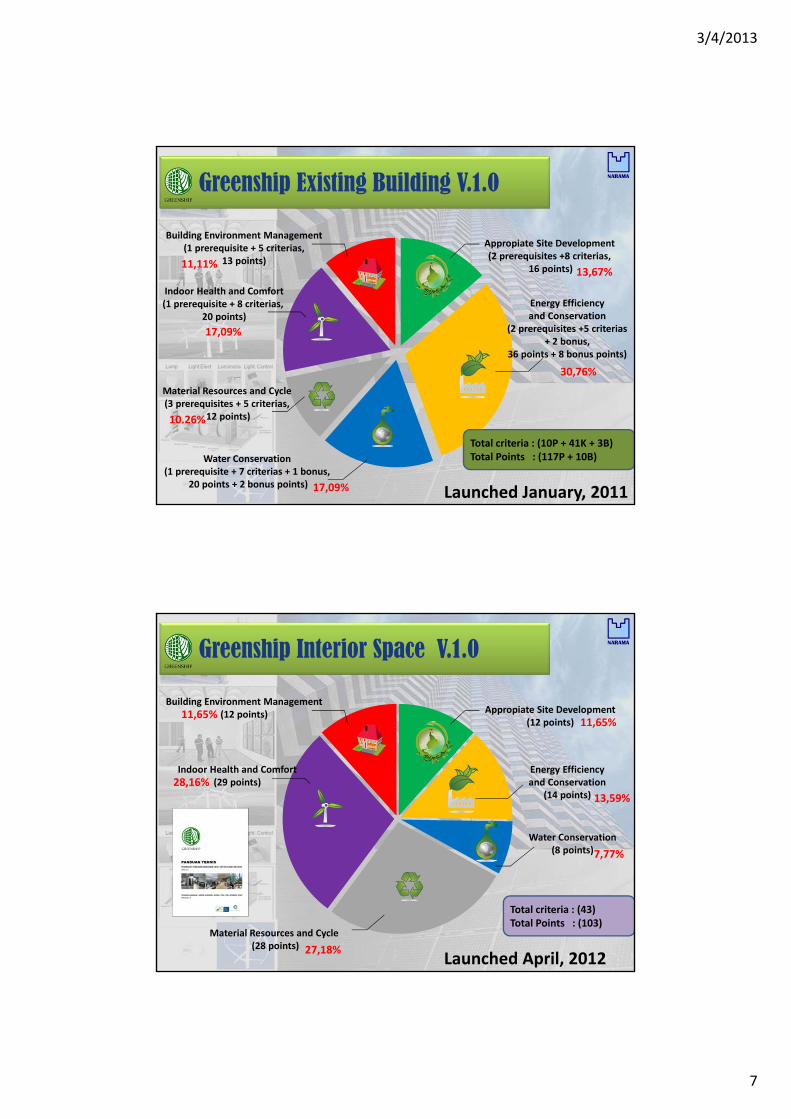
Greenship Existing Building V.1.0
Energy Efficiency and Conservation
(2 prerequisites +5 criterias + 2 bonus,
36 points + 8 bonus points)
Water Conservation(1 prerequisite + 7 criterias + 1 bonus,
20 points + 2 bonus points)
Indoor Health and Comfort(1 prerequisite + 8 criterias,
20 points)
Appropiate Site Development(2 prerequisites +8 criterias,
16 points)
Material Resources and Cycle (3 prerequisites + 5 criterias,
12 points)
Building Environment Management(1 prerequisite + 5 criterias,
13 points)
Total criteria : (10P + 41K + 3B)Total Points : (117P + 10B)
Launched January, 2011
17,09%
11,11%13,67%
30,76%
10.26%
17,09%
Energy Efficiency and Conservation
(14 points)
Water Conservation(8 points)
Indoor Health and Comfort(29 points)
Appropiate Site Development(12 points)
Material Resources and Cycle (28 points)
Building Environment Management(12 points)
Total criteria : (43)Total Points : (103)
Launched April, 2012
11,65%
13,59%
7,77%
27,18%
28,16%
11,65%
Greenship Interior Space V.1.0

3/4/2013
8
Achievement Percentage Minimum Point New Building
Minimum Point Existing Building
Platinum 73 % 74 85Gold 57 % 58 67Silver 46 % 47 53Bronze 35 % 35 41
Total 101 117
Re‐certification: 3 Years
Awarding
PLATINUMDesign Recognition AwardGREENSHIP New BuildingDated:20 September 2011
GOLDDesign Recognition AwardGREENSHIP New BuildingDated: 1 Desember 2011
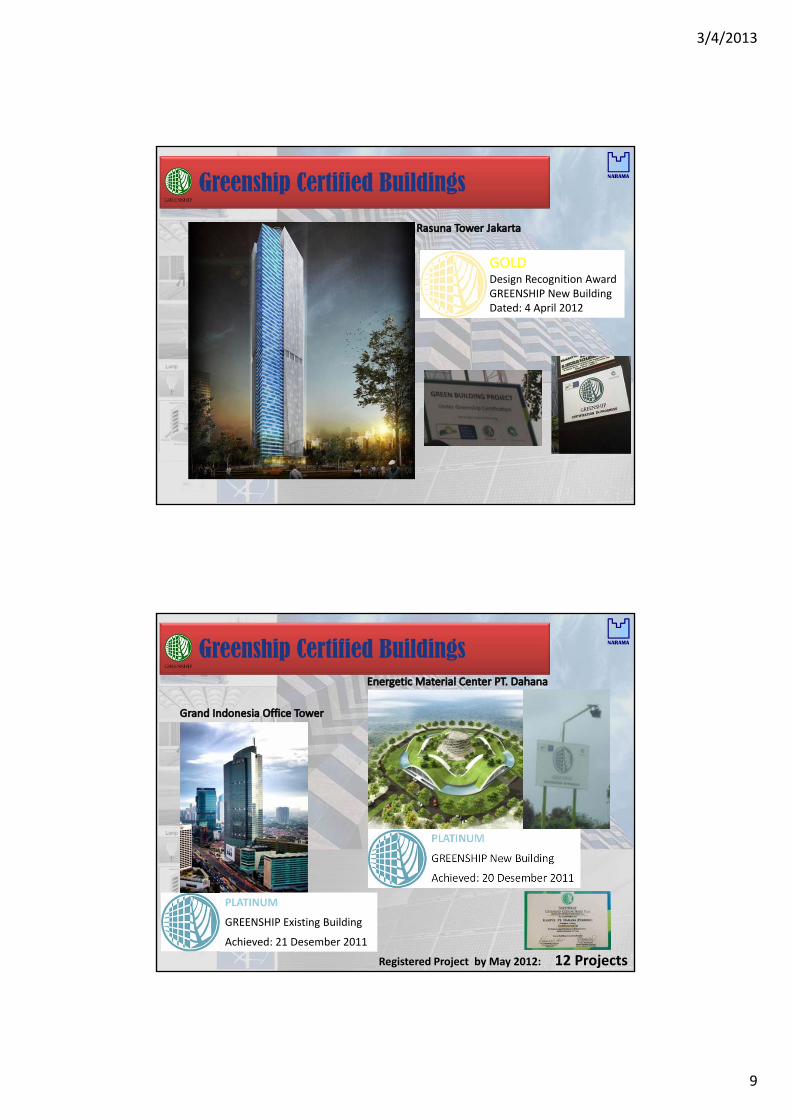
Greenship Certified Buildings
3/4/2013
9
GOLDDesign Recognition AwardGREENSHIP New BuildingDated: 4 April 2012
Greenship Certified Buildings
PLATINUM
GREENSHIP Existing Building
Achieved: 21 Desember 2011
PLATINUM
GREENSHIP New Building
Achieved: 20 Desember 2011
Registered Project by May 2012: 12 Projects
Greenship Certified Buildings
3/4/2013
10
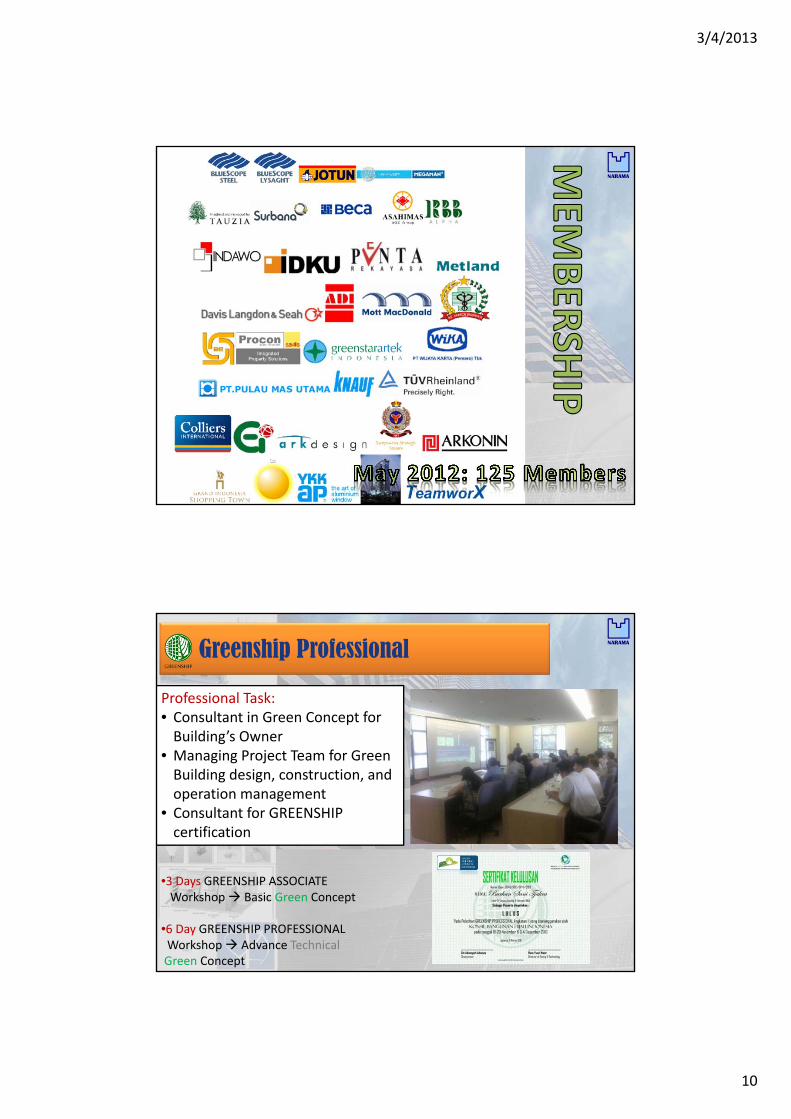
•3 Days GREENSHIP ASSOCIATE Workshop Basic Green Concept
•6 Day GREENSHIP PROFESSIONAL Workshop Advance TechnicalGreen Concept
Professional Task:• Consultant in Green Concept for Building’s Owner
• Managing Project Team for Green Building design, construction, and operation management
• Consultant for GREENSHIP certification
Greenship Professional

3/4/2013
11
www.gbcindonesia.org
Further Information Please visit WEBSITE
Energy Efficiency Guidelines
Energy Efficiency Guidelines for the Building Sector in Indonesia
PART 1ENERGY
EFFICIENCY FOR DEVELOPERS AND
BUILDING OWNERS
PART 2ENERGY
EFFICIENCY TECHNICAL
DESIGN GUIDE
PART 3CASE STUDIES
AND ADDITIONAL INFORMATION

3/4/2013
12
Energy Efficiency Guidelines
DESIGN BRIEF
INTEGRATED DESIGN PROCESS
OPERATIONS AND MAINTENANCE
LIFE‐CYCLE COST
ANALYSIS
Figure 1. Four major aspects that influence the possibility for energy efficient design that are controlled by the developer.
Figure 2. Seven major aspects that influence the possibility for energy efficient design that are controlled by the design team.
Pitfalls
Building Life Cycle Cost Cost Influence for Different Stage of Buildings

3/4/2013
13
Comparison of Integrated and Conventional Design Processes
Integrated Efficient DesignFinancing Concept Landscape and
Environmental Design Concept
Architectural Design
Concept
Human Comfort Design Concept
Electrical and Lighting Design
Concept
Mechanical Design Concept
Operations and
Maintenance Principles
Structural Design
Concept
Integrated Efficient Design

3/4/2013
14
Potential Energy Saving and Degree of Effort in Every Stage
MANAGEMENT / MAINTENANCE POLICIES, REGULATIONS,STANDARDS, ETC.
COSTS / PRICES OF ENERGY
CONSTRUCTION MATERIALSBUILDING DESIGN
EQUIPMENT, APPLIANCES, ETCFUNCTION / NATURE OF BUILDINGS
CLIMATE / WEATHER
OCCUPANCY PATTERN /OCCUPANT BEHAVIOUR
Conception and Design

3/4/2013
15
Building Types and Energy Efficiency Index
Hotel = 290 – 400 kWh/m2/y
Hospital = 320 – 450 kWh/m2/y
Office = 210 – 285 kWh/m2/y
Education = 165 – 295 kWh/m2/y
Mall, Retail & Service = 350 – 500 kWh/m2/y
Apartment = 300 – 400 kWh/m2/y
[totok\ste\Aud-Baturaja.ppt
Case: Energy Balance - Supermall
597,505 kWh/Month (25.72%)
TOTAL ENERGY PLN 20 kV (MV)
AIR CONDITIONING SYSTEM
LIGHTING
901,570 kWh/Month (38.80%)
710,433 kWh/Month (30.58%)
LIFT AND ESCALATOROTHERS
(GIANT, OFFICE, Etc.)
84,178 kWh/Month (3.62%)
TRANSF’ LOSSES 29,555 kWh/Month
(1.27%)
2,323,242 kWh / Month ( 100% )

3/4/2013
16
Case: Energy Saving Potential - Office
• Water cooled chiller• Chilled water pump
• Condenser water pump• Cooling tower
ASHRAE Journal
Chiller System Plant :

3/4/2013
17
ASHRAE Standard 90.1
Office(Enclosed)
Office(Open Plan)
ConferenceRoom Class Room Loby Corridor Active
StorageRetail Sales
AreaAshrae 2001 16.1 14.0 16.1 17.2 19.4 7.5 11.8 23.7Ashrae 2004 11.8 11.8 14.0 15.1 14.0 5.4 8.6 18.3Ashrae 2010 11.8 9.7 11.6 13.3 9.7 7.1 6.8 15.1
0.0
5.0
10.0
15.0
20.0
25.0
Wat
t/m2
Lighting Power Density
Building Performance ImprovementItem 90.1-2004 90.1-2007 90.1-2010 1891.P
Cooling Efficiency 10.3 EER 11.2 EER 11.0 EER/11.4 IPLV 11.2 EER
Economizer NR Yes Yes Yes
SWH Efficiency 80% Et 80% Et 90% Et 80% Et
Roof Insulation R-15 ci R-15 ci R-20 ci R-25 ci
Wall Insulation R-13 + R-3.8 ci R-13 + R-7.5 ci R-13 + R-7.5 ci R-13 + R-10.0 ci
Slab Insulation NR NR NR R-10 for 24”
Window U-Factor 0.57 0.55 0.42 0.45
Window SHGC 0.39 0.40 0.46 0.35
LPD 10.8 W/m2 10.8 W/m2 9.7 W/m2 9.7 W/m2
Avg. EUI 161 kWh/m2/yr 149 kWh/m2/yr 114 kWh/m2/yr 79 kWh/m2/yr
Source: Terry E. Townsend, P.E.; 2008; FASHRAE; ASHRAE - Leading the World to an Independent & Sustainable Future

3/4/2013
18
• Practical guidance for lighting systems:
• Prctical Guidance for A/C systems
1 pk = 746 watt ~ 0,75 kW
Empirical Guidance
+Heat
ConductionthroughWindows
+Solar Heat
GainthroughWindows
HeatConductionthroughWalls
OTTV =
The formula for the OTTV of any given wall orientation is as follows:
0.2% to 5% 10% to 20% 70% to 85%
OTTV = α((1‐WWR)*Uw)*TDeq) + (WWR*Uf*ΔT) + (WWR*SC*SF)exteriorwall
glasssolar
glassconduction
Contributes 54% of building cooling load
Cooling Load from External Building Envelope
3/4/2013
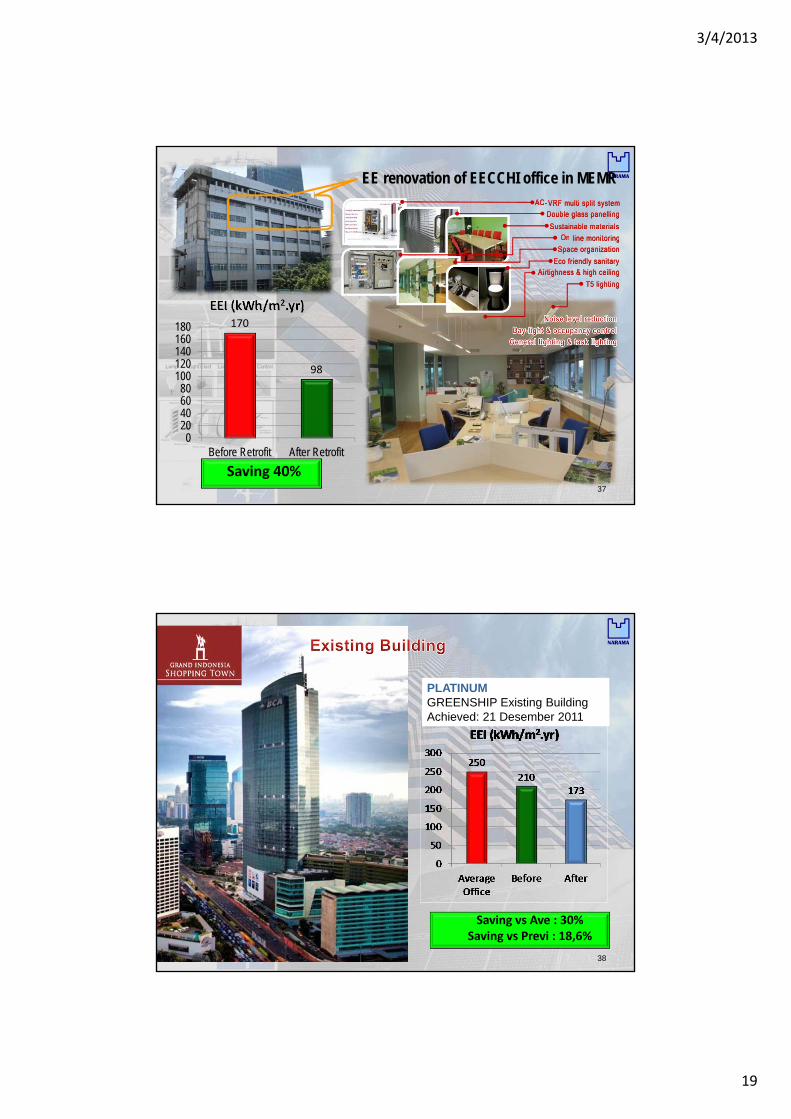
19
Saving 40%
170
98
020406080
100120140160180
Before Retrofit After Retrofit
EEI (kWh/m2.yr)
EE renovation of EECCHI office in MEMR
37
Saving vs Ave : 30%Saving vs Previ : 18,6%
PLATINUMGREENSHIP Existing BuildingAchieved: 21 Desember 2011
38
3/4/2013
20
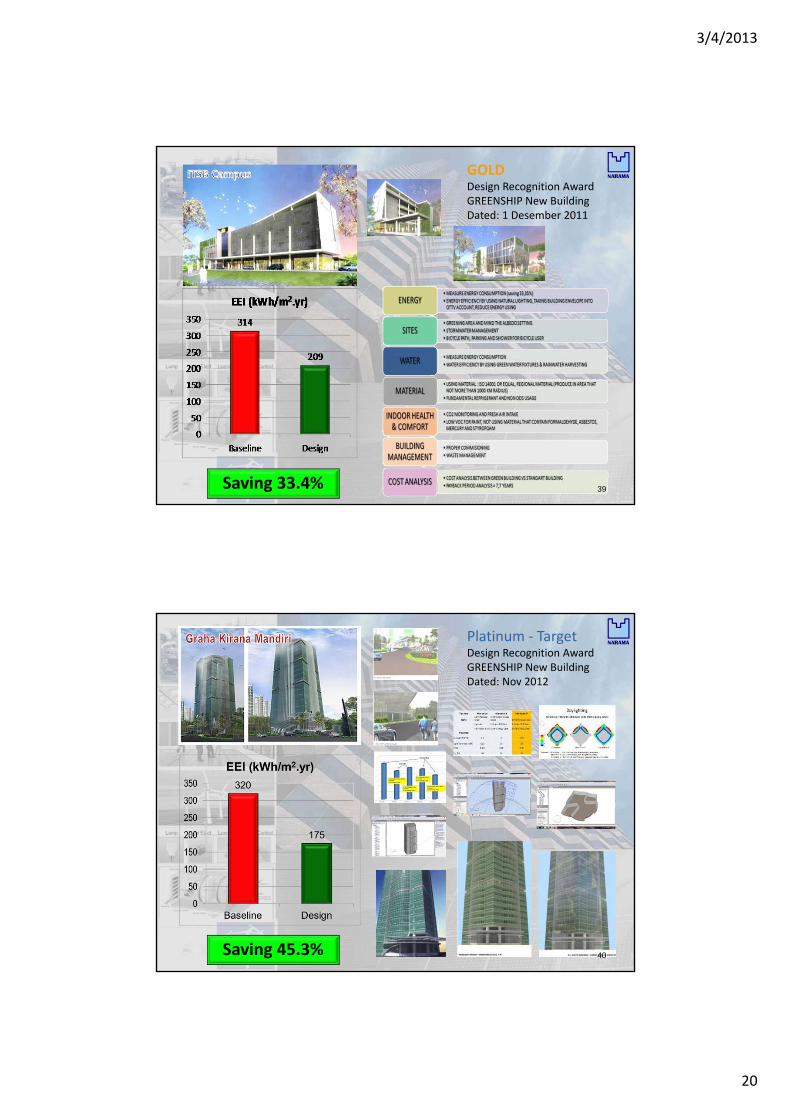
Saving 33.4%
GOLDDesign Recognition AwardGREENSHIP New BuildingDated: 1 Desember 2011
39
Saving 45.3%
Platinum ‐ TargetDesign Recognition AwardGREENSHIP New BuildingDated: Nov 2012
40

3/4/2013
21
Saving 43.6%
Platinum ‐ TargetDesign Recognition AwardGREENSHIP New BuildingDated: Dec 2012
41
Saving 41.2%
Platinum ‐ TargetDesign Recognition AwardGREENSHIP New BuildingDated: Dec 2012
42
3/4/2013
22
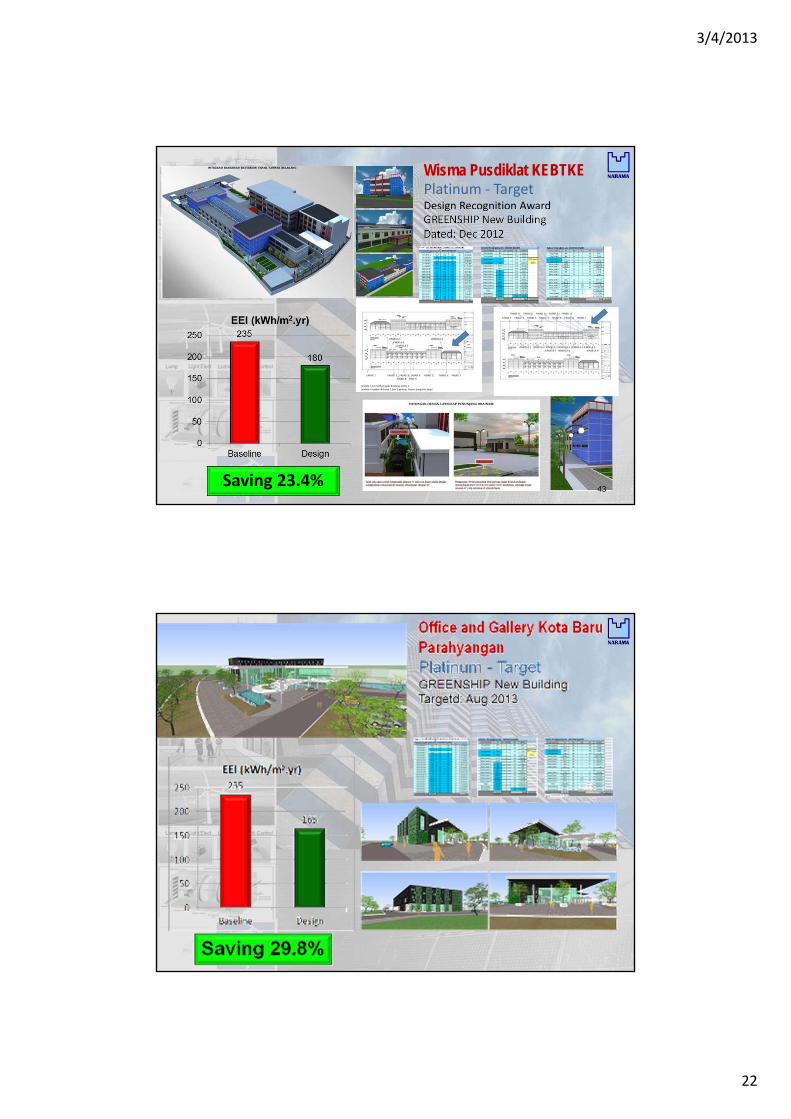
Saving 23.4%
Wisma Pusdiklat KEBTKEPlatinum ‐ TargetDesign Recognition AwardGREENSHIP New BuildingDated: Dec 2012
43

3/4/2013
23
46
Environmental & Global Drivers: 1. Climate change; 2. Peak oil; 3. Energy security; 4. Water scarcity and cost, related health concerns; 5. Increasing cost and decreasing availability of raw materials; 6. Environmental impact of centralized power generation;
Market Drivers: 1. Increasing and uncertain future cost of electricity and gas; 2. Proliferation of consumer electronics (increased plug loads); 3. More and cheaper products due to globalization of manufacturing; 4. Increase in available funding for EE; 5. Increased adoption of Green Building; 6. Market awareness, utility demos and outreach; 7. Energy efficiency promoted through mainstream media
Behavior Drivers: 1. Consumer desire to be “green” and reduce embedded & used energy; 2. Consumer desire for comfort and aesthetics; 3. Personal energy independence/interest in living off the grid; 4. Increased awareness of impact of behavior on energy usage; 5. People like cool, new technologies; 6. People more "plugged in" electronically, digital information, social networking
Policy & Regulatory Drivers: 1. Carbon emissions penalties and/or incentives; 2. Use of codes and standards to lock in efficiency gains; 3. Increasing budgets for emerging technology R&D; 5. Integrated resource planning; 6. Increased interest among legislators in efficiency and renewables; 7. Limits to existing transmission and generation capacity; 8. Smart grid technology development
Technology Innovation Drivers: 1. Integration of info, communication & entertainment devices; 2. Availability of new technologies such as solid state lighting; 3. Availability of cross‐cutting, low‐cost technology building blocks
To Sum up…

3/4/2013
24
Thank you for your attention