Embed Size (px)
Citation preview
ed-JS / sa- MA
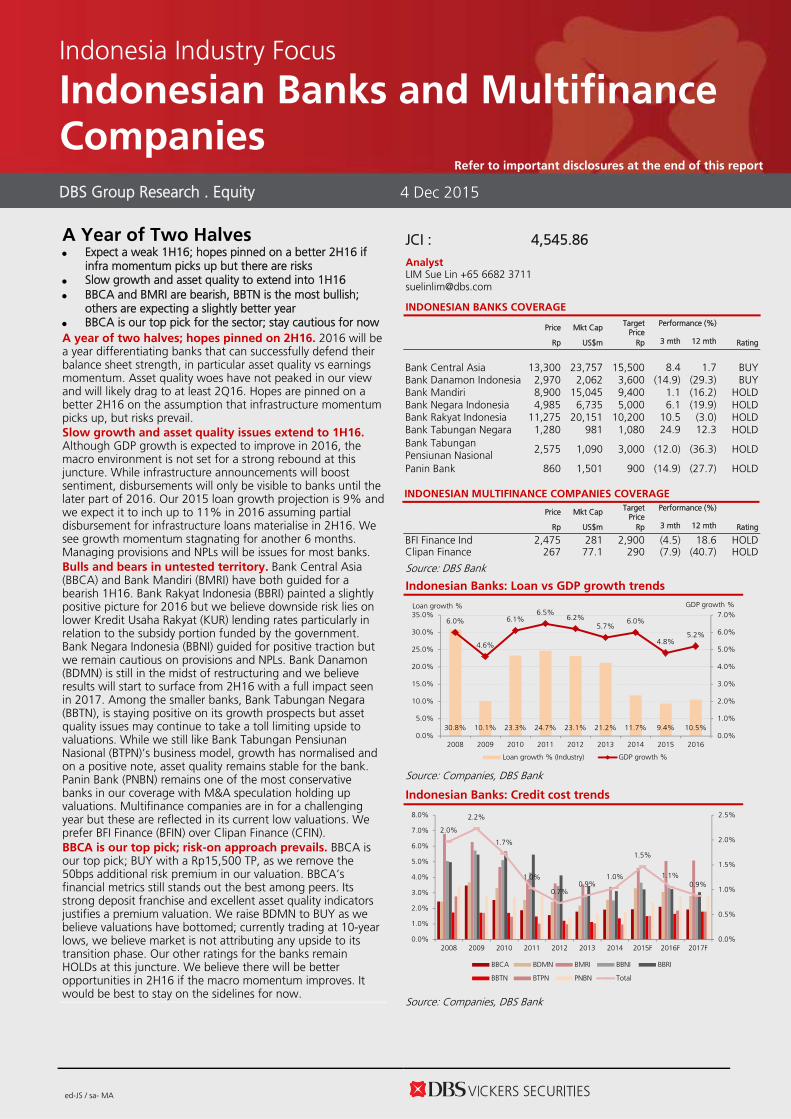
A Year of Two Halves Expect a weak 1H16; hopes pinned on a better 2H16 if
infra momentum picks up but there are risks Slow growth and asset quality to extend into 1H16 BBCA and BMRI are bearish, BBTN is the most bullish;
others are expecting a slightly better year BBCA is our top pick for the sector; stay cautious for now A year of two halves; hopes pinned on 2H16. 2016 will be a year differentiating banks that can successfully defend their balance sheet strength, in particular asset quality vs earnings momentum. Asset quality woes have not peaked in our view and will likely drag to at least 2Q16. Hopes are pinned on a better 2H16 on the assumption that infrastructure momentum picks up, but risks prevail. Slow growth and asset quality issues extend to 1H16. Although GDP growth is expected to improve in 2016, the macro environment is not set for a strong rebound at this juncture. While infrastructure announcements will boost sentiment, disbursements will only be visible to banks until the later part of 2016. Our 2015 loan growth projection is 9% and we expect it to inch up to 11% in 2016 assuming partial disbursement for infrastructure loans materialise in 2H16. We see growth momentum stagnating for another 6 months. Managing provisions and NPLs will be issues for most banks. Bulls and bears in untested territory. Bank Central Asia (BBCA) and Bank Mandiri (BMRI) have both guided for a bearish 1H16. Bank Rakyat Indonesia (BBRI) painted a slightly positive picture for 2016 but we believe downside risk lies on lower Kredit Usaha Rakyat (KUR) lending rates particularly in relation to the subsidy portion funded by the government. Bank Negara Indonesia (BBNI) guided for positive traction but we remain cautious on provisions and NPLs. Bank Danamon (BDMN) is still in the midst of restructuring and we believe results will start to surface from 2H16 with a full impact seen in 2017. Among the smaller banks, Bank Tabungan Negara (BBTN), is staying positive on its growth prospects but asset quality issues may continue to take a toll limiting upside to valuations. While we still like Bank Tabungan Pensiunan Nasional (BTPN)’s business model, growth has normalised and on a positive note, asset quality remains stable for the bank. Panin Bank (PNBN) remains one of the most conservative banks in our coverage with M&A speculation holding up valuations. Multifinance companies are in for a challenging year but these are reflected in its current low valuations. We prefer BFI Finance (BFIN) over Clipan Finance (CFIN). BBCA is our top pick; risk-on approach prevails. BBCA is our top pick; BUY with a Rp15,500 TP, as we remove the 50bps additional risk premium in our valuation. BBCA’s financial metrics still stands out the best among peers. Its strong deposit franchise and excellent asset quality indicators justifies a premium valuation. We raise BDMN to BUY as we believe valuations have bottomed; currently trading at 10-year lows, we believe market is not attributing any upside to its transition phase. Our other ratings for the banks remain HOLDs at this juncture. We believe there will be better opportunities in 2H16 if the macro momentum improves. It would be best to stay on the sidelines for now.
JCI : 4,545.86
Analyst LIM Sue Lin +65 6682 3711 [email protected]
INDONESIAN BANKS COVERAGE
Source: DBS Bank
Indonesian Banks: Loan vs GDP growth trends
30.8% 10.1% 23.3% 24.7% 23.1% 21.2% 11.7% 9.4% 10.5%
6.0%
4.6%
6.1%6.5%
6.2%5.7%
6.0%
4.8%5.2%
0.0%
1.0%
2.0%
3.0%
4.0%
5.0%
6.0%
7.0%
0.0%
5.0%
10.0%
15.0%
20.0%
25.0%
30.0%
35.0%
2008 2009 2010 2011 2012 2013 2014 2015 2016
Loan growth % (Industry) GDP growth %
Loan growth % GDP growth %
Source: Companies, DBS Bank
Indonesian Banks: Credit cost trends
2.0%
2.2%
1.7%
1.0%
0.7%0.9%
1.0%
1.5%
1.1%0.9%
0.0%
0.5%
1.0%
1.5%
2.0%
2.5%
0.0%
1.0%
2.0%
3.0%
4.0%
5.0%
6.0%
7.0%
8.0%
2008 2009 2010 2011 2012 2013 2014 2015F 2016F 2017F
BBCA BDMN BMRI BBNI BBRI
BBTN BTPN PNBN Total
Source: Companies, DBS Bank
DBS Group Research . Equity 4 Dec 2015
Indonesia Industry Focus
Indonesian Banks and Multifinance Companies
Refer to important disclosures at the end of this report
Price Mkt Cap Target Price
Performance (%)
Rp US$m Rp 3 mth 12 mth Rating
Bank Central Asia 13,300 23,757 15,500 8.4 1.7 BUY Bank Danamon Indonesia 2,970 2,062 3,600 (14.9) (29.3) BUY Bank Mandiri 8,900 15,045 9,400 1.1 (16.2) HOLD Bank Negara Indonesia 4,985 6,735 5,000 6.1 (19.9) HOLD Bank Rakyat Indonesia 11,275 20,151 10,200 10.5 (3.0) HOLD Bank Tabungan Negara 1,280 981 1,080 24.9 12.3 HOLD Bank Tabungan Pensiunan Nasional
2,575 1,090 3,000 (12.0) (36.3) HOLD
Panin Bank 860 1,501 900 (14.9) (27.7) HOLD INDONESIAN MULTIFINANCE COMPANIES COVERAGE
Price Mkt Cap Target Price
Performance (%)
Rp US$m Rp 3 mth 12 mth Rating
BFI Finance Ind 2,475 281 2,900 (4.5) 18.6 HOLD Clipan Finance 267 77.1 290 (7.9) (40.7) HOLD
Industry Focus
Indonesian Banks and Multifinance Companies
Page 2
Table of Contents
Outlook for banks remain challenging in 2016 3
Multifinance companies face subdued growth 6
Valuation and recommendation 8
Company Guides 11
Bank Central Asia 12
Bank Danamon 18
Bank Mandiri 24
Bank Negara Indonesia 30
Bank Rakyat Indonesia 36
Bank Tabungan Negara 42
Bank Tabungan Pensiunan Nasional 48
Panin Bank 54
BFI Finance 60
Clipan Finance 66

Industry Focus
Indonesian Banks and Multifinance Companies
Page 3
Outlook for banks remains challenging in 2016
Bearish outlook at least up to 1H16. We believe growth will likely stagnate until end 1H16 at the very least. Loan growth has stayed slow YTD-2015 and does not seem that it will pick up momentum in the coming few months. While announcements on the infrastructure projects will boost sentiment, we do not expect growth or earnings visibility to show for the banks until late 2016. Earnings growth for the sector for 2016 should rebound by a strong 15%, driven largely by BMRI in the absence of high provisions and BBNI’s kitchen sinking year in 2015. Excluding these two banks, earnings growth would be a dismal 7%. Indonesian banks: Earnings growth trends
-10.0%
0.0%
10.0%
20.0%
30.0%
40.0%
50.0%
-20.0%
0.0%
20.0%
40.0%
60.0%
80.0%
100.0%
120.0%
2008 2009 2010 2011 2012 2013 2014 2015F 2016F 2017F
BBCA BDMN BMRI BBNI BBRI
BBTN BTPN PNBN Total
Individual banks% Total %
Source: Companies, DBS Bank Indonesian banks: ROE trends
(10.0%)
(5.0%)
0.0%
5.0%
10.0%
15.0%
20.0%
25.0%
0.0%
5.0%
10.0%
15.0%
20.0%
25.0%
30.0%
35.0%
40.0%
2008 2009 2010 2011 2012 2013 2014 2015F 2016F 2017F
BBCA BDMN BMRI BBNI BBRI
BBTN BTPN PNBN Average
ROE (Banks) ROE (Average)
Source: Companies, DBS Bank
Banks on asset quality watch track, disregarding growth. Most banks are focusing on preserving asset quality and managing NPL issues for most of 2015 and at least until 1H16. Almost all banks will see higher NPL ratios in 2015 and right through 1H16, not just because of absolute NPLs but also as loan growth slows down. Our sense from the banks is that loan demand remains weak in this uncertain environment and sentiment of stagnating growth going forward could continue to see loan growth momentum remaining relatively sluggish. Banks are aggressively classifying NPLs to buffer provision levels and coverage in 2015. Credit costs are also expected to remain elevated until 2Q16 before improving towards the end of 2016. Indonesian banks: Credit cost trends
2.0%
2.2%
1.7%
1.0%
0.7%0.9%
1.0%
1.5%
1.1%0.9%
0.0%
0.5%
1.0%
1.5%
2.0%
2.5%
0.0%
1.0%
2.0%
3.0%
4.0%
5.0%
6.0%
7.0%
8.0%
2008 2009 2010 2011 2012 2013 2014 2015F 2016F 2017F
BBCA BDMN BMRI BBNI BBRI
BBTN BTPN PNBN Total
Source: Companies, DBS Bank
Indonesian banks: Loan loss coverage trends
0.0%
50.0%
100.0%
150.0%
200.0%
250.0%
0.0%
50.0%
100.0%
150.0%
200.0%
250.0%
300.0%
350.0%
400.0%
450.0%
500.0%
2008 2009 2010 2011 2012 2013 2014 2015F 2016F 2017F
BBCA BDMN BMRI BBNI BBRIBBTN BTPN PNBN Average
Loan loss coverage (Banks) Loan loss coverage (Average)
Source: Companies, DBS Bank
Industry Focus
Indonesian Banks and Multifinance Companies
Page 4
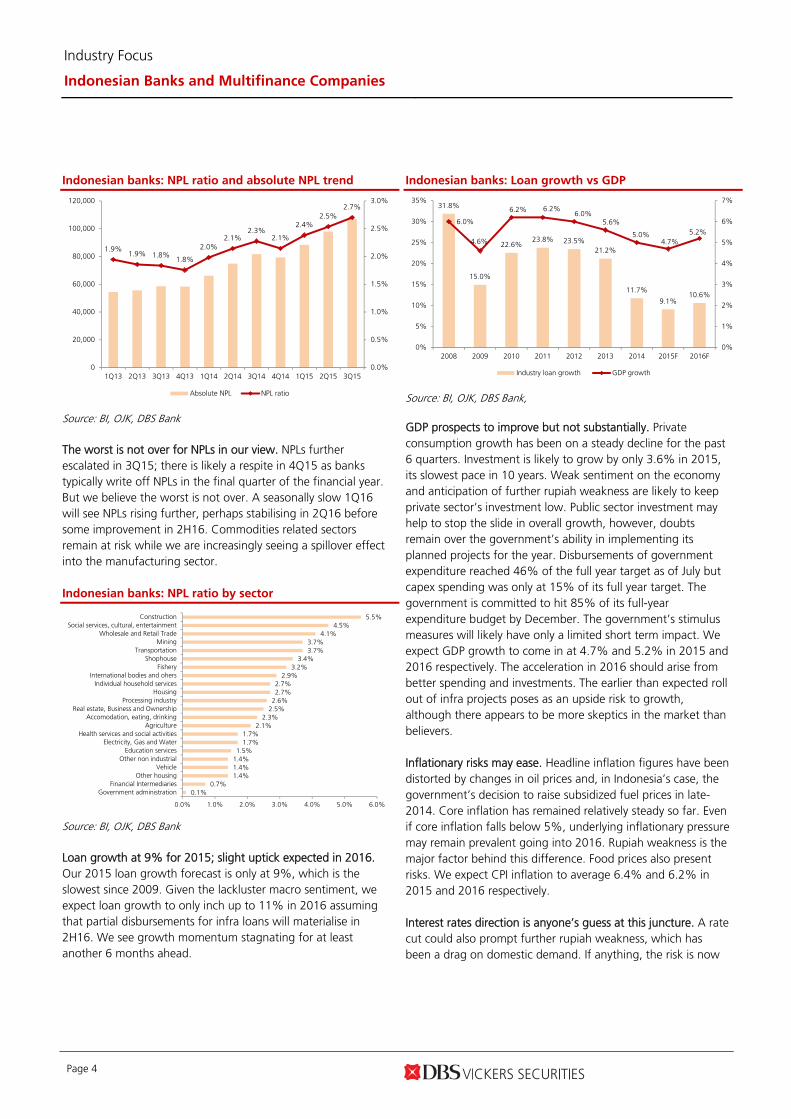
Indonesian banks: NPL ratio and absolute NPL trend
1.9%1.9% 1.8%
1.8%
2.0%2.1%
2.3%2.1%
2.4%2.5%
2.7%
0.0%
0.5%
1.0%
1.5%
2.0%
2.5%
3.0%
0
20,000
40,000
60,000
80,000
100,000
120,000
1Q13 2Q13 3Q13 4Q13 1Q14 2Q14 3Q14 4Q14 1Q15 2Q15 3Q15
Absolute NPL NPL ratio
Source: BI, OJK, DBS Bank
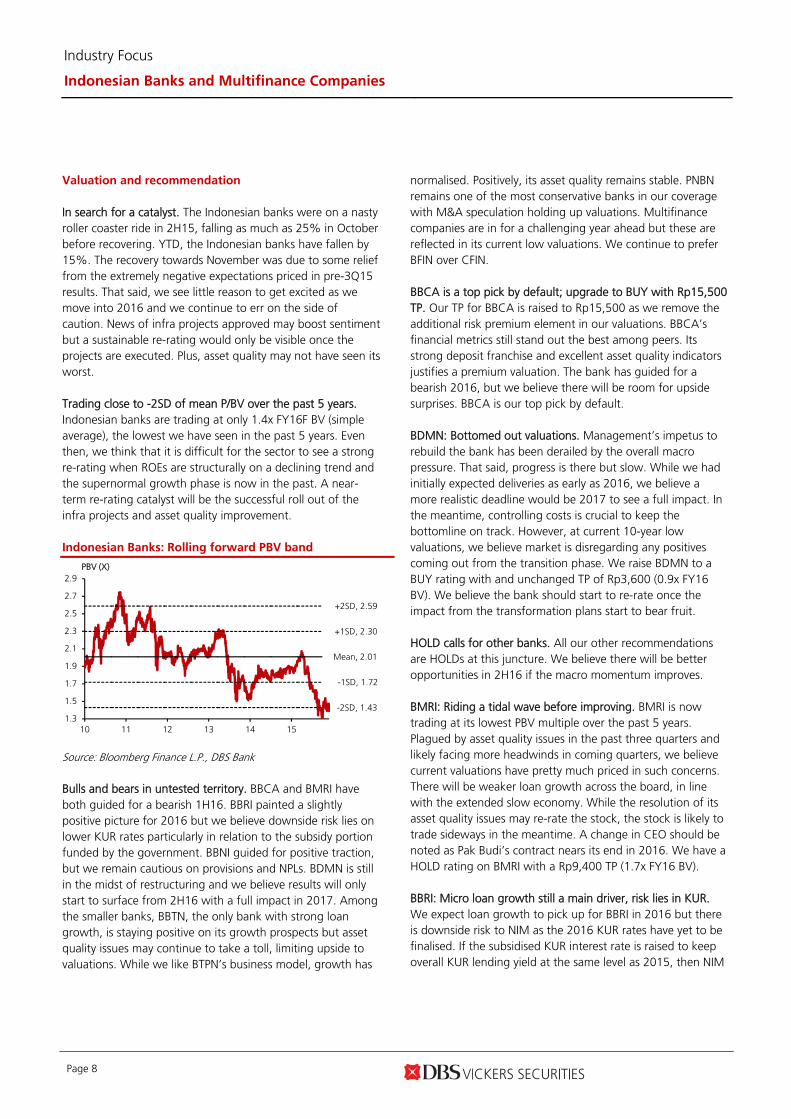
The worst is not over for NPLs in our view. NPLs further escalated in 3Q15; there is likely a respite in 4Q15 as banks typically write off NPLs in the final quarter of the financial year. But we believe the worst is not over. A seasonally slow 1Q16 will see NPLs rising further, perhaps stabilising in 2Q16 before some improvement in 2H16. Commodities related sectors remain at risk while we are increasingly seeing a spillover effect into the manufacturing sector. Indonesian banks: NPL ratio by sector
0.1%0.7%
1.4%1.4%1.4%1.5%
1.7%1.7%
2.1%2.3%
2.5%2.6%2.7%2.7%
2.9%3.2%
3.4%3.7%3.7%
4.1%4.5%
5.5%
0.0% 1.0% 2.0% 3.0% 4.0% 5.0% 6.0%
Government administrationFinancial Intermediaries
Other housingVehicle
Other non industrialEducation services
Electricity, Gas and WaterHealth services and social activities
AgricultureAccomodation, eating, drinking
Real estate, Business and OwnershipProcessing industry
HousingIndividual household services
International bodies and ohersFishery
ShophouseTransportation
MiningWholesale and Retail Trade
Social services, cultural, entertainmentConstruction
Source: BI, OJK, DBS Bank
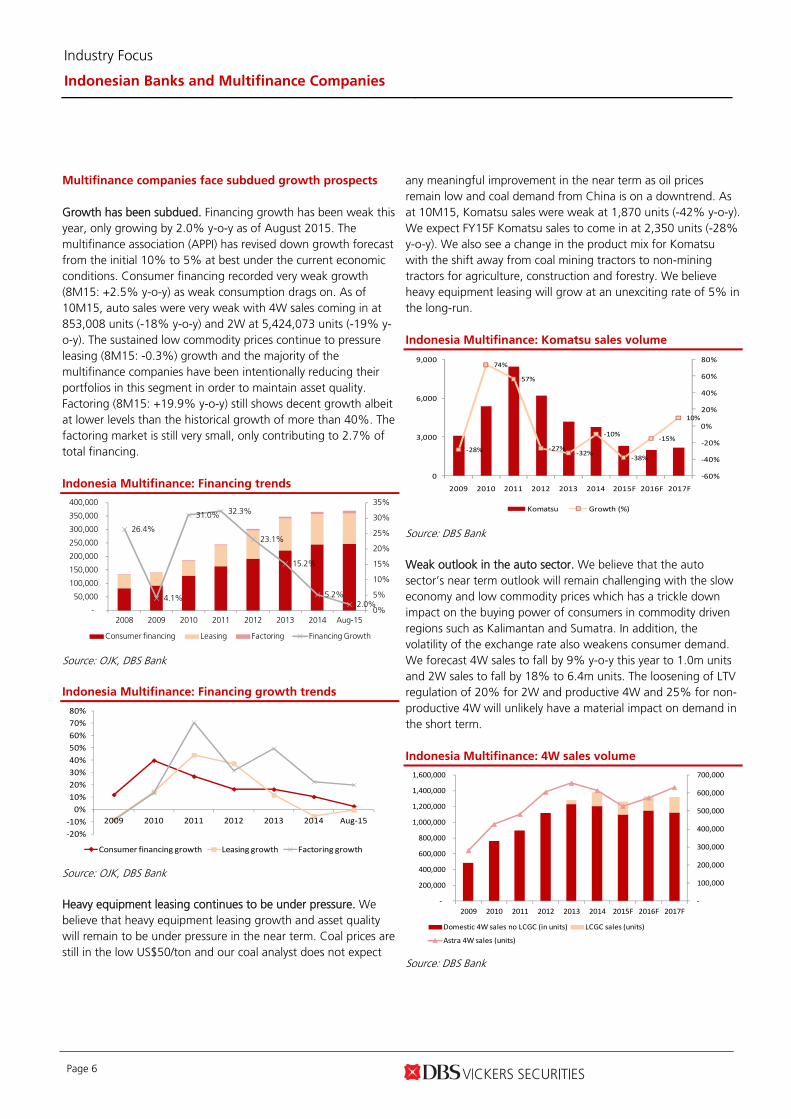
Loan growth at 9% for 2015; slight uptick expected in 2016. Our 2015 loan growth forecast is only at 9%, which is the slowest since 2009. Given the lackluster macro sentiment, we expect loan growth to only inch up to 11% in 2016 assuming that partial disbursements for infra loans will materialise in 2H16. We see growth momentum stagnating for at least another 6 months ahead.
Indonesian banks: Loan growth vs GDP
31.8%
15.0%
22.6%23.8% 23.5%
21.2%
11.7%
9.1%10.6%
6.0%
4.6%
6.2% 6.2%6.0%
5.6%
5.0%4.7%
5.2%
0%
1%
2%
3%
4%
5%
6%
7%
0%
5%
10%
15%
20%
25%
30%
35%
2008 2009 2010 2011 2012 2013 2014 2015F 2016F
Industry loan growth GDP growth
Source: BI, OJK, DBS Bank, GDP prospects to improve but not substantially. Private consumption growth has been on a steady decline for the past 6 quarters. Investment is likely to grow by only 3.6% in 2015, its slowest pace in 10 years. Weak sentiment on the economy and anticipation of further rupiah weakness are likely to keep private sector’s investment low. Public sector investment may help to stop the slide in overall growth, however, doubts remain over the government’s ability in implementing its planned projects for the year. Disbursements of government expenditure reached 46% of the full year target as of July but capex spending was only at 15% of its full year target. The government is committed to hit 85% of its full-year expenditure budget by December. The government’s stimulus measures will likely have only a limited short term impact. We expect GDP growth to come in at 4.7% and 5.2% in 2015 and 2016 respectively. The acceleration in 2016 should arise from better spending and investments. The earlier than expected roll out of infra projects poses as an upside risk to growth, although there appears to be more skeptics in the market than believers. Inflationary risks may ease. Headline inflation figures have been distorted by changes in oil prices and, in Indonesia’s case, the government’s decision to raise subsidized fuel prices in late-2014. Core inflation has remained relatively steady so far. Even if core inflation falls below 5%, underlying inflationary pressure may remain prevalent going into 2016. Rupiah weakness is the major factor behind this difference. Food prices also present risks. We expect CPI inflation to average 6.4% and 6.2% in 2015 and 2016 respectively. Interest rates direction is anyone’s guess at this juncture. A rate cut could also prompt further rupiah weakness, which has been a drag on domestic demand. If anything, the risk is now

Industry Focus
Indonesian Banks and Multifinance Companies
Page 5
tilted towards a hike more than a cut. Since August, Bank Indonesia (BI) has repeatedly indicated that the rupiah is undervalued. While BI is unlikely to go against the market, the central bank has been active in preventing excessive weakness of the rupiah. Whether or not BI will lower its interest rates in December remains anyone’s guess at this point. Vice President Kalla continues to insist that BI should lower rates to help boost GDP growth. But BI’s position on this front was made clear in its November policy statement. There is a need to balance between downside risks to growth and potential volatility in financial markets due to the US Fed rate lift-off. The recent reduction in the Reserve Requirement Ratio (RRR) with effect from 1 Dec from 8.0% to 7.5% is a signal of monetary easing. From our checks with the banks, a handful of them expect a small rate cut of 25bps in 2016. Should a rate cut happen, even as low as 25bps, it will be positive for smaller banks such as BBTN and BTPN which are more sensitive to funding cost movements because of their relatively low CASA proportion to deposits. Rupiah may stay volatile. The Rupiah has been on a depreciating path after it peaked around 8500 against the USD in Aug 2011. The path steepened after the Fed’s taper tantrums increased volatility in emerging markets in 2013. This was represented by USD/IDR trading in an ascending price channel, mostly in the lower half of the channel, after early 2014. This changed in August this year when China’s unanticipated devaluation pressured Asia ex Japan and commodity currencies lower. USD/IDR rose to the middle of the price channel where it is expected to fluctuate. The IDR’s depreciation since 2011 coincided with the slide in Indonesia’s real GDP growth from 6.0-6.4% in 2010-12 to 5.0-5.6% in 2013-14 to less than 5% this year. Export growth has been in negative double-digit territory this year. The Jakarta Composite Index has fallen more than 20% since April, which is also in line with global trends. The IDR remains vulnerable if the US goes ahead to lift interest rates. We expect IDR to come in at Rp14,070 per USD in 2015 and Rp15,200 per USD in 1H16. Banks with higher exposure to USD loans may see some risk, although we believe this would be limited as they tend to hedge their positions.
Earnings contraction in 2015; recovery in 2016 in the absence of high provisions. Our 2015 earnings projection points to a contraction, dragged mainly by significantly higher provisions, largely skewed by BBNI. Excluding the dent from BBNI in 2Q15, overall earnings for the sector is expected to fall by 2%. We
continue to expect NIM to remain relatively stable in 2015 while expenses will likely be 15% higher largely due to continued investments to digitise products and services. Branch/outlet expansion is expected to slow down this year. For 2016, we forecast that earnings will grow by 14.5%, largely due to the absence of hefty provisions. While NPLs will likely remain high, the spike should be less severe in 1H16. We believe asset quality should start to stabilise in 2H16. We continue to expect NIM to remain largely stable unless regulations come into play forcing banks to lower lending rates, micro loans in particular. If policy rates were to shift down by 25bps, the impact to NIM will be marginally positive. Indonesian banks: Banks NIM
6.2%
6.4%
6.6%
6.8%
7.0%
7.2%
7.4%
7.6%
7.8%
0.0%
2.0%
4.0%
6.0%
8.0%
10.0%
12.0%
14.0%
16.0%
2010 2011 2012 2013 2014 2015F 2016F 2017F
BBCA BDMN BMRI BBNI BBRIBBTN BTPN PNBN Average
NIM (Banks) NIM (Average/Industry)
Source: DBS Bank, Companies Regulatory changes. This year, OJK implemented new regulations to stimulate the economy and keep asset quality in check. First of all, OJK reduced the loan-to-value (LTV) ratio from 25-30% to 20-25% although it did not have much of an impact due to the weakness in structural demand for auto loans and mortgages. In addition to that, OJK also reduced the KUR rate to 12% (from 21%) while subsidising 7%, thus BBRI effectively gets 19% to increase demand. OJK also allows the early restructuring of loans and has eased the criteria to restructure loans to pre-emptively prevent NPLs. OJK is also reducing the risk weighting for most types of loans to stimulate growth. Despite all these measures, we still see potential asset quality weakness and growth continuing to lag given the slow macroeconomic climate. We think that these new regulations will not boost growth in the short-term and a bigger impact would be the realisation of government infrastructure projects and the trickle down impact to the whole economy.
Industry Focus
Indonesian Banks and Multifinance Companies
Page 6
Multifinance companies face subdued growth prospects
Growth has been subdued. Financing growth has been weak this year, only growing by 2.0% y-o-y as of August 2015. The multifinance association (APPI) has revised down growth forecast from the initial 10% to 5% at best under the current economic conditions. Consumer financing recorded very weak growth (8M15: +2.5% y-o-y) as weak consumption drags on. As of 10M15, auto sales were very weak with 4W sales coming in at 853,008 units (-18% y-o-y) and 2W at 5,424,073 units (-19% y-o-y). The sustained low commodity prices continue to pressure leasing (8M15: -0.3%) growth and the majority of the multifinance companies have been intentionally reducing their portfolios in this segment in order to maintain asset quality. Factoring (8M15: +19.9% y-o-y) still shows decent growth albeit at lower levels than the historical growth of more than 40%. The factoring market is still very small, only contributing to 2.7% of total financing. Indonesia Multifinance: Financing trends
26.4%
4.1%
31.0% 32.3%
23.1%
15.2%
5.2%2.0%
0%
5%
10%
15%
20%
25%
30%
35%
-
50,000
100,000
150,000
200,000
250,000
300,000
350,000
400,000
2008 2009 2010 2011 2012 2013 2014 Aug-15
Consumer financing Leasing Factoring Financing Growth
Source: OJK, DBS Bank Indonesia Multifinance: Financing growth trends
‐20%
‐10%
0%
10%
20%
30%
40%
50%
60%
70%
80%
2009 2010 2011 2012 2013 2014 Aug‐15
Consumer financing growth Leasing growth Factoring growth
Source: OJK, DBS Bank Heavy equipment leasing continues to be under pressure. We believe that heavy equipment leasing growth and asset quality will remain to be under pressure in the near term. Coal prices are still in the low US$50/ton and our coal analyst does not expect
any meaningful improvement in the near term as oil prices remain low and coal demand from China is on a downtrend. As at 10M15, Komatsu sales were weak at 1,870 units (-42% y-o-y). We expect FY15F Komatsu sales to come in at 2,350 units (-28% y-o-y). We also see a change in the product mix for Komatsu with the shift away from coal mining tractors to non-mining tractors for agriculture, construction and forestry. We believe heavy equipment leasing will grow at an unexciting rate of 5% in the long-run. Indonesia Multifinance: Komatsu sales volume
‐28%
74%
57%
‐27%‐32%
‐10%
‐38%
‐15%
10%
‐60%
‐40%
‐20%
0%
20%
40%
60%
80%
0
3,000
6,000
9,000
2009 2010 2011 2012 2013 2014 2015F 2016F 2017F
Komatsu Growth (%)
Source: DBS Bank Weak outlook in the auto sector. We believe that the auto sector’s near term outlook will remain challenging with the slow economy and low commodity prices which has a trickle down impact on the buying power of consumers in commodity driven regions such as Kalimantan and Sumatra. In addition, the volatility of the exchange rate also weakens consumer demand. We forecast 4W sales to fall by 9% y-o-y this year to 1.0m units and 2W sales to fall by 18% to 6.4m units. The loosening of LTV regulation of 20% for 2W and productive 4W and 25% for non-productive 4W will unlikely have a material impact on demand in the short term. Indonesia Multifinance: 4W sales volume
‐
100,000
200,000
300,000
400,000
500,000
600,000
700,000
‐
200,000
400,000
600,000
800,000
1,000,000
1,200,000
1,400,000
1,600,000
2009 2010 2011 2012 2013 2014 2015F 2016F 2017F
Domestic 4W sales no LCGC (in units) LCGC sales (units)
Astra 4W sales (units)
Source: DBS Bank

Industry Focus
Indonesian Banks and Multifinance Companies
Page 7
Indonesia Multifinance: 2W sales volume
‐
1,000,000
2,000,000
3,000,000
4,000,000
5,000,000
6,000,000
‐
1,000,000
2,000,000
3,000,000
4,000,000
5,000,000
6,000,000
7,000,000
8,000,000
9,000,000
2009 2010 2011 2012 2013 2014 2015F 2016F 2017F
2W sales (units) Astra 2W sales (units)
Source: DBS Bank Regulatory consolidation with banks. OJK has become stricter in regulating the multifinance industry and is starting to employ the same standards and metrics as the banks. As of this year, OJK officially allowed multifinance companies to finance multipurpose loans, re-financing and also infrastructure loans. OJK has also determined a minimum capital level of Rp100bn for multifinance companies and Rp50bn for cooperatives, and this capital requirement must be fulfilled in the next 5 years. In addition to this, OJK will require multifinance companies to fulfill an equity / asset ratio of 10%. The classification of NPL ratios for multifinance companies will also be the same as NPLs for the banks (past 90 days due). OJK will also require a maximum NPL ratio of 5%. In addition to asset quality requirements, provisioning will also be regulated exactly like the banks by using PSAK 50/55. OJK will also impose a minimum financing to asset ratio of 40% and a maximum financing to equity ratio of 50%. OJK has not publicly set a date of the enforcement of all these requirements but will likely start to implement some of these requirements towards the end of this year. Asset quality pressures. Our channel checks indicated that multifinance companies suffered asset quality pressures throughout 2015. Although industry data only shows a manageable NPF ratio of 1.54% as of July 2015, multifinance companies indicated weakness in asset quality and also an increase in write-offs. We should also take into account the write off rates for the multifinance companies aside from the NPF ratios since there are no regulations on write-off policies yet and multifinance companies tend to write-off NPFs. However, companies such as CFIN indicated an increase in NPF ratio and provisioning due to stricter regulations by OJK. The majority of the asset quality weakness is still in the heavy equipment leasing and commodity related areas.
Indonesia Multifinance: Asset quality
2.27%
1.99% 2.03%
1.62%1.41%
1.54%
0.00%
0.50%
1.00%
1.50%
2.00%
2.50%
2010 2011 2012 2013 2014 Jul‐15 Source: OJK, DBS Bank Positive: expect stable NIM. Multifinance companies indicated that margins will largely stay stable as cost of funds trended lower due to improved liquidity in the system. Historically, multifinance companies always had the ability to pass on higher cost of funds to customers. Loan ticket sizes for multifinance firms are generally relatively small and any increase in interest rates would only translate to a small nominal increase in payments. Lending rates will always be variable in nature for multifinance companies. There may even be a slight upside to margins for some companies as lending yields for used 4W and 2W vehicles become more attractive in the current environment. Companies like BFIN will also continue to focus on its direct financing business.. Indonesia Multifinance: NIM trends
16.5%18.0%
15.0%13.7% 12.7% 12.1% 12.6% 12.9%
14.0%12.8%
11.1% 10.7% 10.7% 9.7% 9.7% 9.7%
0.0%
5.0%
10.0%
15.0%
20.0%
2009 2010 2011 2012 2013 2014 2015F 2016F
BFIN CFIN
Source: Companies, DBS Bank Indonesia Multifinance: Market share
2.0%1.5%10.0%
2.2%
11.0%
2.1%
71.2%
BFIN CFIN ADMF Mandiri Tunas Finance FIF Group BCA Finance Others
Source: OJK, DBS Bank
Industry Focus
Indonesian Banks and Multifinance Companies
Page 8
Valuation and recommendation
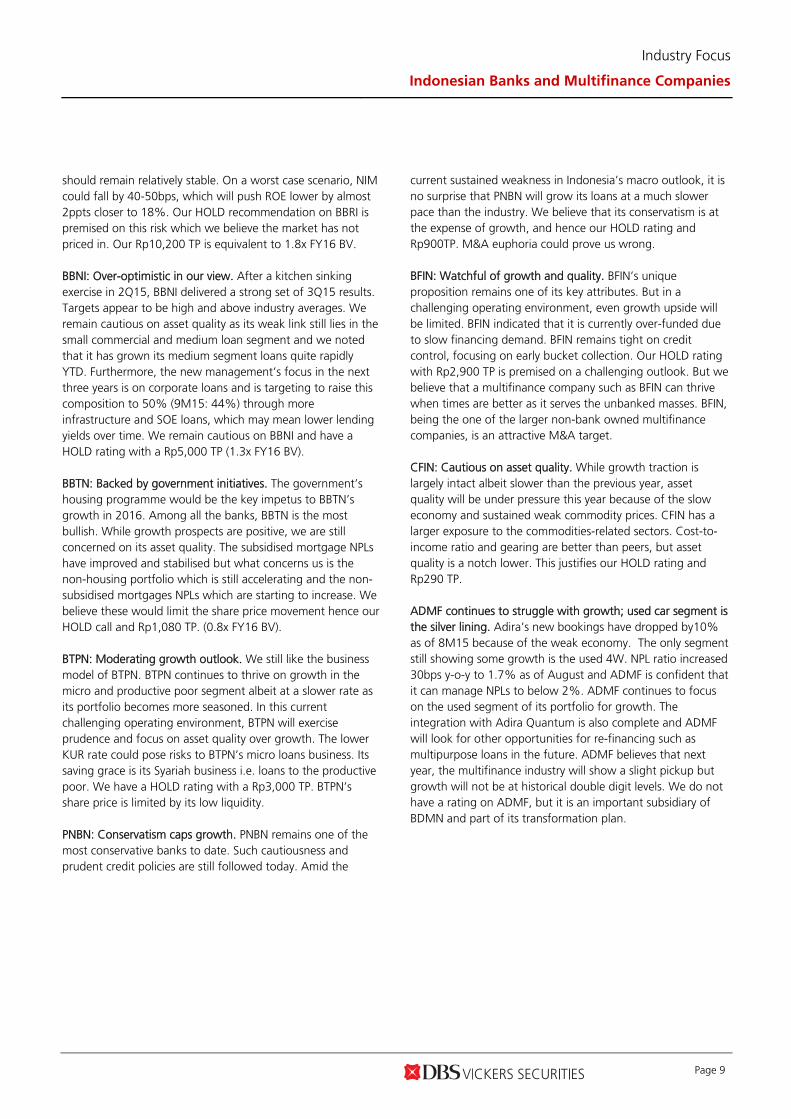
In search for a catalyst. The Indonesian banks were on a nasty roller coaster ride in 2H15, falling as much as 25% in October before recovering. YTD, the Indonesian banks have fallen by 15%. The recovery towards November was due to some relief from the extremely negative expectations priced in pre-3Q15 results. That said, we see little reason to get excited as we move into 2016 and we continue to err on the side of caution. News of infra projects approved may boost sentiment but a sustainable re-rating would only be visible once the projects are executed. Plus, asset quality may not have seen its worst. Trading close to -2SD of mean P/BV over the past 5 years. Indonesian banks are trading at only 1.4x FY16F BV (simple average), the lowest we have seen in the past 5 years. Even then, we think that it is difficult for the sector to see a strong re-rating when ROEs are structurally on a declining trend and the supernormal growth phase is now in the past. A near-term re-rating catalyst will be the successful roll out of the infra projects and asset quality improvement. Indonesian Banks: Rolling forward PBV band
Mean, 2.01
+1SD, 2.30
+2SD, 2.59
-1SD, 1.72
-2SD, 1.43 1.3
1.5
1.7
1.9
2.1
2.3
2.5
2.7
2.9
10 11 12 13 14 15
PBV (X)
Source: Bloomberg Finance L.P., DBS Bank Bulls and bears in untested territory. BBCA and BMRI have both guided for a bearish 1H16. BBRI painted a slightly positive picture for 2016 but we believe downside risk lies on lower KUR rates particularly in relation to the subsidy portion funded by the government. BBNI guided for positive traction, but we remain cautious on provisions and NPLs. BDMN is still in the midst of restructuring and we believe results will only start to surface from 2H16 with a full impact in 2017. Among the smaller banks, BBTN, the only bank with strong loan growth, is staying positive on its growth prospects but asset quality issues may continue to take a toll, limiting upside to valuations. While we like BTPN’s business model, growth has
normalised. Positively, its asset quality remains stable. PNBN remains one of the most conservative banks in our coverage with M&A speculation holding up valuations. Multifinance companies are in for a challenging year ahead but these are reflected in its current low valuations. We continue to prefer BFIN over CFIN. BBCA is a top pick by default; upgrade to BUY with Rp15,500 TP. Our TP for BBCA is raised to Rp15,500 as we remove the additional risk premium element in our valuations. BBCA’s financial metrics still stand out the best among peers. Its strong deposit franchise and excellent asset quality indicators justifies a premium valuation. The bank has guided for a bearish 2016, but we believe there will be room for upside surprises. BBCA is our top pick by default. BDMN: Bottomed out valuations. Management’s impetus to rebuild the bank has been derailed by the overall macro pressure. That said, progress is there but slow. While we had initially expected deliveries as early as 2016, we believe a more realistic deadline would be 2017 to see a full impact. In the meantime, controlling costs is crucial to keep the bottomline on track. However, at current 10-year low valuations, we believe market is disregarding any positives coming out from the transition phase. We raise BDMN to a BUY rating with and unchanged TP of Rp3,600 (0.9x FY16 BV). We believe the bank should start to re-rate once the impact from the transformation plans start to bear fruit. HOLD calls for other banks. All our other recommendations are HOLDs at this juncture. We believe there will be better opportunities in 2H16 if the macro momentum improves. BMRI: Riding a tidal wave before improving. BMRI is now trading at its lowest PBV multiple over the past 5 years. Plagued by asset quality issues in the past three quarters and likely facing more headwinds in coming quarters, we believe current valuations have pretty much priced in such concerns. There will be weaker loan growth across the board, in line with the extended slow economy. While the resolution of its asset quality issues may re-rate the stock, the stock is likely to trade sideways in the meantime. A change in CEO should be noted as Pak Budi’s contract nears its end in 2016. We have a HOLD rating on BMRI with a Rp9,400 TP (1.7x FY16 BV). BBRI: Micro loan growth still a main driver, risk lies in KUR. We expect loan growth to pick up for BBRI in 2016 but there is downside risk to NIM as the 2016 KUR rates have yet to be finalised. If the subsidised KUR interest rate is raised to keep overall KUR lending yield at the same level as 2015, then NIM
Industry Focus
Indonesian Banks and Multifinance Companies
Page 9
should remain relatively stable. On a worst case scenario, NIM could fall by 40-50bps, which will push ROE lower by almost 2ppts closer to 18%. Our HOLD recommendation on BBRI is premised on this risk which we believe the market has not priced in. Our Rp10,200 TP is equivalent to 1.8x FY16 BV. BBNI: Over-optimistic in our view. After a kitchen sinking exercise in 2Q15, BBNI delivered a strong set of 3Q15 results. Targets appear to be high and above industry averages. We remain cautious on asset quality as its weak link still lies in the small commercial and medium loan segment and we noted that it has grown its medium segment loans quite rapidly YTD. Furthermore, the new management’s focus in the next three years is on corporate loans and is targeting to raise this composition to 50% (9M15: 44%) through more infrastructure and SOE loans, which may mean lower lending yields over time. We remain cautious on BBNI and have a HOLD rating with a Rp5,000 TP (1.3x FY16 BV). BBTN: Backed by government initiatives. The government’s housing programme would be the key impetus to BBTN’s growth in 2016. Among all the banks, BBTN is the most bullish. While growth prospects are positive, we are still concerned on its asset quality. The subsidised mortgage NPLs have improved and stabilised but what concerns us is the non-housing portfolio which is still accelerating and the non-subsidised mortgages NPLs which are starting to increase. We believe these would limit the share price movement hence our HOLD call and Rp1,080 TP. (0.8x FY16 BV). BTPN: Moderating growth outlook. We still like the business model of BTPN. BTPN continues to thrive on growth in the micro and productive poor segment albeit at a slower rate as its portfolio becomes more seasoned. In this current challenging operating environment, BTPN will exercise prudence and focus on asset quality over growth. The lower KUR rate could pose risks to BTPN’s micro loans business. Its saving grace is its Syariah business i.e. loans to the productive poor. We have a HOLD rating with a Rp3,000 TP. BTPN’s share price is limited by its low liquidity. PNBN: Conservatism caps growth. PNBN remains one of the most conservative banks to date. Such cautiousness and prudent credit policies are still followed today. Amid the
current sustained weakness in Indonesia’s macro outlook, it is no surprise that PNBN will grow its loans at a much slower pace than the industry. We believe that its conservatism is at the expense of growth, and hence our HOLD rating and Rp900TP. M&A euphoria could prove us wrong. BFIN: Watchful of growth and quality. BFIN’s unique proposition remains one of its key attributes. But in a challenging operating environment, even growth upside will be limited. BFIN indicated that it is currently over-funded due to slow financing demand. BFIN remains tight on credit control, focusing on early bucket collection. Our HOLD rating with Rp2,900 TP is premised on a challenging outlook. But we believe that a multifinance company such as BFIN can thrive when times are better as it serves the unbanked masses. BFIN, being the one of the larger non-bank owned multifinance companies, is an attractive M&A target. CFIN: Cautious on asset quality. While growth traction is largely intact albeit slower than the previous year, asset quality will be under pressure this year because of the slow economy and sustained weak commodity prices. CFIN has a larger exposure to the commodities-related sectors. Cost-to-income ratio and gearing are better than peers, but asset quality is a notch lower. This justifies our HOLD rating and Rp290 TP. ADMF continues to struggle with growth; used car segment is the silver lining. Adira’s new bookings have dropped by10% as of 8M15 because of the weak economy. The only segment still showing some growth is the used 4W. NPL ratio increased 30bps y-o-y to 1.7% as of August and ADMF is confident that it can manage NPLs to below 2%. ADMF continues to focus on the used segment of its portfolio for growth. The integration with Adira Quantum is also complete and ADMF will look for other opportunities for re-financing such as multipurpose loans in the future. ADMF believes that next year, the multifinance industry will show a slight pickup but growth will not be at historical double digit levels. We do not have a rating on ADMF, but it is an important subsidiary of BDMN and part of its transformation plan.

Industry Focus
Indonesian Banks and Multifinance Companies
Page 10
Indonesian Banks: Peer comparison
Banking Group Market cap
Price Target Price
Rating PE (x)
CAGR PBV (x)
ROE (%) Net div (%)
(US$bn) (Rp/s) (Rp/s) FY14A FY15F FY16F ^ (%) FY14A FY15F FY16F FY15F FY15F
Bank Central Asia 23,757 13,300 15,500 BUY 19.9x 18.4x 17.0x 8.0 4.2x 3.6x 3.2x 21.2% 1.5%
Bank Danamon 2,062 2,970 3,600 BUY 10.9x 11.1x 8.9x 10.7 0.9x 0.8x 0.8x 7.6% 2.8%
Bank Mandiri 15,045 8,900 9,400 HOLD 10.5x 12.1x 9.6x 4.3 2.0x 1.9x 1.6x 16.0% 2.4%
Bank Negara Indonesia 6,735 4,985 5,000 HOLD 8.6x 11.0x 8.3x 2.2 1.6x 1.4x 1.3x 13.6% 3.5%
Bank Rakyat Indonesia 20,151 11,275 10,200 HOLD 11.5x 11.4x 11.0x 2.0 2.9x 2.3x 2.0x 22.4% 1.7%
Bank Tabungan Negara 981 1,280 1,080 HOLD 11.9x 8.6x 7.3x 27.6 1.1x 1.0x 0.9x 12.0% 2.5% Bank Tabungan Pensiunan Nasional 1,090 2,575 3,000 HOLD 7.8x 7.6x 7.1x 4.7 1.2x 1.1x 0.9x 15.0% 0.0%
Panin Bank 1,501 860 900 HOLD 8.8x 10.6x 9.7x -4.6 1.0x 0.9x 0.8x 8.9% 0.0%
Weighted average 13.7x 13.8x 12.3x 5.0 2.9x 2.5x 2.1x 18.9% 1.9%
Simple average 11.2x 11.4x 9.9x 6.9 1.9x 1.6x 1.4x 14.6% 1.8%
Weighted average (ex BBCA) 10.6x 11.4x 9.9x 3.5 2.2x 1.9x 1.6x 17.7% 2.2%
Simple average (ex BBCA) 10.0x 10.4x 8.8x 6.7 1.5x 1.3x 1.2x 13.7% 1.8%
^ Refers to 2-year EPS CAGR for FY14-16F
Source: Companies, Bloomberg Finance L.P., DBS Bank Indonesian Multifinance Companies: Peer comparison
Banking Group Market cap
Price Target Price
Rating PE (x)
CAGR PBV (x)
ROE (%) Net div (%)
(US$bn) (Rp/s) (Rp/s) FY14A FY15F FY16F ^ (%) FY14A FY15F FY16F FY15F FY15F
Adira Dinamika Multifinance 680 3,545 NA NR 4.5x 8.2x 6.9x 14.4 0.9x 0.8x 0.7x 22.4% 17.5%
BFI Finance 281 2,475 2,900 HOLD 6.3x 6.6x 6.3x 0.8 1.0x 1.0x 0.9x 14.6% 6.4%
Clipan Finance 77 267 290 HOLD 2.5x 4.5x 3.6x 7.6 0.3x 0.3x 0.3x 12.3% 7.6%
Weighted average 4.8x 7.5x 6.5x 10.2 0.9x 0.8x 0.7x 19.6% 13.8%
Simple average 4.4x 6.5x 5.6x 7.6 0.7x 0.7x 0.6x 16.4% 10.5%
^ Refers to 2-year EPS CAGR for FY14-16F
Source: Companies, Bloomberg Finance L.P., DBS Bank

Industry Focus
Indonesian Banks and Multifinance Companies
Page 11
Company Guides
ASIAN INSIGHTS VICKERS SECURITIES ed: JS / sa: MA
BUY
Last Traded Price: Rp13,300 (JCI : 4,545.86) Price Target : Rp15,500 (17% upside) (Prev Rp14,100) Potential Catalyst: Sustained earnings and balance sheet quality Where we differ: Below consensus earnings likely due to our lower growth and more conservative cost of credit assumptions Analyst LIM Sue Lin +65 6682 3711 [email protected]
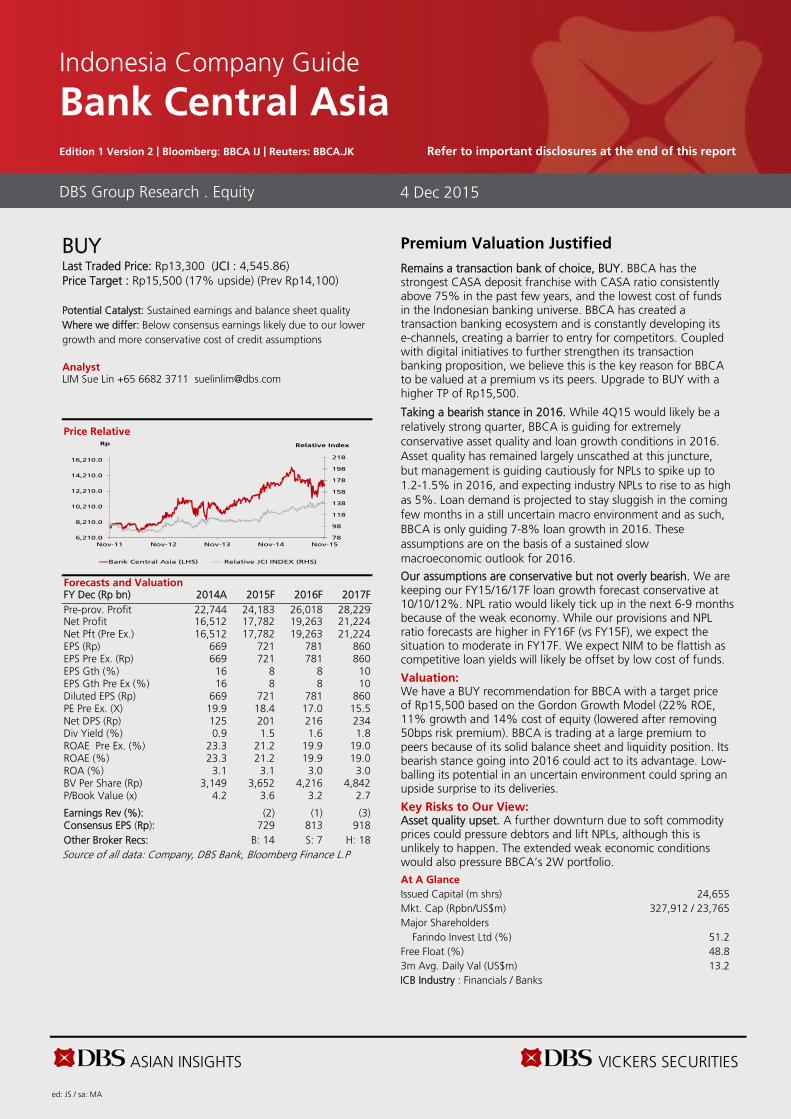
Price Relative
Forecasts and Valuation FY Dec (Rp bn) 2014A 2015F 2016F 2017F Pre-prov. Profit 22,744 24,183 26,018 28,229 Net Profit 16,512 17,782 19,263 21,224 Net Pft (Pre Ex.) 16,512 17,782 19,263 21,224 EPS (Rp) 669 721 781 860 EPS Pre Ex. (Rp) 669 721 781 860 EPS Gth (%) 16 8 8 10 EPS Gth Pre Ex (%) 16 8 8 10 Diluted EPS (Rp) 669 721 781 860 PE Pre Ex. (X) 19.9 18.4 17.0 15.5 Net DPS (Rp) 125 201 216 234 Div Yield (%) 0.9 1.5 1.6 1.8 ROAE Pre Ex. (%) 23.3 21.2 19.9 19.0 ROAE (%) 23.3 21.2 19.9 19.0 ROA (%) 3.1 3.1 3.0 3.0 BV Per Share (Rp) 3,149 3,652 4,216 4,842 P/Book Value (x) 4.2 3.6 3.2 2.7 Earnings Rev (%): (2) (1) (3) Consensus EPS (Rp): 729 813 918 Other Broker Recs: B: 14 S: 7 H: 18 Source of all data: Company, DBS Bank, Bloomberg Finance L.P
Premium Valuation Justified Remains a transaction bank of choice, BUY. BBCA has the strongest CASA deposit franchise with CASA ratio consistently above 75% in the past few years, and the lowest cost of funds in the Indonesian banking universe. BBCA has created a transaction banking ecosystem and is constantly developing its e-channels, creating a barrier to entry for competitors. Coupled with digital initiatives to further strengthen its transaction banking proposition, we believe this is the key reason for BBCA to be valued at a premium vs its peers. Upgrade to BUY with a higher TP of Rp15,500.
Taking a bearish stance in 2016. While 4Q15 would likely be a relatively strong quarter, BBCA is guiding for extremely conservative asset quality and loan growth conditions in 2016. Asset quality has remained largely unscathed at this juncture, but management is guiding cautiously for NPLs to spike up to 1.2-1.5% in 2016, and expecting industry NPLs to rise to as high as 5%. Loan demand is projected to stay sluggish in the coming few months in a still uncertain macro environment and as such, BBCA is only guiding 7-8% loan growth in 2016. These assumptions are on the basis of a sustained slow macroeconomic outlook for 2016.
Our assumptions are conservative but not overly bearish. We are keeping our FY15/16/17F loan growth forecast conservative at 10/10/12%. NPL ratio would likely tick up in the next 6-9 months because of the weak economy. While our provisions and NPL ratio forecasts are higher in FY16F (vs FY15F), we expect the situation to moderate in FY17F. We expect NIM to be flattish as competitive loan yields will likely be offset by low cost of funds.
Valuation: We have a BUY recommendation for BBCA with a target price of Rp15,500 based on the Gordon Growth Model (22% ROE, 11% growth and 14% cost of equity (lowered after removing 50bps risk premium). BBCA is trading at a large premium to peers because of its solid balance sheet and liquidity position. Its bearish stance going into 2016 could act to its advantage. Low-balling its potential in an uncertain environment could spring an upside surprise to its deliveries.
Key Risks to Our View: Asset quality upset. A further downturn due to soft commodity prices could pressure debtors and lift NPLs, although this is unlikely to happen. The extended weak economic conditions would also pressure BBCA’s 2W portfolio. At A Glance Issued Capital (m shrs) 24,655 Mkt. Cap (Rpbn/US$m)
327,912 / 23,765
Major Shareholders Farindo Invest Ltd (%) 51.2 Free Float (%) 48.8 3m Avg. Daily Val (US$m) 13.2 ICB Industry : Financials / Banks
DBS Group Research . Equity 4 Dec 2015
Indonesia Company Guide
Bank Central Asia Edition 1 Version 2 | Bloomberg: BBCA IJ | Reuters: BBCA.JK Refer to important disclosures at the end of this report
78
98
118
138
158
178
198
218
6,210.0
8,210.0
10,210.0
12,210.0
14,210.0
16,210.0
Nov-11 Nov-12 Nov-13 Nov-14 Nov-15
Relative IndexRp
Bank Central Asia (LHS) Relative JCI INDEX (RHS)
ASIAN INSIGHTS VICKERS SECURITIES Page 13
Company Guide
Bank Central Asia
CRITICAL DATA POINTS TO WATCH
Earnings Drivers:
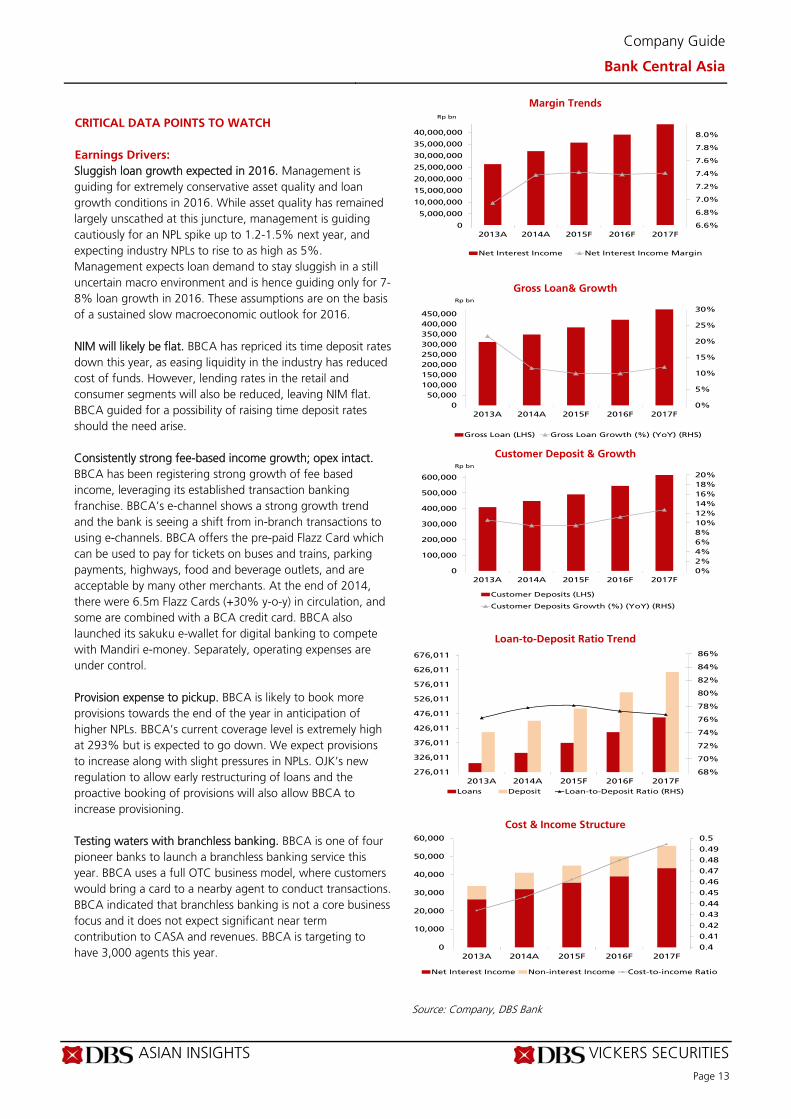
Sluggish loan growth expected in 2016. Management is guiding for extremely conservative asset quality and loan growth conditions in 2016. While asset quality has remained largely unscathed at this juncture, management is guiding cautiously for an NPL spike up to 1.2-1.5% next year, and expecting industry NPLs to rise to as high as 5%. Management expects loan demand to stay sluggish in a still uncertain macro environment and is hence guiding only for 7-8% loan growth in 2016. These assumptions are on the basis of a sustained slow macroeconomic outlook for 2016. NIM will likely be flat. BBCA has repriced its time deposit rates down this year, as easing liquidity in the industry has reduced cost of funds. However, lending rates in the retail and consumer segments will also be reduced, leaving NIM flat. BBCA guided for a possibility of raising time deposit rates should the need arise. Consistently strong fee-based income growth; opex intact. BBCA has been registering strong growth of fee based income, leveraging its established transaction banking franchise. BBCA’s e-channel shows a strong growth trend and the bank is seeing a shift from in-branch transactions to using e-channels. BBCA offers the pre-paid Flazz Card which can be used to pay for tickets on buses and trains, parking payments, highways, food and beverage outlets, and are acceptable by many other merchants. At the end of 2014, there were 6.5m Flazz Cards (+30% y-o-y) in circulation, and some are combined with a BCA credit card. BBCA also launched its sakuku e-wallet for digital banking to compete with Mandiri e-money. Separately, operating expenses are under control. Provision expense to pickup. BBCA is likely to book more provisions towards the end of the year in anticipation of higher NPLs. BBCA’s current coverage level is extremely high at 293% but is expected to go down. We expect provisions to increase along with slight pressures in NPLs. OJK’s new regulation to allow early restructuring of loans and the proactive booking of provisions will also allow BBCA to increase provisioning. Testing waters with branchless banking. BBCA is one of four pioneer banks to launch a branchless banking service this year. BBCA uses a full OTC business model, where customers would bring a card to a nearby agent to conduct transactions. BBCA indicated that branchless banking is not a core business focus and it does not expect significant near term contribution to CASA and revenues. BBCA is targeting to have 3,000 agents this year.
Margin Trends
Gross Loan& Growth
Customer Deposit & Growth
Loan-to-Deposit Ratio Trend
Cost & Income Structure
Source: Company, DBS Bank
6.6%
6.8%
7.0%
7.2%
7.4%
7.6%
7.8%
8.0%
0
5,000,000
10,000,000
15,000,000
20,000,000
25,000,000
30,000,000
35,000,000
40,000,000
2013A 2014A 2015F 2016F 2017F
Rp bn
Net Interest Income Net Interest Income Margin
0%
5%
10%
15%
20%
25%
30%
0
50,000
100,000
150,000
200,000
250,000
300,000
350,000
400,000
450,000
2013A 2014A 2015F 2016F 2017F
Rp bn
Gross Loan (LHS) Gross Loan Growth (%) (YoY) (RHS)
0%
2%
4%
6%
8%
10%
12%
14%
16%
18%
20%
0
100,000
200,000
300,000
400,000
500,000
600,000
2013A 2014A 2015F 2016F 2017F
Rp bn
Customer Deposits (LHS)
Customer Deposits Growth (%) (YoY) (RHS)
68%
70%
72%
74%
76%
78%
80%
82%
84%
86%
276,011
326,011
376,011
426,011
476,011
526,011
576,011
626,011
676,011
2013A 2014A 2015F 2016F 2017F
Loans Deposit Loan-to-Deposit Ratio (RHS)
0.4
0.41
0.42
0.43
0.44
0.45
0.46
0.47
0.48
0.49
0.5
0
10,000
20,000
30,000
40,000
50,000
60,000
2013A 2014A 2015F 2016F 2017F
Net Interest Income Non-interest Income Cost-to-income Ratio
ASIAN INSIGHTS VICKERS SECURITIES Page 14
Company Guide
Bank Central Asia
Balance Sheet:
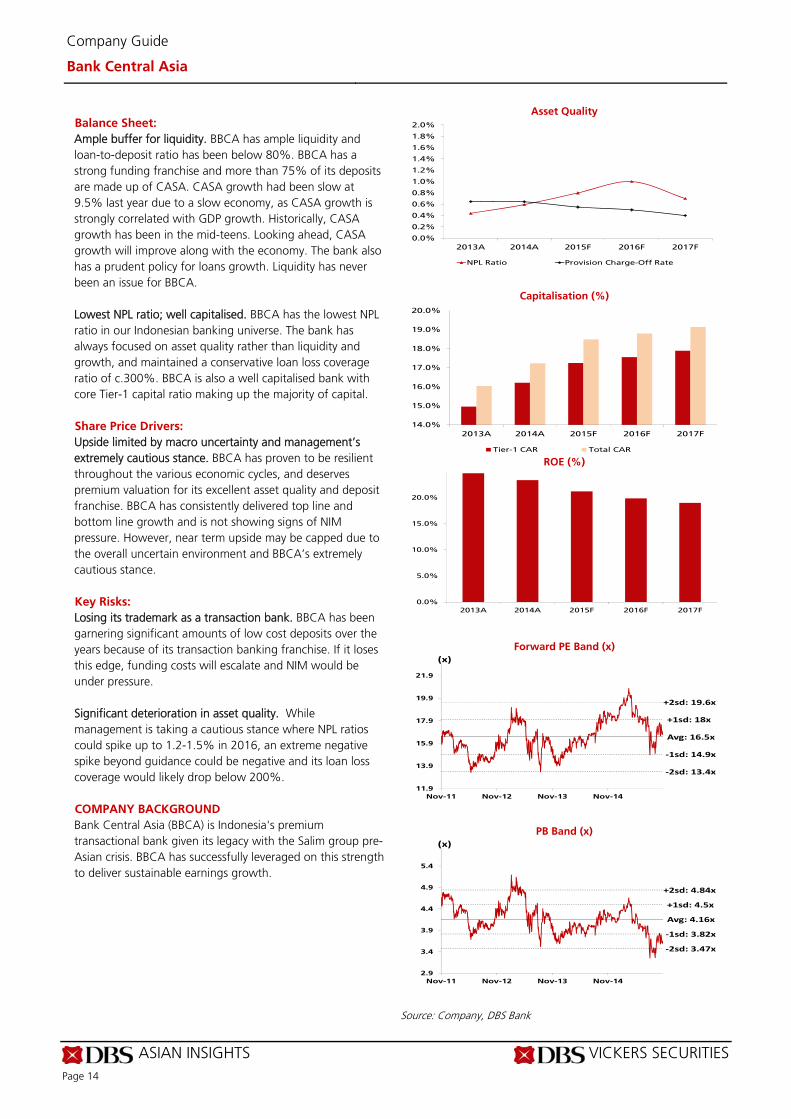
Ample buffer for liquidity. BBCA has ample liquidity and loan-to-deposit ratio has been below 80%. BBCA has a strong funding franchise and more than 75% of its deposits are made up of CASA. CASA growth had been slow at 9.5% last year due to a slow economy, as CASA growth is strongly correlated with GDP growth. Historically, CASA growth has been in the mid-teens. Looking ahead, CASA growth will improve along with the economy. The bank also has a prudent policy for loans growth. Liquidity has never been an issue for BBCA. Lowest NPL ratio; well capitalised. BBCA has the lowest NPL ratio in our Indonesian banking universe. The bank has always focused on asset quality rather than liquidity and growth, and maintained a conservative loan loss coverage ratio of c.300%. BBCA is also a well capitalised bank with core Tier-1 capital ratio making up the majority of capital. Share Price Drivers:
Upside limited by macro uncertainty and management’s extremely cautious stance. BBCA has proven to be resilient throughout the various economic cycles, and deserves premium valuation for its excellent asset quality and deposit franchise. BBCA has consistently delivered top line and bottom line growth and is not showing signs of NIM pressure. However, near term upside may be capped due to the overall uncertain environment and BBCA’s extremely cautious stance. Key Risks:
Losing its trademark as a transaction bank. BBCA has been garnering significant amounts of low cost deposits over the years because of its transaction banking franchise. If it loses this edge, funding costs will escalate and NIM would be under pressure. Significant deterioration in asset quality. While management is taking a cautious stance where NPL ratios could spike up to 1.2-1.5% in 2016, an extreme negative spike beyond guidance could be negative and its loan loss coverage would likely drop below 200%. COMPANY BACKGROUND
Bank Central Asia (BBCA) is Indonesia's premium transactional bank given its legacy with the Salim group pre-Asian crisis. BBCA has successfully leveraged on this strength to deliver sustainable earnings growth.
Asset Quality
Capitalisation (%)
ROE (%)
Forward PE Band (x)
PB Band (x)
Source: Company, DBS Bank
0.0%
0.2%
0.4%
0.6%
0.8%
1.0%
1.2%
1.4%
1.6%
1.8%
2.0%
2013A 2014A 2015F 2016F 2017F
NPL Ratio Provision Charge-Off Rate
14.0%
15.0%
16.0%
17.0%
18.0%
19.0%
20.0%
2013A 2014A 2015F 2016F 2017F
Tier-1 CAR Total CAR
0.0%
5.0%
10.0%
15.0%
20.0%
2013A 2014A 2015F 2016F 2017F
Avg: 16.5x
+1sd: 18x
+2sd: 19.6x
‐1sd: 14.9x
‐2sd: 13.4x
11.9
13.9
15.9
17.9
19.9
21.9
Nov-11 Nov-12 Nov-13 Nov-14
(x)
Avg: 4.16x
+1sd: 4.5x
+2sd: 4.84x
‐1sd: 3.82x
‐2sd: 3.47x
2.9
3.4
3.9
4.4
4.9
5.4
Nov-11 Nov-12 Nov-13 Nov-14
(x)
ASIAN INSIGHTS VICKERS SECURITIES Page 15
Company Guide
Bank Central Asia
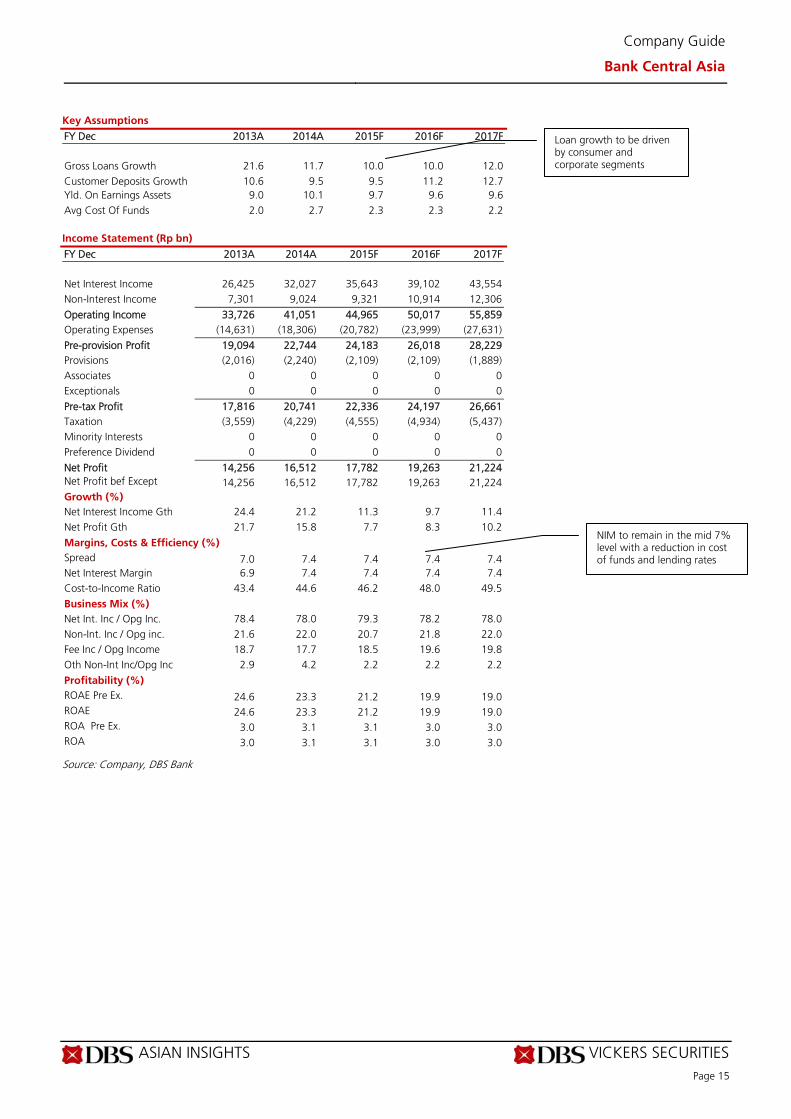
Key Assumptions
FY Dec 2013A 2014A 2015F 2016F 2017F
Gross Loans Growth 21.6 11.7 10.0 10.0 12.0 Customer Deposits Growth 10.6 9.5 9.5 11.2 12.7 Yld. On Earnings Assets 9.0 10.1 9.7 9.6 9.6 Avg Cost Of Funds 2.0 2.7 2.3 2.3 2.2 Income Statement (Rp bn)
FY Dec 2013A 2014A 2015F 2016F 2017F Net Interest Income 26,425 32,027 35,643 39,102 43,554 Non-Interest Income 7,301 9,024 9,321 10,914 12,306
Operating Income 33,726 41,051 44,965 50,017 55,859 Operating Expenses (14,631) (18,306) (20,782) (23,999) (27,631)
Pre-provision Profit 19,094 22,744 24,183 26,018 28,229 Provisions (2,016) (2,240) (2,109) (2,109) (1,889) Associates 0 0 0 0 0 Exceptionals 0 0 0 0 0
Pre-tax Profit 17,816 20,741 22,336 24,197 26,661 Taxation (3,559) (4,229) (4,555) (4,934) (5,437) Minority Interests 0 0 0 0 0 Preference Dividend 0 0 0 0 0
Net Profit 14,256 16,512 17,782 19,263 21,224 Net Profit bef Except 14,256 16,512 17,782 19,263 21,224 Growth (%) Net Interest Income Gth 24.4 21.2 11.3 9.7 11.4 Net Profit Gth 21.7 15.8 7.7 8.3 10.2
Margins, Costs & Efficiency (%) Spread 7.0 7.4 7.4 7.4 7.4 Net Interest Margin 6.9 7.4 7.4 7.4 7.4 Cost-to-Income Ratio 43.4 44.6 46.2 48.0 49.5
Business Mix (%) Net Int. Inc / Opg Inc. 78.4 78.0 79.3 78.2 78.0 Non-Int. Inc / Opg inc. 21.6 22.0 20.7 21.8 22.0 Fee Inc / Opg Income 18.7 17.7 18.5 19.6 19.8 Oth Non-Int Inc/Opg Inc 2.9 4.2 2.2 2.2 2.2
Profitability (%) ROAE Pre Ex. 24.6 23.3 21.2 19.9 19.0 ROAE 24.6 23.3 21.2 19.9 19.0 ROA Pre Ex. 3.0 3.1 3.1 3.0 3.0 ROA 3.0 3.1 3.1 3.0 3.0
Source: Company, DBS Bank
Loan growth to be driven by consumer and corporate segments
NIM to remain in the mid 7% level with a reduction in cost of funds and lending rates
ASIAN INSIGHTS VICKERS SECURITIES Page 16
Company Guide
Bank Central Asia
Quarterly / Interim Income Statement (Rp bn)
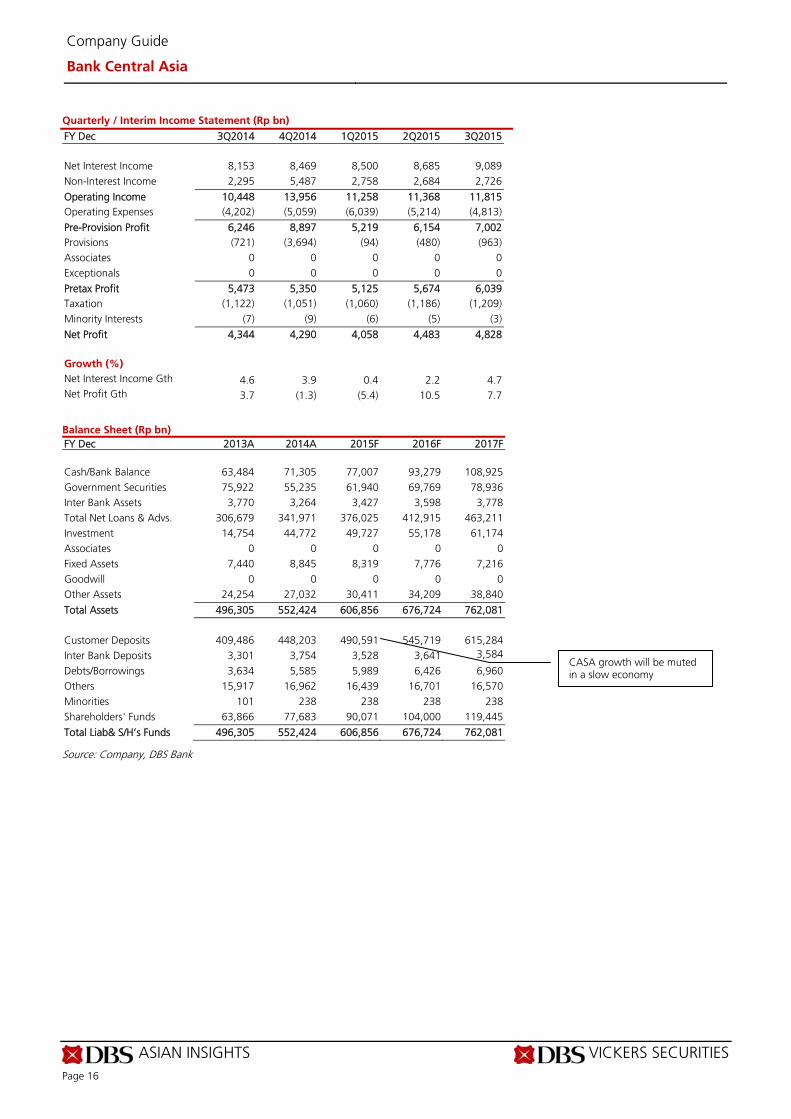
FY Dec 3Q2014 4Q2014 1Q2015 2Q2015 3Q2015 Net Interest Income 8,153 8,469 8,500 8,685 9,089 Non-Interest Income 2,295 5,487 2,758 2,684 2,726
Operating Income 10,448 13,956 11,258 11,368 11,815 Operating Expenses (4,202) (5,059) (6,039) (5,214) (4,813)
Pre-Provision Profit 6,246 8,897 5,219 6,154 7,002 Provisions (721) (3,694) (94) (480) (963) Associates 0 0 0 0 0 Exceptionals 0 0 0 0 0
Pretax Profit 5,473 5,350 5,125 5,674 6,039 Taxation (1,122) (1,051) (1,060) (1,186) (1,209) Minority Interests (7) (9) (6) (5) (3)
Net Profit 4,344 4,290 4,058 4,483 4,828 Growth (%) Net Interest Income Gth 4.6 3.9 0.4 2.2 4.7 Net Profit Gth 3.7 (1.3) (5.4) 10.5 7.7
Balance Sheet (Rp bn)
FY Dec 2013A 2014A 2015F 2016F 2017F Cash/Bank Balance 63,484 71,305 77,007 93,279 108,925 Government Securities 75,922 55,235 61,940 69,769 78,936 Inter Bank Assets 3,770 3,264 3,427 3,598 3,778 Total Net Loans & Advs. 306,679 341,971 376,025 412,915 463,211 Investment 14,754 44,772 49,727 55,178 61,174 Associates 0 0 0 0 0 Fixed Assets 7,440 8,845 8,319 7,776 7,216 Goodwill 0 0 0 0 0 Other Assets 24,254 27,032 30,411 34,209 38,840
Total Assets 496,305 552,424 606,856 676,724 762,081 Customer Deposits 409,486 448,203 490,591 545,719 615,284 Inter Bank Deposits 3,301 3,754 3,528 3,641 3,584
Debts/Borrowings 3,634 5,585 5,989 6,426 6,960 Others 15,917 16,962 16,439 16,701 16,570 Minorities 101 238 238 238 238 Shareholders' Funds 63,866 77,683 90,071 104,000 119,445
Total Liab& S/H’s Funds 496,305 552,424 606,856 676,724 762,081
Source: Company, DBS Bank
CASA growth will be muted in a slow economy

ASIAN INSIGHTS VICKERS SECURITIES Page 17
Company Guide
Bank Central Asia
Financial Stability Measures (%)
FY Dec 2013A 2014A 2015F 2016F 2017F Balance Sheet Structure Loan-to-Deposit Ratio 76.3 77.8 78.2 77.3 76.8 Net Loans / Total Assets 61.8 61.9 62.0 61.0 60.8 Investment / Total Assets 3.0 8.1 8.2 8.2 8.0 Cust . Dep./Int. Bear. Liab. 99.1 98.8 98.8 98.8 98.9 Interbank Dep / Int. Bear. 0.8 0.8 0.7 0.7 0.6
Asset Quality NPL / Total Gross Loans 0.4 0.6 0.8 1.0 0.7 NPL / Total Assets 0.3 0.4 0.5 0.6 0.4 Loan Loss Reserve Coverage 408.8 324.2 243.2 210.2 275.7
Provision Charge-Off Rate 0.6 0.6 0.6 0.5 0.4
Capital Strength Total CAR 16.0 17.2 18.5 18.8 19.1 Tier-1 CAR 15.0 16.2 17.3 17.6 17.9
Source: Company, DBS Bank Target Price & Ratings History
Source: Company, DBS Bank
S.No. DateClosing
PriceT arget Price
Rat ing
1 09 Jan 15 12925.00 12500.00 HOLD
2 06 Mar 15 14600 12500 HOLD
3 09 Mar 15 14375 14100 HOLD
4 17 Mar 15 14100 14100 HOLD
5 30 Apr 15 13475 14100 HOLD
6 25 Jun 15 13475 14100 HOLD
7 02 Jul 15 13600 14000 HOLD
8 15 Jul 15 13500 14000 HOLD
9 06 Aug 15 13800 14000 HOLD
10 10 Aug 15 13850 14000 HOLD
11 03 Sep 15 12300 14300 BUY
12 30 Sep 15 12275 14300 BUY
13 29 Oct 15 13150 14100 HOLD
2
34
5
6 78 91011
12 13
10735
11735
12735
13735
14735
15735
Nov-14 Mar-15 Jul-15 Nov-15
Rp
Asset quality will remain comparatively strong; it is the main priority for the bank this year
Ample liquidity
ASIAN INSIGHTS VICKERS SECURITIES ed: JS / sa: MA
BUY
Last Traded Price: Rp2,970 (JCI : 4,545.86) Price Target : Rp3,600 (21% upside) Potential Catalyst: Transformation plans materialise under new CEO Where we differ: We are among the few brokers bullish on Danamon’s turnaround story; expect turnaround to be visible by FY17F Analyst LIM Sue Lin +65 6682 3711 [email protected]
Price Relative
Forecasts and Valuation FY Dec (Rp bn) 2014A 2015F 2016F 2017F Pre-prov. Profit 8,049 8,412 9,343 10,954 Net Profit 2,604 2,550 3,190 4,191 Net Pft (Pre Ex.) 2,604 2,550 3,190 4,191 EPS (Rp) 273 267 334 439 EPS Pre Ex. (Rp) 273 267 334 439 EPS Gth (%) (36) (2) 25 31 EPS Gth Pre Ex (%) (36) (2) 25 31 Diluted EPS (Rp) 273 267 334 439 PE Pre Ex. (X) 10.9 11.1 8.9 6.8 Net DPS (Rp) 127 82 80 100 Div Yield (%) 4.3 2.8 2.7 3.4 ROAE Pre Ex. (%) 8.1 7.6 8.9 10.8 ROAE (%) 8.1 7.6 8.9 10.8 ROA (%) 1.4 1.3 1.5 1.8 BV Per Share (Rp) 3,435 3,630 3,884 4,223 P/Book Value (x) 0.9 0.8 0.8 0.7 Earnings Rev (%): 0 0 0 Consensus EPS (Rp): 276 348 462 Other Broker Recs: B: 4 S: 10 H: 13 Source of all data: Company, DBS Bank, Bloomberg Finance L.P
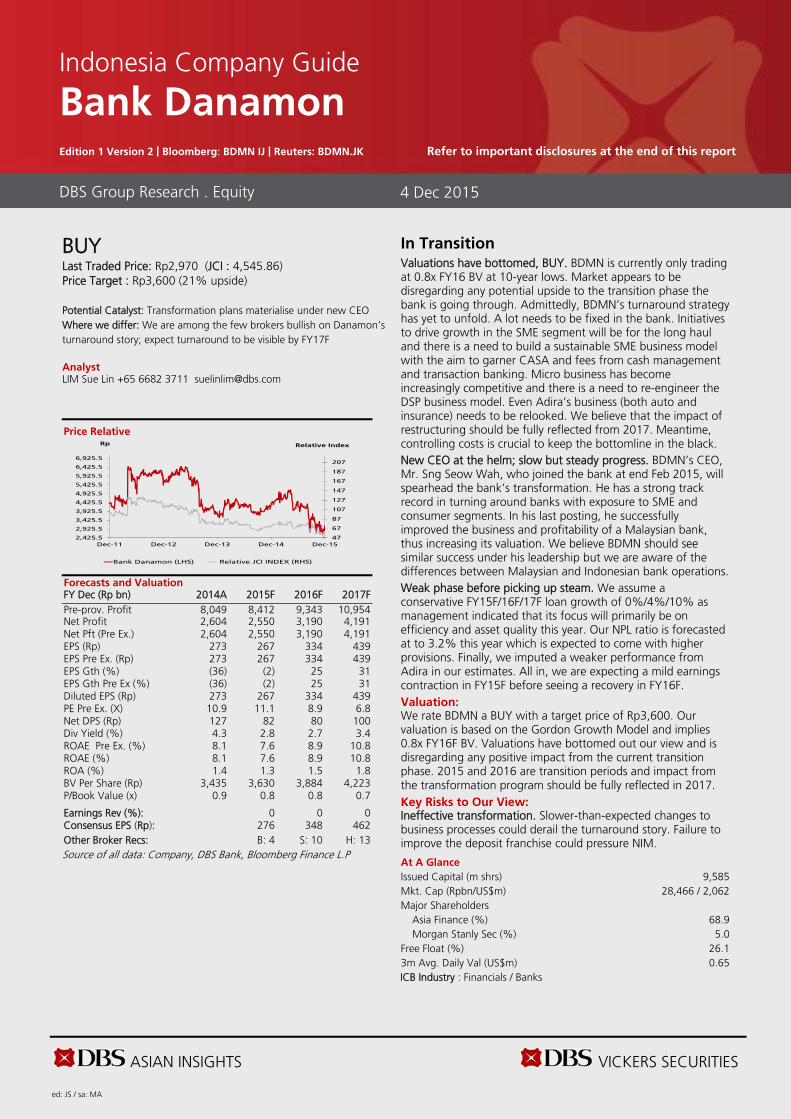
In Transition Valuations have bottomed, BUY. BDMN is currently only trading at 0.8x FY16 BV at 10-year lows. Market appears to be disregarding any potential upside to the transition phase the bank is going through. Admittedly, BDMN’s turnaround strategy has yet to unfold. A lot needs to be fixed in the bank. Initiatives to drive growth in the SME segment will be for the long haul and there is a need to build a sustainable SME business model with the aim to garner CASA and fees from cash management and transaction banking. Micro business has become increasingly competitive and there is a need to re-engineer the DSP business model. Even Adira’s business (both auto and insurance) needs to be relooked. We believe that the impact of restructuring should be fully reflected from 2017. Meantime, controlling costs is crucial to keep the bottomline in the black. New CEO at the helm; slow but steady progress. BDMN’s CEO, Mr. Sng Seow Wah, who joined the bank at end Feb 2015, will spearhead the bank’s transformation. He has a strong track record in turning around banks with exposure to SME and consumer segments. In his last posting, he successfully improved the business and profitability of a Malaysian bank, thus increasing its valuation. We believe BDMN should see similar success under his leadership but we are aware of the differences between Malaysian and Indonesian bank operations. Weak phase before picking up steam. We assume a conservative FY15F/16F/17F loan growth of 0%/4%/10% as management indicated that its focus will primarily be on efficiency and asset quality this year. Our NPL ratio is forecasted at to 3.2% this year which is expected to come with higher provisions. Finally, we imputed a weaker performance from Adira in our estimates. All in, we are expecting a mild earnings contraction in FY15F before seeing a recovery in FY16F. Valuation: We rate BDMN a BUY with a target price of Rp3,600. Our valuation is based on the Gordon Growth Model and implies 0.8x FY16F BV. Valuations have bottomed out our view and is disregarding any positive impact from the current transition phase. 2015 and 2016 are transition periods and impact from the transformation program should be fully reflected in 2017. Key Risks to Our View: Ineffective transformation. Slower-than-expected changes to business processes could derail the turnaround story. Failure to improve the deposit franchise could pressure NIM.
At A Glance Issued Capital (m shrs) 9,585 Mkt. Cap (Rpbn/US$m)
28,466 / 2,062
Major Shareholders Asia Finance (%) 68.9 Morgan Stanly Sec (%) 5.0 Free Float (%) 26.1 3m Avg. Daily Val (US$m) 0.65 ICB Industry : Financials / Banks
DBS Group Research . Equity 4 Dec 2015
Indonesia Company Guide
Bank Danamon Edition 1 Version 2 | Bloomberg: BDMN IJ | Reuters: BDMN.JK Refer to important disclosures at the end of this report
47
67
87
107
127
147
167
187
207
2,425.5
2,925.5
3,425.5
3,925.5
4,425.5
4,925.5
5,425.5
5,925.5
6,425.5
6,925.5
Dec-11 Dec-12 Dec-13 Dec-14 Dec-15
Relative IndexRp
Bank Danamon (LHS) Relative JCI INDEX (RHS)
ASIAN INSIGHTS VICKERS SECURITIES Page 19
Company Guide
Bank Danamon
CRITICAL DATA POINTS TO WATCH
Earnings Drivers:
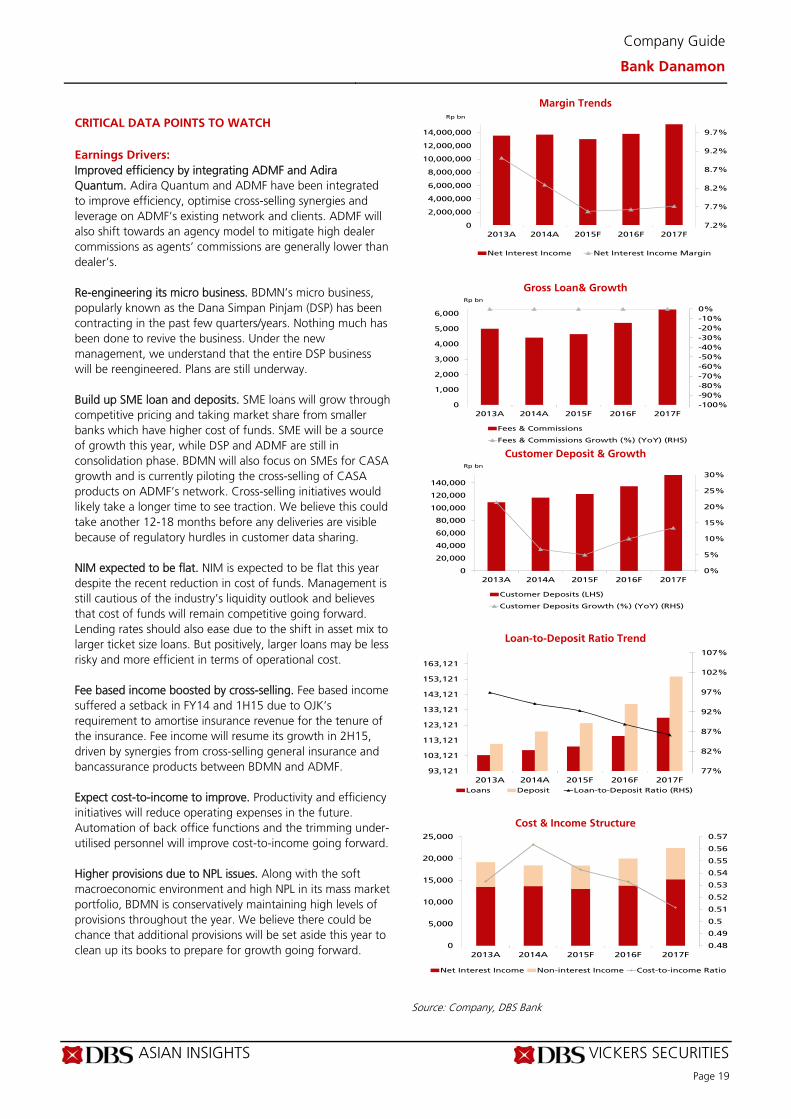
Improved efficiency by integrating ADMF and Adira Quantum. Adira Quantum and ADMF have been integrated to improve efficiency, optimise cross-selling synergies and leverage on ADMF’s existing network and clients. ADMF will also shift towards an agency model to mitigate high dealer commissions as agents’ commissions are generally lower than dealer’s. Re-engineering its micro business. BDMN’s micro business, popularly known as the Dana Simpan Pinjam (DSP) has been contracting in the past few quarters/years. Nothing much has been done to revive the business. Under the new management, we understand that the entire DSP business will be reengineered. Plans are still underway. Build up SME loan and deposits. SME loans will grow through competitive pricing and taking market share from smaller banks which have higher cost of funds. SME will be a source of growth this year, while DSP and ADMF are still in consolidation phase. BDMN will also focus on SMEs for CASA growth and is currently piloting the cross-selling of CASA products on ADMF’s network. Cross-selling initiatives would likely take a longer time to see traction. We believe this could take another 12-18 months before any deliveries are visible because of regulatory hurdles in customer data sharing. NIM expected to be flat. NIM is expected to be flat this year despite the recent reduction in cost of funds. Management is still cautious of the industry’s liquidity outlook and believes that cost of funds will remain competitive going forward. Lending rates should also ease due to the shift in asset mix to larger ticket size loans. But positively, larger loans may be less risky and more efficient in terms of operational cost. Fee based income boosted by cross-selling. Fee based income suffered a setback in FY14 and 1H15 due to OJK’s requirement to amortise insurance revenue for the tenure of the insurance. Fee income will resume its growth in 2H15, driven by synergies from cross-selling general insurance and bancassurance products between BDMN and ADMF. Expect cost-to-income to improve. Productivity and efficiency initiatives will reduce operating expenses in the future. Automation of back office functions and the trimming under-utilised personnel will improve cost-to-income going forward. Higher provisions due to NPL issues. Along with the soft macroeconomic environment and high NPL in its mass market portfolio, BDMN is conservatively maintaining high levels of provisions throughout the year. We believe there could be chance that additional provisions will be set aside this year to clean up its books to prepare for growth going forward.
Margin Trends
Gross Loan& Growth
Customer Deposit & Growth
Loan-to-Deposit Ratio Trend
Cost & Income Structure
Source: Company, DBS Bank
7.2%
7.7%
8.2%
8.7%
9.2%
9.7%
0
2,000,000
4,000,000
6,000,000
8,000,000
10,000,000
12,000,000
14,000,000
2013A 2014A 2015F 2016F 2017F
Rp bn
Net Interest Income Net Interest Income Margin
-100%
-90%
-80%
-70%
-60%
-50%
-40%
-30%
-20%
-10%
0%
0
1,000
2,000
3,000
4,000
5,000
6,000
2013A 2014A 2015F 2016F 2017F
Rp bn
Fees & Commissions
Fees & Commissions Growth (%) (YoY) (RHS)
0%
5%
10%
15%
20%
25%
30%
0
20,000
40,000
60,000
80,000
100,000
120,000
140,000
2013A 2014A 2015F 2016F 2017F
Rp bn
Customer Deposits (LHS)
Customer Deposits Growth (%) (YoY) (RHS)
77%
82%
87%
92%
97%
102%
107%
93,121
103,121
113,121
123,121
133,121
143,121
153,121
163,121
2013A 2014A 2015F 2016F 2017F
Loans Deposit Loan-to-Deposit Ratio (RHS)
0.48
0.49
0.5
0.51
0.52
0.53
0.54
0.55
0.56
0.57
0
5,000
10,000
15,000
20,000
25,000
2013A 2014A 2015F 2016F 2017F
Net Interest Income Non-interest Income Cost-to-income Ratio

ASIAN INSIGHTS VICKERS SECURITIES Page 20
Company Guide
Bank Danamon
Balance Sheet:
Liquidity still a challenge; enhancing funding franchise is key. Management indicated that liquidity will remain tight in the near future, but would remain manageable at bank level with LDR expected to stay at 90-92%. Management will continue to grow its CASA funding franchise through SME customers. ADMF is now less dependent on BDMN’s joint financing scheme and will utilise other funding sources such as bank borrowings, bonds and MTN. Focus on improving asset quality. BDMN has struggled with coal mining and related loans. Mass market loans are also pressuring NPLs. SME loans are better managed and NPLs are below industry levels. BDMN will focus on improving NPLs with stricter approval of loans and change in business process. Asset quality may still be under pressure this year due to the slower loan growth and tough macroeconomic conditions. Share Price Drivers:
New CEO a hidden catalyst. The new CEO, Mr Sng Seow Wah has a strong track record in turning around banks with exposure to SME and consumer segments. He had successfully improved the business and profitability of a Malaysian bank, thus increasing its valuation. He also initiated a high dividend payout ratio policy to share the bank’s success with shareholders. We believe BDMN should see similar success under his leadership but we would give a discount to the parameters after taking into account the different operating environment in Indonesia. Key Risks:
Ineffective transformation deliveries. This would be mainly slower-than-expected changes in business processes and the new business model being ineffective. But these changes will take time and resources to implement. Failure of the transformation program will not only impact operations and profitability, but the opportunity cost would magnify the impact. The other key risks for BDMN are failure to maintain liquidity and weaker-than-expected deposit growth since its loan-to-deposit ratio has always been high. COMPANY BACKGROUND
Bank Danamon (BDMN) is the fifth biggest bank in Indonesia by assets. The bank focuses on mass market loans with its Danamon Simpan Pinjam. BDMN is aided by its 95% owned multifinance arm Adira Finance for auto loans.
Asset Quality
Capitalisation (%)
ROE (%)
Forward PE Band (x)
PB Band (x)
Source: Company, DBS Bank
1.0%
1.5%
2.0%
2.5%
3.0%
3.5%
4.0%
4.5%
5.0%
2013A 2014A 2015F 2016F 2017F
NPL Ratio Provision Charge-Off Rate
16.0%
16.5%
17.0%
17.5%
18.0%
2013A 2014A 2015F 2016F 2017F
Tier-1 CAR Total CAR
0.0%
2.0%
4.0%
6.0%
8.0%
10.0%
12.0%
2013A 2014A 2015F 2016F 2017F
Avg: 14.2x
+1sd: 16.3x
+2sd: 18.5x
‐1sd: 12x
‐2sd: 9.9x
7.4
9.4
11.4
13.4
15.4
17.4
19.4
Dec-11 Dec-12 Dec-13 Dec-14 Dec-15
(x)
Avg: 1.51x
+1sd: 1.91x
+2sd: 2.31x
‐1sd: 1.11x
‐2sd: 0.71x0.6
0.8
1.0
1.2
1.4
1.6
1.8
2.0
2.2
2.4
2.6
Dec-11 Dec-12 Dec-13 Dec-14 Dec-15
(x)
ASIAN INSIGHTS VICKERS SECURITIES Page 21
Company Guide
Bank Danamon
Key Assumptions
FY Dec 2013A 2014A 2015F 2016F 2017F
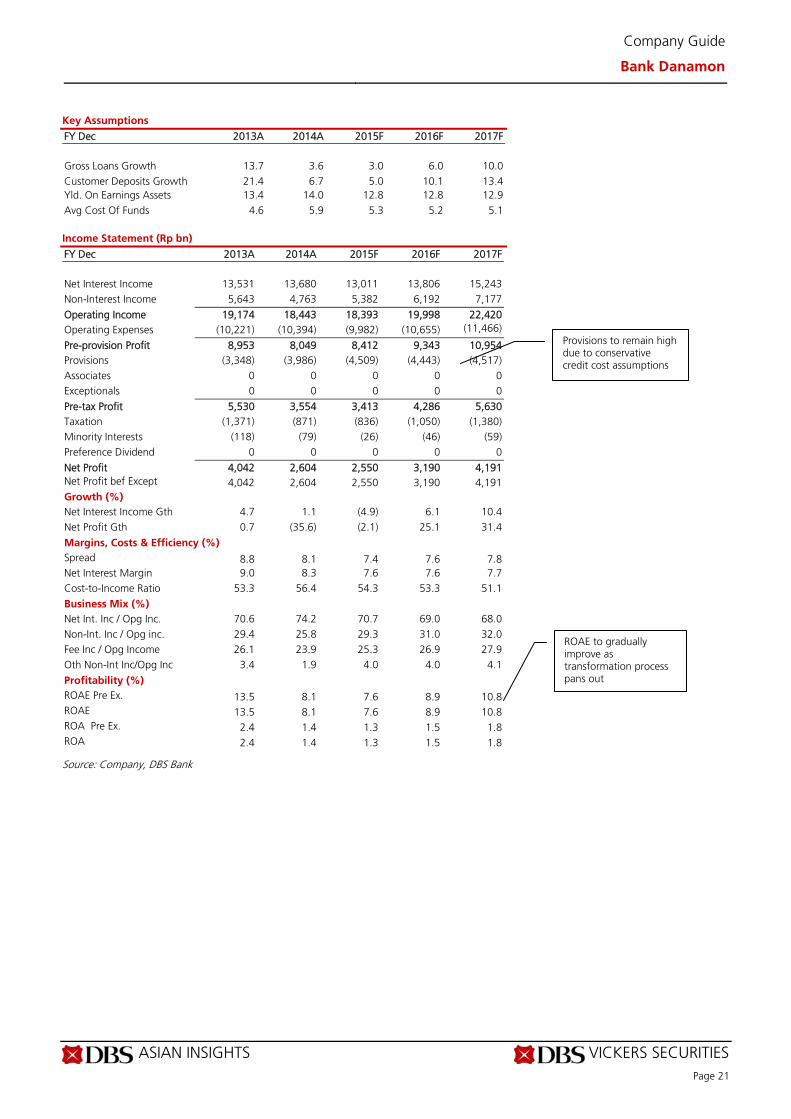
Gross Loans Growth 13.7 3.6 3.0 6.0 10.0 Customer Deposits Growth 21.4 6.7 5.0 10.1 13.4 Yld. On Earnings Assets 13.4 14.0 12.8 12.8 12.9 Avg Cost Of Funds 4.6 5.9 5.3 5.2 5.1 Income Statement (Rp bn)
FY Dec 2013A 2014A 2015F 2016F 2017F Net Interest Income 13,531 13,680 13,011 13,806 15,243 Non-Interest Income 5,643 4,763 5,382 6,192 7,177
Operating Income 19,174 18,443 18,393 19,998 22,420 Operating Expenses (10,221) (10,394) (9,982) (10,655) (11,466)
Pre-provision Profit 8,953 8,049 8,412 9,343 10,954 Provisions (3,348) (3,986) (4,509) (4,443) (4,517) Associates 0 0 0 0 0 Exceptionals 0 0 0 0 0
Pre-tax Profit 5,530 3,554 3,413 4,286 5,630 Taxation (1,371) (871) (836) (1,050) (1,380) Minority Interests (118) (79) (26) (46) (59) Preference Dividend 0 0 0 0 0
Net Profit 4,042 2,604 2,550 3,190 4,191 Net Profit bef Except 4,042 2,604 2,550 3,190 4,191 Growth (%) Net Interest Income Gth 4.7 1.1 (4.9) 6.1 10.4 Net Profit Gth 0.7 (35.6) (2.1) 25.1 31.4
Margins, Costs & Efficiency (%) Spread 8.8 8.1 7.4 7.6 7.8 Net Interest Margin 9.0 8.3 7.6 7.6 7.7 Cost-to-Income Ratio 53.3 56.4 54.3 53.3 51.1
Business Mix (%) Net Int. Inc / Opg Inc. 70.6 74.2 70.7 69.0 68.0 Non-Int. Inc / Opg inc. 29.4 25.8 29.3 31.0 32.0 Fee Inc / Opg Income 26.1 23.9 25.3 26.9 27.9 Oth Non-Int Inc/Opg Inc 3.4 1.9 4.0 4.0 4.1
Profitability (%) ROAE Pre Ex. 13.5 8.1 7.6 8.9 10.8 ROAE 13.5 8.1 7.6 8.9 10.8 ROA Pre Ex. 2.4 1.4 1.3 1.5 1.8 ROA 2.4 1.4 1.3 1.5 1.8
Source: Company, DBS Bank
Provisions to remain high due to conservative credit cost assumptions
ROAE to gradually improve as transformation process pans out
ASIAN INSIGHTS VICKERS SECURITIES Page 22
Company Guide
Bank Danamon
Quarterly / Interim Income Statement (Rp bn)
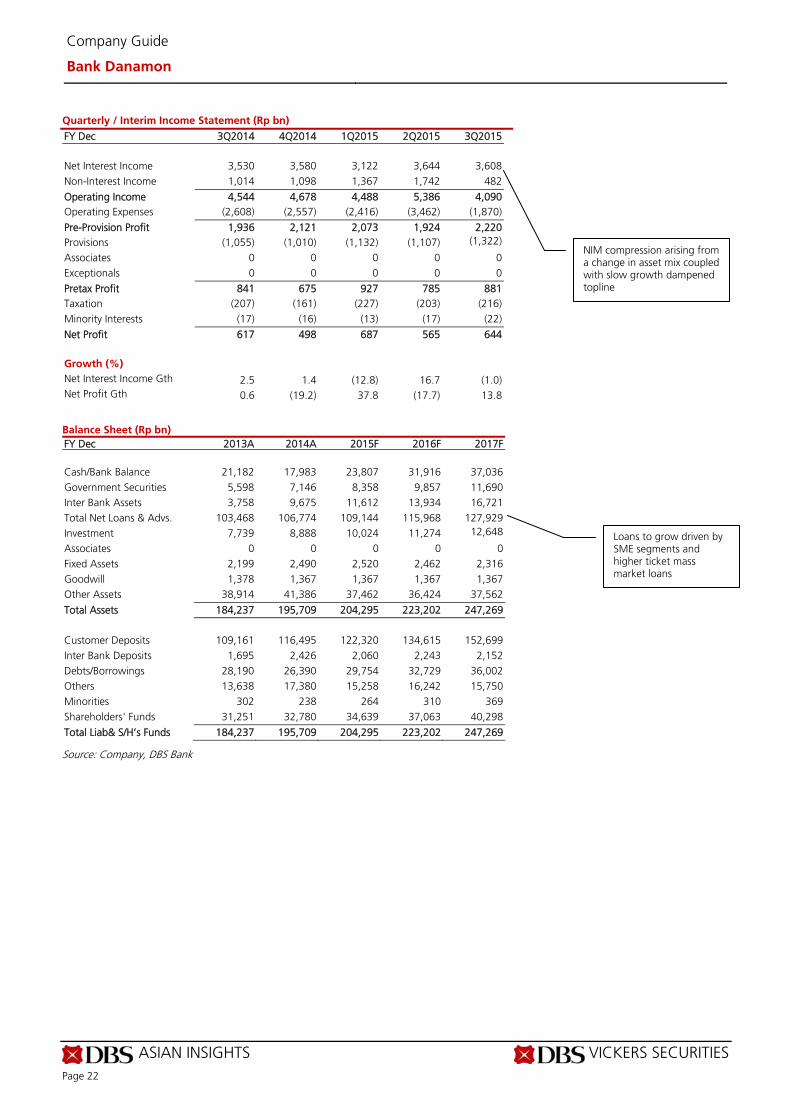
FY Dec 3Q2014 4Q2014 1Q2015 2Q2015 3Q2015 Net Interest Income 3,530 3,580 3,122 3,644 3,608 Non-Interest Income 1,014 1,098 1,367 1,742 482
Operating Income 4,544 4,678 4,488 5,386 4,090 Operating Expenses (2,608) (2,557) (2,416) (3,462) (1,870)
Pre-Provision Profit 1,936 2,121 2,073 1,924 2,220 Provisions (1,055) (1,010) (1,132) (1,107) (1,322)
Associates 0 0 0 0 0 Exceptionals 0 0 0 0 0
Pretax Profit 841 675 927 785 881 Taxation (207) (161) (227) (203) (216) Minority Interests (17) (16) (13) (17) (22)
Net Profit 617 498 687 565 644 Growth (%) Net Interest Income Gth 2.5 1.4 (12.8) 16.7 (1.0) Net Profit Gth 0.6 (19.2) 37.8 (17.7) 13.8
Balance Sheet (Rp bn)
FY Dec 2013A 2014A 2015F 2016F 2017F Cash/Bank Balance 21,182 17,983 23,807 31,916 37,036 Government Securities 5,598 7,146 8,358 9,857 11,690 Inter Bank Assets 3,758 9,675 11,612 13,934 16,721 Total Net Loans & Advs. 103,468 106,774 109,144 115,968 127,929 Investment 7,739 8,888 10,024 11,274 12,648
Associates 0 0 0 0 0 Fixed Assets 2,199 2,490 2,520 2,462 2,316 Goodwill 1,378 1,367 1,367 1,367 1,367 Other Assets 38,914 41,386 37,462 36,424 37,562
Total Assets 184,237 195,709 204,295 223,202 247,269 Customer Deposits 109,161 116,495 122,320 134,615 152,699 Inter Bank Deposits 1,695 2,426 2,060 2,243 2,152 Debts/Borrowings 28,190 26,390 29,754 32,729 36,002 Others 13,638 17,380 15,258 16,242 15,750 Minorities 302 238 264 310 369 Shareholders' Funds 31,251 32,780 34,639 37,063 40,298
Total Liab& S/H’s Funds 184,237 195,709 204,295 223,202 247,269
Source: Company, DBS Bank
NIM compression arising from a change in asset mix coupled with slow growth dampened topline
Loans to grow driven by SME segments and higher ticket mass market loans
ASIAN INSIGHTS VICKERS SECURITIES Page 23
Company Guide
Bank Danamon
Financial Stability Measures (%)
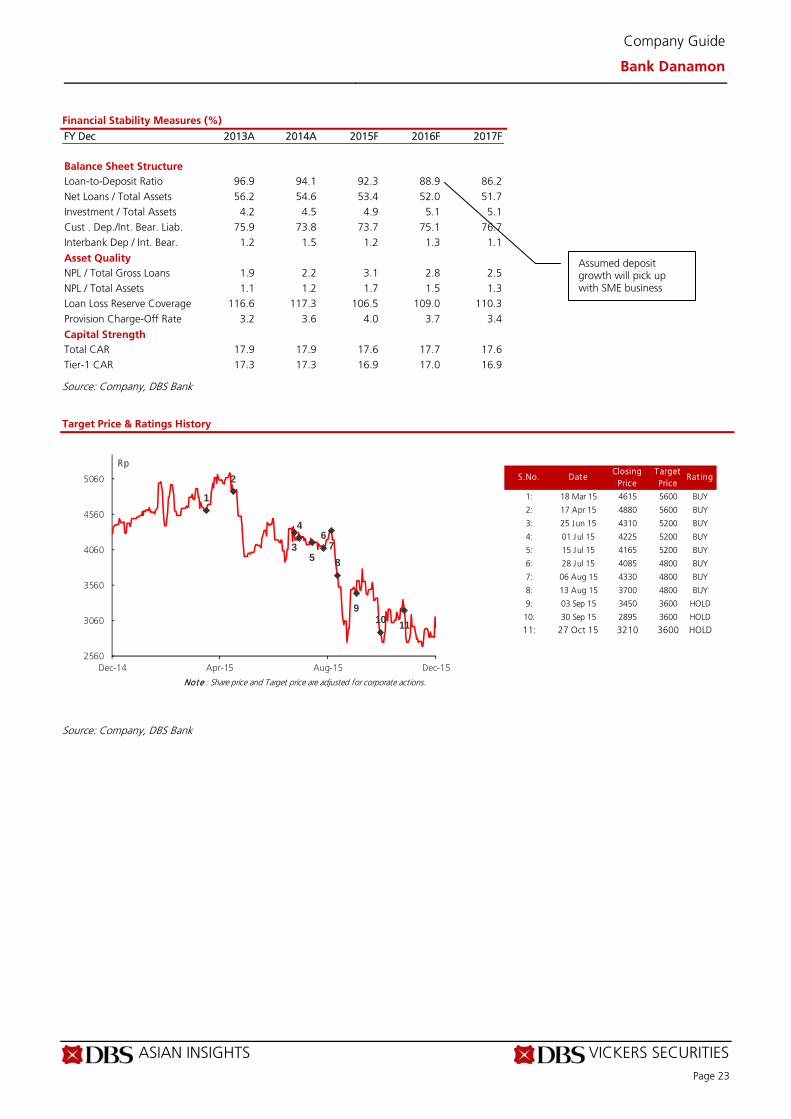
FY Dec 2013A 2014A 2015F 2016F 2017F Balance Sheet Structure Loan-to-Deposit Ratio 96.9 94.1 92.3 88.9 86.2 Net Loans / Total Assets 56.2 54.6 53.4 52.0 51.7 Investment / Total Assets 4.2 4.5 4.9 5.1 5.1 Cust . Dep./Int. Bear. Liab. 75.9 73.8 73.7 75.1 76.7 Interbank Dep / Int. Bear. 1.2 1.5 1.2 1.3 1.1
Asset Quality NPL / Total Gross Loans 1.9 2.2 3.1 2.8 2.5 NPL / Total Assets 1.1 1.2 1.7 1.5 1.3 Loan Loss Reserve Coverage 116.6 117.3 106.5 109.0 110.3 Provision Charge-Off Rate 3.2 3.6 4.0 3.7 3.4
Capital Strength Total CAR 17.9 17.9 17.6 17.7 17.6 Tier-1 CAR 17.3 17.3 16.9 17.0 16.9
Source: Company, DBS Bank Target Price & Ratings History
Source: Company, DBS Bank
S.No. DateClosing
PriceTarget Price
Rat ing
1: 18 Mar 15 4615 5600 BUY
2: 17 Apr 15 4880 5600 BUY
3: 25 Jun 15 4310 5200 BUY
4: 01 Jul 15 4225 5200 BUY
5: 15 Jul 15 4165 5200 BUY
6: 28 Jul 15 4085 4800 BUY
7: 06 Aug 15 4330 4800 BUY
8: 13 Aug 15 3700 4800 BUY
9: 03 Sep 15 3450 3600 HOLD
10: 30 Sep 15 2895 3600 HOLD
11: 27 Oct 15 3210 3600 HOLD
Note : Share price and Target price are adjusted for corporate actions.
1
2
3
4
5
67
8
910 11
2560
3060
3560
4060
4560
5060
Dec-14 Apr-15 Aug-15 Dec-15
Rp
Assumed deposit growth will pick up with SME business
ASIAN INSIGHTS VICKERS SECURITIES ed: SGC / sa: MA
HOLD
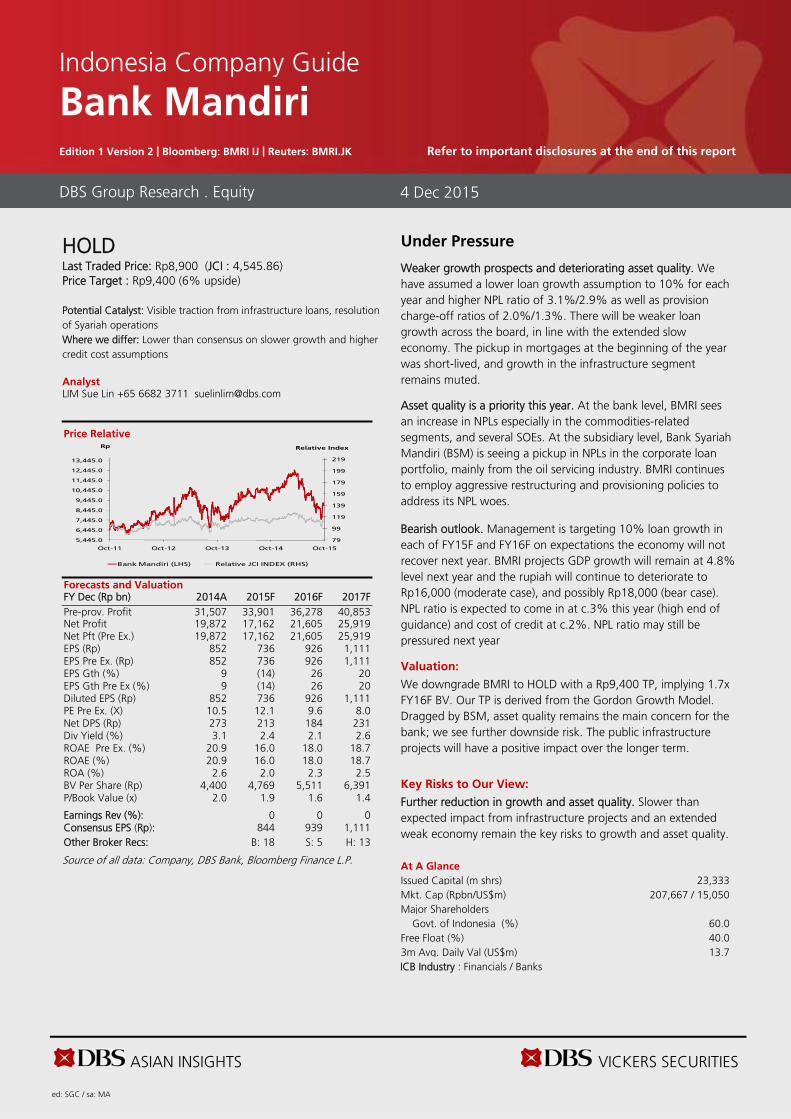
Last Traded Price: Rp8,900 (JCI : 4,545.86) Price Target : Rp9,400 (6% upside) Potential Catalyst: Visible traction from infrastructure loans, resolution of Syariah operations Where we differ: Lower than consensus on slower growth and higher credit cost assumptions Analyst LIM Sue Lin +65 6682 3711 [email protected]
Price Relative
Forecasts and Valuation FY Dec (Rp bn) 2014A 2015F 2016F 2017F Pre-prov. Profit 31,507 33,901 36,278 40,853 Net Profit 19,872 17,162 21,605 25,919 Net Pft (Pre Ex.) 19,872 17,162 21,605 25,919 EPS (Rp) 852 736 926 1,111 EPS Pre Ex. (Rp) 852 736 926 1,111 EPS Gth (%) 9 (14) 26 20 EPS Gth Pre Ex (%) 9 (14) 26 20 Diluted EPS (Rp) 852 736 926 1,111 PE Pre Ex. (X) 10.5 12.1 9.6 8.0 Net DPS (Rp) 273 213 184 231 Div Yield (%) 3.1 2.4 2.1 2.6 ROAE Pre Ex. (%) 20.9 16.0 18.0 18.7 ROAE (%) 20.9 16.0 18.0 18.7 ROA (%) 2.6 2.0 2.3 2.5 BV Per Share (Rp) 4,400 4,769 5,511 6,391 P/Book Value (x) 2.0 1.9 1.6 1.4 Earnings Rev (%): 0 0 0 Consensus EPS (Rp): 844 939 1,111 Other Broker Recs: B: 18 S: 5 H: 13
Source of all data: Company, DBS Bank, Bloomberg Finance L.P.
Under Pressure
Weaker growth prospects and deteriorating asset quality. We have assumed a lower loan growth assumption to 10% for each year and higher NPL ratio of 3.1%/2.9% as well as provision charge-off ratios of 2.0%/1.3%. There will be weaker loan growth across the board, in line with the extended slow economy. The pickup in mortgages at the beginning of the year was short-lived, and growth in the infrastructure segment remains muted.
Asset quality is a priority this year. At the bank level, BMRI sees an increase in NPLs especially in the commodities-related segments, and several SOEs. At the subsidiary level, Bank Syariah Mandiri (BSM) is seeing a pickup in NPLs in the corporate loan portfolio, mainly from the oil servicing industry. BMRI continues to employ aggressive restructuring and provisioning policies to address its NPL woes.
Bearish outlook. Management is targeting 10% loan growth in each of FY15F and FY16F on expectations the economy will not recover next year. BMRI projects GDP growth will remain at 4.8% level next year and the rupiah will continue to deteriorate to Rp16,000 (moderate case), and possibly Rp18,000 (bear case). NPL ratio is expected to come in at c.3% this year (high end of guidance) and cost of credit at c.2%. NPL ratio may still be pressured next year
Valuation:
We downgrade BMRI to HOLD with a Rp9,400 TP, implying 1.7x FY16F BV. Our TP is derived from the Gordon Growth Model. Dragged by BSM, asset quality remains the main concern for the bank; we see further downside risk. The public infrastructure projects will have a positive impact over the longer term.
Key Risks to Our View:
Further reduction in growth and asset quality. Slower than expected impact from infrastructure projects and an extended weak economy remain the key risks to growth and asset quality. At A Glance Issued Capital (m shrs) 23,333 Mkt. Cap (Rpbn/US$m) 207,667 / 15,050 Major Shareholders Govt. of Indonesia (%) 60.0 Free Float (%) 40.0 3m Avg. Daily Val (US$m) 13.7 ICB Industry : Financials / Banks
DBS Group Research . Equity 4 Dec 2015
Indonesia Company Guide
Bank Mandiri Edition 1 Version 2 | Bloomberg: BMRI IJ | Reuters: BMRI.JK Refer to important disclosures at the end of this report
79
99
119
139
159
179
199
219
5,445.0
6,445.0
7,445.0
8,445.0
9,445.0
10,445.0
11,445.0
12,445.0
13,445.0
Oct-11 Oct-12 Oct-13 Oct-14 Oct-15
Relative IndexRp
Bank Mandiri (LHS) Relative JCI INDEX (RHS)
ASIAN INSIGHTS VICKERS SECURITIES Page 25
Company Guide
Bank Mandiri
CRITICAL DATA POINTS TO WATCH
Earnings Drivers:
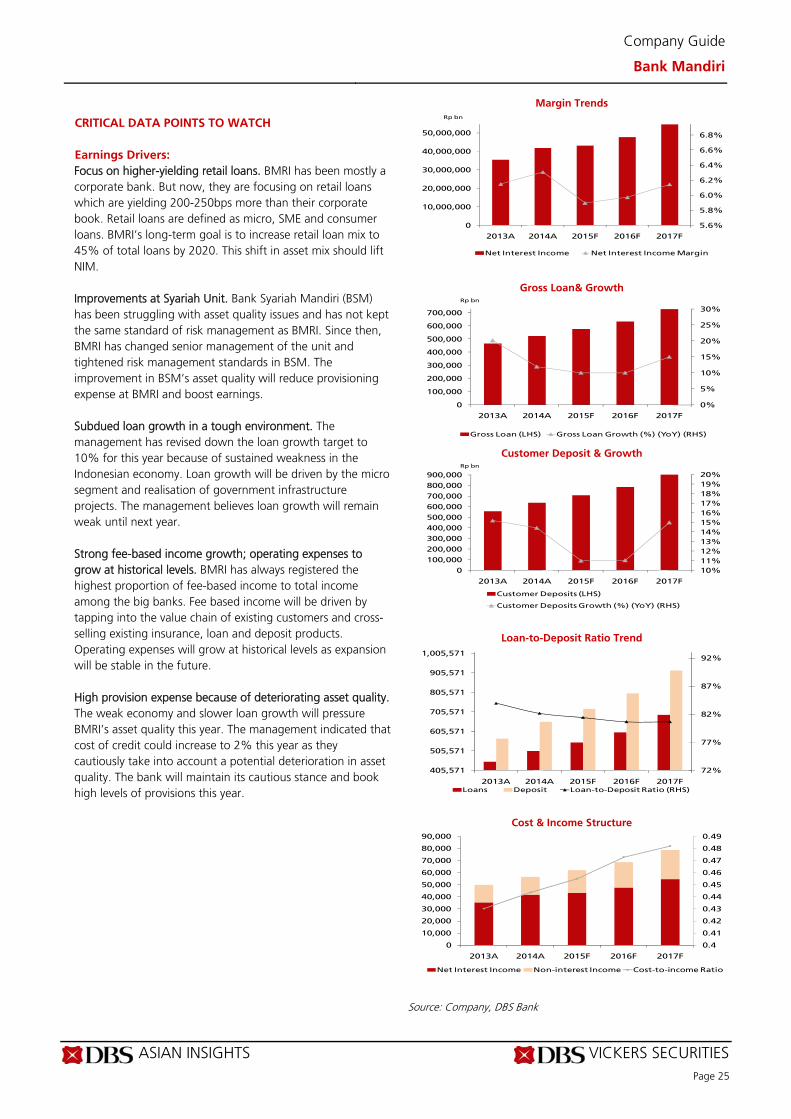
Focus on higher-yielding retail loans. BMRI has been mostly a corporate bank. But now, they are focusing on retail loans which are yielding 200-250bps more than their corporate book. Retail loans are defined as micro, SME and consumer loans. BMRI’s long-term goal is to increase retail loan mix to 45% of total loans by 2020. This shift in asset mix should lift NIM. Improvements at Syariah Unit. Bank Syariah Mandiri (BSM) has been struggling with asset quality issues and has not kept the same standard of risk management as BMRI. Since then, BMRI has changed senior management of the unit and tightened risk management standards in BSM. The improvement in BSM’s asset quality will reduce provisioning expense at BMRI and boost earnings. Subdued loan growth in a tough environment. The management has revised down the loan growth target to 10% for this year because of sustained weakness in the Indonesian economy. Loan growth will be driven by the micro segment and realisation of government infrastructure projects. The management believes loan growth will remain weak until next year. Strong fee-based income growth; operating expenses to grow at historical levels. BMRI has always registered the highest proportion of fee-based income to total income among the big banks. Fee based income will be driven by tapping into the value chain of existing customers and cross-selling existing insurance, loan and deposit products. Operating expenses will grow at historical levels as expansion will be stable in the future. High provision expense because of deteriorating asset quality. The weak economy and slower loan growth will pressure BMRI’s asset quality this year. The management indicated that cost of credit could increase to 2% this year as they cautiously take into account a potential deterioration in asset quality. The bank will maintain its cautious stance and book high levels of provisions this year.
Margin Trends
Gross Loan& Growth
Customer Deposit & Growth
Loan-to-Deposit Ratio Trend
Cost & Income Structure
Source: Company, DBS Bank
5.6%
5.8%
6.0%
6.2%
6.4%
6.6%
6.8%
0
10,000,000
20,000,000
30,000,000
40,000,000
50,000,000
2013A 2014A 2015F 2016F 2017F
Rp bn
Net Interest Income Net Interest Income Margin
0%
5%
10%
15%
20%
25%
30%
0
100,000
200,000
300,000
400,000
500,000
600,000
700,000
2013A 2014A 2015F 2016F 2017F
Rp bn
Gross Loan (LHS) Gross Loan Growth (%) (YoY) (RHS)
10%
11%
12%
13%
14%
15%
16%
17%
18%
19%
20%
0
100,000
200,000
300,000
400,000
500,000
600,000
700,000
800,000
900,000
2013A 2014A 2015F 2016F 2017F
Rp bn
Customer Deposits (LHS)
Customer Deposits Growth (%) (YoY) (RHS)
72%
77%
82%
87%
92%
405,571
505,571
605,571
705,571
805,571
905,571
1,005,571
2013A 2014A 2015F 2016F 2017FLoans Deposit Loan-to-Deposit Ratio (RHS)
0.4
0.41
0.42
0.43
0.44
0.45
0.46
0.47
0.48
0.49
0
10,000
20,000
30,000
40,000
50,000
60,000
70,000
80,000
90,000
2013A 2014A 2015F 2016F 2017F
Net Interest Income Non-interest Income Cost-to-income Ratio
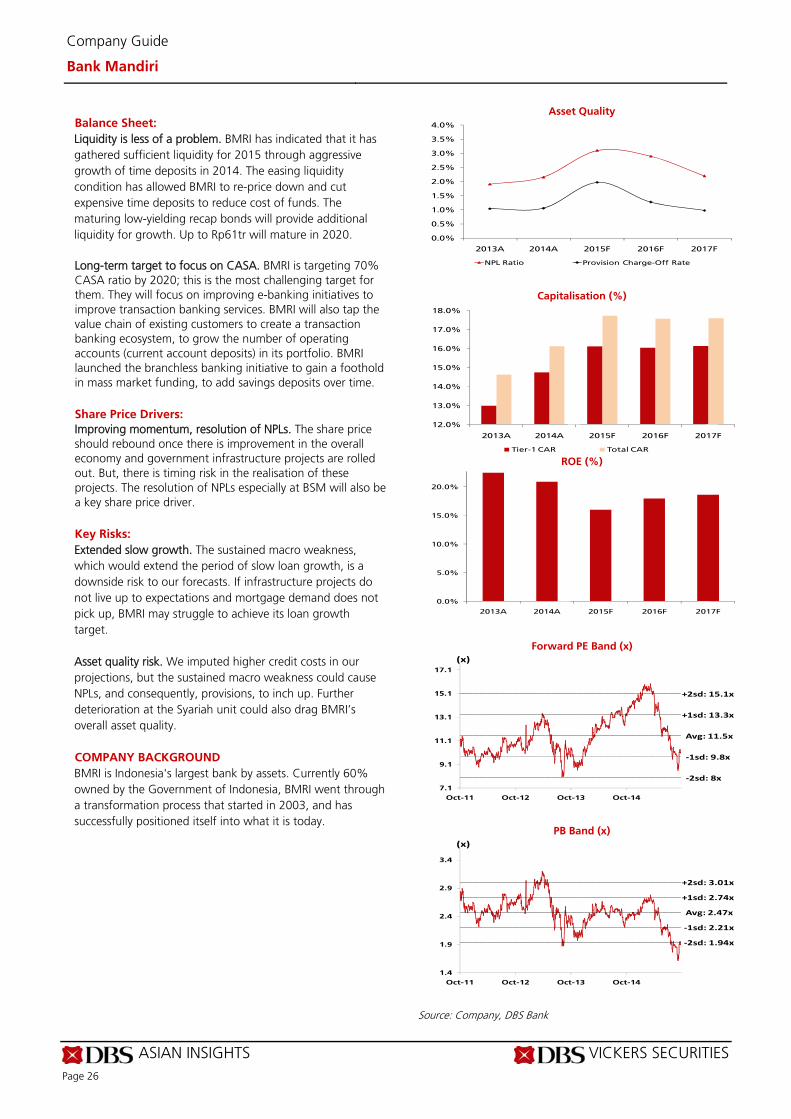
ASIAN INSIGHTS VICKERS SECURITIES Page 26
Company Guide
Bank Mandiri
Balance Sheet:
Liquidity is less of a problem. BMRI has indicated that it has gathered sufficient liquidity for 2015 through aggressive growth of time deposits in 2014. The easing liquidity condition has allowed BMRI to re-price down and cut expensive time deposits to reduce cost of funds. The maturing low-yielding recap bonds will provide additional liquidity for growth. Up to Rp61tr will mature in 2020. Long-term target to focus on CASA. BMRI is targeting 70% CASA ratio by 2020; this is the most challenging target for them. They will focus on improving e-banking initiatives to improve transaction banking services. BMRI will also tap the value chain of existing customers to create a transaction banking ecosystem, to grow the number of operating accounts (current account deposits) in its portfolio. BMRI launched the branchless banking initiative to gain a foothold in mass market funding, to add savings deposits over time.
Share Price Drivers:
Improving momentum, resolution of NPLs. The share price should rebound once there is improvement in the overall economy and government infrastructure projects are rolled out. But, there is timing risk in the realisation of these projects. The resolution of NPLs especially at BSM will also be a key share price driver. Key Risks:
Extended slow growth. The sustained macro weakness, which would extend the period of slow loan growth, is a downside risk to our forecasts. If infrastructure projects do not live up to expectations and mortgage demand does not pick up, BMRI may struggle to achieve its loan growth target. Asset quality risk. We imputed higher credit costs in our projections, but the sustained macro weakness could cause NPLs, and consequently, provisions, to inch up. Further deterioration at the Syariah unit could also drag BMRI’s overall asset quality. COMPANY BACKGROUND
BMRI is Indonesia's largest bank by assets. Currently 60% owned by the Government of Indonesia, BMRI went through a transformation process that started in 2003, and has successfully positioned itself into what it is today.
Asset Quality
Capitalisation (%)
ROE (%)
Forward PE Band (x)
PB Band (x)
Source: Company, DBS Bank
0.0%
0.5%
1.0%
1.5%
2.0%
2.5%
3.0%
3.5%
4.0%
2013A 2014A 2015F 2016F 2017F
NPL Ratio Provision Charge-Off Rate
12.0%
13.0%
14.0%
15.0%
16.0%
17.0%
18.0%
2013A 2014A 2015F 2016F 2017F
Tier-1 CAR Total CAR
0.0%
5.0%
10.0%
15.0%
20.0%
2013A 2014A 2015F 2016F 2017F
Avg: 11.5x
+1sd: 13.3x
+2sd: 15.1x
‐1sd: 9.8x
‐2sd: 8x7.1
9.1
11.1
13.1
15.1
17.1
Oct-11 Oct-12 Oct-13 Oct-14
(x)
Avg: 2.47x
+1sd: 2.74x
+2sd: 3.01x
‐1sd: 2.21x
‐2sd: 1.94x
1.4
1.9
2.4
2.9
3.4
Oct-11 Oct-12 Oct-13 Oct-14
(x)
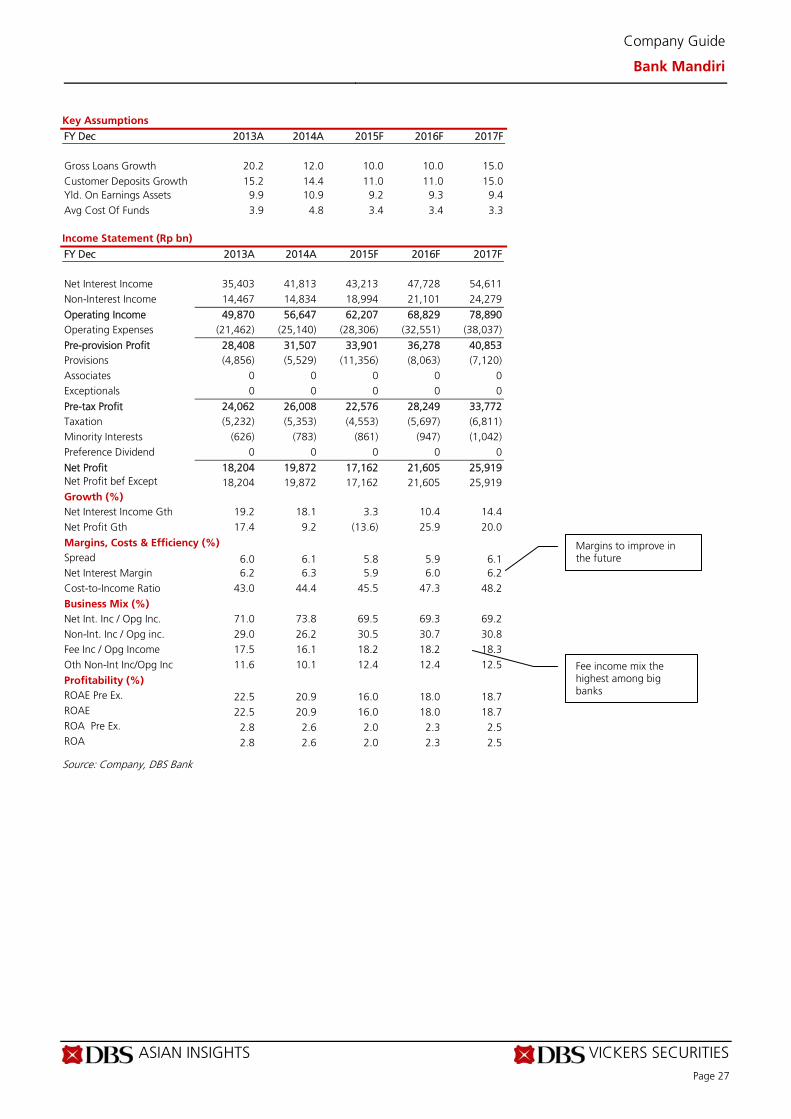
ASIAN INSIGHTS VICKERS SECURITIES Page 27
Company Guide
Bank Mandiri
Key Assumptions
FY Dec 2013A 2014A 2015F 2016F 2017F
Gross Loans Growth 20.2 12.0 10.0 10.0 15.0 Customer Deposits Growth 15.2 14.4 11.0 11.0 15.0 Yld. On Earnings Assets 9.9 10.9 9.2 9.3 9.4 Avg Cost Of Funds 3.9 4.8 3.4 3.4 3.3 Income Statement (Rp bn)
FY Dec 2013A 2014A 2015F 2016F 2017F Net Interest Income 35,403 41,813 43,213 47,728 54,611 Non-Interest Income 14,467 14,834 18,994 21,101 24,279
Operating Income 49,870 56,647 62,207 68,829 78,890 Operating Expenses (21,462) (25,140) (28,306) (32,551) (38,037)
Pre-provision Profit 28,408 31,507 33,901 36,278 40,853 Provisions (4,856) (5,529) (11,356) (8,063) (7,120) Associates 0 0 0 0 0 Exceptionals 0 0 0 0 0
Pre-tax Profit 24,062 26,008 22,576 28,249 33,772 Taxation (5,232) (5,353) (4,553) (5,697) (6,811) Minority Interests (626) (783) (861) (947) (1,042) Preference Dividend 0 0 0 0 0
Net Profit 18,204 19,872 17,162 21,605 25,919 Net Profit bef Except 18,204 19,872 17,162 21,605 25,919 Growth (%) Net Interest Income Gth 19.2 18.1 3.3 10.4 14.4 Net Profit Gth 17.4 9.2 (13.6) 25.9 20.0
Margins, Costs & Efficiency (%) Spread 6.0 6.1 5.8 5.9 6.1 Net Interest Margin 6.2 6.3 5.9 6.0 6.2 Cost-to-Income Ratio 43.0 44.4 45.5 47.3 48.2
Business Mix (%) Net Int. Inc / Opg Inc. 71.0 73.8 69.5 69.3 69.2 Non-Int. Inc / Opg inc. 29.0 26.2 30.5 30.7 30.8 Fee Inc / Opg Income 17.5 16.1 18.2 18.2 18.3 Oth Non-Int Inc/Opg Inc 11.6 10.1 12.4 12.4 12.5
Profitability (%) ROAE Pre Ex. 22.5 20.9 16.0 18.0 18.7 ROAE 22.5 20.9 16.0 18.0 18.7 ROA Pre Ex. 2.8 2.6 2.0 2.3 2.5 ROA 2.8 2.6 2.0 2.3 2.5
Source: Company, DBS Bank
Margins to improve in the future
Fee income mix the highest among big banks
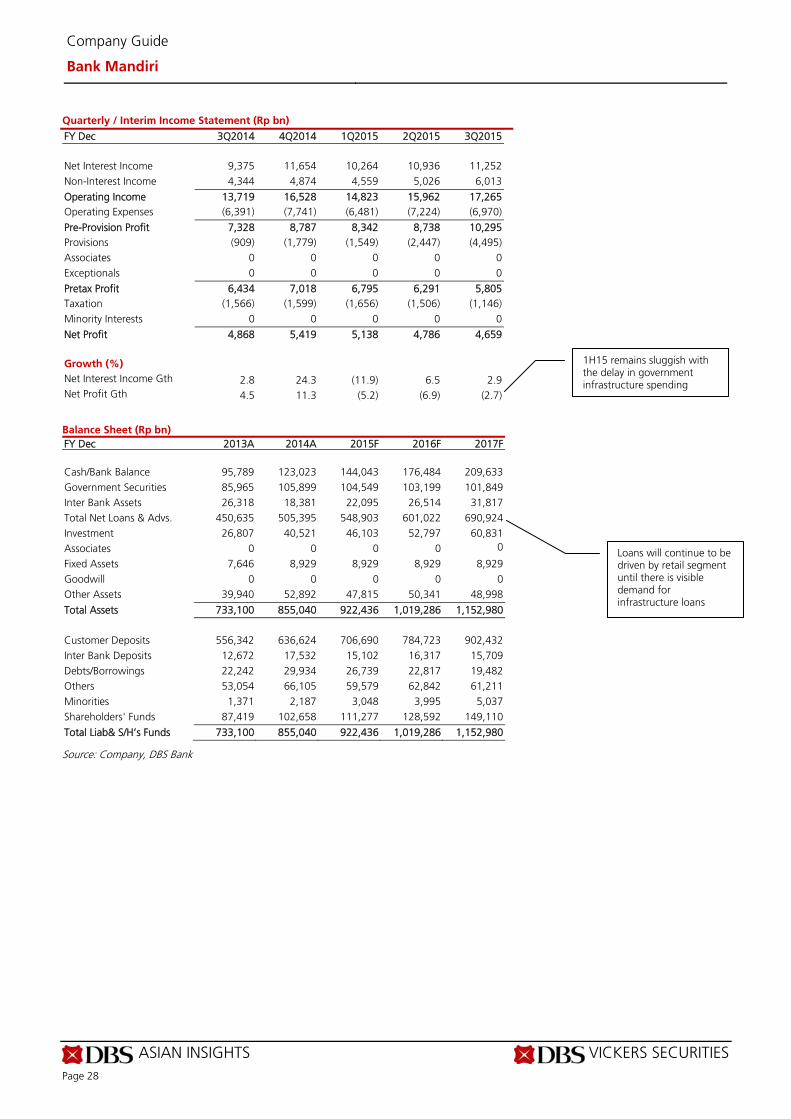
ASIAN INSIGHTS VICKERS SECURITIES Page 28
Company Guide
Bank Mandiri
Quarterly / Interim Income Statement (Rp bn)
FY Dec 3Q2014 4Q2014 1Q2015 2Q2015 3Q2015 Net Interest Income 9,375 11,654 10,264 10,936 11,252 Non-Interest Income 4,344 4,874 4,559 5,026 6,013
Operating Income 13,719 16,528 14,823 15,962 17,265 Operating Expenses (6,391) (7,741) (6,481) (7,224) (6,970)
Pre-Provision Profit 7,328 8,787 8,342 8,738 10,295 Provisions (909) (1,779) (1,549) (2,447) (4,495) Associates 0 0 0 0 0 Exceptionals 0 0 0 0 0
Pretax Profit 6,434 7,018 6,795 6,291 5,805 Taxation (1,566) (1,599) (1,656) (1,506) (1,146) Minority Interests 0 0 0 0 0
Net Profit 4,868 5,419 5,138 4,786 4,659
Growth (%) Net Interest Income Gth 2.8 24.3 (11.9) 6.5 2.9 Net Profit Gth 4.5 11.3 (5.2) (6.9) (2.7)
Balance Sheet (Rp bn)
FY Dec 2013A 2014A 2015F 2016F 2017F Cash/Bank Balance 95,789 123,023 144,043 176,484 209,633 Government Securities 85,965 105,899 104,549 103,199 101,849 Inter Bank Assets 26,318 18,381 22,095 26,514 31,817 Total Net Loans & Advs. 450,635 505,395 548,903 601,022 690,924 Investment 26,807 40,521 46,103 52,797 60,831 Associates 0 0 0 0 0
Fixed Assets 7,646 8,929 8,929 8,929 8,929 Goodwill 0 0 0 0 0 Other Assets 39,940 52,892 47,815 50,341 48,998
Total Assets 733,100 855,040 922,436 1,019,286 1,152,980 Customer Deposits 556,342 636,624 706,690 784,723 902,432 Inter Bank Deposits 12,672 17,532 15,102 16,317 15,709 Debts/Borrowings 22,242 29,934 26,739 22,817 19,482 Others 53,054 66,105 59,579 62,842 61,211 Minorities 1,371 2,187 3,048 3,995 5,037 Shareholders' Funds 87,419 102,658 111,277 128,592 149,110
Total Liab& S/H’s Funds 733,100 855,040 922,436 1,019,286 1,152,980
Source: Company, DBS Bank
1H15 remains sluggish with the delay in government infrastructure spending
Loans will continue to be driven by retail segment until there is visible demand for infrastructure loans
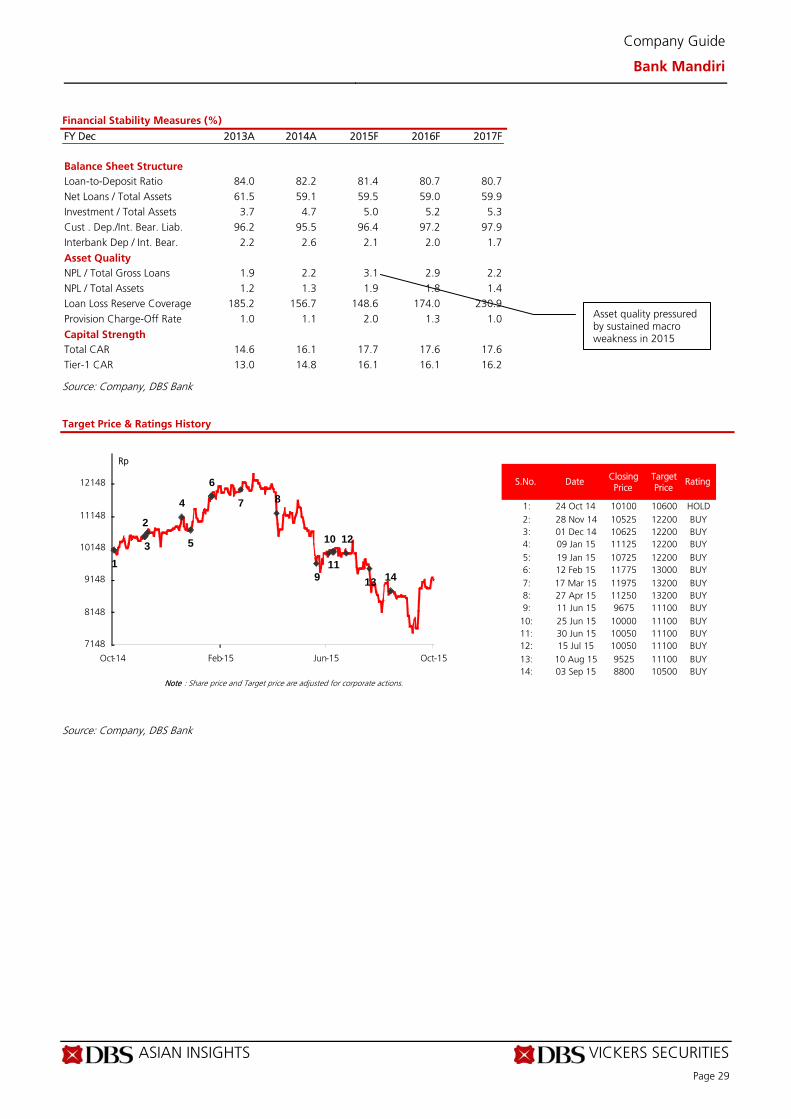
ASIAN INSIGHTS VICKERS SECURITIES Page 29
Company Guide
Bank Mandiri
Financial Stability Measures (%)
FY Dec 2013A 2014A 2015F 2016F 2017F Balance Sheet Structure Loan-to-Deposit Ratio 84.0 82.2 81.4 80.7 80.7 Net Loans / Total Assets 61.5 59.1 59.5 59.0 59.9 Investment / Total Assets 3.7 4.7 5.0 5.2 5.3 Cust . Dep./Int. Bear. Liab. 96.2 95.5 96.4 97.2 97.9 Interbank Dep / Int. Bear. 2.2 2.6 2.1 2.0 1.7
Asset Quality NPL / Total Gross Loans 1.9 2.2 3.1 2.9 2.2 NPL / Total Assets 1.2 1.3 1.9 1.8 1.4 Loan Loss Reserve Coverage 185.2 156.7 148.6 174.0 230.9 Provision Charge-Off Rate 1.0 1.1 2.0 1.3 1.0
Capital Strength Total CAR 14.6 16.1 17.7 17.6 17.6 Tier-1 CAR 13.0 14.8 16.1 16.1 16.2
Source: Company, DBS Bank Target Price & Ratings History
Source: Company, DBS Bank
S.No. Date Closing Price
Target Price
Rating
1: 24 Oct 14 10100 10600 HOLD2: 28 Nov 14 10525 12200 BUY3: 01 Dec 14 10625 12200 BUY4: 09 Jan 15 11125 12200 BUY5: 19 Jan 15 10725 12200 BUY6: 12 Feb 15 11775 13000 BUY7: 17 Mar 15 11975 13200 BUY8: 27 Apr 15 11250 13200 BUY9: 11 Jun 15 9675 11100 BUY
10: 25 Jun 15 10000 11100 BUY11: 30 Jun 15 10050 11100 BUY12: 15 Jul 15 10050 11100 BUY13: 10 Aug 15 9525 11100 BUY14: 03 Sep 15 8800 10500 BUY
Note : Share price and Target price are adjusted for corporate actions.
1
2
3
4
5
6
7 8
9
10
11
12
13 14
7148
8148
9148
10148
11148
12148
Oct-14 Feb-15 Jun-15 Oct-15
Rp
Asset quality pressured by sustained macro weakness in 2015
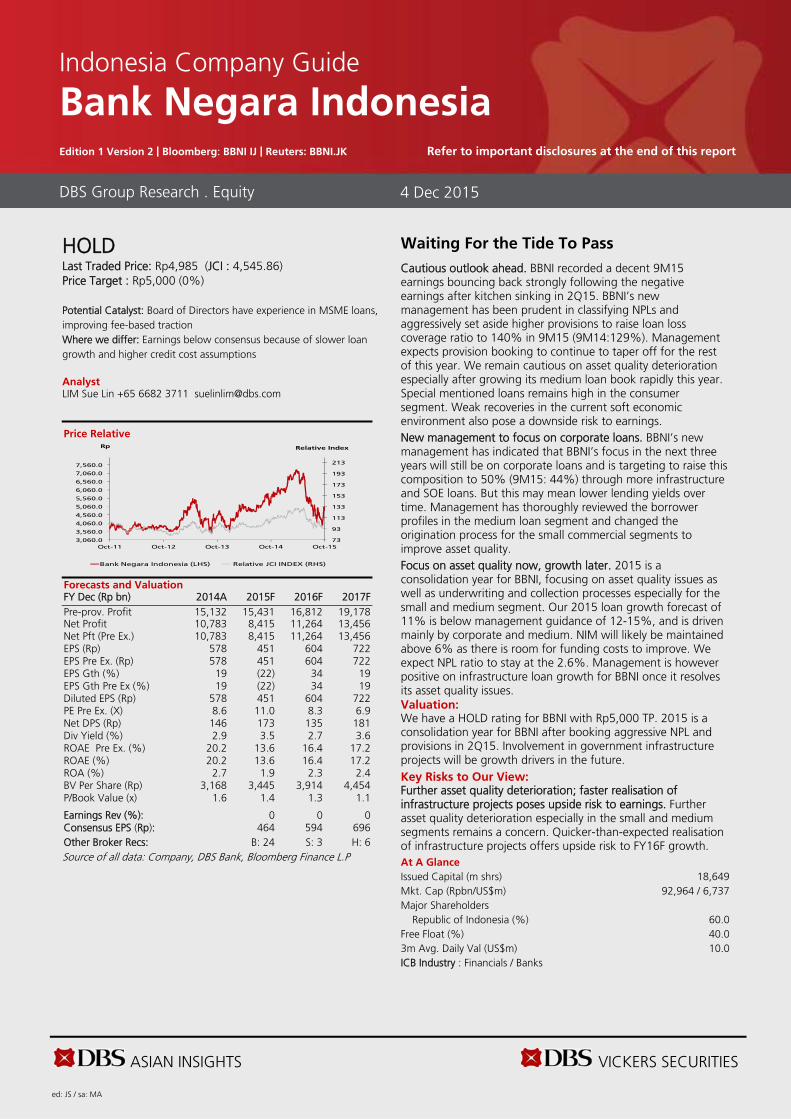
ASIAN INSIGHTS VICKERS SECURITIES ed: JS / sa: MA
HOLD
Last Traded Price: Rp4,985 (JCI : 4,545.86) Price Target : Rp5,000 (0%) Potential Catalyst: Board of Directors have experience in MSME loans, improving fee-based traction Where we differ: Earnings below consensus because of slower loan growth and higher credit cost assumptions Analyst LIM Sue Lin +65 6682 3711 [email protected]
Price Relative
Forecasts and Valuation FY Dec (Rp bn) 2014A 2015F 2016F 2017F Pre-prov. Profit 15,132 15,431 16,812 19,178 Net Profit 10,783 8,415 11,264 13,456 Net Pft (Pre Ex.) 10,783 8,415 11,264 13,456 EPS (Rp) 578 451 604 722 EPS Pre Ex. (Rp) 578 451 604 722 EPS Gth (%) 19 (22) 34 19 EPS Gth Pre Ex (%) 19 (22) 34 19 Diluted EPS (Rp) 578 451 604 722 PE Pre Ex. (X) 8.6 11.0 8.3 6.9 Net DPS (Rp) 146 173 135 181 Div Yield (%) 2.9 3.5 2.7 3.6 ROAE Pre Ex. (%) 20.2 13.6 16.4 17.2 ROAE (%) 20.2 13.6 16.4 17.2 ROA (%) 2.7 1.9 2.3 2.4 BV Per Share (Rp) 3,168 3,445 3,914 4,454 P/Book Value (x) 1.6 1.4 1.3 1.1 Earnings Rev (%): 0 0 0 Consensus EPS (Rp): 464 594 696 Other Broker Recs: B: 24 S: 3 H: 6 Source of all data: Company, DBS Bank, Bloomberg Finance L.P
Waiting For the Tide To Pass
Cautious outlook ahead. BBNI recorded a decent 9M15 earnings bouncing back strongly following the negative earnings after kitchen sinking in 2Q15. BBNI’s new management has been prudent in classifying NPLs and aggressively set aside higher provisions to raise loan loss coverage ratio to 140% in 9M15 (9M14:129%). Management expects provision booking to continue to taper off for the rest of this year. We remain cautious on asset quality deterioration especially after growing its medium loan book rapidly this year. Special mentioned loans remains high in the consumer segment. Weak recoveries in the current soft economic environment also pose a downside risk to earnings. New management to focus on corporate loans. BBNI’s new management has indicated that BBNI’s focus in the next three years will still be on corporate loans and is targeting to raise this composition to 50% (9M15: 44%) through more infrastructure and SOE loans. But this may mean lower lending yields over time. Management has thoroughly reviewed the borrower profiles in the medium loan segment and changed the origination process for the small commercial segments to improve asset quality. Focus on asset quality now, growth later. 2015 is a consolidation year for BBNI, focusing on asset quality issues as well as underwriting and collection processes especially for the small and medium segment. Our 2015 loan growth forecast of 11% is below management guidance of 12-15%, and is driven mainly by corporate and medium. NIM will likely be maintained above 6% as there is room for funding costs to improve. We expect NPL ratio to stay at the 2.6%. Management is however positive on infrastructure loan growth for BBNI once it resolves its asset quality issues. Valuation: We have a HOLD rating for BBNI with Rp5,000 TP. 2015 is a consolidation year for BBNI after booking aggressive NPL and provisions in 2Q15. Involvement in government infrastructure projects will be growth drivers in the future. Key Risks to Our View: Further asset quality deterioration; faster realisation of infrastructure projects poses upside risk to earnings. Further asset quality deterioration especially in the small and medium segments remains a concern. Quicker-than-expected realisation of infrastructure projects offers upside risk to FY16F growth. At A Glance Issued Capital (m shrs) 18,649 Mkt. Cap (Rpbn/US$m)
92,964 / 6,737
Major Shareholders Republic of Indonesia (%) 60.0 Free Float (%) 40.0 3m Avg. Daily Val (US$m) 10.0 ICB Industry : Financials / Banks
DBS Group Research . Equity 4 Dec 2015
Indonesia Company Guide
Bank Negara Indonesia Edition 1 Version 2 | Bloomberg: BBNI IJ | Reuters: BBNI.JK Refer to important disclosures at the end of this report
73
93
113
133
153
173
193
213
3,060.0
3,560.0
4,060.0
4,560.0
5,060.0
5,560.0
6,060.0
6,560.0
7,060.0
7,560.0
Oct-11 Oct-12 Oct-13 Oct-14 Oct-15
Relative IndexRp
Bank Negara Indonesia (LHS) Relative JCI INDEX (RHS)

ASIAN INSIGHTS VICKERS SECURITIES Page 31
Company Guide
Bank Negara Indonesia
CRITICAL DATA POINTS TO WATCH
Earnings Drivers:
Loan growth driven by corporate banking. Loan growth will mainly be driven by corporate banking as BBNI’s new management focuses on the core corporate loan book. Corporate loan composition will be increased to 50% of total loans through dealing with more government infrastructure loans and other SOE loans. We forecast loan growth of 11% this year. NIM expected to remain stable. BBNI will also maintain its NIM at c.6% for the year. Cost of funds should trend down since BBNI and all the large Indonesian banks are trimming down time deposit rates. Asset yield will decrease with the lower consumer and retail rates as well as the shift to lower-yielding corporate loans. Prudent growth on mass market loans. In the past, BBNI had struggled with asset quality issues in the small and medium loan book. The new management has vast experience in the mass-market segment (BBNI’s new CEO was prevoiusly from BBRI). As such, there will be a concerted effort to focus on business process improvements and prudent growth for small and medium loans. The new management requires the compliance division to be involved in the credit origination process for small commercial loans. Each of the debtors in the medium segment have also been reviewed, leading to an improvement in asset quality. BBNI currently runs its micro lending business via its Shariah unit, BNI Syariah, which is still comparatively small (c.4% of assets/less than 1% of earnings). Recoveries may drag non-interest income. Weaker recoveries due to the soft market will continue to drag non-interest income this year. Fee-based income is expected to continue to grow strongly as insurance premiums from the BNI Life-Sumitomo tie-up are starting to gain traction, while recurring ATM and credit card fees are also showing good growth. Majority of provisions booked in 2Q15. BBNI indicated that c.75% of its provisions have been booked as at 1H15. After the aggressive provisioning in 2Q15, there is sufficient buffer for loan loss coverage to meet headwinds in 2015/16. The bank remains cautious due to the weak commodity prices and soft economy. We expect a cost of credit of 2.3% this year. Cost-to-income ratio to remain stable; capex for overseas expansion. Cost-to-income ratio should remain stable but there will be capex for office buildings and overseas branches in Korea and Myanmar. Opex is mainly made up of personnel and G&A expenses. Cost-to-income will be at the 55% level this year.
Margin Trends
Gross Loan& Growth
Customer Deposit & Growth
Loan-to-Deposit Ratio Trend
Cost & Income Structure
Source: Company, DBS Bank
5.7%
5.9%
6.1%
6.3%
6.5%
6.7%
6.9%
7.1%
0
5,000,000
10,000,000
15,000,000
20,000,000
25,000,000
2013A 2014A 2015F 2016F 2017F
Rp bn
Net Interest Income Net Interest Income Margin
10%
15%
20%
25%
30%
0
50,000
100,000
150,000
200,000
250,000
300,000
350,000
400,000
2013A 2014A 2015F 2016F 2017F
Rp bn
Gross Loan (LHS) Gross Loan Growth (%) (YoY) (RHS)
0%
2%
4%
6%
8%
10%
12%
14%
16%
18%
20%
0
50,000
100,000
150,000
200,000
250,000
300,000
350,000
400,000
450,000
2013A 2014A 2015F 2016F 2017F
Rp bn
Customer Deposits (LHS)
Customer Deposits Growth (%) (YoY) (RHS)
77%
82%
87%
92%
97%
219,382
269,382
319,382
369,382
419,382
469,382
2013A 2014A 2015F 2016F 2017F
Loans Deposit Loan-to-Deposit Ratio (RHS)
0.49
0.5
0.51
0.52
0.53
0.54
0.55
0.56
0
5,000
10,000
15,000
20,000
25,000
30,000
35,000
40,000
45,000
2013A 2014A 2015F 2016F 2017F
Net Interest Income Non-interest Income Cost-to-income Ratio
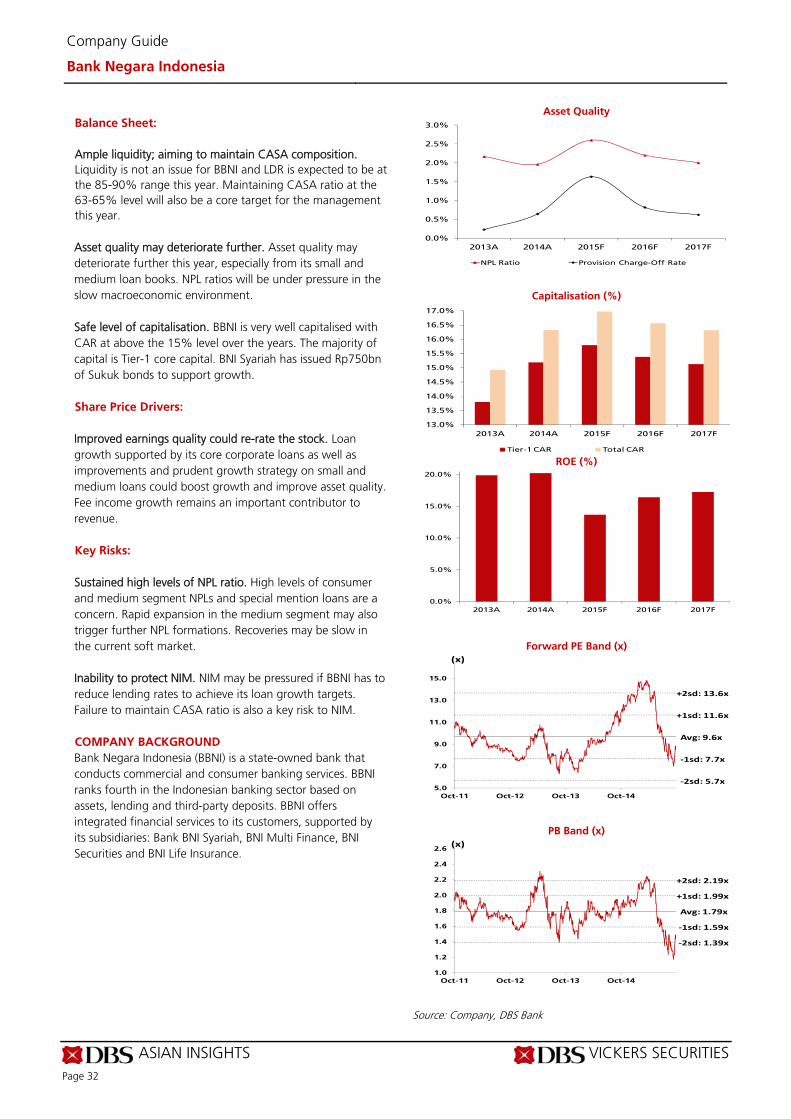
ASIAN INSIGHTS VICKERS SECURITIES Page 32
Company Guide
Bank Negara Indonesia
Balance Sheet:
Ample liquidity; aiming to maintain CASA composition. Liquidity is not an issue for BBNI and LDR is expected to be at the 85-90% range this year. Maintaining CASA ratio at the 63-65% level will also be a core target for the management this year. Asset quality may deteriorate further. Asset quality may deteriorate further this year, especially from its small and medium loan books. NPL ratios will be under pressure in the slow macroeconomic environment. Safe level of capitalisation. BBNI is very well capitalised with CAR at above the 15% level over the years. The majority of capital is Tier-1 core capital. BNI Syariah has issued Rp750bn of Sukuk bonds to support growth. Share Price Drivers:
Improved earnings quality could re-rate the stock. Loan growth supported by its core corporate loans as well as improvements and prudent growth strategy on small and medium loans could boost growth and improve asset quality. Fee income growth remains an important contributor to revenue. Key Risks:
Sustained high levels of NPL ratio. High levels of consumer and medium segment NPLs and special mention loans are a concern. Rapid expansion in the medium segment may also trigger further NPL formations. Recoveries may be slow in the current soft market. Inability to protect NIM. NIM may be pressured if BBNI has to reduce lending rates to achieve its loan growth targets. Failure to maintain CASA ratio is also a key risk to NIM. COMPANY BACKGROUND
Bank Negara Indonesia (BBNI) is a state-owned bank that conducts commercial and consumer banking services. BBNI ranks fourth in the Indonesian banking sector based on assets, lending and third-party deposits. BBNI offers integrated financial services to its customers, supported by its subsidiaries: Bank BNI Syariah, BNI Multi Finance, BNI Securities and BNI Life Insurance.
Asset Quality
Capitalisation (%)
ROE (%)
Forward PE Band (x)
PB Band (x)
Source: Company, DBS Bank
0.0%
0.5%
1.0%
1.5%
2.0%
2.5%
3.0%
2013A 2014A 2015F 2016F 2017F
NPL Ratio Provision Charge-Off Rate
13.0%
13.5%
14.0%
14.5%
15.0%
15.5%
16.0%
16.5%
17.0%
2013A 2014A 2015F 2016F 2017F
Tier-1 CAR Total CAR
0.0%
5.0%
10.0%
15.0%
20.0%
2013A 2014A 2015F 2016F 2017F
Avg: 9.6x
+1sd: 11.6x
+2sd: 13.6x
‐1sd: 7.7x
‐2sd: 5.7x5.0
7.0
9.0
11.0
13.0
15.0
Oct-11 Oct-12 Oct-13 Oct-14
(x)
Avg: 1.79x
+1sd: 1.99x
+2sd: 2.19x
‐1sd: 1.59x
‐2sd: 1.39x
1.0
1.2
1.4
1.6
1.8
2.0
2.2
2.4
2.6
Oct-11 Oct-12 Oct-13 Oct-14
(x)
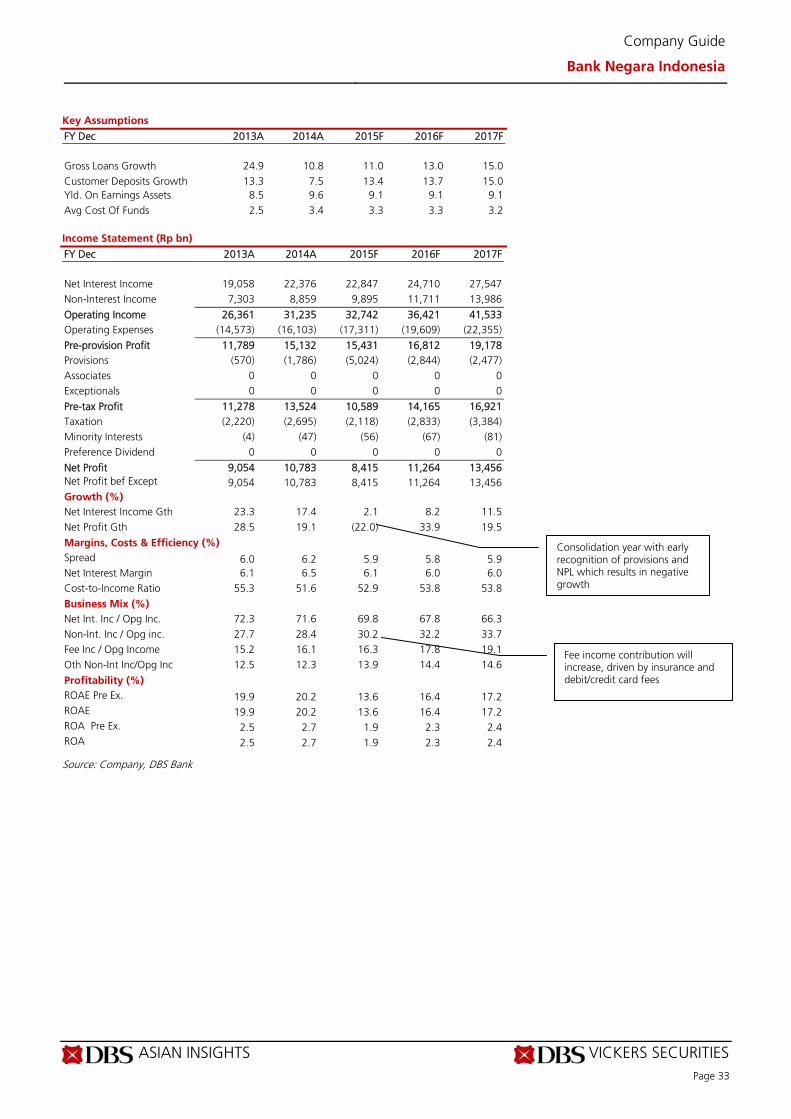
ASIAN INSIGHTS VICKERS SECURITIES Page 33
Company Guide
Bank Negara Indonesia
Key Assumptions
FY Dec 2013A 2014A 2015F 2016F 2017F
Gross Loans Growth 24.9 10.8 11.0 13.0 15.0 Customer Deposits Growth 13.3 7.5 13.4 13.7 15.0 Yld. On Earnings Assets 8.5 9.6 9.1 9.1 9.1 Avg Cost Of Funds 2.5 3.4 3.3 3.3 3.2 Income Statement (Rp bn)
FY Dec 2013A 2014A 2015F 2016F 2017F Net Interest Income 19,058 22,376 22,847 24,710 27,547 Non-Interest Income 7,303 8,859 9,895 11,711 13,986
Operating Income 26,361 31,235 32,742 36,421 41,533 Operating Expenses (14,573) (16,103) (17,311) (19,609) (22,355)
Pre-provision Profit 11,789 15,132 15,431 16,812 19,178 Provisions (570) (1,786) (5,024) (2,844) (2,477) Associates 0 0 0 0 0 Exceptionals 0 0 0 0 0
Pre-tax Profit 11,278 13,524 10,589 14,165 16,921 Taxation (2,220) (2,695) (2,118) (2,833) (3,384) Minority Interests (4) (47) (56) (67) (81) Preference Dividend 0 0 0 0 0
Net Profit 9,054 10,783 8,415 11,264 13,456 Net Profit bef Except 9,054 10,783 8,415 11,264 13,456 Growth (%) Net Interest Income Gth 23.3 17.4 2.1 8.2 11.5 Net Profit Gth 28.5 19.1 (22.0) 33.9 19.5
Margins, Costs & Efficiency (%) Spread 6.0 6.2 5.9 5.8 5.9 Net Interest Margin 6.1 6.5 6.1 6.0 6.0 Cost-to-Income Ratio 55.3 51.6 52.9 53.8 53.8
Business Mix (%) Net Int. Inc / Opg Inc. 72.3 71.6 69.8 67.8 66.3 Non-Int. Inc / Opg inc. 27.7 28.4 30.2 32.2 33.7 Fee Inc / Opg Income 15.2 16.1 16.3 17.8 19.1 Oth Non-Int Inc/Opg Inc 12.5 12.3 13.9 14.4 14.6
Profitability (%) ROAE Pre Ex. 19.9 20.2 13.6 16.4 17.2 ROAE 19.9 20.2 13.6 16.4 17.2 ROA Pre Ex. 2.5 2.7 1.9 2.3 2.4 ROA 2.5 2.7 1.9 2.3 2.4
Source: Company, DBS Bank
Consolidation year with early recognition of provisions and NPL which results in negative growth
Fee income contribution will increase, driven by insurance and debit/credit card fees
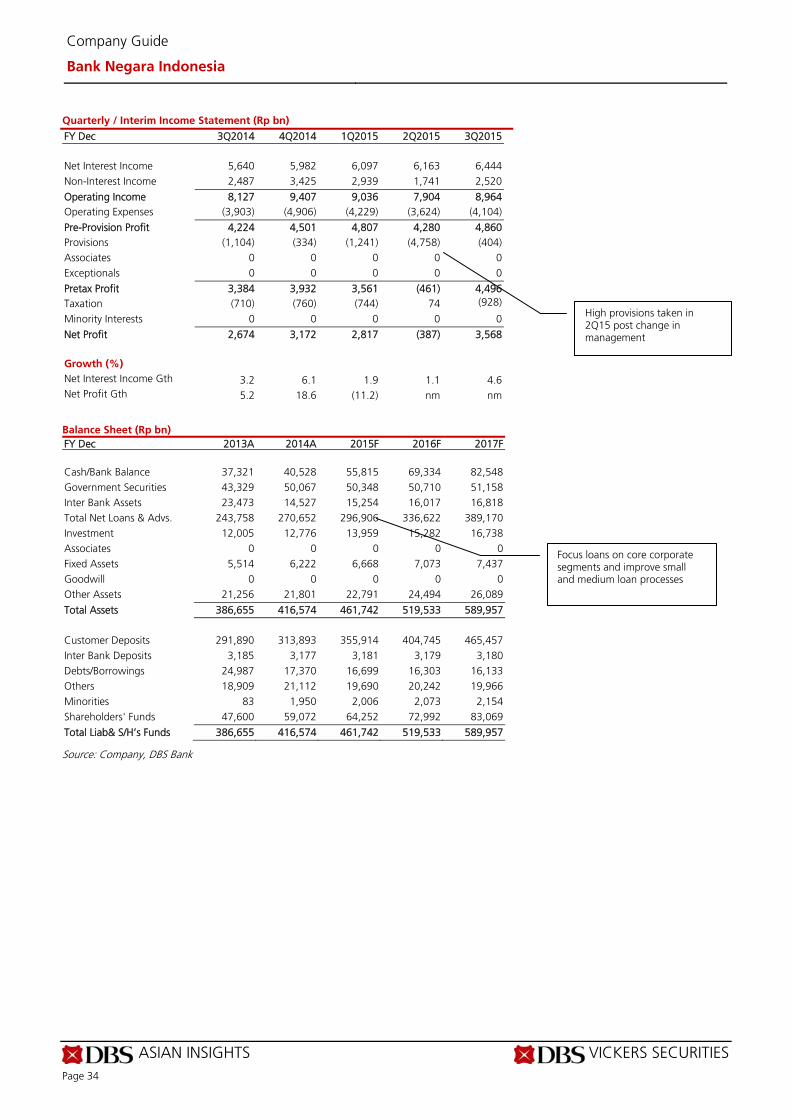
ASIAN INSIGHTS VICKERS SECURITIES Page 34
Company Guide
Bank Negara Indonesia
Quarterly / Interim Income Statement (Rp bn)
FY Dec 3Q2014 4Q2014 1Q2015 2Q2015 3Q2015 Net Interest Income 5,640 5,982 6,097 6,163 6,444 Non-Interest Income 2,487 3,425 2,939 1,741 2,520
Operating Income 8,127 9,407 9,036 7,904 8,964 Operating Expenses (3,903) (4,906) (4,229) (3,624) (4,104)
Pre-Provision Profit 4,224 4,501 4,807 4,280 4,860 Provisions (1,104) (334) (1,241) (4,758) (404) Associates 0 0 0 0 0 Exceptionals 0 0 0 0 0
Pretax Profit 3,384 3,932 3,561 (461) 4,496 Taxation (710) (760) (744) 74 (928)
Minority Interests 0 0 0 0 0
Net Profit 2,674 3,172 2,817 (387) 3,568 Growth (%) Net Interest Income Gth 3.2 6.1 1.9 1.1 4.6 Net Profit Gth 5.2 18.6 (11.2) nm nm
Balance Sheet (Rp bn)
FY Dec 2013A 2014A 2015F 2016F 2017F Cash/Bank Balance 37,321 40,528 55,815 69,334 82,548 Government Securities 43,329 50,067 50,348 50,710 51,158 Inter Bank Assets 23,473 14,527 15,254 16,017 16,818 Total Net Loans & Advs. 243,758 270,652 296,906 336,622 389,170 Investment 12,005 12,776 13,959 15,282 16,738 Associates 0 0 0 0 0 Fixed Assets 5,514 6,222 6,668 7,073 7,437 Goodwill 0 0 0 0 0 Other Assets 21,256 21,801 22,791 24,494 26,089
Total Assets 386,655 416,574 461,742 519,533 589,957 Customer Deposits 291,890 313,893 355,914 404,745 465,457 Inter Bank Deposits 3,185 3,177 3,181 3,179 3,180 Debts/Borrowings 24,987 17,370 16,699 16,303 16,133 Others 18,909 21,112 19,690 20,242 19,966 Minorities 83 1,950 2,006 2,073 2,154 Shareholders' Funds 47,600 59,072 64,252 72,992 83,069
Total Liab& S/H’s Funds 386,655 416,574 461,742 519,533 589,957
Source: Company, DBS Bank
High provisions taken in 2Q15 post change in management
Focus loans on core corporate segments and improve small and medium loan processes

ASIAN INSIGHTS VICKERS SECURITIES Page 35
Company Guide
Bank Negara Indonesia
Financial Stability Measures (%)
FY Dec 2013A 2014A 2015F 2016F 2017F Balance Sheet Structure Loan-to-Deposit Ratio 85.9 88.4 86.6 86.0 86.0 Net Loans / Total Assets 63.0 65.0 64.3 64.8 66.0 Investment / Total Assets 3.1 3.1 3.0 2.9 2.8 Cust . Dep./Int. Bear. Liab. 92.1 94.8 95.5 96.1 96.7 Interbank Dep / Int. Bear. 1.0 1.0 0.9 0.8 0.7
Asset Quality NPL / Total Gross Loans 2.2 2.0 2.6 2.2 2.0 NPL / Total Assets 1.4 1.3 1.7 1.5 1.4 Loan Loss Reserve Coverage 126.9 128.2 140.5 151.4 140.9
Provision Charge-Off Rate 0.2 0.6 1.6 0.8 0.6
Capital Strength Total CAR 14.9 16.3 17.0 16.6 16.3 Tier-1 CAR 13.8 15.2 15.8 15.4 15.1
Source: Company, DBS Bank Target Price & Ratings History
Source: Company, DBS Bank
S.No. Da teClos ing
Pric eTa rge t Pric e
Ra ting
1: 09 Jan 15 6150 6400 HOLD2: 30 Jan 15 6250 6400 HOLD3: 17 Mar 15 6900 6400 HOLD4: 24 Apr 15 6950 6400 HOLD5: 15 Jul 15 5075 6200 BUY6: 10 Aug 15 4890 4300 HOLD
Note : Share price and Target price are adjusted for corporate actions.
1
23
4
5
6
3743
4243
4743
5243
5743
6243
6743
7243
Oct-14 Feb-15 Jun-15 Oct-15
Rp
Asset quality deterioration in small and medium portfolio, NPL is expected to improve in 4Q15
Management is comfortable with LDR of 85-90%
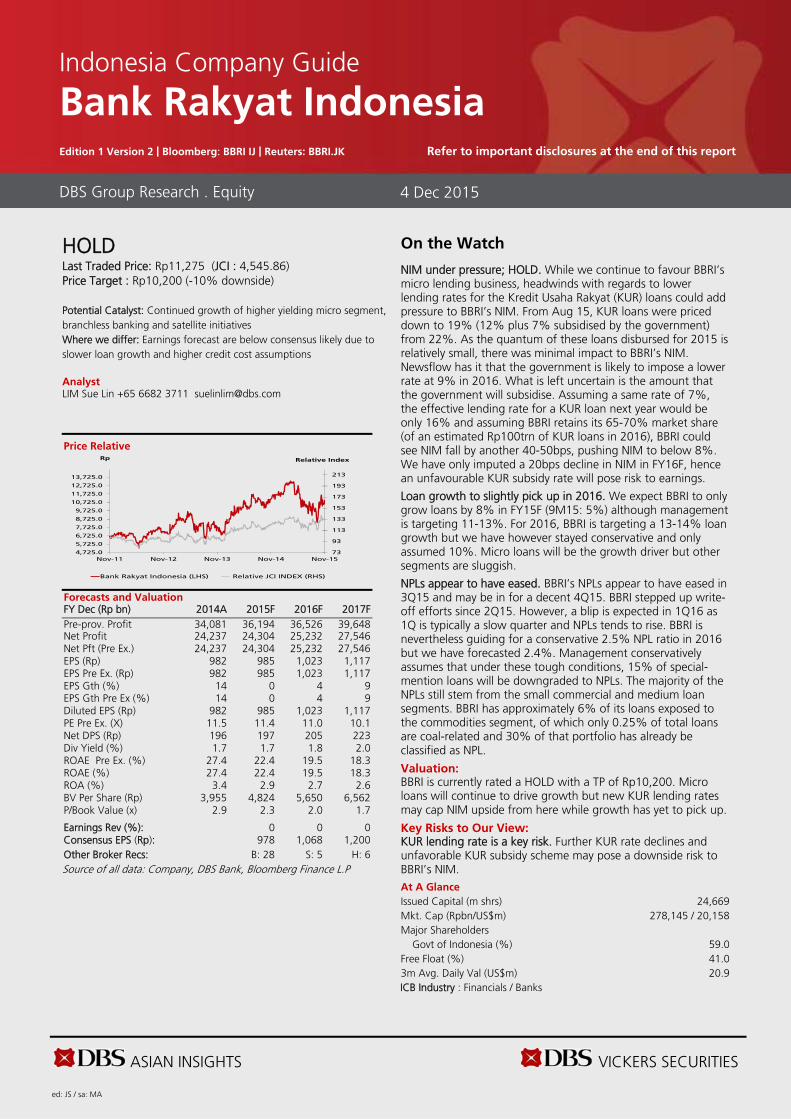
ASIAN INSIGHTS VICKERS SECURITIES ed: JS / sa: MA
HOLD
Last Traded Price: Rp11,275 (JCI : 4,545.86) Price Target : Rp10,200 (-10% downside) Potential Catalyst: Continued growth of higher yielding micro segment, branchless banking and satellite initiatives Where we differ: Earnings forecast are below consensus likely due to slower loan growth and higher credit cost assumptions Analyst LIM Sue Lin +65 6682 3711 [email protected]
Price Relative
Forecasts and Valuation FY Dec (Rp bn) 2014A 2015F 2016F 2017F Pre-prov. Profit 34,081 36,194 36,526 39,648 Net Profit 24,237 24,304 25,232 27,546 Net Pft (Pre Ex.) 24,237 24,304 25,232 27,546 EPS (Rp) 982 985 1,023 1,117 EPS Pre Ex. (Rp) 982 985 1,023 1,117 EPS Gth (%) 14 0 4 9 EPS Gth Pre Ex (%) 14 0 4 9 Diluted EPS (Rp) 982 985 1,023 1,117 PE Pre Ex. (X) 11.5 11.4 11.0 10.1 Net DPS (Rp) 196 197 205 223 Div Yield (%) 1.7 1.7 1.8 2.0 ROAE Pre Ex. (%) 27.4 22.4 19.5 18.3 ROAE (%) 27.4 22.4 19.5 18.3 ROA (%) 3.4 2.9 2.7 2.6 BV Per Share (Rp) 3,955 4,824 5,650 6,562 P/Book Value (x) 2.9 2.3 2.0 1.7 Earnings Rev (%): 0 0 0 Consensus EPS (Rp): 978 1,068 1,200 Other Broker Recs: B: 28 S: 5 H: 6 Source of all data: Company, DBS Bank, Bloomberg Finance L.P
On the Watch
NIM under pressure; HOLD. While we continue to favour BBRI’s micro lending business, headwinds with regards to lower lending rates for the Kredit Usaha Rakyat (KUR) loans could add pressure to BBRI’s NIM. From Aug 15, KUR loans were priced down to 19% (12% plus 7% subsidised by the government) from 22%. As the quantum of these loans disbursed for 2015 is relatively small, there was minimal impact to BBRI’s NIM. Newsflow has it that the government is likely to impose a lower rate at 9% in 2016. What is left uncertain is the amount that the government will subsidise. Assuming a same rate of 7%, the effective lending rate for a KUR loan next year would be only 16% and assuming BBRI retains its 65-70% market share (of an estimated Rp100trn of KUR loans in 2016), BBRI could see NIM fall by another 40-50bps, pushing NIM to below 8%. We have only imputed a 20bps decline in NIM in FY16F, hence an unfavourable KUR subsidy rate will pose risk to earnings.
Loan growth to slightly pick up in 2016. We expect BBRI to only grow loans by 8% in FY15F (9M15: 5%) although management is targeting 11-13%. For 2016, BBRI is targeting a 13-14% loan growth but we have however stayed conservative and only assumed 10%. Micro loans will be the growth driver but other segments are sluggish.
NPLs appear to have eased. BBRI’s NPLs appear to have eased in 3Q15 and may be in for a decent 4Q15. BBRI stepped up write-off efforts since 2Q15. However, a blip is expected in 1Q16 as 1Q is typically a slow quarter and NPLs tends to rise. BBRI is nevertheless guiding for a conservative 2.5% NPL ratio in 2016 but we have forecasted 2.4%. Management conservatively assumes that under these tough conditions, 15% of special-mention loans will be downgraded to NPLs. The majority of the NPLs still stem from the small commercial and medium loan segments. BBRI has approximately 6% of its loans exposed to the commodities segment, of which only 0.25% of total loans are coal-related and 30% of that portfolio has already be classified as NPL.
Valuation: BBRI is currently rated a HOLD with a TP of Rp10,200. Micro loans will continue to drive growth but new KUR lending rates may cap NIM upside from here while growth has yet to pick up.
Key Risks to Our View: KUR lending rate is a key risk. Further KUR rate declines and unfavorable KUR subsidy scheme may pose a downside risk to BBRI’s NIM. At A Glance Issued Capital (m shrs) 24,669 Mkt. Cap (Rpbn/US$m)
278,145 / 20,158
Major Shareholders Govt of Indonesia (%) 59.0 Free Float (%) 41.0 3m Avg. Daily Val (US$m) 20.9 ICB Industry : Financials / Banks
DBS Group Research . Equity 4 Dec 2015
Indonesia Company Guide
Bank Rakyat Indonesia Edition 1 Version 2 | Bloomberg: BBRI IJ | Reuters: BBRI.JK Refer to important disclosures at the end of this report
73
93
113
133
153
173
193
213
4,725.0
5,725.0
6,725.0
7,725.0
8,725.0
9,725.0
10,725.0
11,725.0
12,725.0
13,725.0
Nov-11 Nov-12 Nov-13 Nov-14 Nov-15
Relative IndexRp
Bank Rakyat Indonesia (LHS) Relative JCI INDEX (RHS)

ASIAN INSIGHTS VICKERS SECURITIES Page 37
Company Guide
Bank Rakyat Indonesia
CRITICAL DATA POINTS TO WATCH
Earnings Drivers:
Sluggish pick-up in loan demand. BBRI has not see any pick-up in loan demand YTD and the realisation of government spending is still slow. BBRI indicated that it has signed several loan agreements for infrastructure projects such as ports and airports after 1Q15 but the drawdown can take up to 6-12 months. So far, none of its big SOE corporate clients are drawing down their loans yet. Micro loans continue to be resilient while BBRI will be more prudent in disbursing SME loans. We expect loans to grow 8% this year, below management's guidance of 11-13%.
NIM may be under pressure. BBRI started to trim down expensive time deposits early this year as liquidity in the market has eased. At the same time, retail loan yields are slightly reduced to attract demand. BBRI expects NIM to be at the 7.9-8.2% level. The government decided to cut KUR rate to 12% in Aug 2015. In the new scheme, the government will subsidise 7% on top of the 12% interest rate, implying total yield booked at BBRI would be 19% (lower than the previous 21%). The increased portion of KUR loans next year, further reduction in KUR rate and unfavorable subsidy scheme poses downside risks to margins.
Looking to boost fee income. BBRI wants to grow its fee-based income by 20-25% this year. Approximately 50% of BBRI’s fee-based income is from loan and deposit fees. BBRI plans to grow its e-channel initiatives, mainly ATMs. It also needs to improve its credit card services but it is hard for micro customers to adopt credit cards. BBRI is looking to acquire an insurance company this year to further boost its fee-based income.
Rolling out branchless banking initiative. BBRI is riding on its experience and existing infrastructure in micro mass market loans to expand its branchless banking operations. BBRI is targeting 50,000 agents this year that will offer a basic savings account product and transaction banking services, and refer customers to a BRI unit for lending products. Branchless banking will help boost its fee-based income through transaction fees and the bank is aiming for Rp75bn revenues this year. It will also add to CASA in the long term.
Asset quality appears to have eased. BBRI struggled with NPLs in 1H16 due to the slower loan growth and weakness in the economy. BBRI's stress test indicate that with the assumption of a 4.5% GDP growth and IDR/USD rate at the Rp15,000 level, NPL can go up to 2.7-2.8%. We expect NPLs to come in at 2.7% this year and cost of credit to remain high at 1.4%. However, by 3Q15, we noted that NPLs have started to ease although bulk of it was addressed by write-offs. While the NPL ratio may see some improvement in 4Q15, it will falter in 1Q16 before improving in 2H16.
Margin Trends
Gross Loan& Growth
Customer Deposit & Growth
Loan-to-Deposit Ratio Trend
Cost & Income Structure
Source: Company, DBS Bank
7.2%
7.7%
8.2%
8.7%
9.2%
9.7%
0
10,000,000
20,000,000
30,000,000
40,000,000
50,000,000
60,000,000
70,000,000
2013A 2014A 2015F 2016F 2017F
Rp bn
Net Interest Income Net Interest Income Margin
0%
5%
10%
15%
20%
25%
30%
0
100,000
200,000
300,000
400,000
500,000
600,000
2013A 2014A 2015F 2016F 2017F
Rp bn
Gross Loan (LHS) Gross Loan Growth (%) (YoY) (RHS)
10%
15%
20%
25%
30%
0
100,000
200,000
300,000
400,000
500,000
600,000
700,000
800,000
900,000
2013A 2014A 2015F 2016F 2017F
Rp bn
Customer Deposits (LHS)
Customer Deposits Growth (%) (YoY) (RHS)
69%
74%
79%
84%
89%
94%
389,634
489,634
589,634
689,634
789,634
889,634
989,634
2013A 2014A 2015F 2016F 2017F
Loans Deposit Loan-to-Deposit Ratio (RHS)
0
0.1
0.2
0.3
0.4
0.5
0.6
0
10,000
20,000
30,000
40,000
50,000
60,000
70,000
80,000
90,000
2013A 2014A 2015F 2016F 2017F
Net Interest Income Non-interest Income Cost-to-income Ratio

ASIAN INSIGHTS VICKERS SECURITIES Page 38
Company Guide
Bank Rakyat Indonesia
Balance Sheet:
Testing out bond issuance; improving CASA ratio. BBRI wants to diversify its funding composition and match the maturity of its asset and liability and it issued bonds worth Rp3tn this year. BBRI also wants to improve its CASA ratio to 60% by optimising CASA marketing agents and improving its services by adding branches and rolling out branchless banking agents. As loan growth has been sluggish in 2015, there was little pressure to aggresively gather deposits. The situation may change in 2016 if loan growth picks up. Improvements in business process to improve asset quality. BBRI will improve underwriting processes to improve asset quality. The bank will create a special task force to tackle NPL and special mentioned. It will also limit loans to small and medium players, focusing on certain quality debtors and industries. BBRI will also place experienced personnel from its head office to regional offices to improve its business processes. The majority of the problems in its NPL stems from the small commercial and medium segments. Strong capital position. BBRI’s CAR remains healthy at over 18%. We see little risk in any capital raising exercises as BBRI has refinanced its maturing Rp2tn subordinated debt at the end of last year. Share Price Drivers:
Sustained growth in micro loans; improvement in the economy. BBRI’s bread-and-butter micro loans still show decent growth and is expected to grow at mid to high teens this year. NPL ratio is also manageable in this segment. An improvement in the economy and the realisation of government infrastructure projects will boost BBRI’s growth and place less pressure on debtors, thus reducing NPLs. Key Risks:
Slowdown in mass-market lending. The delayed economic could suppress growth in the MSME segment. Slower realisation of government projects could also hamper the growth of BBRI’s corporate loans. Asset quality issues. BBRI has exposure to more sensitive small and medium commercial loans. BBRI also has the highest level of special-mention loans among big banks. COMPANY BACKGROUND
BBRI is Indonesia's leading micro lender, mainly to retail clients largely in the rural areas. It also has a comparatively small but growing corporate business. It is currently a 60% government-owned operating company.
Asset Quality
Capitalisation (%)
ROE (%)
Forward PE Band (x)
PB Band (x)
Source: Company, DBS Bank
0.0%
0.5%
1.0%
1.5%
2.0%
2.5%
3.0%
2013A 2014A 2015F 2016F 2017F
NPL Ratio Provision Charge-Off Rate
15.0%
16.0%
17.0%
18.0%
19.0%
20.0%
21.0%
2013A 2014A 2015F 2016F 2017F
Tier-1 CAR Total CAR
0.0%
5.0%
10.0%
15.0%
20.0%
25.0%
2013A 2014A 2015F 2016F 2017F
Avg: 9.6x
+1sd: 11.1x
+2sd: 12.6x
‐1sd: 8.1x
‐2sd: 6.6x
5.8
6.8
7.8
8.8
9.8
10.8
11.8
12.8
13.8
Nov-11 Nov-12 Nov-13 Nov-14
(x)
Avg: 2.8x
+1sd: 3.12x
+2sd: 3.43x
‐1sd: 2.48x
‐2sd: 2.16x
1.6
2.1
2.6
3.1
3.6
Nov-11 Nov-12 Nov-13 Nov-14
(x)
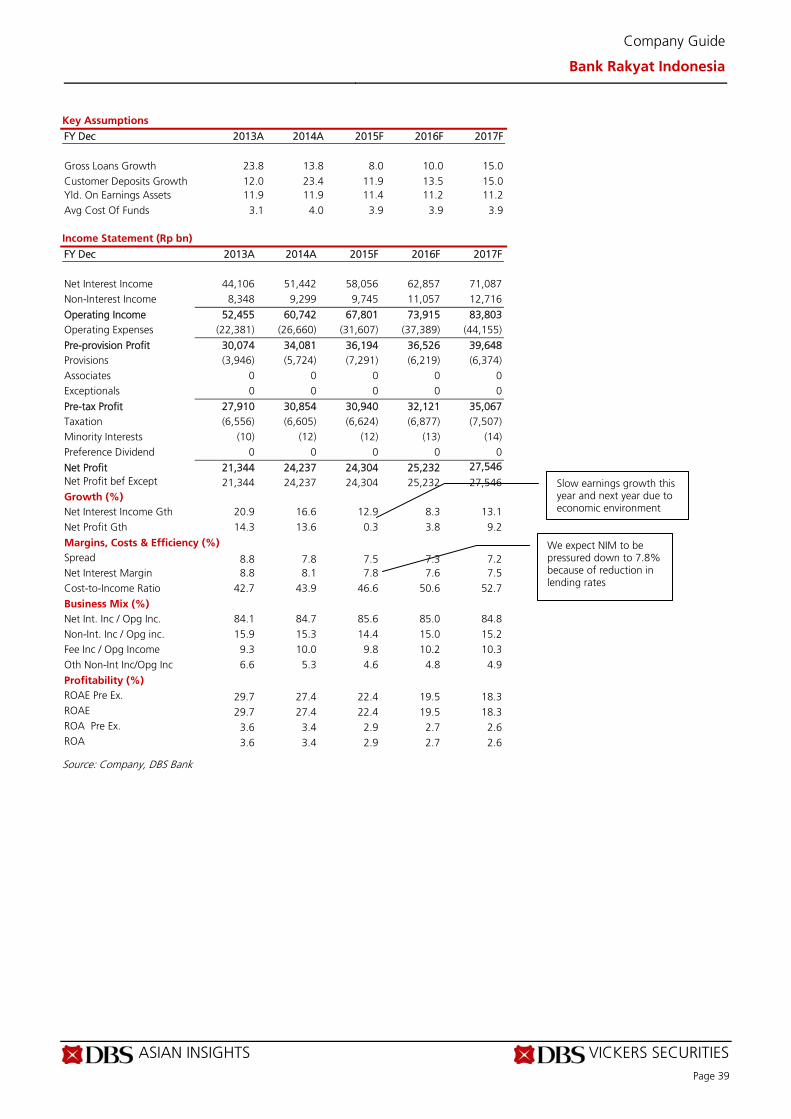
ASIAN INSIGHTS VICKERS SECURITIES Page 39
Company Guide
Bank Rakyat Indonesia
Key Assumptions
FY Dec 2013A 2014A 2015F 2016F 2017F
Gross Loans Growth 23.8 13.8 8.0 10.0 15.0 Customer Deposits Growth 12.0 23.4 11.9 13.5 15.0 Yld. On Earnings Assets 11.9 11.9 11.4 11.2 11.2 Avg Cost Of Funds 3.1 4.0 3.9 3.9 3.9 Income Statement (Rp bn)
FY Dec 2013A 2014A 2015F 2016F 2017F Net Interest Income 44,106 51,442 58,056 62,857 71,087 Non-Interest Income 8,348 9,299 9,745 11,057 12,716
Operating Income 52,455 60,742 67,801 73,915 83,803 Operating Expenses (22,381) (26,660) (31,607) (37,389) (44,155)
Pre-provision Profit 30,074 34,081 36,194 36,526 39,648 Provisions (3,946) (5,724) (7,291) (6,219) (6,374) Associates 0 0 0 0 0 Exceptionals 0 0 0 0 0
Pre-tax Profit 27,910 30,854 30,940 32,121 35,067 Taxation (6,556) (6,605) (6,624) (6,877) (7,507) Minority Interests (10) (12) (12) (13) (14) Preference Dividend 0 0 0 0 0
Net Profit 21,344 24,237 24,304 25,232 27,546 Net Profit bef Except 21,344 24,237 24,304 25,232 27,546 Growth (%) Net Interest Income Gth 20.9 16.6 12.9 8.3 13.1 Net Profit Gth 14.3 13.6 0.3 3.8 9.2
Margins, Costs & Efficiency (%) Spread 8.8 7.8 7.5 7.3 7.2 Net Interest Margin 8.8 8.1 7.8 7.6 7.5 Cost-to-Income Ratio 42.7 43.9 46.6 50.6 52.7
Business Mix (%) Net Int. Inc / Opg Inc. 84.1 84.7 85.6 85.0 84.8 Non-Int. Inc / Opg inc. 15.9 15.3 14.4 15.0 15.2 Fee Inc / Opg Income 9.3 10.0 9.8 10.2 10.3 Oth Non-Int Inc/Opg Inc 6.6 5.3 4.6 4.8 4.9
Profitability (%) ROAE Pre Ex. 29.7 27.4 22.4 19.5 18.3 ROAE 29.7 27.4 22.4 19.5 18.3 ROA Pre Ex. 3.6 3.4 2.9 2.7 2.6 ROA 3.6 3.4 2.9 2.7 2.6
Source: Company, DBS Bank
Slow earnings growth this year and next year due to economic environment
We expect NIM to be pressured down to 7.8% because of reduction in lending rates
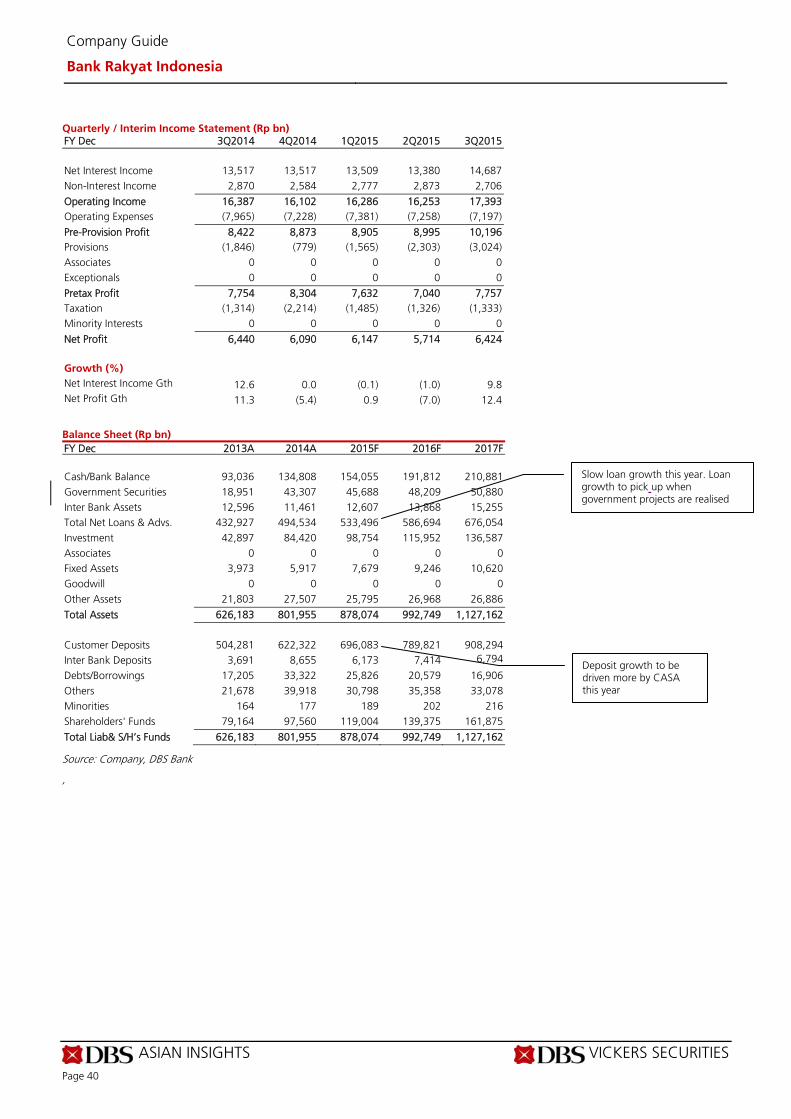
ASIAN INSIGHTS VICKERS SECURITIES Page 40
Company Guide
Bank Rakyat Indonesia
Quarterly / Interim Income Statement (Rp bn) FY Dec 3Q2014 4Q2014 1Q2015 2Q2015 3Q2015 Net Interest Income 13,517 13,517 13,509 13,380 14,687 Non-Interest Income 2,870 2,584 2,777 2,873 2,706
Operating Income 16,387 16,102 16,286 16,253 17,393 Operating Expenses (7,965) (7,228) (7,381) (7,258) (7,197)
Pre-Provision Profit 8,422 8,873 8,905 8,995 10,196 Provisions (1,846) (779) (1,565) (2,303) (3,024) Associates 0 0 0 0 0 Exceptionals 0 0 0 0 0
Pretax Profit 7,754 8,304 7,632 7,040 7,757 Taxation (1,314) (2,214) (1,485) (1,326) (1,333) Minority Interests 0 0 0 0 0
Net Profit 6,440 6,090 6,147 5,714 6,424 Growth (%) Net Interest Income Gth 12.6 0.0 (0.1) (1.0) 9.8 Net Profit Gth 11.3 (5.4) 0.9 (7.0) 12.4
Balance Sheet (Rp bn)
FY Dec 2013A 2014A 2015F 2016F 2017F
Cash/Bank Balance 93,036 134,808 154,055 191,812 210,881 Government Securities 18,951 43,307 45,688 48,209 50,880 Inter Bank Assets 12,596 11,461 12,607 13,868 15,255 Total Net Loans & Advs. 432,927 494,534 533,496 586,694 676,054 Investment 42,897 84,420 98,754 115,952 136,587 Associates 0 0 0 0 0 Fixed Assets 3,973 5,917 7,679 9,246 10,620 Goodwill 0 0 0 0 0 Other Assets 21,803 27,507 25,795 26,968 26,886
Total Assets 626,183 801,955 878,074 992,749 1,127,162 Customer Deposits 504,281 622,322 696,083 789,821 908,294 Inter Bank Deposits 3,691 8,655 6,173 7,414 6,794
Debts/Borrowings 17,205 33,322 25,826 20,579 16,906 Others 21,678 39,918 30,798 35,358 33,078 Minorities 164 177 189 202 216 Shareholders' Funds 79,164 97,560 119,004 139,375 161,875
Total Liab& S/H’s Funds 626,183 801,955 878,074 992,749 1,127,162
Source: Company, DBS Bank
,
Slow loan growth this year. Loan growth to pick up when government projects are realised
Deposit growth to be driven more by CASA this year
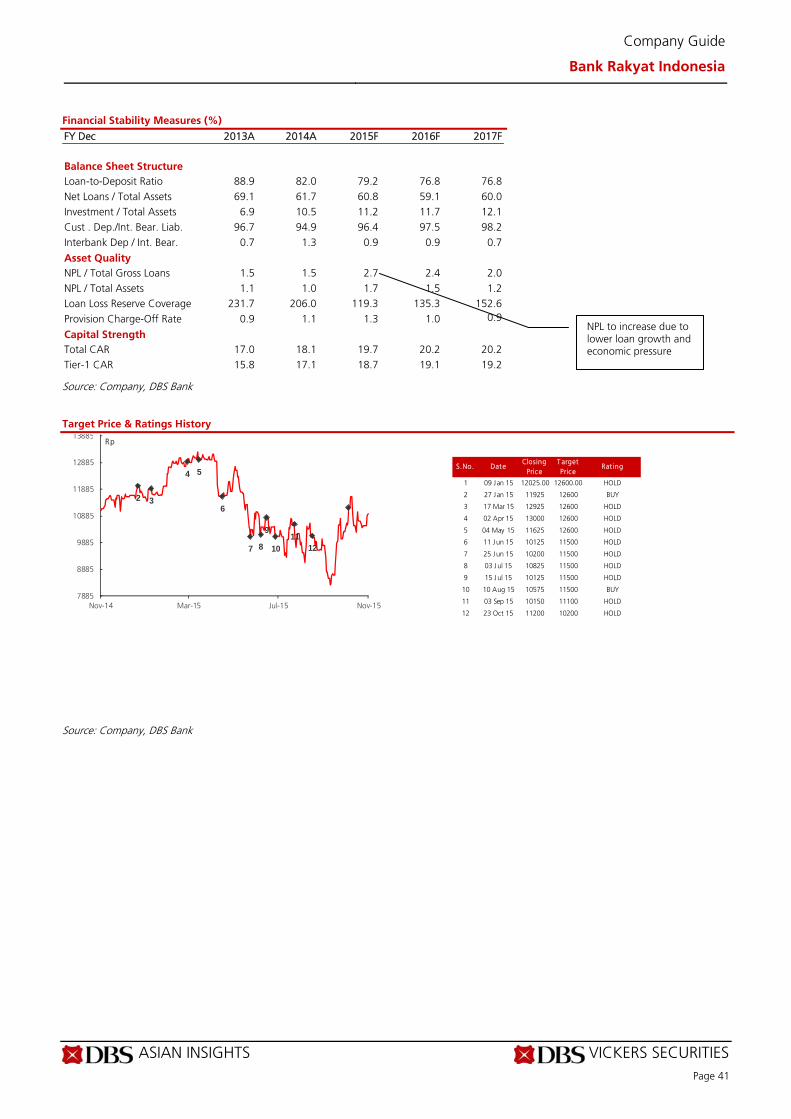
ASIAN INSIGHTS VICKERS SECURITIES Page 41
Company Guide
Bank Rakyat Indonesia
Financial Stability Measures (%)
FY Dec 2013A 2014A 2015F 2016F 2017F Balance Sheet Structure Loan-to-Deposit Ratio 88.9 82.0 79.2 76.8 76.8 Net Loans / Total Assets 69.1 61.7 60.8 59.1 60.0 Investment / Total Assets 6.9 10.5 11.2 11.7 12.1 Cust . Dep./Int. Bear. Liab. 96.7 94.9 96.4 97.5 98.2 Interbank Dep / Int. Bear. 0.7 1.3 0.9 0.9 0.7
Asset Quality NPL / Total Gross Loans 1.5 1.5 2.7 2.4 2.0 NPL / Total Assets 1.1 1.0 1.7 1.5 1.2 Loan Loss Reserve Coverage 231.7 206.0 119.3 135.3 152.6 Provision Charge-Off Rate 0.9 1.1 1.3 1.0 0.9
Capital Strength Total CAR 17.0 18.1 19.7 20.2 20.2 Tier-1 CAR 15.8 17.1 18.7 19.1 19.2
Source: Company, DBS Bank Target Price & Ratings History
Source: Company, DBS Bank
S.No. DateClosing
PriceT arget Price
Rat ing
1 09 Jan 15 12025.00 12600.00 HOLD
2 27 Jan 15 11925 12600 BUY
3 17 Mar 15 12925 12600 HOLD
4 02 Apr 15 13000 12600 HOLD
5 04 May 15 11625 12600 HOLD
6 11 Jun 15 10125 11500 HOLD
7 25 Jun 15 10200 11500 HOLD
8 03 Jul 15 10825 11500 HOLD
9 15 Jul 15 10125 11500 HOLD
10 10 Aug 15 10575 11500 BUY
11 03 Sep 15 10150 11100 HOLD
12 23 Oct 15 11200 10200 HOLD
2 3
4 5
6
7 8
9
10
1112
7885
8885
9885
10885
11885
12885
13885
Nov-14 Mar-15 Jul-15 Nov-15
Rp
NPL to increase due to lower loan growth and economic pressure

ASIAN INSIGHTS VICKERS SECURITIES ed: JS / sa: MA
HOLD
Last Traded Price: Rp1,280 (JCI : 4,545.86) Price Target : Rp1,080 (-16% downside) Potential Catalyst: Improving NPLs, government policies spur growth in housing loans Where we differ: Earnings slightly below consensus likely due to higher credit cost and NPL assumptions Analyst LIM Sue Lin +65 6682 3711 [email protected]
Price Relative
Forecasts and Valuation FY Dec (Rp bn) 2014A 2015F 2016F 2017F Pre-prov. Profit 2,318 2,806 3,311 3,989 Net Profit 1,116 1,534 1,816 2,207 Net Pft (Pre Ex.) 1,116 1,534 1,816 2,207 EPS (Rp) 108 148 175 213 EPS Pre Ex. (Rp) 108 148 175 213 EPS Gth (%) (29) 38 18 22 EPS Gth Pre Ex (%) (29) 38 18 22 Diluted EPS (Rp) 108 148 175 213 PE Pre Ex. (X) 11.9 8.6 7.3 6.0 Net DPS (Rp) 45 32 44 53 Div Yield (%) 3.5 2.5 3.5 4.1 ROAE Pre Ex. (%) 9.4 12.0 12.9 14.2 ROAE (%) 9.4 12.0 12.9 14.2 ROA (%) 0.8 1.0 1.0 1.1 BV Per Share (Rp) 1,179 1,295 1,426 1,586 P/Book Value (x) 1.1 1.0 0.9 0.8 Earnings Rev (%): 0 0 0 Consensus EPS (Rp): 147 177 210 Other Broker Recs: B: 13 S: 1 H: 6 Source of all data: Company, DBS Bank, Bloomberg Finance L.P
Back To Basics
Government-backed growth but asset quality remains its weak link. BBTN is in a favourable position as the government is targeting to build 1m low-cost houses for the year, for which BBTN will be a major financier. Although the Rp5.1tn funding for the subsidised mortgage programme (Fasilitas Likuiditas Pembiayaan Perumahan, FLPP) was used up by Aug 2015, BBTN is currently in negotiations with the government for a possible interest rate subsidy for the rest of the year. The FLPP scheme will be renegotiated in 2016. There is an inherent risk to NIM which is dependent on the lending yield and funding cost for the FLPP, negotiated on an annual basis with the Minister of Housing. While BBTN’s growth traction remains positive, we remain cautious on its asset quality of its non-housing segment. Government initiative to support growth. Of the 1m houses the government targets to build, BBTN will be involved in financing 460k houses under the FLPP, while another 400k houses will be offered under the non-subsidised mortgage. BBTN is reverting to its roots to focus back on the subsidised mortgages thanks to the government’s initiatives. We maintain a loan growth target of 17% for FY15-16F as we believe it may be challenging for the new subsidised scheme to take off in a big way over the next year due to the limited funding available from the government’s stretched budget. Fund raising for growth and capital. BBTN is planning to use various fundraising methods including the issue of asset-backed securities (Rp1.5tn), NCDs (Rp1tn) and bonds (Rp3tn), to grow its non-subsidised mortgage segment. Management recently indicated that the issuance of asset backed securities may be delayed due to the weak market. BBTN also plans to issue 5-year subordinated debt of US$200-300m to boost capital Valuation: We have a HOLD rating with TP of 1,080, based on the Gordon Growth Model and this implies 0.8x FY16F BV. Concerns on asset quality and earnings prospects have been an overhang. Its ability to maintain strong growth and better NIM would be a catalyst. Key Risks to Our View: Regulatory risks and delays. Administrative delays in the government's housing programme and insufficient housing units for financing may be a risk to BBTN’s growth. Changes in the FLPP scheme which may be unfavourable to BBTN is an earnings risk. Upside risk from better-than-expected NPL improvement. While we still remain cautious on NPL indicators, a quicker-than-expected resolution of its non-housing segment’s NPLs poses an upside risk to our forecasts. At A Glance Issued Capital (m shrs) 10,582 Mkt. Cap (Rpbn/US$m)
13,545 / 982
Major Shareholders Government of Indonesia (%) 60.1 Free Float (%) 39.9 3m Avg. Daily Val (US$m) 1.6 ICB Industry : Financials / Financial Services
DBS Group Research . Equity 4 Dec 2015
Indonesia Company Guide
Bank Tabungan Negara Edition 1 Version 2 | Bloomberg: BBTN IJ | Reuters: BBTN.JK Refer to important disclosures at the end of this report
47
67
87
107
127
147
167
187
207
756.0
956.0
1,156.0
1,356.0
1,556.0
1,756.0
Nov-11 Nov-12 Nov-13 Nov-14 Nov-15
Relative IndexRp
Bank Tabungan Negara (LHS) Relative JCI INDEX (RHS)

ASIAN INSIGHTS VICKERS SECURITIES Page 43
Company Guide
Bank Tabungan Negara
CRITICAL DATA POINTS TO WATCH
Earnings Drivers:
Strong loan growth supported by government programme. BBTN targets loans to grow by17-19% this year, supported by the government's 1m-unit housing programme. Of the 1m units, 460k units will be financed by the FLPP scheme and 400k units by non-subsidised mortgage loans, while the rest will be fully-subsidised by the government. BBTN will be involved in financing both the non-subsidised and subsidised mortgage segments (in 2014, BBTN had 95% market share of subsidised mortgage loans). While we believe BBTN will likely benefit from the above, the impact may be offset by lower lending yields under the revised FLPP scheme. We have assumed the lower end of management’s guidance for loan growth at 17% for FY15F. FLPP rate cut to boost growth but hurts NIM. In April 2015, the government cut the subsidised mortgage (FLPP) rate to 5% (from 7.25%). But the government increased its funding portion to 90% (from 75%) and reduced cost of funds to 0.3% (from 0.5%). BBTN has indicated that NIM can still decline by 20-30bps as a result, but hopes that the lost income will be offset by higher loan volumes. Currently, the FLPP budget of Rp5.1tn has been used up in August and BBTN is in talks with the government for a possible interest rate subsidy for the subsidised mortgage program until the end of the year. Next year’s FLPP scheme may pose as a risk to NIM if the government’s funding proportion is reduced. Strong deposit growth. BBTN expects deposits to grow by 19-20% and will focus on improving CASA. CASA-to-total deposits is still low vs larger bank peers. BBTN will do this by optimising existing branches, growing priority banking services and continue to work together with Post Office Indonesia as a point of sales. Additionally, BBTN will work on transaction banking by partnering with Pertamina for payments and offer attractive savings products with a reward system such as eBataraPos. Loan-to-deposit ratio will likely stay above 100% but the new rule on loan-to-funding ratio would be 90-95%. Maintain cost-to-income ratio; focus on operational efficiency. BBTN hopes to maintain its cost-to-income ratio this year by boosting fee-based income as well as improving the operational efficiency of existing branches instead of opening new ones. Fee-based income will be boosted by the sales of bancassurance, mutual funds and wealth management products. Provisions should taper off. We expect provision charge-off rates to taper off to 50bps in FY15F (FY14: 67bps), as we note that BBTN was faced with distressed loans for the subsidised mortgage scheme in FY13-14.
Margin Trends
Gross Loan& Growth
Customer Deposit & Growth
Loan-to-Deposit Ratio Trend
Cost & Income Structure
Source: Company, DBS Bank
4.1%
4.3%
4.5%
4.7%
4.9%
5.1%
5.3%
5.5%
0
1,000,000
2,000,000
3,000,000
4,000,000
5,000,000
6,000,000
7,000,000
8,000,000
9,000,000
2013A 2014A 2015F 2016F 2017F
Rp bn
Net Interest Income Net Interest Income Margin
10%
15%
20%
25%
30%
0
20,000
40,000
60,000
80,000
100,000
120,000
140,000
160,000
180,000
2013A 2014A 2015F 2016F 2017F
Rp bn
Gross Loan (LHS) Gross Loan Growth (%) (YoY) (RHS)
10%
15%
20%
25%
30%
0
20,000
40,000
60,000
80,000
100,000
120,000
140,000
160,000
2013A 2014A 2015F 2016F 2017F
Rp bn
Customer Deposits (LHS)
Customer Deposits Growth (%) (YoY) (RHS)
93%
98%
103%
108%
113%
118%
86,835
106,835
126,835
146,835
166,835
186,835
2013A 2014A 2015F 2016F 2017F
Loans Deposit Loan-to-Deposit Ratio (RHS)
0.58
0.59
0.6
0.61
0.62
0.63
0.64
0
2,000
4,000
6,000
8,000
10,000
12,000
2013A 2014A 2015F 2016F 2017F
Net Interest Income Non-interest Income Cost-to-income Ratio

ASIAN INSIGHTS VICKERS SECURITIES Page 44
Company Guide
Bank Tabungan Negara
Balance Sheet:
Aggressive NPL targets. BBTN is targeting for its NPL ratio to be at the 3% range by end-FY15F, driven by improvements in its screening and collection processes. However, we retain our cautious stance on BBTN’s asset quality position (FY15F NPL ratio assumption: 3.4%). While NPLs have improved for its housing segments (especially the subsidised mortgage portfolio), NPLs are still high for the commercial loan segment and other housing and construction loans. And with the challenging operating environment expected in 2015, significant improvements in NPLs for these segments may be hampered. Fund-raising for growth and capital. BBTN expects to use various means of fund-raising including the issuance of asset-backed securities (Rp1.5tn), NCDs (Rp1tn) and bonds (Rp3tn), particularly to fund its non-subsidised mortgage growth. Management indicated that issuance of asset backed securities may be delayed due to the weak market conditions. As loan growth is expected to remain high, thanks to government-driven initiatives, BBTN plans to raise capital by issuing sub-debt at the end of this year to support growth. Note that as BBTN’s loan-to-deposit ratio stays above 100%, it needs to maintain a mininum CAR of 14%. The government indicated that it has no plans for a capital injection to BBTN in the near future. Share Price Drivers:
Strong growth and reduction in cost of funds. Strong loan growth supported by the government's 1m-unit housing programme will boost earnings. The reduction in cost of funds will also improve margins as well as provide better opportunities for BBTN to raise funds by issuing asset-backed securities, NCDs and bonds. Key Risks:
Capital raising risk. As BBTN’s loan-to-deposit ratio stays above 100%, it needs to maintain a minimum CAR of 14%. There is not much buffer between this and BBTN’s current CAR level. We believe there is capital raising risk in the future. Further NPL deterioration. NPL levels remains high in the commercial loans segment while increasing in the non-subsidised housing segment. Deterioriation in these segments remains a key risk especially as the majority of the non-subsidised housing book will be converted to a floating interest rate scheme this year. COMPANY BACKGROUND
Bank Tabungan Negara (BBTN) provides commercial banking services. 88% of its loan book is related to property loans. BBTN specialises in subsidised mortgage loans and has the largest market share in this segment.
Asset Quality
Capitalisation (%)
ROE (%)
Forward PE Band (x)
PB Band (x)
Source: Company, DBS Bank
0.0%
0.5%
1.0%
1.5%
2.0%
2.5%
3.0%
3.5%
4.0%
4.5%
5.0%
2013A 2014A 2015F 2016F 2017F
NPL Ratio Provision Charge-Off Rate
12.0%
12.5%
13.0%
13.5%
14.0%
14.5%
15.0%
15.5%
16.0%
2013A 2014A 2015F 2016F 2017F
Tier-1 CAR Total CAR
0.0%
2.0%
4.0%
6.0%
8.0%
10.0%
12.0%
14.0%
2013A 2014A 2015F 2016F 2017F
Avg: 8.7x
+1sd: 10x
+2sd: 11.4x
‐1sd: 7.4x
‐2sd: 6x
5.1
6.1
7.1
8.1
9.1
10.1
11.1
12.1
13.1
Nov-11 Nov-12 Nov-13 Nov-14 Nov-15
(x)
Avg: 1.18x
+1sd: 1.48x
+2sd: 1.79x
‐1sd: 0.87x
‐2sd: 0.56x0.5
0.7
0.9
1.1
1.3
1.5
1.7
1.9
2.1
Nov-11 Nov-12 Nov-13 Nov-14 Nov-15
(x)
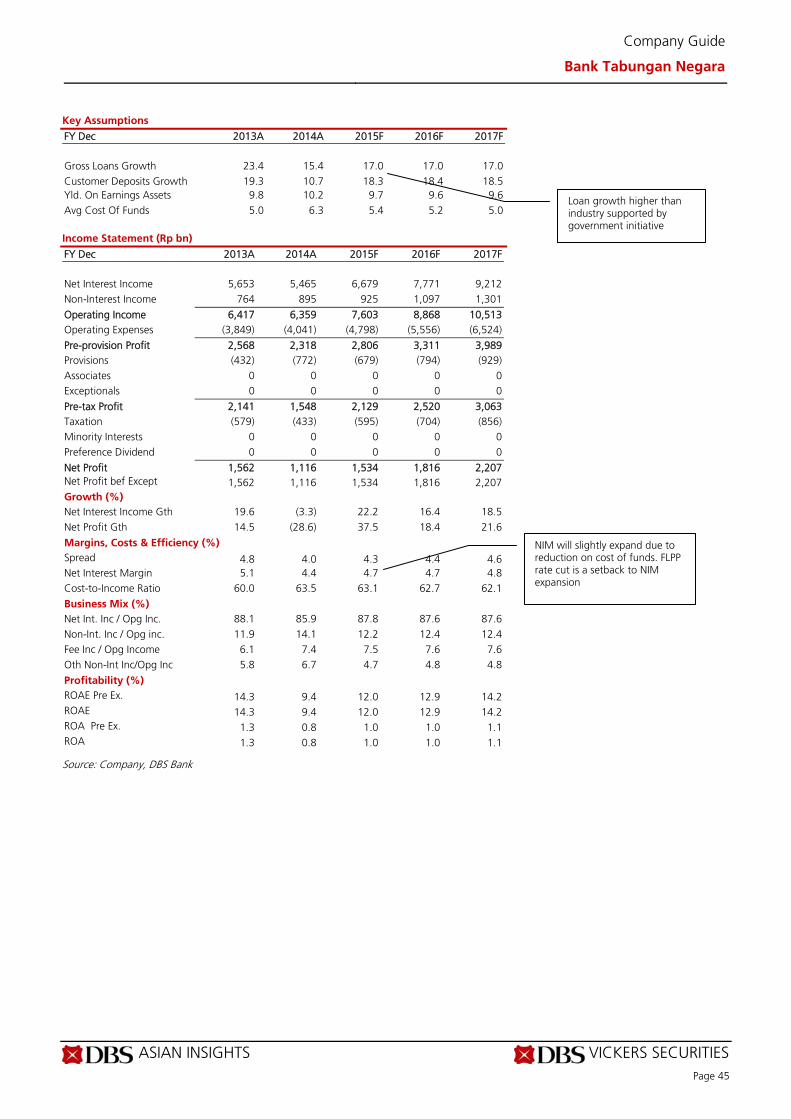
ASIAN INSIGHTS VICKERS SECURITIES Page 45
Company Guide
Bank Tabungan Negara
Key Assumptions
FY Dec 2013A 2014A 2015F 2016F 2017F
Gross Loans Growth 23.4 15.4 17.0 17.0 17.0 Customer Deposits Growth 19.3 10.7 18.3 18.4 18.5 Yld. On Earnings Assets 9.8 10.2 9.7 9.6 9.6 Avg Cost Of Funds 5.0 6.3 5.4 5.2 5.0 Income Statement (Rp bn)
FY Dec 2013A 2014A 2015F 2016F 2017F Net Interest Income 5,653 5,465 6,679 7,771 9,212 Non-Interest Income 764 895 925 1,097 1,301
Operating Income 6,417 6,359 7,603 8,868 10,513 Operating Expenses (3,849) (4,041) (4,798) (5,556) (6,524)
Pre-provision Profit 2,568 2,318 2,806 3,311 3,989 Provisions (432) (772) (679) (794) (929) Associates 0 0 0 0 0 Exceptionals 0 0 0 0 0
Pre-tax Profit 2,141 1,548 2,129 2,520 3,063 Taxation (579) (433) (595) (704) (856) Minority Interests 0 0 0 0 0 Preference Dividend 0 0 0 0 0
Net Profit 1,562 1,116 1,534 1,816 2,207 Net Profit bef Except 1,562 1,116 1,534 1,816 2,207 Growth (%) Net Interest Income Gth 19.6 (3.3) 22.2 16.4 18.5 Net Profit Gth 14.5 (28.6) 37.5 18.4 21.6
Margins, Costs & Efficiency (%) Spread 4.8 4.0 4.3 4.4 4.6 Net Interest Margin 5.1 4.4 4.7 4.7 4.8 Cost-to-Income Ratio 60.0 63.5 63.1 62.7 62.1
Business Mix (%) Net Int. Inc / Opg Inc. 88.1 85.9 87.8 87.6 87.6 Non-Int. Inc / Opg inc. 11.9 14.1 12.2 12.4 12.4 Fee Inc / Opg Income 6.1 7.4 7.5 7.6 7.6 Oth Non-Int Inc/Opg Inc 5.8 6.7 4.7 4.8 4.8
Profitability (%) ROAE Pre Ex. 14.3 9.4 12.0 12.9 14.2 ROAE 14.3 9.4 12.0 12.9 14.2 ROA Pre Ex. 1.3 0.8 1.0 1.0 1.1 ROA 1.3 0.8 1.0 1.0 1.1
Source: Company, DBS Bank
Loan growth higher than industry supported by government initiative
NIM will slightly expand due to reduction on cost of funds. FLPP rate cut is a setback to NIM expansion

ASIAN INSIGHTS VICKERS SECURITIES Page 46
Company Guide
Bank Tabungan Negara
Quarterly / Interim Income Statement (Rp bn)
FY Dec 3Q2014 4Q2014 1Q2015 2Q2015 3Q2015 Net Interest Income 1,307 1,497 1,554 1,633 1,771 Non-Interest Income 202 334 245 282 258
Operating Income 1,509 1,831 1,799 1,915 2,029 Operating Expenses (1,027) (1,063) (1,052) (1,241) (1,073)
Pre-Provision Profit 482 768 747 674 956 Provisions (175) (272) (189) (81) (388) Associates 0 0 0 0 0 Exceptionals 0 0 0 0 0
Pretax Profit 308 497 563 600 571 Taxation (92) (136) (161) (171) (180) Minority Interests 0 0 0 0 0
Net Profit 216 361 402 429 391 Growth (%) Net Interest Income Gth 5.7 14.5 3.8 5.1 8.5 Net Profit Gth 9.1 67.1 11.4 6.7 (8.9)
Balance Sheet (Rp bn)
FY Dec 2013A 2014A 2015F 2016F 2017F Cash/Bank Balance 11,183 11,385 12,506 16,255 20,131 Government Securities 8,385 8,238 9,062 9,968 10,965 Inter Bank Assets 4,839 1,496 1,532 1,609 1,689 Total Net Loans & Advs. 99,330 114,339 133,578 156,056 182,319 Investment 4,202 5,437 4,883 4,628 4,386 Associates 0 0 0 0 0 Fixed Assets 1,523 1,488 1,323 1,142 947 Goodwill 0 0 0 0 0 Other Assets 1,707 2,191 1,949 2,070 2,010
Total Assets 131,170 144,576 164,833 191,729 222,447 Customer Deposits 96,208 106,471 125,921 149,068 176,645 Inter Bank Deposits 275 1,179 727 953 840 Debts/Borrowings 15,910 15,518 16,720 18,392 20,231 Others 7,220 9,202 8,058 8,554 8,306
Minorities 0 0 0 0 0 Shareholders' Funds 11,557 12,206 13,406 14,761 16,424
Total Liab& S/H’s Funds 131,170 144,576 164,833 191,729 222,447
Source: Company, DBS Bank
Reduction in provision expense on a y-o-y basis due to better NPL ratios
To increase from bonds, NCD issuance
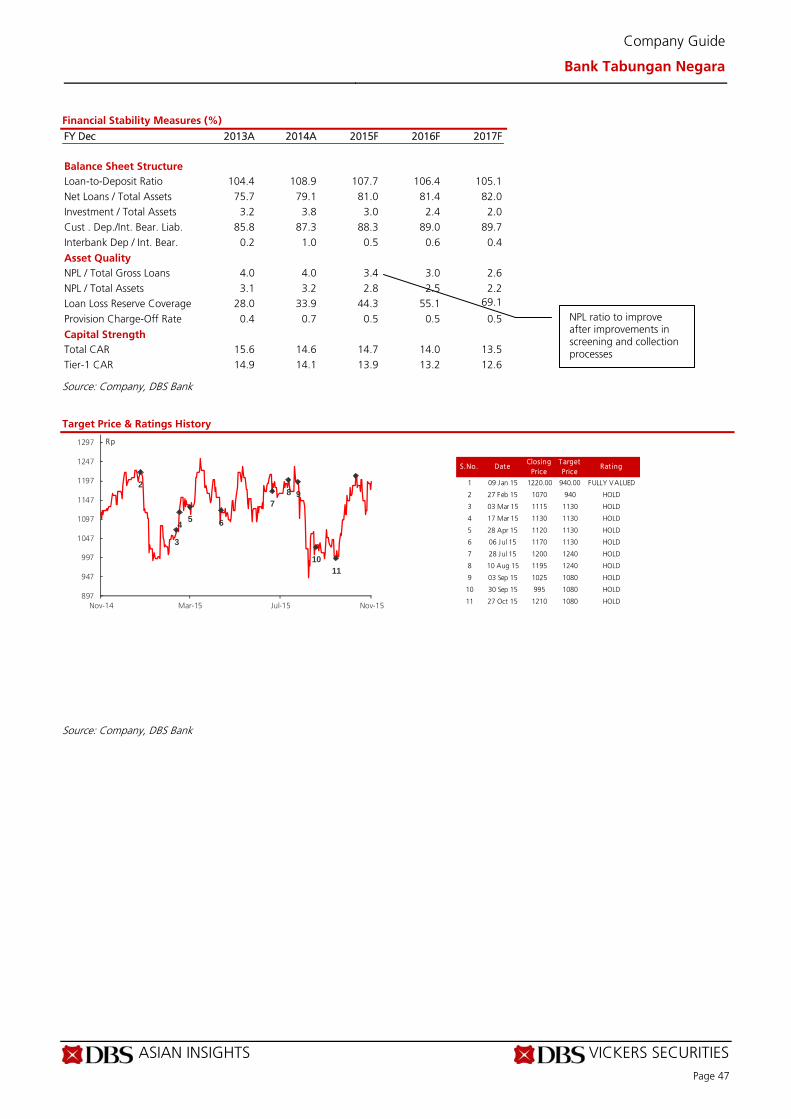
ASIAN INSIGHTS VICKERS SECURITIES Page 47
Company Guide
Bank Tabungan Negara
Financial Stability Measures (%)
FY Dec 2013A 2014A 2015F 2016F 2017F Balance Sheet Structure Loan-to-Deposit Ratio 104.4 108.9 107.7 106.4 105.1 Net Loans / Total Assets 75.7 79.1 81.0 81.4 82.0 Investment / Total Assets 3.2 3.8 3.0 2.4 2.0 Cust . Dep./Int. Bear. Liab. 85.8 87.3 88.3 89.0 89.7 Interbank Dep / Int. Bear. 0.2 1.0 0.5 0.6 0.4
Asset Quality NPL / Total Gross Loans 4.0 4.0 3.4 3.0 2.6 NPL / Total Assets 3.1 3.2 2.8 2.5 2.2 Loan Loss Reserve Coverage 28.0 33.9 44.3 55.1 69.1
Provision Charge-Off Rate 0.4 0.7 0.5 0.5 0.5
Capital Strength Total CAR 15.6 14.6 14.7 14.0 13.5 Tier-1 CAR 14.9 14.1 13.9 13.2 12.6
Source: Company, DBS Bank Target Price & Ratings History
Source: Company, DBS Bank
S.No. DateClosing
PriceT arget Price
Rat ing
1 09 Jan 15 1220.00 940.00 FULLY VALUED
2 27 Feb 15 1070 940 HOLD
3 03 Mar 15 1115 1130 HOLD
4 17 Mar 15 1130 1130 HOLD
5 28 Apr 15 1120 1130 HOLD
6 06 Jul 15 1170 1130 HOLD
7 28 Jul 15 1200 1240 HOLD
8 10 Aug 15 1195 1240 HOLD
9 03 Sep 15 1025 1080 HOLD
10 30 Sep 15 995 1080 HOLD
11 27 Oct 15 1210 1080 HOLD
2
3
45 6
78 9
1011
897
947
997
1047
1097
1147
1197
1247
1297
Nov-14 Mar-15 Jul-15 Nov-15
Rp
NPL ratio to improve after improvements in screening and collection processes
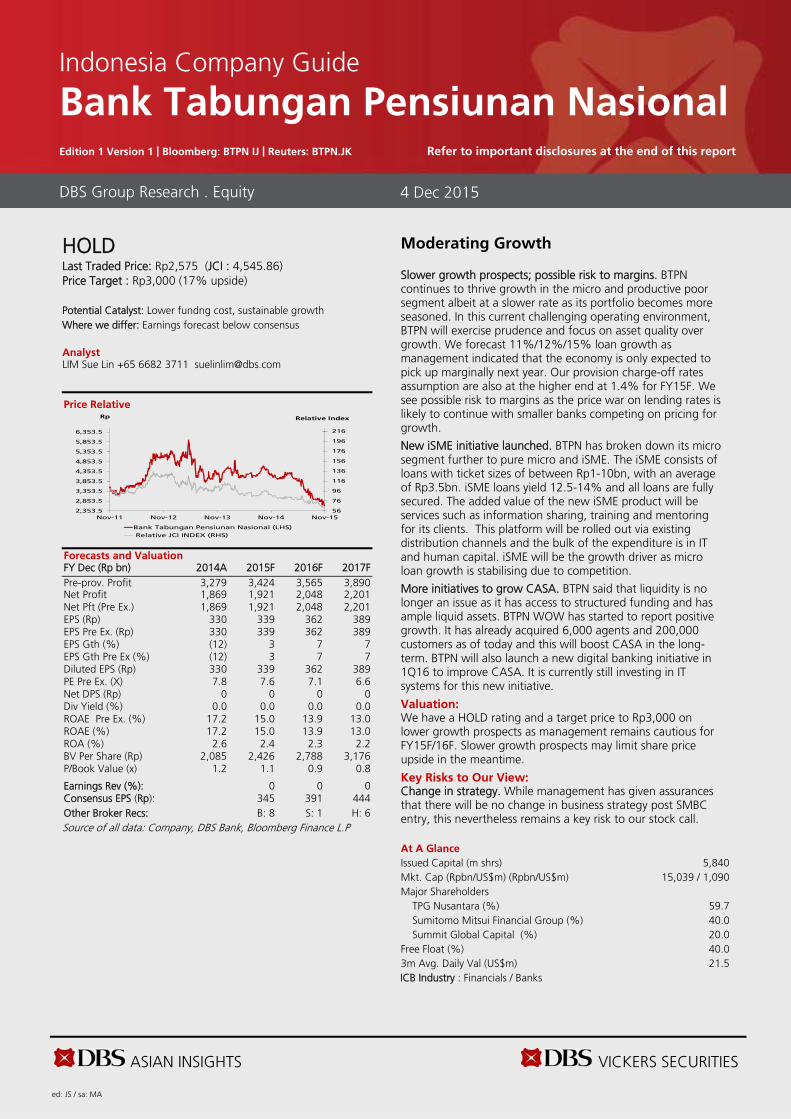
ASIAN INSIGHTS VICKERS SECURITIES ed: JS / sa: MA
HOLD
Last Traded Price: Rp2,575 (JCI : 4,545.86) Price Target : Rp3,000 (17% upside) Potential Catalyst: Lower fundng cost, sustainable growth Where we differ: Earnings forecast below consensus Analyst LIM Sue Lin +65 6682 3711 [email protected]
Price Relative
Forecasts and Valuation FY Dec (Rp bn) 2014A 2015F 2016F 2017F Pre-prov. Profit 3,279 3,424 3,565 3,890 Net Profit 1,869 1,921 2,048 2,201 Net Pft (Pre Ex.) 1,869 1,921 2,048 2,201 EPS (Rp) 330 339 362 389 EPS Pre Ex. (Rp) 330 339 362 389 EPS Gth (%) (12) 3 7 7 EPS Gth Pre Ex (%) (12) 3 7 7 Diluted EPS (Rp) 330 339 362 389 PE Pre Ex. (X) 7.8 7.6 7.1 6.6 Net DPS (Rp) 0 0 0 0 Div Yield (%) 0.0 0.0 0.0 0.0 ROAE Pre Ex. (%) 17.2 15.0 13.9 13.0 ROAE (%) 17.2 15.0 13.9 13.0 ROA (%) 2.6 2.4 2.3 2.2 BV Per Share (Rp) 2,085 2,426 2,788 3,176 P/Book Value (x) 1.2 1.1 0.9 0.8 Earnings Rev (%): 0 0 0 Consensus EPS (Rp): 345 391 444 Other Broker Recs: B: 8 S: 1 H: 6 Source of all data: Company, DBS Bank, Bloomberg Finance L.P
Moderating Growth Slower growth prospects; possible risk to margins. BTPN continues to thrive growth in the micro and productive poor segment albeit at a slower rate as its portfolio becomes more seasoned. In this current challenging operating environment, BTPN will exercise prudence and focus on asset quality over growth. We forecast 11%/12%/15% loan growth as management indicated that the economy is only expected to pick up marginally next year. Our provision charge-off rates assumption are also at the higher end at 1.4% for FY15F. We see possible risk to margins as the price war on lending rates is likely to continue with smaller banks competing on pricing for growth.
New iSME initiative launched. BTPN has broken down its micro segment further to pure micro and iSME. The iSME consists of loans with ticket sizes of between Rp1-10bn, with an average of Rp3.5bn. iSME loans yield 12.5-14% and all loans are fully secured. The added value of the new iSME product will be services such as information sharing, training and mentoring for its clients. This platform will be rolled out via existing distribution channels and the bulk of the expenditure is in IT and human capital. iSME will be the growth driver as micro loan growth is stabilising due to competition.
More initiatives to grow CASA. BTPN said that liquidity is no longer an issue as it has access to structured funding and has ample liquid assets. BTPN WOW has started to report positive growth. It has already acquired 6,000 agents and 200,000 customers as of today and this will boost CASA in the long-term. BTPN will also launch a new digital banking initiative in 1Q16 to improve CASA. It is currently still investing in IT systems for this new initiative.
Valuation: We have a HOLD rating and a target price to Rp3,000 on lower growth prospects as management remains cautious for FY15F/16F. Slower growth prospects may limit share price upside in the meantime.
Key Risks to Our View: Change in strategy. While management has given assurances that there will be no change in business strategy post SMBC entry, this nevertheless remains a key risk to our stock call. At A Glance Issued Capital (m shrs) 5,840 Mkt. Cap (Rpbn/US$m) (Rpbn/US$m) 15,039 / 1,090 Major Shareholders TPG Nusantara (%) 59.7 Sumitomo Mitsui Financial Group (%) 40.0 Summit Global Capital (%) 20.0 Free Float (%) 40.0 3m Avg. Daily Val (US$m) 21.5 ICB Industry : Financials / Banks
DBS Group Research . Equity 4 Dec 2015
Indonesia Company Guide
Bank Tabungan Pensiunan Nasional Edition 1 Version 1 | Bloomberg: BTPN IJ | Reuters: BTPN.JK Refer to important disclosures at the end of this report
56
76
96
116
136
156
176
196
216
2,353.5
2,853.5
3,353.5
3,853.5
4,353.5
4,853.5
5,353.5
5,853.5
6,353.5
Nov-11 Nov-12 Nov-13 Nov-14 Nov-15
Relative IndexRp
Bank Tabungan Pensiunan Nasional (LHS)
Relative JCI INDEX (RHS)
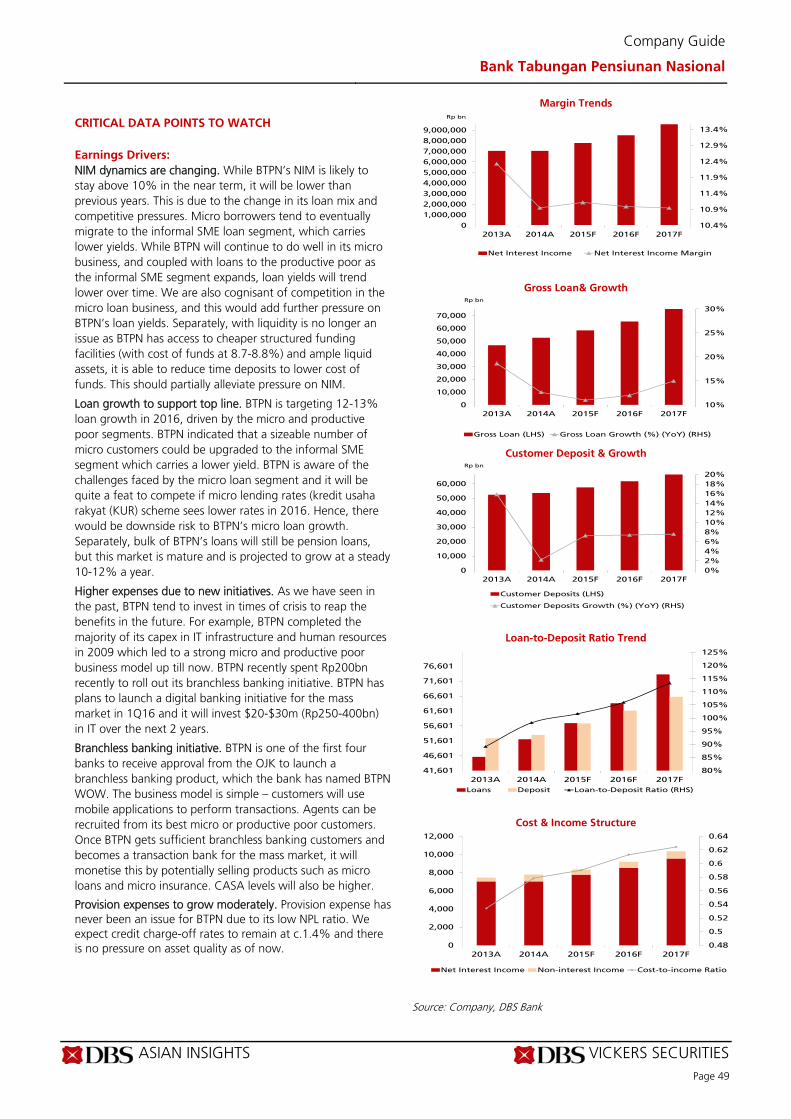
ASIAN INSIGHTS VICKERS SECURITIES Page 49
Company Guide
Bank Tabungan Pensiunan Nasional
CRITICAL DATA POINTS TO WATCH
Earnings Drivers:
NIM dynamics are changing. While BTPN’s NIM is likely to stay above 10% in the near term, it will be lower than previous years. This is due to the change in its loan mix and competitive pressures. Micro borrowers tend to eventually migrate to the informal SME loan segment, which carries lower yields. While BTPN will continue to do well in its micro business, and coupled with loans to the productive poor as the informal SME segment expands, loan yields will trend lower over time. We are also cognisant of competition in the micro loan business, and this would add further pressure on BTPN’s loan yields. Separately, with liquidity is no longer an issue as BTPN has access to cheaper structured funding facilities (with cost of funds at 8.7-8.8%) and ample liquid assets, it is able to reduce time deposits to lower cost of funds. This should partially alleviate pressure on NIM.
Loan growth to support top line. BTPN is targeting 12-13% loan growth in 2016, driven by the micro and productive poor segments. BTPN indicated that a sizeable number of micro customers could be upgraded to the informal SME segment which carries a lower yield. BTPN is aware of the challenges faced by the micro loan segment and it will be quite a feat to compete if micro lending rates (kredit usaha rakyat (KUR) scheme sees lower rates in 2016. Hence, there would be downside risk to BTPN’s micro loan growth. Separately, bulk of BTPN’s loans will still be pension loans, but this market is mature and is projected to grow at a steady 10-12% a year.
Higher expenses due to new initiatives. As we have seen in the past, BTPN tend to invest in times of crisis to reap the benefits in the future. For example, BTPN completed the majority of its capex in IT infrastructure and human resources in 2009 which led to a strong micro and productive poor business model up till now. BTPN recently spent Rp200bn recently to roll out its branchless banking initiative. BTPN has plans to launch a digital banking initiative for the mass market in 1Q16 and it will invest $20-$30m (Rp250-400bn) in IT over the next 2 years.
Branchless banking initiative. BTPN is one of the first four banks to receive approval from the OJK to launch a branchless banking product, which the bank has named BTPN WOW. The business model is simple – customers will use mobile applications to perform transactions. Agents can be recruited from its best micro or productive poor customers. Once BTPN gets sufficient branchless banking customers and becomes a transaction bank for the mass market, it will monetise this by potentially selling products such as micro loans and micro insurance. CASA levels will also be higher.
Provision expenses to grow moderately. Provision expense has never been an issue for BTPN due to its low NPL ratio. We expect credit charge-off rates to remain at c.1.4% and there is no pressure on asset quality as of now.
Margin Trends
Gross Loan& Growth
Customer Deposit & Growth
Loan-to-Deposit Ratio Trend
Cost & Income Structure
Source: Company, DBS Bank
10.4%
10.9%
11.4%
11.9%
12.4%
12.9%
13.4%
0
1,000,000
2,000,000
3,000,000
4,000,000
5,000,000
6,000,000
7,000,000
8,000,000
9,000,000
2013A 2014A 2015F 2016F 2017F
Rp bn
Net Interest Income Net Interest Income Margin
10%
15%
20%
25%
30%
0
10,000
20,000
30,000
40,000
50,000
60,000
70,000
2013A 2014A 2015F 2016F 2017F
Rp bn
Gross Loan (LHS) Gross Loan Growth (%) (YoY) (RHS)
0%
2%
4%
6%
8%
10%
12%
14%
16%
18%
20%
0
10,000
20,000
30,000
40,000
50,000
60,000
2013A 2014A 2015F 2016F 2017F
Rp bn
Customer Deposits (LHS)
Customer Deposits Growth (%) (YoY) (RHS)
80%
85%
90%
95%
100%
105%
110%
115%
120%
125%
41,601
46,601
51,601
56,601
61,601
66,601
71,601
76,601
2013A 2014A 2015F 2016F 2017F
Loans Deposit Loan-to-Deposit Ratio (RHS)
0.48
0.5
0.52
0.54
0.56
0.58
0.6
0.62
0.64
0
2,000
4,000
6,000
8,000
10,000
12,000
2013A 2014A 2015F 2016F 2017F
Net Interest Income Non-interest Income Cost-to-income Ratio
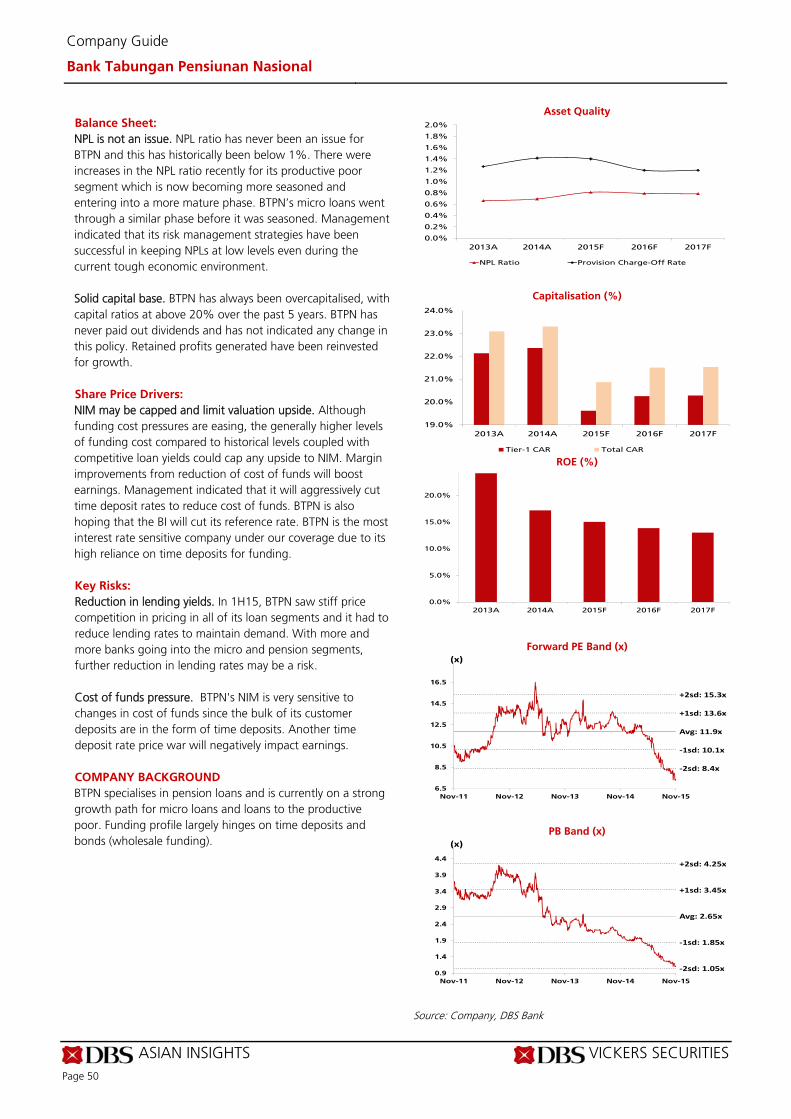
ASIAN INSIGHTS VICKERS SECURITIES Page 50
Company Guide
Bank Tabungan Pensiunan Nasional
Balance Sheet:
NPL is not an issue. NPL ratio has never been an issue for BTPN and this has historically been below 1%. There were increases in the NPL ratio recently for its productive poor segment which is now becoming more seasoned and entering into a more mature phase. BTPN’s micro loans went through a similar phase before it was seasoned. Management indicated that its risk management strategies have been successful in keeping NPLs at low levels even during the current tough economic environment. Solid capital base. BTPN has always been overcapitalised, with capital ratios at above 20% over the past 5 years. BTPN has never paid out dividends and has not indicated any change in this policy. Retained profits generated have been reinvested for growth.
Share Price Drivers:
NIM may be capped and limit valuation upside. Although funding cost pressures are easing, the generally higher levels of funding cost compared to historical levels coupled with competitive loan yields could cap any upside to NIM. Margin improvements from reduction of cost of funds will boost earnings. Management indicated that it will aggressively cut time deposit rates to reduce cost of funds. BTPN is also hoping that the BI will cut its reference rate. BTPN is the most interest rate sensitive company under our coverage due to its high reliance on time deposits for funding. Key Risks:
Reduction in lending yields. In 1H15, BTPN saw stiff price competition in pricing in all of its loan segments and it had to reduce lending rates to maintain demand. With more and more banks going into the micro and pension segments, further reduction in lending rates may be a risk. Cost of funds pressure. BTPN's NIM is very sensitive to changes in cost of funds since the bulk of its customer deposits are in the form of time deposits. Another time deposit rate price war will negatively impact earnings. COMPANY BACKGROUND
BTPN specialises in pension loans and is currently on a strong growth path for micro loans and loans to the productive poor. Funding profile largely hinges on time deposits and bonds (wholesale funding).
Asset Quality
Capitalisation (%)
ROE (%)
Forward PE Band (x)
PB Band (x)
Source: Company, DBS Bank
0.0%
0.2%
0.4%
0.6%
0.8%
1.0%
1.2%
1.4%
1.6%
1.8%
2.0%
2013A 2014A 2015F 2016F 2017F
NPL Ratio Provision Charge-Off Rate
19.0%
20.0%
21.0%
22.0%
23.0%
24.0%
2013A 2014A 2015F 2016F 2017F
Tier-1 CAR Total CAR
0.0%
5.0%
10.0%
15.0%
20.0%
2013A 2014A 2015F 2016F 2017F
Avg: 11.9x
+1sd: 13.6x
+2sd: 15.3x
‐1sd: 10.1x
‐2sd: 8.4x
6.5
8.5
10.5
12.5
14.5
16.5
Nov-11 Nov-12 Nov-13 Nov-14 Nov-15
(x)
Avg: 2.65x
+1sd: 3.45x
+2sd: 4.25x
‐1sd: 1.85x
‐2sd: 1.05x0.9
1.4
1.9
2.4
2.9
3.4
3.9
4.4
Nov-11 Nov-12 Nov-13 Nov-14 Nov-15
(x)
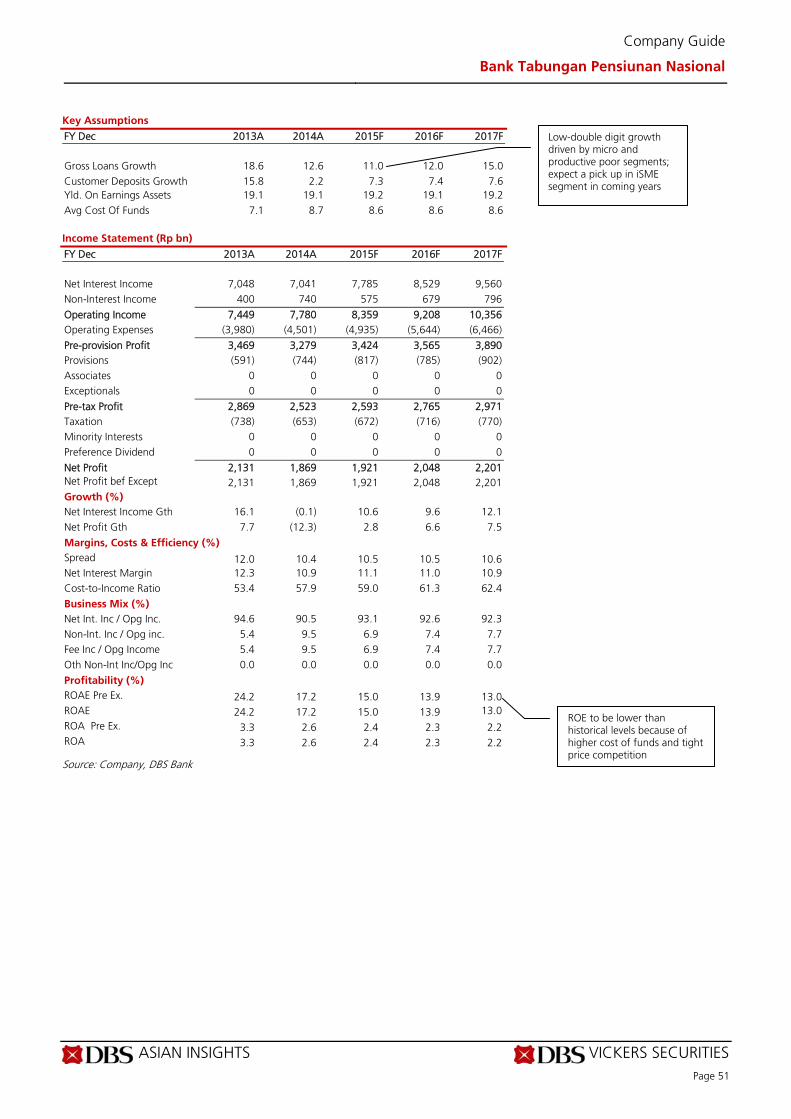
ASIAN INSIGHTS VICKERS SECURITIES Page 51
Company Guide
Bank Tabungan Pensiunan Nasional
Key Assumptions
FY Dec 2013A 2014A 2015F 2016F 2017F
Gross Loans Growth 18.6 12.6 11.0 12.0 15.0 Customer Deposits Growth 15.8 2.2 7.3 7.4 7.6 Yld. On Earnings Assets 19.1 19.1 19.2 19.1 19.2 Avg Cost Of Funds 7.1 8.7 8.6 8.6 8.6 Income Statement (Rp bn)
FY Dec 2013A 2014A 2015F 2016F 2017F Net Interest Income 7,048 7,041 7,785 8,529 9,560 Non-Interest Income 400 740 575 679 796
Operating Income 7,449 7,780 8,359 9,208 10,356 Operating Expenses (3,980) (4,501) (4,935) (5,644) (6,466)
Pre-provision Profit 3,469 3,279 3,424 3,565 3,890 Provisions (591) (744) (817) (785) (902) Associates 0 0 0 0 0 Exceptionals 0 0 0 0 0
Pre-tax Profit 2,869 2,523 2,593 2,765 2,971 Taxation (738) (653) (672) (716) (770) Minority Interests 0 0 0 0 0 Preference Dividend 0 0 0 0 0
Net Profit 2,131 1,869 1,921 2,048 2,201 Net Profit bef Except 2,131 1,869 1,921 2,048 2,201 Growth (%) Net Interest Income Gth 16.1 (0.1) 10.6 9.6 12.1 Net Profit Gth 7.7 (12.3) 2.8 6.6 7.5
Margins, Costs & Efficiency (%) Spread 12.0 10.4 10.5 10.5 10.6 Net Interest Margin 12.3 10.9 11.1 11.0 10.9 Cost-to-Income Ratio 53.4 57.9 59.0 61.3 62.4
Business Mix (%) Net Int. Inc / Opg Inc. 94.6 90.5 93.1 92.6 92.3 Non-Int. Inc / Opg inc. 5.4 9.5 6.9 7.4 7.7 Fee Inc / Opg Income 5.4 9.5 6.9 7.4 7.7 Oth Non-Int Inc/Opg Inc 0.0 0.0 0.0 0.0 0.0
Profitability (%) ROAE Pre Ex. 24.2 17.2 15.0 13.9 13.0 ROAE 24.2 17.2 15.0 13.9 13.0 ROA Pre Ex. 3.3 2.6 2.4 2.3 2.2 ROA 3.3 2.6 2.4 2.3 2.2
Source: Company, DBS Bank
Low-double digit growth driven by micro and productive poor segments; expect a pick up in iSME segment in coming years
ROE to be lower than historical levels because of higher cost of funds and tight price competition
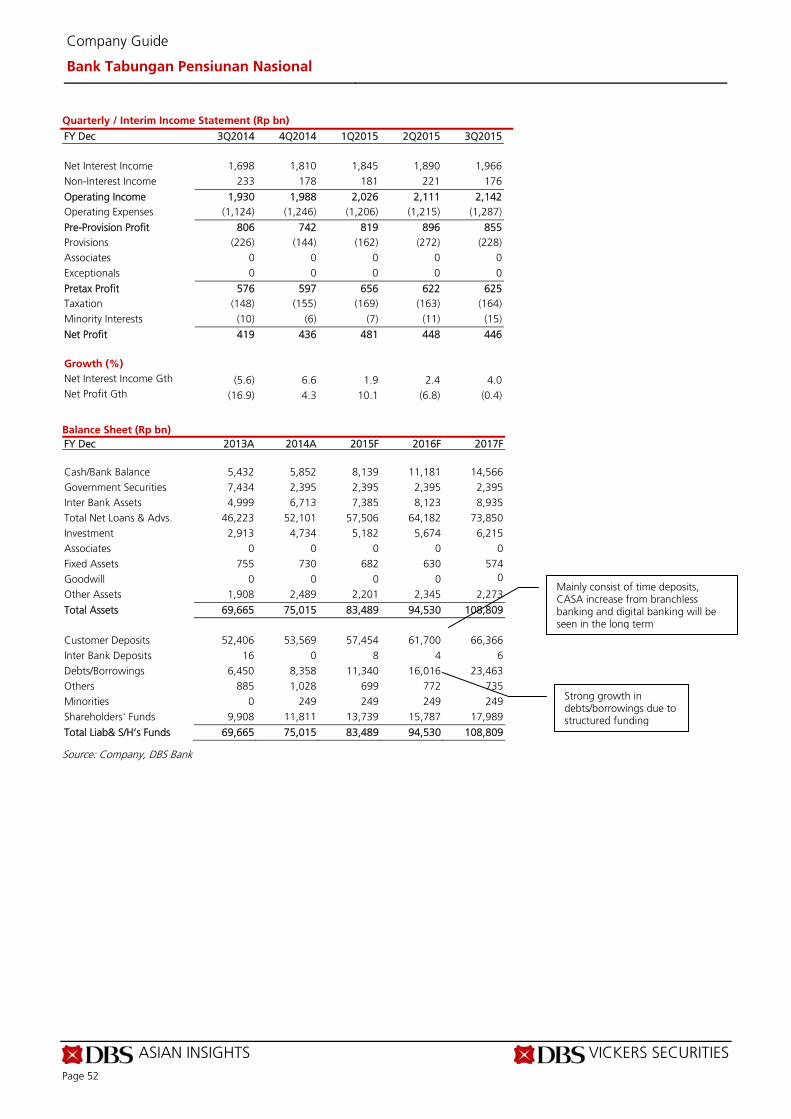
ASIAN INSIGHTS VICKERS SECURITIES Page 52
Company Guide
Bank Tabungan Pensiunan Nasional
Quarterly / Interim Income Statement (Rp bn)
FY Dec 3Q2014 4Q2014 1Q2015 2Q2015 3Q2015 Net Interest Income 1,698 1,810 1,845 1,890 1,966 Non-Interest Income 233 178 181 221 176
Operating Income 1,930 1,988 2,026 2,111 2,142 Operating Expenses (1,124) (1,246) (1,206) (1,215) (1,287)
Pre-Provision Profit 806 742 819 896 855 Provisions (226) (144) (162) (272) (228) Associates 0 0 0 0 0 Exceptionals 0 0 0 0 0
Pretax Profit 576 597 656 622 625 Taxation (148) (155) (169) (163) (164) Minority Interests (10) (6) (7) (11) (15)
Net Profit 419 436 481 448 446 Growth (%) Net Interest Income Gth (5.6) 6.6 1.9 2.4 4.0 Net Profit Gth (16.9) 4.3 10.1 (6.8) (0.4)
Balance Sheet (Rp bn)
FY Dec 2013A 2014A 2015F 2016F 2017F Cash/Bank Balance 5,432 5,852 8,139 11,181 14,566 Government Securities 7,434 2,395 2,395 2,395 2,395 Inter Bank Assets 4,999 6,713 7,385 8,123 8,935 Total Net Loans & Advs. 46,223 52,101 57,506 64,182 73,850 Investment 2,913 4,734 5,182 5,674 6,215 Associates 0 0 0 0 0 Fixed Assets 755 730 682 630 574 Goodwill 0 0 0 0 0
Other Assets 1,908 2,489 2,201 2,345 2,273
Total Assets 69,665 75,015 83,489 94,530 108,809 Customer Deposits 52,406 53,569 57,454 61,700 66,366 Inter Bank Deposits 16 0 8 4 6 Debts/Borrowings 6,450 8,358 11,340 16,016 23,463 Others 885 1,028 699 772 735 Minorities 0 249 249 249 249 Shareholders' Funds 9,908 11,811 13,739 15,787 17,989
Total Liab& S/H’s Funds 69,665 75,015 83,489 94,530 108,809
Source: Company, DBS Bank
Mainly consist of time deposits, CASA increase from branchless banking and digital banking will be seen in the long term
Strong growth in debts/borrowings due to structured funding
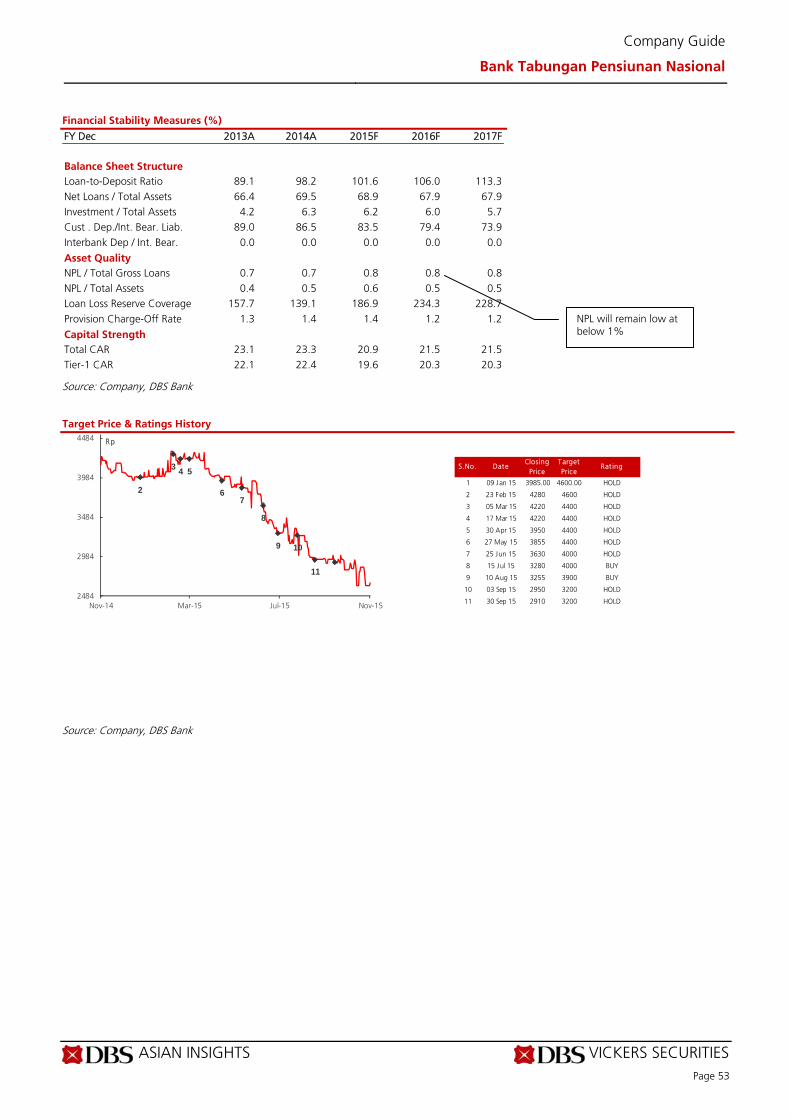
ASIAN INSIGHTS VICKERS SECURITIES Page 53
Company Guide
Bank Tabungan Pensiunan Nasional
Financial Stability Measures (%)
FY Dec 2013A 2014A 2015F 2016F 2017F Balance Sheet Structure Loan-to-Deposit Ratio 89.1 98.2 101.6 106.0 113.3 Net Loans / Total Assets 66.4 69.5 68.9 67.9 67.9 Investment / Total Assets 4.2 6.3 6.2 6.0 5.7 Cust . Dep./Int. Bear. Liab. 89.0 86.5 83.5 79.4 73.9 Interbank Dep / Int. Bear. 0.0 0.0 0.0 0.0 0.0
Asset Quality NPL / Total Gross Loans 0.7 0.7 0.8 0.8 0.8 NPL / Total Assets 0.4 0.5 0.6 0.5 0.5 Loan Loss Reserve Coverage 157.7 139.1 186.9 234.3 228.7 Provision Charge-Off Rate 1.3 1.4 1.4 1.2 1.2
Capital Strength Total CAR 23.1 23.3 20.9 21.5 21.5 Tier-1 CAR 22.1 22.4 19.6 20.3 20.3
Source: Company, DBS Bank Target Price & Ratings History
Source: Company, DBS Bank
S.No. DateClosing
PriceTarget Price
Rat ing
1 09 Jan 15 3985.00 4600.00 HOLD
2 23 Feb 15 4280 4600 HOLD
3 05 Mar 15 4220 4400 HOLD
4 17 Mar 15 4220 4400 HOLD
5 30 Apr 15 3950 4400 HOLD
6 27 May 15 3855 4400 HOLD
7 25 Jun 15 3630 4000 HOLD
8 15 Jul 15 3280 4000 BUY
9 10 Aug 15 3255 3900 BUY
10 03 Sep 15 2950 3200 HOLD
11 30 Sep 15 2910 3200 HOLD
2
34 5
67
8
9 10
11
2484
2984
3484
3984
4484
Nov-14 Mar-15 Jul-15 Nov-15
Rp
NPL will remain low at below 1%
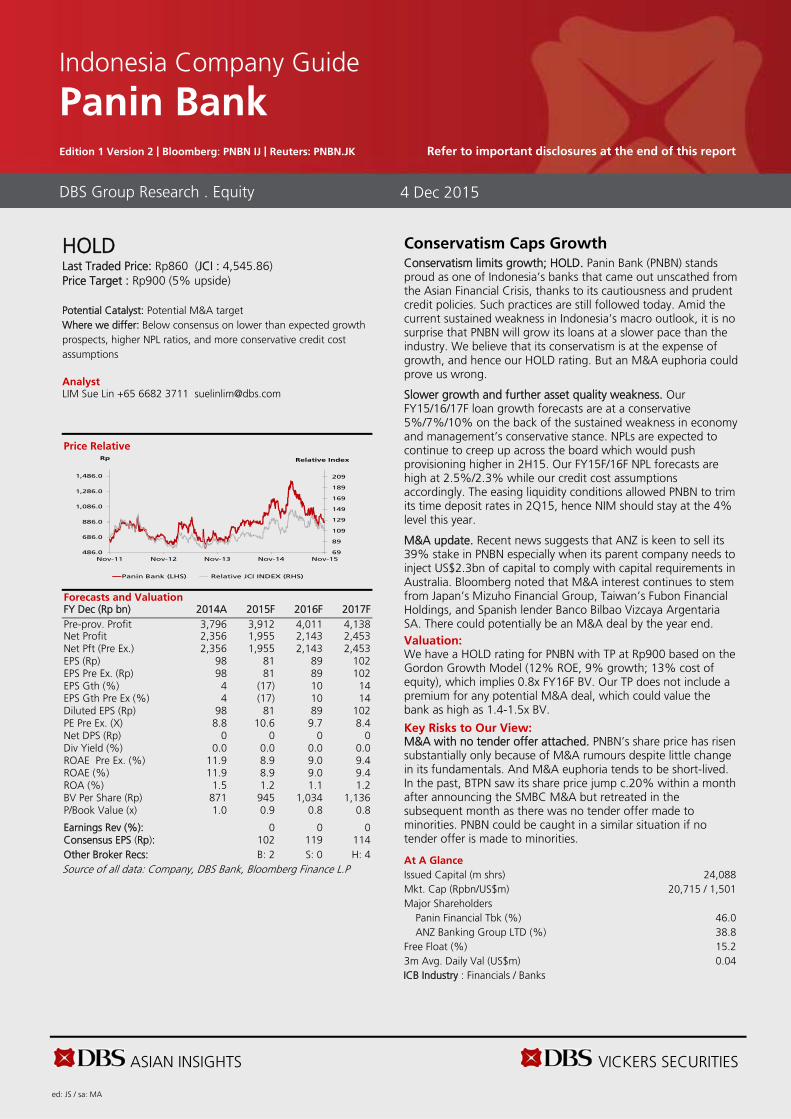
ASIAN INSIGHTS VICKERS SECURITIES ed: JS / sa: MA
HOLD
Last Traded Price: Rp860 (JCI : 4,545.86) Price Target : Rp900 (5% upside) Potential Catalyst: Potential M&A target Where we differ: Below consensus on lower than expected growth prospects, higher NPL ratios, and more conservative credit cost assumptions Analyst LIM Sue Lin +65 6682 3711 [email protected]
Price Relative
Forecasts and Valuation FY Dec (Rp bn) 2014A 2015F 2016F 2017F Pre-prov. Profit 3,796 3,912 4,011 4,138 Net Profit 2,356 1,955 2,143 2,453 Net Pft (Pre Ex.) 2,356 1,955 2,143 2,453 EPS (Rp) 98 81 89 102 EPS Pre Ex. (Rp) 98 81 89 102 EPS Gth (%) 4 (17) 10 14 EPS Gth Pre Ex (%) 4 (17) 10 14 Diluted EPS (Rp) 98 81 89 102 PE Pre Ex. (X) 8.8 10.6 9.7 8.4 Net DPS (Rp) 0 0 0 0 Div Yield (%) 0.0 0.0 0.0 0.0 ROAE Pre Ex. (%) 11.9 8.9 9.0 9.4 ROAE (%) 11.9 8.9 9.0 9.4 ROA (%) 1.5 1.2 1.1 1.2 BV Per Share (Rp) 871 945 1,034 1,136 P/Book Value (x) 1.0 0.9 0.8 0.8 Earnings Rev (%): 0 0 0 Consensus EPS (Rp): 102 119 114 Other Broker Recs: B: 2 S: 0 H: 4 Source of all data: Company, DBS Bank, Bloomberg Finance L.P
Conservatism Caps Growth Conservatism limits growth; HOLD. Panin Bank (PNBN) stands proud as one of Indonesia’s banks that came out unscathed from the Asian Financial Crisis, thanks to its cautiousness and prudent credit policies. Such practices are still followed today. Amid the current sustained weakness in Indonesia’s macro outlook, it is no surprise that PNBN will grow its loans at a slower pace than the industry. We believe that its conservatism is at the expense of growth, and hence our HOLD rating. But an M&A euphoria could prove us wrong.
Slower growth and further asset quality weakness. Our FY15/16/17F loan growth forecasts are at a conservative 5%/7%/10% on the back of the sustained weakness in economy and management’s conservative stance. NPLs are expected to continue to creep up across the board which would push provisioning higher in 2H15. Our FY15F/16F NPL forecasts are high at 2.5%/2.3% while our credit cost assumptions accordingly. The easing liquidity conditions allowed PNBN to trim its time deposit rates in 2Q15, hence NIM should stay at the 4% level this year.
M&A update. Recent news suggests that ANZ is keen to sell its 39% stake in PNBN especially when its parent company needs to inject US$2.3bn of capital to comply with capital requirements in Australia. Bloomberg noted that M&A interest continues to stem from Japan’s Mizuho Financial Group, Taiwan’s Fubon Financial Holdings, and Spanish lender Banco Bilbao Vizcaya Argentaria SA. There could potentially be an M&A deal by the year end. Valuation: We have a HOLD rating for PNBN with TP at Rp900 based on the Gordon Growth Model (12% ROE, 9% growth; 13% cost of equity), which implies 0.8x FY16F BV. Our TP does not include a premium for any potential M&A deal, which could value the bank as high as 1.4-1.5x BV.
Key Risks to Our View: M&A with no tender offer attached. PNBN’s share price has risen substantially only because of M&A rumours despite little change in its fundamentals. And M&A euphoria tends to be short-lived. In the past, BTPN saw its share price jump c.20% within a month after announcing the SMBC M&A but retreated in the subsequent month as there was no tender offer made to minorities. PNBN could be caught in a similar situation if no tender offer is made to minorities.
At A Glance Issued Capital (m shrs) 24,088 Mkt. Cap (Rpbn/US$m)
20,715 / 1,501
Major Shareholders Panin Financial Tbk (%) 46.0 ANZ Banking Group LTD (%) 38.8 Free Float (%) 15.2 3m Avg. Daily Val (US$m) 0.04 ICB Industry : Financials / Banks
DBS Group Research . Equity 4 Dec 2015
Indonesia Company Guide
Panin Bank Edition 1 Version 2 | Bloomberg: PNBN IJ | Reuters: PNBN.JK Refer to important disclosures at the end of this report
69
89
109
129
149
169
189
209
486.0
686.0
886.0
1,086.0
1,286.0
1,486.0
Nov-11 Nov-12 Nov-13 Nov-14 Nov-15
Relative IndexRp
Panin Bank (LHS) Relative JCI INDEX (RHS)

ASIAN INSIGHTS VICKERS SECURITIES Page 55
Company Guide
Panin Bank
CRITICAL DATA POINTS TO WATCH
Earnings Drivers:
Loans targeting SME niche market. PNBN has always focused on the SME and the commercial segment, particularly traders. PNBN is also funding mortgages through agents in the secondary market. We expect loan growth of only 5% this year due to the slow economic environment. NIM to stay stable. PNBN expects NIM to stay flat this year. Cost of funds reductions will be felt after trimming down time deposit rates. Lending rates will also be adjusted accordingly since PNBN uses a cost-plus pricing model to price its loans. We expect NIM to stay flat at c.4%. Maintain liquidity, CASA ratio lower than historical levels. PNBN will keep its loan-to-deposit at the 85-90% level for 2015. Liquidity has been easing this year and PNBN has already trimmed its deposit rates to reduce cost of funds. However, PNBN believes that it will be challenging for CASA ratio to revert to the low 60% level and it will remain at the current (low 50%) levels due to tight competition. Stable growth in fee-based income. Growth in fee-based income will be stable this year, similar to historical levels (15%). A large chunk of PNBN’s non-interest income comes from NPL recoveries and management indicated that there will not be much recoveries this year because of weak market conditions. Unlike other banks, PNBN does not want to jump onto the e-banking bandwagon and will focus on its brick-and-mortar banking business. Fee income from its insurance tie-up with Dai-Ichi will make a slow and gradual impact. No significant increase in operating expenses. PNBN has been conservative in expanding the number of branches this year due to the slow economic environment. Opex should grow at similar rates in the past while cost-to-income should remain stable in the low 50% level. Increased levels of provisions. PNBN has historically booked lower provisions due to its good asset quality management. However, pre-implementation of PSAK 50/55, PNBN was conservative with provisions and booked high provision charge off rates at the 1% level. Post-PSAK 50/55 (from 2011), provision charge off rates dropped to the 0.4-0.5% level. However, we expect provision charge off rates to come in at a high 1% this year because of higher NPLs and conservative booking of provisions in the current slow environment. We expect coverage ratio to increase slightly to 95% this year.
Margin Trends
Gross Loan& Growth
Customer Deposit & Growth
Loan-to-Deposit Ratio Trend
Cost & Income Structure
Source: Company, DBS Bank
3.5%
3.7%
3.9%
4.1%
4.3%
4.5%
0
1,000,000
2,000,000
3,000,000
4,000,000
5,000,000
6,000,000
7,000,000
2013A 2014A 2015F 2016F 2017F
Rp bn
Net Interest Income Net Interest Income Margin
0%
2%
4%
6%
8%
10%
12%
14%
16%
18%
20%
0
20,000
40,000
60,000
80,000
100,000
120,000
140,000
2013A 2014A 2015F 2016F 2017F
Rp bn
Gross Loan (LHS) Gross Loan Growth (%) (YoY) (RHS)
0%
2%
4%
6%
8%
10%
12%
14%
16%
18%
20%
0
20,000
40,000
60,000
80,000
100,000
120,000
140,000
160,000
180,000
2013A 2014A 2015F 2016F 2017F
Rp bn
Customer Deposits (LHS)
Customer Deposits Growth (%) (YoY) (RHS)
68%
73%
78%
83%
88%
93%
98%
92,765
112,765
132,765
152,765
172,765
192,765
2013A 2014A 2015F 2016F 2017F
Loans Deposit Loan-to-Deposit Ratio (RHS)
0
0.1
0.2
0.3
0.4
0.5
0.6
0.7
0
2,000
4,000
6,000
8,000
10,000
12,000
2013A 2014A 2015F 2016F 2017F
Net Interest Income Non-interest Income Cost-to-income Ratio

ASIAN INSIGHTS VICKERS SECURITIES Page 56
Company Guide
Panin Bank
Balance Sheet:
Asset quality pressures. A prudent growth strategy has always been PNBN’s priority and the majority of its SME and commercial loans are fully collateralised. As a result, PNBN has always maintained an NPL ratio of below 2% and provision expenses have been low. However, PNBN is seeing asset quality pressures in its loan book across the board due to sustained weakness in the economy. We conservatively expect NPL ratio to increase to 2.5% this year, thus significantly increasing the amount of provisions. Strong capitalisation. Capitalisation has been strong due to its conservative growth and high quality loan book, as well as strong capital boost from retained earnings due to its zero dividend payout policy. Share Price Drivers:
High quality growth; potential M&A target. PNBN has always focused on a conservative but high quality growth strategy with all loans fully collateralised. Asset quality has always been at manageable levels. PNBN is also a potential M&A target because of its attractive valuation. a potential divestment of ANZ's 39% stake in PNBN may be a share price catalyst. Key Risks:
Asset quality pressures. We expect NPL ratio to be c. 2.5%, in line with management's worst case guidance. Macroeconomic headwinds may further pressure NPLs as the bulk of PNBN’s loan book consists of SME loans in the trade industry. SMEs are also part of the value chain of bigger corporates and mayl be negatively impacted by the weak performance of these corporates. Thin liquidity .The thin liquidity of the shares is a big constraint for many investors. Delays in M&A. Potential delays or even the cancellation of an M&A announcement can pose downside risk to share price. COMPANY BACKGROUND
Panin Bank (PNBN) is one of the largest privately owned local banks in Indonesia, behind BCA and Permata. PNBN focuses on disbursing loans to SMEs in the growing trade industry.
Asset Quality
Capitalisation (%)
ROE (%)
Forward PE Band (x)
PB Band (x)
Source: Company, DBS Bank
0.0%
0.5%
1.0%
1.5%
2.0%
2.5%
3.0%
2013A 2014A 2015F 2016F 2017F
NPL Ratio Provision Charge-Off Rate
12.0%
13.0%
14.0%
15.0%
16.0%
17.0%
18.0%
19.0%
20.0%
21.0%
22.0%
2013A 2014A 2015F 2016F 2017F
Tier-1 CAR Total CAR
0.0%
2.0%
4.0%
6.0%
8.0%
10.0%
12.0%
2013A 2014A 2015F 2016F 2017F
Avg: 9.5x
+1sd: 12.1x
+2sd: 14.6x
‐1sd: 7x
‐2sd: 4.5x4.0
6.0
8.0
10.0
12.0
14.0
16.0
18.0
Nov-11 Nov-12 Nov-13 Nov-14 Nov-15
(x)
Avg: 1.12x
+1sd: 1.3x
+2sd: 1.48x
‐1sd: 0.94x
‐2sd: 0.76x
0.6
0.8
1.0
1.2
1.4
1.6
1.8
Nov-11 Nov-12 Nov-13 Nov-14 Nov-15
(x)
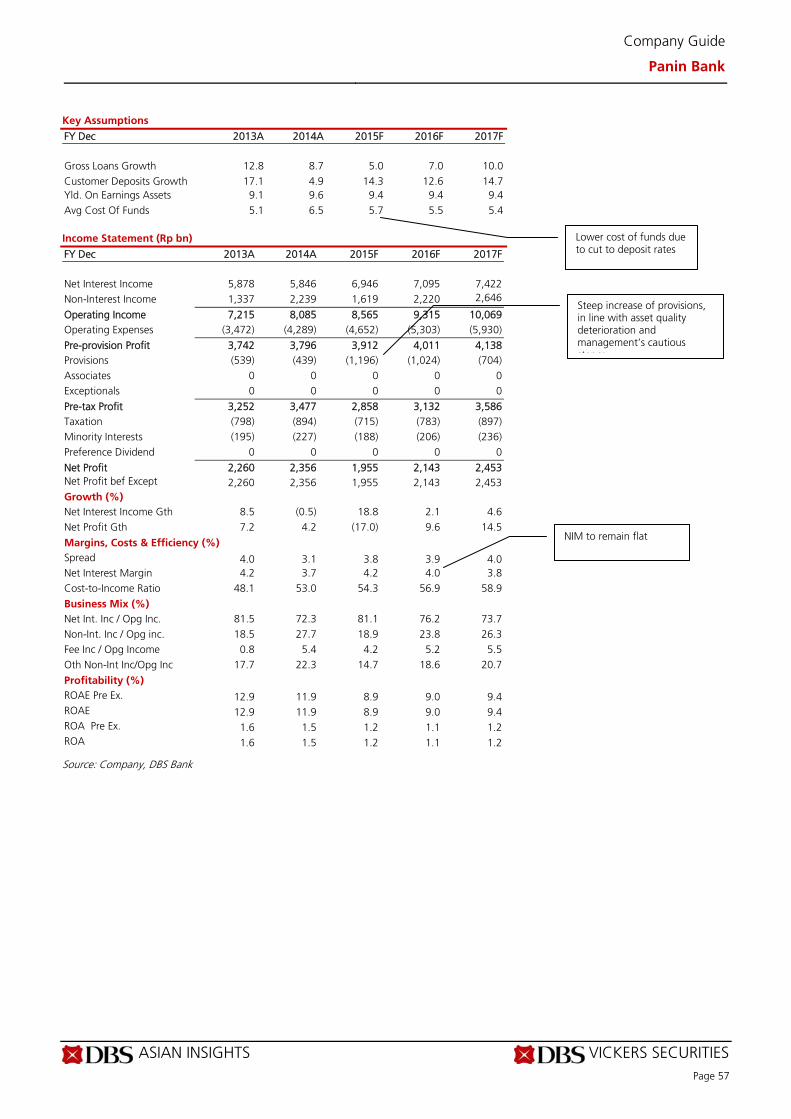
ASIAN INSIGHTS VICKERS SECURITIES Page 57
Company Guide
Panin Bank
Key Assumptions
FY Dec 2013A 2014A 2015F 2016F 2017F
Gross Loans Growth 12.8 8.7 5.0 7.0 10.0 Customer Deposits Growth 17.1 4.9 14.3 12.6 14.7 Yld. On Earnings Assets 9.1 9.6 9.4 9.4 9.4 Avg Cost Of Funds 5.1 6.5 5.7 5.5 5.4 Income Statement (Rp bn)
FY Dec 2013A 2014A 2015F 2016F 2017F Net Interest Income 5,878 5,846 6,946 7,095 7,422 Non-Interest Income 1,337 2,239 1,619 2,220 2,646
Operating Income 7,215 8,085 8,565 9,315 10,069 Operating Expenses (3,472) (4,289) (4,652) (5,303) (5,930)
Pre-provision Profit 3,742 3,796 3,912 4,011 4,138 Provisions (539) (439) (1,196) (1,024) (704) Associates 0 0 0 0 0 Exceptionals 0 0 0 0 0
Pre-tax Profit 3,252 3,477 2,858 3,132 3,586 Taxation (798) (894) (715) (783) (897) Minority Interests (195) (227) (188) (206) (236) Preference Dividend 0 0 0 0 0
Net Profit 2,260 2,356 1,955 2,143 2,453 Net Profit bef Except 2,260 2,356 1,955 2,143 2,453 Growth (%) Net Interest Income Gth 8.5 (0.5) 18.8 2.1 4.6 Net Profit Gth 7.2 4.2 (17.0) 9.6 14.5
Margins, Costs & Efficiency (%) Spread 4.0 3.1 3.8 3.9 4.0 Net Interest Margin 4.2 3.7 4.2 4.0 3.8 Cost-to-Income Ratio 48.1 53.0 54.3 56.9 58.9
Business Mix (%) Net Int. Inc / Opg Inc. 81.5 72.3 81.1 76.2 73.7 Non-Int. Inc / Opg inc. 18.5 27.7 18.9 23.8 26.3 Fee Inc / Opg Income 0.8 5.4 4.2 5.2 5.5 Oth Non-Int Inc/Opg Inc 17.7 22.3 14.7 18.6 20.7
Profitability (%) ROAE Pre Ex. 12.9 11.9 8.9 9.0 9.4 ROAE 12.9 11.9 8.9 9.0 9.4 ROA Pre Ex. 1.6 1.5 1.2 1.1 1.2 ROA 1.6 1.5 1.2 1.1 1.2
Source: Company, DBS Bank
Lower cost of funds due to cut to deposit rates
NIM to remain flat
Steep increase of provisions, in line with asset quality deterioration and management’s cautious stance

ASIAN INSIGHTS VICKERS SECURITIES Page 58
Company Guide
Panin Bank
Quarterly / Interim Income Statement (Rp bn)
FY Dec 3Q2014 4Q2014 1Q2015 2Q2015 3Q2015 Net Interest Income 1,524 1,693 1,614 1,737 1,851 Non-Interest Income 614 347 340 230 225
Operating Income 2,138 2,040 1,953 1,967 2,076 Operating Expenses (1,021) (1,447) (1,020) (1,165) (1,313)
Pre-Provision Profit 1,117 593 933 802 762 Provisions (283) (36) (88) (219) (540) Associates 0 0 0 0 0 Exceptionals 0 0 0 0 0
Pretax Profit 880 574 869 609 260 Taxation (222) (213) (221) (165) (64) Minority Interests 0 2 (60) (45) (35)
Net Profit 658 363 588 400 161 Growth (%) Net Interest Income Gth 2.9 11.1 (4.7) 7.6 6.6 Net Profit Gth (24.1) (44.9) 62.2 (32.0) (59.8)
Balance Sheet (Rp bn)
FY Dec 2013A 2014A 2015F 2016F 2017F
Cash/Bank Balance 19,462 13,910 27,699 39,086 51,244 Government Securities 13,189 14,156 15,000 15,900 16,859 Inter Bank Assets 7,912 3,354 3,857 4,435 5,100 Total Net Loans & Advs. 103,072 111,944 116,792 124,468 136,882 Investment 6,137 13,772 14,255 14,763 15,297 Associates 0 0 0 0 0 Fixed Assets 2,441 2,502 2,275 2,028 1,761 Goodwill 0 0 0 0 0 Other Assets 11,843 12,944 13,598 15,107 16,993
Total Assets 164,056 172,582 193,475 215,788 244,137 Customer Deposits 120,257 126,105 144,187 162,361 186,179 Inter Bank Deposits 4,876 4,753 4,991 5,240 5,502 Debts/Borrowings 12,618 11,081 11,745 12,842 14,103 Others 6,347 7,414 7,364 7,807 8,126 Minorities 1,408 2,253 2,441 2,648 2,884 Shareholders' Funds 18,550 20,976 22,747 24,890 27,343
Total Liab& S/H’s Funds 164,056 172,582 193,475 215,788 244,137
Source: Company, DBS Bank
,
The majority of loans are to SMEs in the trade industry
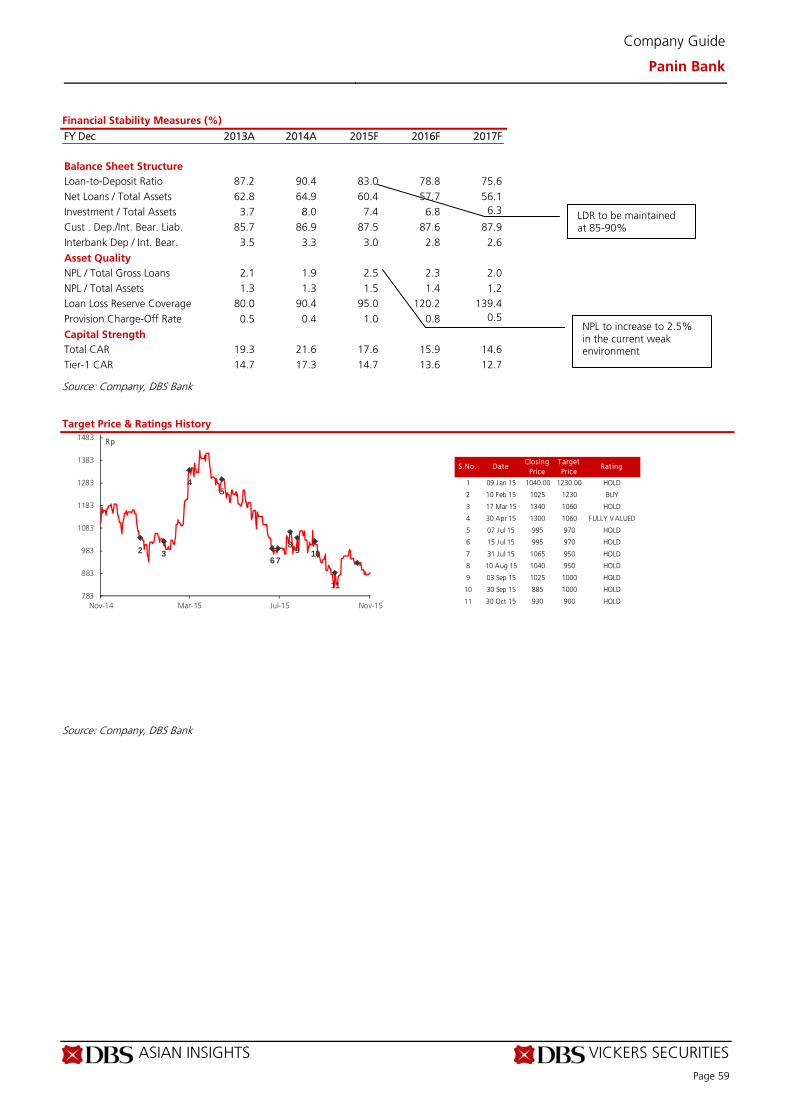
ASIAN INSIGHTS VICKERS SECURITIES Page 59
Company Guide
Panin Bank
Financial Stability Measures (%)
FY Dec 2013A 2014A 2015F 2016F 2017F Balance Sheet Structure Loan-to-Deposit Ratio 87.2 90.4 83.0 78.8 75.6 Net Loans / Total Assets 62.8 64.9 60.4 57.7 56.1 Investment / Total Assets 3.7 8.0 7.4 6.8 6.3
Cust . Dep./Int. Bear. Liab. 85.7 86.9 87.5 87.6 87.9 Interbank Dep / Int. Bear. 3.5 3.3 3.0 2.8 2.6
Asset Quality NPL / Total Gross Loans 2.1 1.9 2.5 2.3 2.0 NPL / Total Assets 1.3 1.3 1.5 1.4 1.2 Loan Loss Reserve Coverage 80.0 90.4 95.0 120.2 139.4 Provision Charge-Off Rate 0.5 0.4 1.0 0.8 0.5
Capital Strength Total CAR 19.3 21.6 17.6 15.9 14.6 Tier-1 CAR 14.7 17.3 14.7 13.6 12.7
Source: Company, DBS Bank Target Price & Ratings History
Source: Company, DBS Bank
S.No. DateClosing
PriceTarget Price
Rat ing
1 09 Jan 15 1040.00 1230.00 HOLD
2 10 Feb 15 1025 1230 BUY
3 17 Mar 15 1340 1060 HOLD
4 30 Apr 15 1300 1060 FULLY VALUED
5 07 Jul 15 995 970 HOLD
6 15 Jul 15 995 970 HOLD
7 31 Jul 15 1065 950 HOLD
8 10 Aug 15 1040 950 HOLD
9 03 Sep 15 1025 1000 HOLD
10 30 Sep 15 885 1000 HOLD
11 30 Oct 15 930 900 HOLD
2 3
45
6 7
89 10
11783
883
983
1083
1183
1283
1383
1483
Nov-14 Mar-15 Jul-15 Nov-15
Rp
LDR to be maintained at 85-90%
NPL to increase to 2.5% in the current weak environment
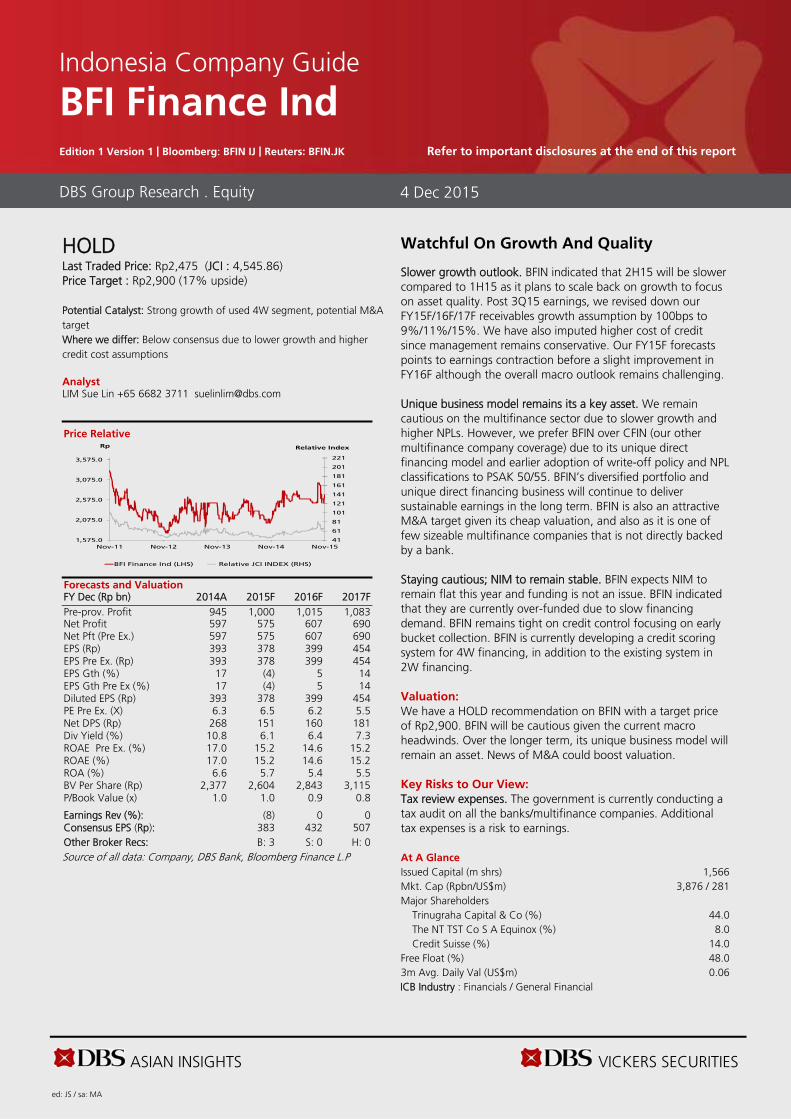
ASIAN INSIGHTS VICKERS SECURITIES ed: JS / sa: MA
HOLD Last Traded Price: Rp2,475 (JCI : 4,545.86) Price Target : Rp2,900 (17% upside) Potential Catalyst: Strong growth of used 4W segment, potential M&A target Where we differ: Below consensus due to lower growth and higher credit cost assumptions Analyst LIM Sue Lin +65 6682 3711 [email protected]
Price Relative
Forecasts and Valuation FY Dec (Rp bn) 2014A 2015F 2016F 2017F Pre-prov. Profit 945 1,000 1,015 1,083 Net Profit 597 575 607 690 Net Pft (Pre Ex.) 597 575 607 690 EPS (Rp) 393 378 399 454 EPS Pre Ex. (Rp) 393 378 399 454 EPS Gth (%) 17 (4) 5 14 EPS Gth Pre Ex (%) 17 (4) 5 14 Diluted EPS (Rp) 393 378 399 454 PE Pre Ex. (X) 6.3 6.5 6.2 5.5 Net DPS (Rp) 268 151 160 181 Div Yield (%) 10.8 6.1 6.4 7.3 ROAE Pre Ex. (%) 17.0 15.2 14.6 15.2 ROAE (%) 17.0 15.2 14.6 15.2 ROA (%) 6.6 5.7 5.4 5.5 BV Per Share (Rp) 2,377 2,604 2,843 3,115 P/Book Value (x) 1.0 1.0 0.9 0.8 Earnings Rev (%): (8) 0 0 Consensus EPS (Rp): 383 432 507 Other Broker Recs: B: 3 S: 0 H: 0 Source of all data: Company, DBS Bank, Bloomberg Finance L.P
Watchful On Growth And Quality
Slower growth outlook. BFIN indicated that 2H15 will be slower compared to 1H15 as it plans to scale back on growth to focus on asset quality. Post 3Q15 earnings, we revised down our FY15F/16F/17F receivables growth assumption by 100bps to 9%/11%/15%. We have also imputed higher cost of credit since management remains conservative. Our FY15F forecasts points to earnings contraction before a slight improvement in FY16F although the overall macro outlook remains challenging. Unique business model remains its a key asset. We remain cautious on the multifinance sector due to slower growth and higher NPLs. However, we prefer BFIN over CFIN (our other multifinance company coverage) due to its unique direct financing model and earlier adoption of write-off policy and NPL classifications to PSAK 50/55. BFIN’s diversified portfolio and unique direct financing business will continue to deliver sustainable earnings in the long term. BFIN is also an attractive M&A target given its cheap valuation, and also as it is one of few sizeable multifinance companies that is not directly backed by a bank. Staying cautious; NIM to remain stable. BFIN expects NIM to remain flat this year and funding is not an issue. BFIN indicated that they are currently over-funded due to slow financing demand. BFIN remains tight on credit control focusing on early bucket collection. BFIN is currently developing a credit scoring system for 4W financing, in addition to the existing system in 2W financing.
Valuation:
We have a HOLD recommendation on BFIN with a target price of Rp2,900. BFIN will be cautious given the current macro headwinds. Over the longer term, its unique business model will remain an asset. News of M&A could boost valuation. Key Risks to Our View:
Tax review expenses. The government is currently conducting a tax audit on all the banks/multifinance companies. Additional tax expenses is a risk to earnings. At A Glance Issued Capital (m shrs) 1,566 Mkt. Cap (Rpbn/US$m)
3,876 / 281
Major Shareholders Trinugraha Capital & Co (%) 44.0 The NT TST Co S A Equinox (%) 8.0 Credit Suisse (%) 14.0 Free Float (%) 48.0 3m Avg. Daily Val (US$m) 0.06 ICB Industry : Financials / General Financial
DBS Group Research . Equity 4 Dec 2015
Indonesia Company Guide
BFI Finance Ind Edition 1 Version 1 | Bloomberg: BFIN IJ | Reuters: BFIN.JK Refer to important disclosures at the end of this report
41
61
81
101
121
141
161
181
201
221
1,575.0
2,075.0
2,575.0
3,075.0
3,575.0
Nov-11 Nov-12 Nov-13 Nov-14 Nov-15
Relative IndexRp
BFI Finance Ind (LHS) Relative JCI INDEX (RHS)
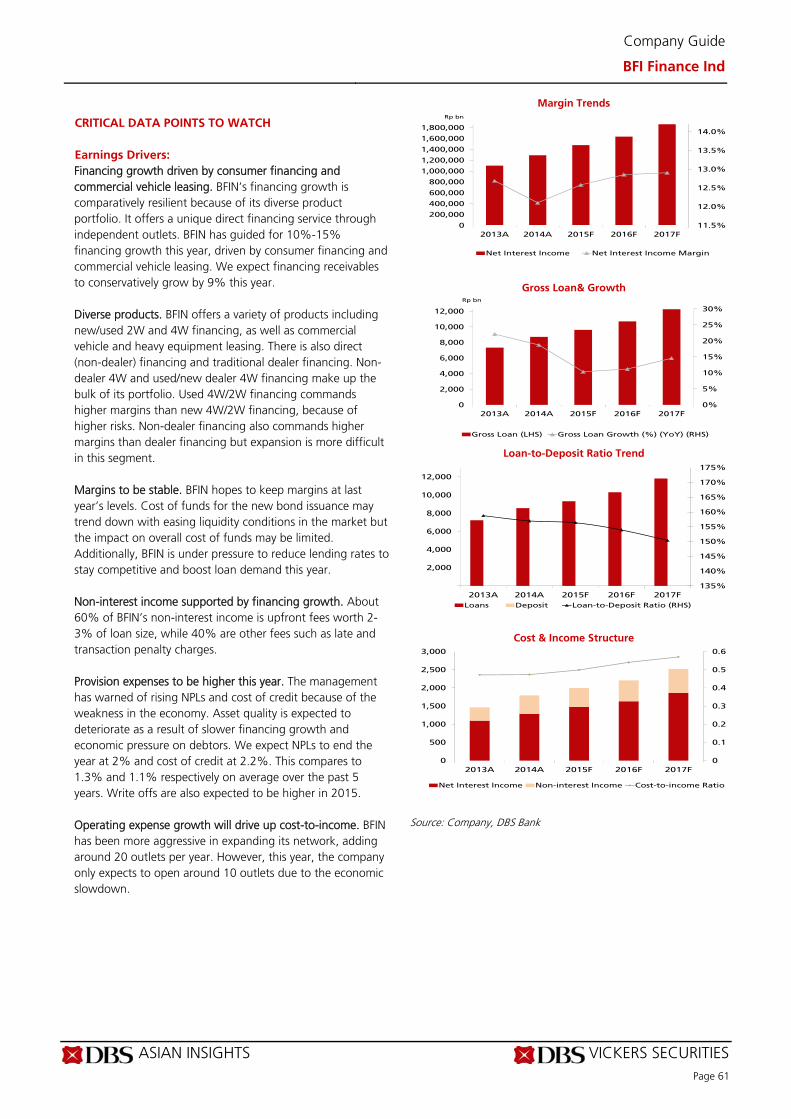
ASIAN INSIGHTS VICKERS SECURITIES Page 61
Company Guide
BFI Finance Ind
CRITICAL DATA POINTS TO WATCH
Earnings Drivers:
Financing growth driven by consumer financing and commercial vehicle leasing. BFIN’s financing growth is comparatively resilient because of its diverse product portfolio. It offers a unique direct financing service through independent outlets. BFIN has guided for 10%-15% financing growth this year, driven by consumer financing and commercial vehicle leasing. We expect financing receivables to conservatively grow by 9% this year. Diverse products. BFIN offers a variety of products including new/used 2W and 4W financing, as well as commercial vehicle and heavy equipment leasing. There is also direct (non-dealer) financing and traditional dealer financing. Non-dealer 4W and used/new dealer 4W financing make up the bulk of its portfolio. Used 4W/2W financing commands higher margins than new 4W/2W financing, because of higher risks. Non-dealer financing also commands higher margins than dealer financing but expansion is more difficult in this segment. Margins to be stable. BFIN hopes to keep margins at last year’s levels. Cost of funds for the new bond issuance may trend down with easing liquidity conditions in the market but the impact on overall cost of funds may be limited. Additionally, BFIN is under pressure to reduce lending rates to stay competitive and boost loan demand this year. Non-interest income supported by financing growth. About 60% of BFIN’s non-interest income is upfront fees worth 2-3% of loan size, while 40% are other fees such as late and transaction penalty charges. Provision expenses to be higher this year. The management has warned of rising NPLs and cost of credit because of the weakness in the economy. Asset quality is expected to deteriorate as a result of slower financing growth and economic pressure on debtors. We expect NPLs to end the year at 2% and cost of credit at 2.2%. This compares to 1.3% and 1.1% respectively on average over the past 5 years. Write offs are also expected to be higher in 2015. Operating expense growth will drive up cost-to-income. BFIN has been more aggressive in expanding its network, adding around 20 outlets per year. However, this year, the company only expects to open around 10 outlets due to the economic slowdown.
Margin Trends
Gross Loan& Growth
Loan-to-Deposit Ratio Trend
Cost & Income Structure
Source: Company, DBS Bank
11.5%
12.0%
12.5%
13.0%
13.5%
14.0%
0
200,000
400,000
600,000
800,000
1,000,000
1,200,000
1,400,000
1,600,000
1,800,000
2013A 2014A 2015F 2016F 2017F
Rp bn
Net Interest Income Net Interest Income Margin
0%
5%
10%
15%
20%
25%
30%
0
2,000
4,000
6,000
8,000
10,000
12,000
2013A 2014A 2015F 2016F 2017F
Rp bn
Gross Loan (LHS) Gross Loan Growth (%) (YoY) (RHS)
135%
140%
145%
150%
155%
160%
165%
170%
175%
2,000
4,000
6,000
8,000
10,000
12,000
2013A 2014A 2015F 2016F 2017F
Loans Deposit Loan-to-Deposit Ratio (RHS)
0
0.1
0.2
0.3
0.4
0.5
0.6
0
500
1,000
1,500
2,000
2,500
3,000
2013A 2014A 2015F 2016F 2017F
Net Interest Income Non-interest Income Cost-to-income Ratio

ASIAN INSIGHTS VICKERS SECURITIES Page 62
Company Guide
BFI Finance Ind
Balance Sheet:
Funding is not an issue. Funding is not an issue this year as BFIN continues to utilise bond issuance and bank borrowings. BFIN is currently over-funded because of the slow demand for financing. It is not feasible at present to get fully hedged USD loans due to the high swap cost. NPLs may creep up. Management indicated that NPLs will creep up this year due to the weakness in the economy. We expect NPLs and cost of credit to peak this year and improve in subsequent quarters as the economy recovers. The main driver of NPL is still in the heavy equipment and commodity related sectors. Gearing ratio remains low. The company’s gearing ratio has been low at 1.4-1.5x historically. BFIN is well-capitalised and carries low solvency risk. Going forward, management expects gearing ratio to be 1.5-2.0x. Share Price Drivers:
Near-term resilience will support valuation; M&A will boost multiples over the long term. BFIN’s diversified portfolio and unique direct financing business will continue to deliver sustainable earnings in the long term. BFIN is also an attractive M&A target given its cheap valuation, and also as it is one of few sizeable multifinance companies that is not directly backed by a bank. Key Risks:
Low commodity prices and stock liquidity. Commodity prices have not recovered, which could be a risk to asset quality for mining and related loans. Low trading liquidity may also be an issue. Slower-than-expected growth; asset quality pressure. Slower growth of consumer financing would be a downside risk to our forecast. Further asset quality pressure throughout the year would also increase provision expenses and hurt earnings. COMPANY BACKGROUND
BFI Finance (BFIN) is a financing company that focuses on consumer financing, both dealer generated and direct lending. The major shareholder with 44.95% stake is a consortium comprising TPG Capital, Northstar Equity Partners and Boy Garibaldi Thohir.
Asset Quality
ROE (%)
Forward PE Band (x)
PB Band (x)
Source: Company, DBS Bank
1.0%
1.5%
2.0%
2.5%
3.0%
3.5%
4.0%
2013A 2014A 2015F 2016F 2017F
NPL Ratio Provision Charge-Off Rate
0.0%
2.0%
4.0%
6.0%
8.0%
10.0%
12.0%
14.0%
16.0%
2013A 2014A 2015F 2016F 2017F
Avg: 6.5x
+1sd: 7.4x
+2sd: 8.2x
‐1sd: 5.7x
‐2sd: 4.8x4.3
5.3
6.3
7.3
8.3
9.3
10.3
11.3
Nov-11 Nov-12 Nov-13 Nov-14
(x)
Avg: 1.15x
+1sd: 1.38x
+2sd: 1.61x
‐1sd: 0.92x
‐2sd: 0.68x0.6
0.8
1.0
1.2
1.4
1.6
1.8
2.0
2.2
2.4
Nov-11 Nov-12 Nov-13 Nov-14
(x)

ASIAN INSIGHTS VICKERS SECURITIES Page 63
Company Guide
BFI Finance Ind
Key Assumptions
FY Dec 2013A 2014A 2015F 2016F 2017F
Gross Loans Growth 22.1 18.7 10.4 11.2 14.6 Customer Deposits Growth N/A N/A N/A N/A N/A Yld. On Earnings Assets 17.6 16.9 17.8 18.1 18.2 Avg Cost Of Funds 10.4 9.9 10.5 10.2 10.2 Income Statement (Rp bn)
FY Dec 2013A 2014A 2015F 2016F 2017F Net Interest Income 1,102 1,292 1,479 1,635 1,863 Non-Interest Income 365 504 518 577 660
Operating Income 1,467 1,796 1,997 2,212 2,523 Operating Expenses (693) (851) (997) (1,197) (1,440)
Pre-provision Profit 775 945 1,000 1,015 1,083 Provisions (107) (198) (281) (257) (220) Associates 0 0 0 0 0 Exceptionals 0 0 0 0 0
Pre-tax Profit 667 748 719 758 862 Taxation (159) (151) (144) (152) (172) Minority Interests 0 0 0 0 0 Preference Dividend 0 0 0 0 0
Net Profit 509 597 575 607 690 Net Profit bef Except 509 597 575 607 690
Growth (%) Net Interest Income Gth 20.9 17.2 14.5 10.6 13.9 Net Profit Gth 3.7 17.4 (3.7) 5.5 13.7
Margins, Costs & Efficiency (%) Spread 7.2 7.0 7.4 7.9 8.1 Net Interest Margin 12.7 12.1 12.6 12.9 12.9 Cost-to-Income Ratio 47.2 47.4 49.9 54.1 57.1
Business Mix (%) Net Int. Inc / Opg Inc. 75.1 71.9 74.1 73.9 73.8 Non-Int. Inc / Opg inc. 24.9 28.1 25.9 26.1 26.2 Fee Inc / Opg Income 22.8 22.3 20.6 20.7 20.8 Oth Non-Int Inc/Opg Inc 2.1 5.8 5.3 5.4 5.4
Profitability (%) ROAE Pre Ex. 16.3 17.0 15.2 14.6 15.2 ROAE 16.3 17.0 15.2 14.6 15.2 ROA Pre Ex. 6.8 6.6 5.7 5.4 5.5 ROA 6.8 6.6 5.7 5.4 5.5
Source: Company, DBS Bank
Negative earnings growth due to rising provisions and weak financing demand

ASIAN INSIGHTS VICKERS SECURITIES Page 64
Company Guide
BFI Finance Ind
Quarterly / Interim Income Statement (Rp bn)
FY Dec 3Q2014 4Q2014 1Q2015 2Q2015 3Q2015 Net Interest Income 327 336 349 360 366 Non-Interest Income 121 146 156 167 163
Operating Income 448 482 506 527 528 Operating Expenses (204) (259) (251) (265) (277)
Pre-Provision Profit 245 223 255 262 251 Provisions (47) (50) (72) (75) (57) Associates 0 0 0 0 0 Exceptionals 0 0 0 0 0
Pretax Profit 198 172 184 187 194 Taxation (49) (16) (36) (37) (37) Minority Interests 0 0 0 0 0
Net Profit 149 157 147 150 157 Growth (%) Net Interest Income Gth 3.5 2.7 4.0 3.2 1.5 Net Profit Gth 15.7 5.1 (5.8) 1.7 4.9
Balance Sheet (Rp bn)
FY Dec 2013A 2014A 2015F 2016F 2017F Cash/Bank Balance 225 290 431 610 699 Government Securities 0 0 0 0 0 Inter Bank Assets 0 0 0 0 0 Total Net Loans & Advs. 7,239 8,559 9,326 10,311 11,836 Investment 0 0 0 0 0
Associates 0 0 0 0 0 Fixed Assets 414 447 450 450 449 Goodwill 0 0 0 0 0 Other Assets 415 376 376 376 376
Total Assets 8,293 9,671 10,583 11,747 13,361 Customer Deposits 0 0 0 0 0 Inter Bank Deposits 0 0 0 0 0 Debts/Borrowings 4,626 5,555 6,155 6,955 8,155 Others 270 502 469 469 469 Minorities 0 0 0 0 0 Shareholders' Funds 3,397 3,614 3,959 4,323 4,737
Total Liab& S/H’s Funds 8,293 9,671 10,583 11,747 13,361
Source: Company, DBS Bank
Booking higher provisions during times of uncertainty
Loan growth supported by diversified portfolio

ASIAN INSIGHTS VICKERS SECURITIES Page 65
Company Guide
BFI Finance Ind
Financial Stability Measures (%)
FY Dec 2013A 2014A 2015F 2016F 2017F Balance Sheet Structure Loan-to-Deposit Ratio 158.8 157.0 156.4 153.9 150.4 Net Loans / Total Assets 87.3 88.5 88.1 87.8 88.6 Investment / Total Assets 0.0 0.0 0.0 0.0 0.0 Cust . Dep./Int. Bear. Liab. 0.0 0.0 0.0 0.0 0.0 Interbank Dep / Int. Bear. 0.0 0.0 0.0 0.0 0.0
Asset Quality NPL / Total Gross Loans 1.5 1.5 2.0 1.8 1.7 NPL / Total Assets 1.6 1.7 2.4 2.0 1.9
Loan Loss Reserve Coverage 79.1 101.0 118.2 166.9 173.2 Provision Charge-Off Rate 1.5 2.3 2.9 2.4 1.8
Capital Strength Total CAR 0.0 0.0 0.0 0.0 0.0 Tier-1 CAR 0.0 0.0 0.0 0.0 0.0
Source: Company, DBS Bank Target Price & Ratings History
Source: Company, DBS Bank
S.No. DateClosing
PriceTarget Price
Rat ing
1 09 Jan 15 2400.00 3100.00 BUY
2 04 May 15 2700 3100 BUY
3 08 Jul 15 2600 3100 BUY
4 03 Nov 15 2600 2900 HOLD
2
34
5
505
1005
1505
2005
2505
3005
Nov-14 Mar-15 Jul-15
Rp
NPL to tick up this year

ASIAN INSIGHTS VICKERS SECURITIES ed: SGC / sa: MA
HOLD Last Traded Price: Rp267 JCI : 4,545.86 Price Target : Rp 290 (9% upside) Potential Catalyst: Prudent growth in receivables and stable margins Where we differ: We are the only broker covering the stock and sector Analyst
LIM Sue Lin +65 6682 3711 [email protected]
Price Relative
Forecasts and Valuation FY Dec (Rp bn) 2014A 2015F 2016F 2017F Pre-prov. Profit 577 640 735 842 Net Profit 398 368 460 539 Net Pft (Pre Ex.) 398 368 460 539 EPS (Rp) 105 97 122 143 EPS Pre Ex. (Rp) 105 97 122 143 EPS Gth (%) 2 (8) 25 17 EPS Gth Pre Ex (%) 2 (8) 25 17 Diluted EPS (Rp) 105 97 122 143 PE Pre Ex. (X) 2.5 2.7 2.2 1.9 Net DPS (Rp) 0 16 20 24 Div Yield (%) 0.0 6.1 7.6 9.0 ROAE Pre Ex. (%) 13.2 10.8 12.3 12.9 ROAE (%) 13.2 10.8 12.3 12.9 ROA (%) 6.3 5.3 5.8 6.0 BV Per Share (Rp) 863 944 1,045 1,164 P/Book Value (x) 0.3 0.3 0.3 0.2 Earnings Rev (%): 0 0 0 Consensus EPS (Rp): 97 122 143 Other Broker Recs: B: 2 S: 0 H: 0 Source of all data: Company, DBS Bank, Bloomberg Finance L.P.
Cautious On Asset Quality
Cautious on asset quality; downgrade to HOLD. Asset quality will be under pressure this year because of the slow economy and sustained weak commodity prices. Provision expense will also increase after OJK imposed provisioning regulations on multifinance companies. We cut FY15F/16F earnings by 12%/4% after raising credit cost and NPL assumptions. We expect NPL to come in at 2.1% this year (previously 1.1%). Our TP is reduced to Rp290 and we downgrade CFIN to HOLD.
Growth traction intact. The management expects financing receivables to grow by 10-15% in 2015, mainly driven by consumer financing, of which 90% is derived from used cars. CFIN still sees strong growth in used 4W financing, and the five new branches will also help to achieve its growth target. The leasing business will be driven by commercial vehicles and shipping, offsetting heavy equipment leasing which is expected to remain muted as long as commodity prices are weak. Factoring will remain slow because of limited utilisation in the current economic condition. Positively, CFIN’s gearing ratio remains low at 1.0x. CFIN indicated that funding is not an issue and it still has unutilised loan facilities at several banks.
Stable NIM. CFIN expects to reduce cost of funds by c.50bps this year because of easing liquidity conditions. CFIN has historically been selective in choosing the lowest funding rates to minimise cost of funds. Lending rate will also be re-priced accordingly, thus, leaving NIM largely unchanged.
Valuation: We have a HOLD recommendation and Rp290 TP for CFIN. Our TP is based on the Gordon Growth Model and implies 0.3x FY16F BV. Cost-to-income ratio and gearing are better than at BFI Finance, but asset quality is a notch lower. Its low gearing ratio provides opportunity for growth.
Key Risks to Our View: Slow growth and deteriorating asset quality. A key risk to our view would be slower-than-expected receivables growth and further deterioration of asset quality. Low commodity prices and slow realisation of government infrastructure projects will also soften demand and increase NPL ratios for CFIN’s leasing segment.
At A Glance Issued Capital (m shrs) 3,985 Mkt. Cap (Rpbn/US$m) 1,064 / 77.1 Major Shareholders Bank Pan Indonesia TBK (%) 54.4 Mackenzie Financial Corporation
13.8
Free Float (%) 31.9 3m Avg. Daily Val (US$m) 0.0 ICB Industry : Financials / General Financial
DBS Group Research . Equity 4 Dec 2015
Indonesia Company Guide
Clipan Finance Edition 1 Version 2 | Bloomberg: CFIN IJ | Reuters: CFIN.JK Refer to important disclosures at the end of this report
44
64
84
104
124
144
164
184
204
225.0
275.0
325.0
375.0
425.0
475.0
525.0
575.0
625.0
Oct-11 Oct-12 Oct-13 Oct-14 Oct-15
Relative IndexRp
Clipan Finance (LHS) Relative JCI INDEX (RHS)
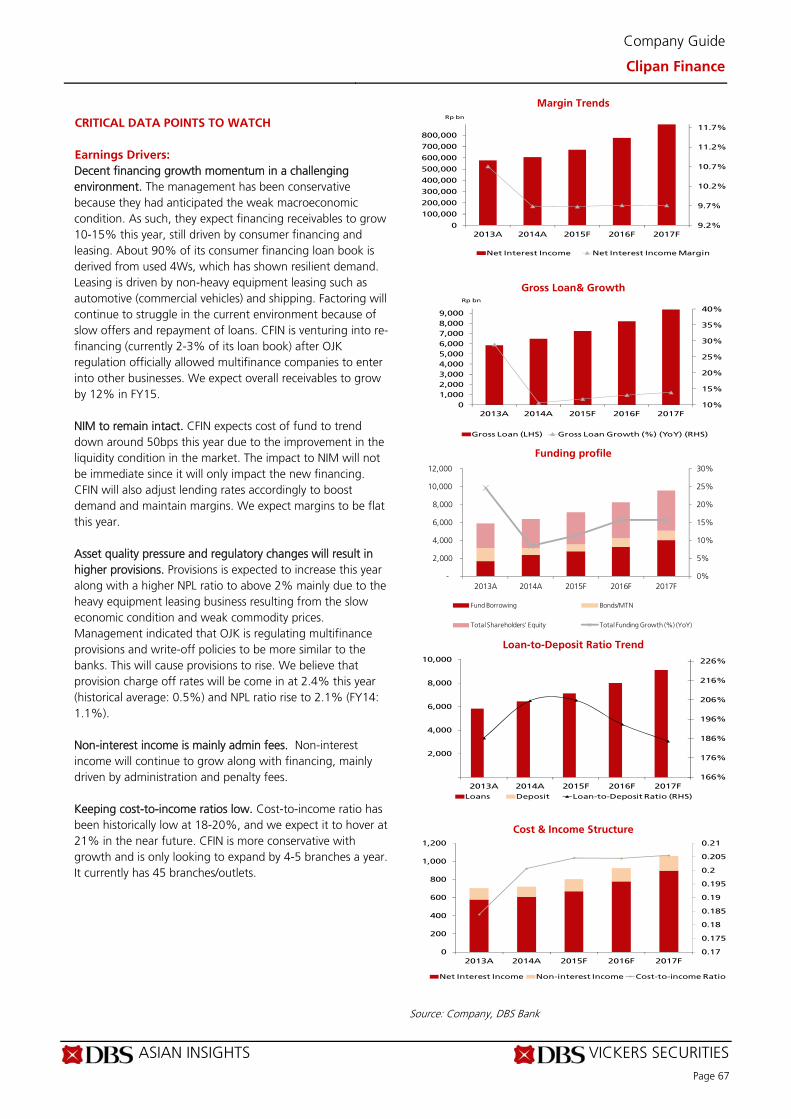
ASIAN INSIGHTS VICKERS SECURITIES Page 67
Company Guide
Clipan Finance
CRITICAL DATA POINTS TO WATCH
Earnings Drivers:
Decent financing growth momentum in a challenging environment. The management has been conservative because they had anticipated the weak macroeconomic condition. As such, they expect financing receivables to grow 10-15% this year, still driven by consumer financing and leasing. About 90% of its consumer financing loan book is derived from used 4Ws, which has shown resilient demand. Leasing is driven by non-heavy equipment leasing such as automotive (commercial vehicles) and shipping. Factoring will continue to struggle in the current environment because of slow offers and repayment of loans. CFIN is venturing into re-financing (currently 2-3% of its loan book) after OJK regulation officially allowed multifinance companies to enter into other businesses. We expect overall receivables to grow by 12% in FY15. NIM to remain intact. CFIN expects cost of fund to trend down around 50bps this year due to the improvement in the liquidity condition in the market. The impact to NIM will not be immediate since it will only impact the new financing. CFIN will also adjust lending rates accordingly to boost demand and maintain margins. We expect margins to be flat this year. Asset quality pressure and regulatory changes will result in higher provisions. Provisions is expected to increase this year along with a higher NPL ratio to above 2% mainly due to the heavy equipment leasing business resulting from the slow economic condition and weak commodity prices. Management indicated that OJK is regulating multifinance provisions and write-off policies to be more similar to the banks. This will cause provisions to rise. We believe that provision charge off rates will be come in at 2.4% this year (historical average: 0.5%) and NPL ratio rise to 2.1% (FY14: 1.1%). Non-interest income is mainly admin fees. Non-interest income will continue to grow along with financing, mainly driven by administration and penalty fees. Keeping cost-to-income ratios low. Cost-to-income ratio has been historically low at 18-20%, and we expect it to hover at 21% in the near future. CFIN is more conservative with growth and is only looking to expand by 4-5 branches a year. It currently has 45 branches/outlets.
Margin Trends
Gross Loan& Growth
Funding profile
Loan-to-Deposit Ratio Trend
Cost & Income Structure
Source: Company, DBS Bank
9.2%
9.7%
10.2%
10.7%
11.2%
11.7%
0
100,000
200,000
300,000
400,000
500,000
600,000
700,000
800,000
2013A 2014A 2015F 2016F 2017F
Rp bn
Net Interest Income Net Interest Income Margin
10%
15%
20%
25%
30%
35%
40%
0
1,000
2,000
3,000
4,000
5,000
6,000
7,000
8,000
9,000
2013A 2014A 2015F 2016F 2017F
Rp bn
Gross Loan (LHS) Gross Loan Growth (%) (YoY) (RHS)
0%
5%
10%
15%
20%
25%
30%
-
2,000
4,000
6,000
8,000
10,000
12,000
2013A 2014A 2015F 2016F 2017F
Fund Borrowing Bonds/MTN
Total Shareholders' Equity Total Funding Growth (%) (YoY)
166%
176%
186%
196%
206%
216%
226%
2,000
4,000
6,000
8,000
10,000
2013A 2014A 2015F 2016F 2017F
Loans Deposit Loan-to-Deposit Ratio (RHS)
0.17
0.175
0.18
0.185
0.19
0.195
0.2
0.205
0.21
0
200
400
600
800
1,000
1,200
2013A 2014A 2015F 2016F 2017F
Net Interest Income Non-interest Income Cost-to-income Ratio

ASIAN INSIGHTS VICKERS SECURITIES Page 68
Company Guide
Clipan Finance
Balance Sheet:
Low gearing. CFIN has room to grow because its gearing ratio is only 1x. We expect gearing ratio to remain at current levels. CFIN will utilise medium-term notes and bank borrowings for funding this year. Unlike its competitors, CFIN does not seem keen to reduce cost of funds through cheaper offshore financing and prefers to stick with safer domestic borrowings without having to deal with exchange rate risks. CFIN plans to increase its share of joint-financing with Panin Bank. Close watch on asset quality. Although asset quality is historically low at around 1%, CFIN has struggled with NPLs this year because of the slow economy and weak commodity prices. CFIN will prioritise asset quality over growth this year and will remain conservative in booking provisions and underwriting loans. As mentioned earlier, we expect NPLs to increase to 2.1% this year as asset quality will deteriorate in its heavy equipment leasing book, coupled with the enforcement of write-off policies and NPL recognition by the OJK. CFIN remains confident of recovering 70% of its loan loss provision. Share Price Drivers:
Consistent quality growth. Stable growth and low opex should boost earnings. CFIN is confident of achieving its financing receivables growth target of 10-15% across all business lines as consumer financing and vehicle leasing remains strong. Thin liquidity. The thin trading liquidity is a major constraint for many investors, and could cap share price upside. Key Risks:
Asset quality risk. The extended weak global economy could suppress commodity prices. This could continue to affect asset quality in its leasing business. The weak economy may also pressure asset quality in the consumer financing and factoring segments. Further slowdown in factoring. Since factoring is a niche market, demand may be capped, or continue to slow down like in recent quarters.
COMPANY BACKGROUND
Clipan Finance (CFIN) provides consumer financing, leasing and factoring services. The multi-finance company was established in 1982 and is part of Panin Group; currently, 54.4% owned by Panin Bank. Its leasing business targets the transportation, mining and plantation sectors, and consumer financing focuses on new and used cars.
Asset Quality
Gearing Ratio
ROE (%)
Forward PE Band (x)
PB Band (x)
Source: Company, DBS Bank
0.0%
0.5%
1.0%
1.5%
2.0%
2.5%
3.0%
2013A 2014A 2015F 2016F 2017F
NPL Ratio Provision Charge-Off Rate
0.5
0.7
0.9
1.1
1.3
1.5
2013A 2014A 2015F 2016F 2017F
0.0%
2.0%
4.0%
6.0%
8.0%
10.0%
12.0%
14.0%
2013A 2014A 2015F 2016F 2017F
Avg: 4.1x
+1sd: 4.7x
+2sd: 5.3x
‐1sd: 3.5x
‐2sd: 2.9x
1.9
2.4
2.9
3.4
3.9
4.4
4.9
5.4
5.9
6.4
6.9
Oct-11 Oct-12 Oct-13 Oct-14
(x)
Avg: 0.59x
+1sd: 0.72x
+2sd: 0.85x
‐1sd: 0.46x
‐2sd: 0.33x
0.2
0.3
0.4
0.5
0.6
0.7
0.8
0.9
1.0
1.1
Oct-11 Oct-12 Oct-13 Oct-14
(x)
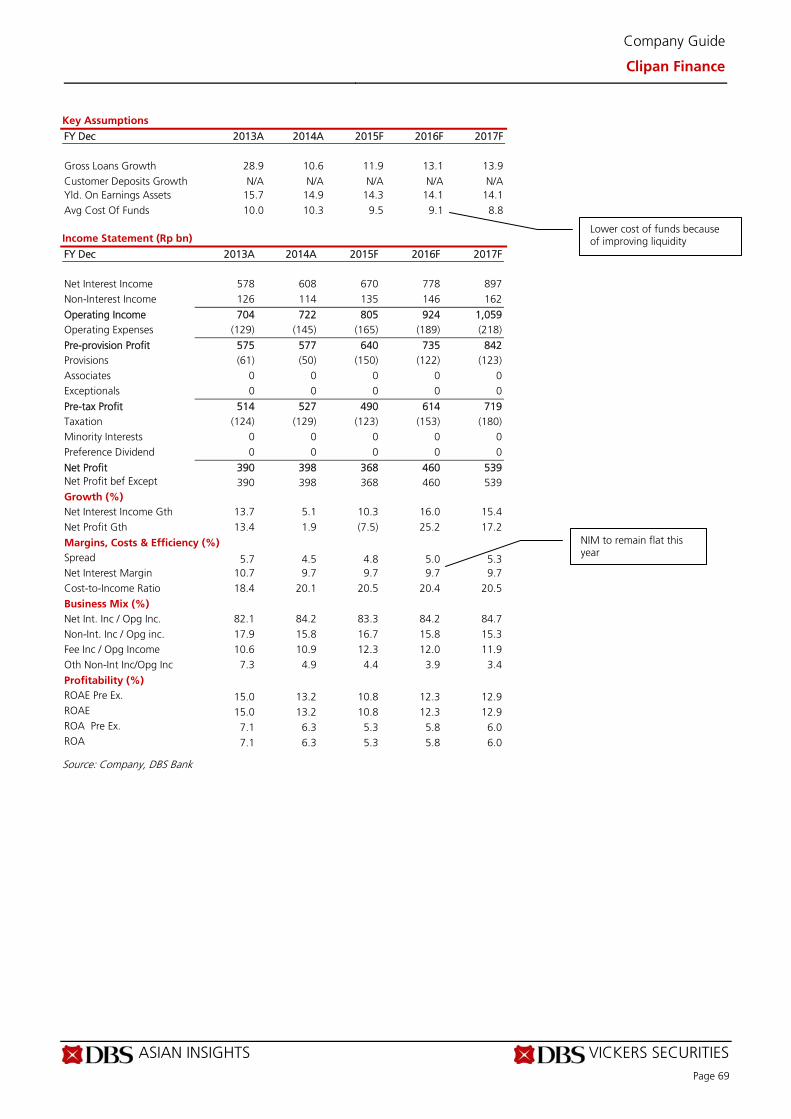
ASIAN INSIGHTS VICKERS SECURITIES Page 69
Company Guide
Clipan Finance
Key Assumptions
FY Dec 2013A 2014A 2015F 2016F 2017F
Gross Loans Growth 28.9 10.6 11.9 13.1 13.9 Customer Deposits Growth N/A N/A N/A N/A N/A Yld. On Earnings Assets 15.7 14.9 14.3 14.1 14.1 Avg Cost Of Funds 10.0 10.3 9.5 9.1 8.8 Income Statement (Rp bn)
FY Dec 2013A 2014A 2015F 2016F 2017F Net Interest Income 578 608 670 778 897 Non-Interest Income 126 114 135 146 162
Operating Income 704 722 805 924 1,059 Operating Expenses (129) (145) (165) (189) (218)
Pre-provision Profit 575 577 640 735 842 Provisions (61) (50) (150) (122) (123) Associates 0 0 0 0 0 Exceptionals 0 0 0 0 0
Pre-tax Profit 514 527 490 614 719 Taxation (124) (129) (123) (153) (180) Minority Interests 0 0 0 0 0 Preference Dividend 0 0 0 0 0
Net Profit 390 398 368 460 539 Net Profit bef Except 390 398 368 460 539 Growth (%) Net Interest Income Gth 13.7 5.1 10.3 16.0 15.4 Net Profit Gth 13.4 1.9 (7.5) 25.2 17.2
Margins, Costs & Efficiency (%) Spread 5.7 4.5 4.8 5.0 5.3 Net Interest Margin 10.7 9.7 9.7 9.7 9.7 Cost-to-Income Ratio 18.4 20.1 20.5 20.4 20.5
Business Mix (%) Net Int. Inc / Opg Inc. 82.1 84.2 83.3 84.2 84.7 Non-Int. Inc / Opg inc. 17.9 15.8 16.7 15.8 15.3 Fee Inc / Opg Income 10.6 10.9 12.3 12.0 11.9 Oth Non-Int Inc/Opg Inc 7.3 4.9 4.4 3.9 3.4
Profitability (%) ROAE Pre Ex. 15.0 13.2 10.8 12.3 12.9 ROAE 15.0 13.2 10.8 12.3 12.9 ROA Pre Ex. 7.1 6.3 5.3 5.8 6.0 ROA 7.1 6.3 5.3 5.8 6.0
Source: Company, DBS Bank
NIM to remain flat this year
Lower cost of funds because of improving liquidity
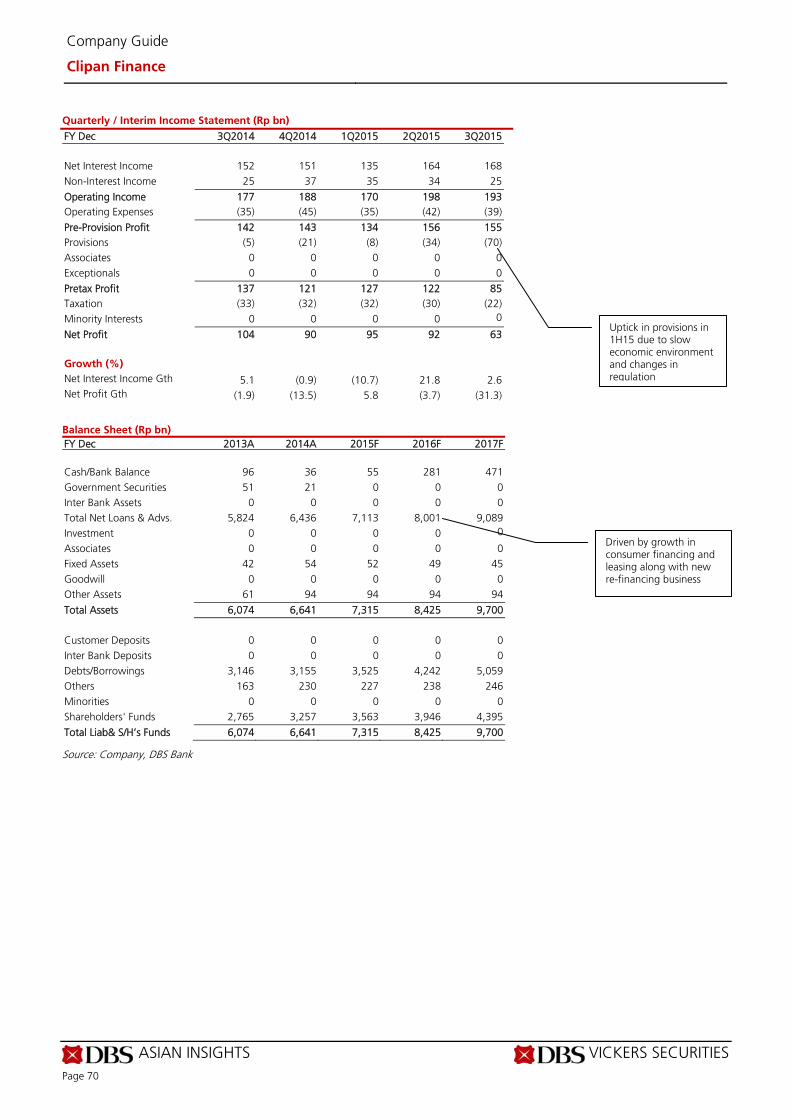
ASIAN INSIGHTS VICKERS SECURITIES Page 70
Company Guide
Clipan Finance
Quarterly / Interim Income Statement (Rp bn)
FY Dec 3Q2014 4Q2014 1Q2015 2Q2015 3Q2015 Net Interest Income 152 151 135 164 168 Non-Interest Income 25 37 35 34 25
Operating Income 177 188 170 198 193 Operating Expenses (35) (45) (35) (42) (39)
Pre-Provision Profit 142 143 134 156 155 Provisions (5) (21) (8) (34) (70) Associates 0 0 0 0 0 Exceptionals 0 0 0 0 0
Pretax Profit 137 121 127 122 85 Taxation (33) (32) (32) (30) (22) Minority Interests 0 0 0 0 0
Net Profit 104 90 95 92 63 Growth (%) Net Interest Income Gth 5.1 (0.9) (10.7) 21.8 2.6 Net Profit Gth (1.9) (13.5) 5.8 (3.7) (31.3)
Balance Sheet (Rp bn)
FY Dec 2013A 2014A 2015F 2016F 2017F Cash/Bank Balance 96 36 55 281 471 Government Securities 51 21 0 0 0 Inter Bank Assets 0 0 0 0 0 Total Net Loans & Advs. 5,824 6,436 7,113 8,001 9,089 Investment 0 0 0 0 0
Associates 0 0 0 0 0 Fixed Assets 42 54 52 49 45 Goodwill 0 0 0 0 0 Other Assets 61 94 94 94 94
Total Assets 6,074 6,641 7,315 8,425 9,700 Customer Deposits 0 0 0 0 0 Inter Bank Deposits 0 0 0 0 0 Debts/Borrowings 3,146 3,155 3,525 4,242 5,059 Others 163 230 227 238 246 Minorities 0 0 0 0 0 Shareholders' Funds 2,765 3,257 3,563 3,946 4,395
Total Liab& S/H’s Funds 6,074 6,641 7,315 8,425 9,700
Source: Company, DBS Bank
Uptick in provisions in 1H15 due to slow economic environment and changes in regulation
Driven by growth in consumer financing and leasing along with new re-financing business
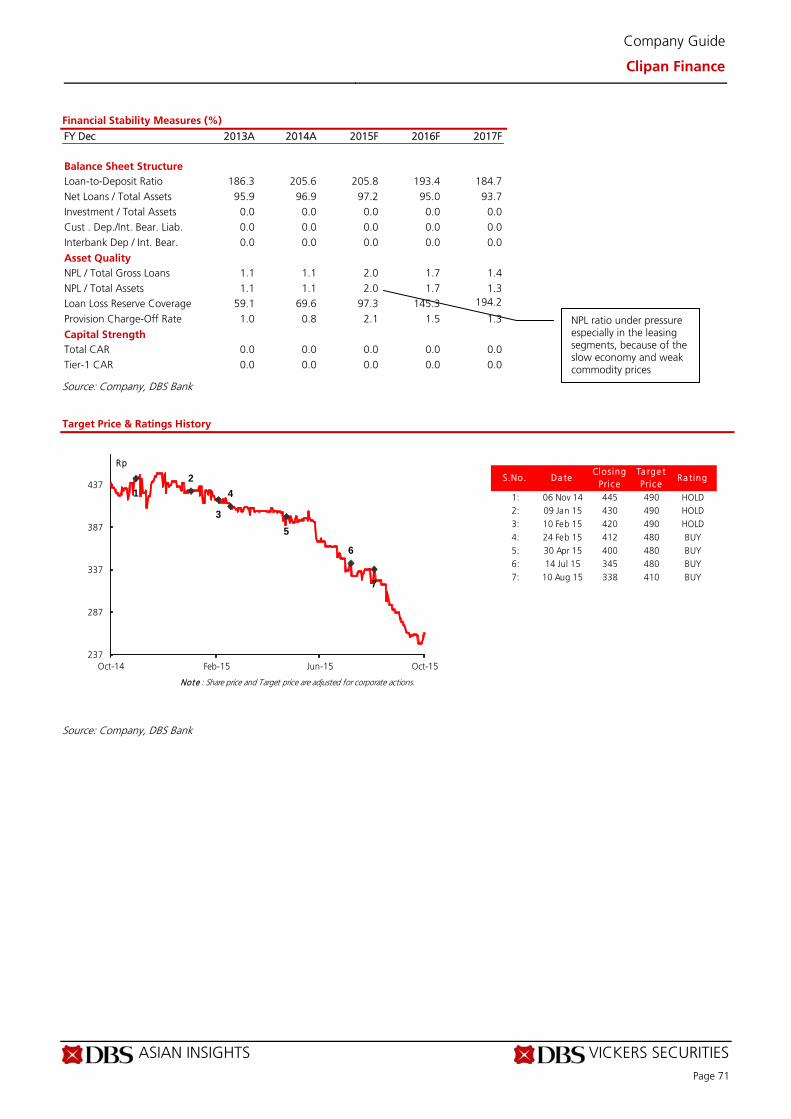
ASIAN INSIGHTS VICKERS SECURITIES Page 71
Company Guide
Clipan Finance
Financial Stability Measures (%)
FY Dec 2013A 2014A 2015F 2016F 2017F Balance Sheet Structure Loan-to-Deposit Ratio 186.3 205.6 205.8 193.4 184.7 Net Loans / Total Assets 95.9 96.9 97.2 95.0 93.7 Investment / Total Assets 0.0 0.0 0.0 0.0 0.0 Cust . Dep./Int. Bear. Liab. 0.0 0.0 0.0 0.0 0.0 Interbank Dep / Int. Bear. 0.0 0.0 0.0 0.0 0.0
Asset Quality NPL / Total Gross Loans 1.1 1.1 2.0 1.7 1.4 NPL / Total Assets 1.1 1.1 2.0 1.7 1.3 Loan Loss Reserve Coverage 59.1 69.6 97.3 145.3 194.2
Provision Charge-Off Rate 1.0 0.8 2.1 1.5 1.3
Capital Strength Total CAR 0.0 0.0 0.0 0.0 0.0 Tier-1 CAR 0.0 0.0 0.0 0.0 0.0
Source: Company, DBS Bank Target Price & Ratings History
Source: Company, DBS Bank
S.No. Da teClos ing
Pric eTa rge t Pric e
Ra ting
1: 06 Nov 14 445 490 HOLD2: 09 Jan 15 430 490 HOLD3: 10 Feb 15 420 490 HOLD4: 24 Feb 15 412 480 BUY5: 30 Apr 15 400 480 BUY6: 14 Jul 15 345 480 BUY7: 10 Aug 15 338 410 BUY
Note : Share price and Target price are adjusted for corporate actions.
1
2
3
4
5
6
7
237
287
337
387
437
Oct-14 Feb-15 Jun-15 Oct-15
Rp
NPL ratio under pressure especially in the leasing segments, because of the slow economy and weak commodity prices
Industry Focus
Indonesian Banks and Multifinance Companies
Page 12
DBS Bank recommendations are based an Absolute Total Return* Rating system, defined as follows:
STRONG BUY (>20% total return over the next 3 months, with identifiable share price catalysts within this time frame)
BUY (>15% total return over the next 12 months for small caps, >10% for large caps)
HOLD (-10% to +15% total return over the next 12 months for small caps, -10% to +10% for large caps)
FULLY VALUED (negative total return i.e. > -10% over the next 12 months)
SELL (negative total return of > -20% over the next 3 months, with identifiable catalysts within this time frame)
Share price appreciation + dividends
GENERAL DISCLOSURE/DISCLAIMER This report is prepared by DBS Bank Ltd. This report is solely intended for the clients of DBS Bank Ltd and DBS Vickers Securities (Singapore) Pte Ltd, its respective connected and associated corporations and affiliates (collectively, the “DBS Vickers Group”) only and no part of this document may be (i) copied, photocopied or duplicated in any form or by any means or (ii) redistributed without the prior written consent of DBS Bank Ltd. The research set out in this report is based on information obtained from sources believed to be reliable, but we (which collectively refers to DBS Bank Ltd., its respective connected and associated corporations, affiliates and their respective directors, officers, employees and agents (collectively, the “DBS Group”)) do not make any representation or warranty as to its accuracy, completeness or correctness. Opinions expressed are subject to change without notice. This document is prepared for general circulation. Any recommendation contained in this document does not have regard to the specific investment objectives, financial situation and the particular needs of any specific addressee. This document is for the information of addressees only and is not to be taken in substitution for the exercise of judgement by addressees, who should obtain separate independent legal or financial advice. The DBS Group accepts no liability whatsoever for any direct, indirect and/or consequential loss (including any claims for loss of profit) arising from any use of and/or reliance upon this document and/or further communication given in relation to this document. This document is not to be construed as an offer or a solicitation of an offer to buy or sell any securities. The DBS Group, along with its affiliates and/or persons associated with any of them may from time to time have interests in the securities mentioned in this document. The DBS Group may have positions in, and may effect transactions in securities mentioned herein and may also perform or seek to perform broking, investment banking and other banking services for these companies. Any valuations, opinions, estimates, forecasts, ratings or risk assessments herein constitutes a judgment as of the date of this report, and there can be no assurance that future results or events will be consistent with any such valuations, opinions, estimates, forecasts, ratings or risk assessments. The information in this document is subject to change without notice, its accuracy is not guaranteed, it may be incomplete or condensed and it may not contain all material information concerning the company (or companies) referred to in this report. The valuations, opinions, estimates, forecasts, ratings or risk assessments described in this report were based upon a number of estimates and assumptions and are inherently subject to significant uncertainties and contingencies. It can be expected that one or more of the estimates on which the valuations, opinions, estimates, forecasts, ratings or risk assessments were based will not materialize or will vary significantly from actual results. Therefore, the inclusion of the valuations, opinions, estimates, forecasts, ratings or risk assessments described herein IS NOT TO BE RELIED UPON as a representation and/or warranty by the DBS Group (and/or any persons associated with the aforesaid entities), that: (a) such valuations, opinions, estimates, forecasts, ratings or risk assessments or their underlying assumptions will be achieved, and (b) there is any assurance that future results or events will be consistent with any such valuations, opinions, estimates, forecasts, ratings or risk
assessments stated therein. Any assumptions made in this report that refers to commodities, are for the purposes of making forecasts for the company (or companies) mentioned herein. They are not to be construed as recommendations to trade in the physical commodity or in the futures contract relating to the commodity referred to in this report. DBS Vickers Securities (USA) Inc ("DBSVUSA")"), a U.S.-registered broker-dealer, does not have its own investment banking or research department, has not participated in any public offering of securities as a manager or co-manager or in any other investment banking transaction in the past twelve months and does not engage in market-making. ANALYST CERTIFICATION The research analyst(s) primarily responsible for the content of this research report, in part or in whole, certifies that the views about the companies and their securities expressed in this report accurately reflect his/her personal views. The analyst(s) also certifies that no part of his/her compensation was, is, or will be, directly, or indirectly, related to specific recommendations or views expressed in this report. As of 4 Dec 2015, the analyst(s) and his/her spouse and/or relatives who are financially dependent on the analyst(s), do not hold interests in the securities recommended in this report (“interest” includes direct or indirect ownership of securities).
COMPANY-SPECIFIC / REGULATORY DISCLOSURES
1. DBS Bank Ltd., DBS Vickers Securities (Singapore) Pte Ltd (“DBSVS”), their subsidiaries and/or other affiliates do not have proprietary positions in the securities recommended in this report as of 31 Oct 2015.
2. DBS Bank Ltd does not market make in equity securities of the issuer(s) or company(ies) mentioned in this Research Report. 3.
Compensation for investment banking services: DBS Bank Ltd., DBSVS, their subsidiaries and/or other affiliates of DBSVUSA have received compensation, within the past 12 months for investment banking services from Bank Central Asia, Bank Danamon, Bank Tabungan Negara and Bank Rakyat Indonesia as of 31 October 2015. DBSVUSA does not have its own investment banking or research department, nor has it participated in any public offering of
Industry Focus
Indonesian Banks and Multifinance Companies
Page 13
securities as a manager or co-manager or in any other investment banking transaction in the past twelve months. Any US persons wishing to obtain further information, including any clarification on disclosures in this disclaimer, or to effect a transaction in any security discussed in this document should contact DBSVUSA exclusively.
RESTRICTIONS ON DISTRIBUTION
General This report is not directed to, or intended for distribution to or use by, any person or entity who is a citizen or resident of or located in any locality, state, country or other jurisdiction where such distribution, publication, availability or use would be contrary to law or regulation.
Australia This report is being distributed in Australia by DBS Bank Ltd. (“DBS”) or DBS Vickers Securities (Singapore) Pte Ltd (“DBSVS”), both of which are exempted from the requirement to hold an Australian Financial Services Licence under the Corporation Act 2001 (“CA”) in respect of financial services provided to the recipients. Both DBS and DBSVS are regulated by the Monetary Authority of Singapore under the laws of Singapore, which differ from Australian laws. Distribution of this report is intended only for “wholesale investors” within the meaning of the CA.
Hong Kong This report is being distributed in Hong Kong by DBS Vickers (Hong Kong) Limited which is licensed and regulated by the Hong Kong Securities and Futures Commission.
Indonesia This report is being distributed in Indonesia by PT DBS Vickers Securities Indonesia.
Malaysia This report is distributed in Malaysia by AllianceDBS Research Sdn Bhd ("ADBSR"). Recipients of this report, received from ADBSR are to contact the undersigned at 603-2604 3333 in respect of any matters arising from or in connection with this report. In addition to the General Disclosure/Disclaimer found at the preceding page, recipients of this report are advised that ADBSR (the preparer of this report), its holding company Alliance Investment Bank Berhad, their respective connected and associated corporations, affiliates, their directors, officers, employees, agents and parties related or associated with any of them may have positions in, and may effect transactions in the securities mentioned herein and may also perform or seek to perform broking, investment banking/corporate advisory and other services for the subject companies. They may also have received compensation and/or seek to obtain compensation for broking, investment banking/corporate advisory and other services from the subject companies.
Wong Ming Tek, Executive Director, ADBSR
Singapore This report is distributed in Singapore by DBS Bank Ltd (Company Regn. No. 196800306E) or DBSVS (Company Regn No. 198600294G), both of which are Exempt Financial Advisers as defined in the Financial Advisers Act and regulated by the Monetary Authority of Singapore. DBS Bank Ltd and/or DBSVS, may distribute reports produced by its respective foreign entities, affiliates or other foreign research houses pursuant to an arrangement under Regulation 32C of the Financial Advisers Regulations. Where the report is distributed in Singapore to a person who is not an Accredited Investor, Expert Investor or an Institutional Investor, DBS Bank Ltd accepts legal responsibility for the contents of the report to such persons only to the extent required by law. Singapore recipients should contact DBS Bank Ltd at 6327 2288 for matters arising from, or in connection with the report.
Thailand This report is being distributed in Thailand by DBS Vickers Securities (Thailand) Co Ltd. Research reports distributed are only intended for institutional clients only and no other person may act upon it.
United Kingdom
This report is being distributed in the UK by DBS Vickers Securities (UK) Ltd, who is an authorised person in the meaning of the Financial Services and Markets Act and is regulated by The Financial Conduct Authority. Research distributed in the UK is intended only for institutional clients.
Dubai
This research report is being distributed in The Dubai International Financial Centre (“DIFC”) by DBS Bank Ltd., (DIFC Branch) having its office at PO Box 506538, 3rd Floor, Building 3, East Wing, Gate Precinct, Dubai International Financial Centre (DIFC), Dubai, United Arab Emirates. DBS Bank Ltd., (DIFC Branch) is regulated by The Dubai Financial Services Authority. This research report is intended only for professional clients (as defined in the DFSA rulebook) and no other person may act upon it.
United States This report was prepared by DBS Bank Limited. DBSVUSA did not participate in its preparation. The research analyst(s) named on this report are not registered as research analysts with FINRA and are not associated persons of DBSVUSA. The research analyst(s) are not subject to FINRA Rule 2241 restrictions on analyst compensation, communications with a subject company, public appearances and trading securities held by a research analyst. This report is being distributed in the United States by DBSVUSA, which accepts responsibility for its contents. This report may only be distributed to Major U.S. Institutional Investors (as defined in SEC Rule 15a-6) and to such other institutional investors and qualified persons as DBSVUSA may authorize. Any U.S. person receiving this report who wishes to effect transactions in any securities referred to herein should contact DBSVUSA directly and not its affiliate.
Other jurisdictions
In any other jurisdictions, except if otherwise restricted by laws or regulations, this report is intended only for qualified, professional, institutional or sophisticated investors as defined in the laws and regulations of such jurisdictions.
DBS Bank Ltd.
12 Marina Boulevard, Marina Bay Financial Centre Tower 3 Singapore 018982 Tel. 65-6878 8888
Company Regn. No. 196800306E