Embed Size (px)
Citation preview
THIS REPORT CONTAINS ASSESSMENTS OF COMMODITY AND TRADE ISSUES MADE BY
USDA STAFF AND NOT NECESSARILY STATEMENTS OF OFFICIAL U.S. GOVERNMENT
POLICY
Date:
GAIN Report Number:
Approved By:
Prepared By:
Report Highlights:
The Government of India reports that Indonesia’s hotel industry averaged 6.5 percent growth between
2007 and 2011, while the restaurant industry grew an average of 5.7 percent. The HRI industry
attributes continued growth to urban Indonesian’s increased purchasing power, tourism, and MICE
(Meeting, Incentive, Conference, and Exhibitions) development. These factors have led to dramatic
growth of major international hotels, restaurants, and bakery chains.
Fahwani. Y. Rangkuti &
Thom Wright
Thom Wright
HRI Update 2013
Food Service - Hotel Restaurant Institutional
Indonesia
ID1361
12/27/2013
Required Report - public distribution

Post:
Executive Summary:
I. MARKET SUMMARY
Market Overview
Indonesia is the most populous country in the ASEAN region with 240 million people, mostly
concentrated on the five main islands of Java, Sumatra, Kalimantan, Sulawesi and Papua. It is home to
approximately 13,500 islands and hundreds of local languages and ethnic groups. It is bestowed with
vast natural resources, including petroleum and natural gas, logs, fisheries and iron ore. Indonesia is a
major producer of rubber, palm oil, coffee and cocoa.
The Indonesian economy is declining, with GDP falling to 5.6 percent despite sound monetary policy
interventions. This contrasts with positive growth rates above 6.0 percent during the 2007 to 2012
period. 2013 overall inflation is approaching eight percent, and the rupiah is weakening vis-à-vis the
U.S. dollar, having recently broken the RS 12,000 mark for the first time. The trade, hotel and restaurant
sector contributes 1.07 percent of GDP growth, second only to the manufacturing sector. The Ministry
of Finance 2012 report stated that during 2007 to 2011 hotel industry was growing at average 6.5
percent and restaurant industry at 5.7 percent.
Gross National Product per capita in 2007 was $1,843 and had grown to $3,459 by 2012. Consumption
accounted for 55 percent of GDP growth in Indonesia in 2012. Indonesian incomes are rising, driving an
expansion of the middle class. A major multinational bank published a report that indicated Indonesia’s
middle class was 1.6 million in 2004; 50 million in 2009; and a projected 150 million by 2014. This
growing demographic is creating new demand for western food products, imported brand names and
socializing outside of the home. Middle class consumers also have newly acquired access to media and
the internet, which further expose Indonesians to various international products, activities and lifestyles.
Strong domestic demand, slowing exports, and import growth have pushed up Indonesia’s trade deficit.
These points, along with a wave of election year economic nationalism have led the Government of
Indonesia (GOI) to strictly limit food imports. These limitations have resulted in dramatic price
increases for meat and horticultural products. The GOI also reduced certain fuel subsidies, leading to
higher fuel and electricity prices as of June 2013. Inflation and more protectionist policies are likely to
create challenges for the expansion of U.S. food product exports to Indonesia.
The Indonesian Hotel, Restaurant, and Institutional (HRI) sector is extremely diverse, consisting of
high-end hotels and restaurants that serve local and international cuisine, fast food outlets, cafés and
bars, bakery, and low-end small restaurants, street-side restaurants known as warungs, and vendors that
sell food to customers on the street. Catering operations serve airlines, factories, private social
functions, cruise and military ships, offshore mining and oil operations with expatriate staffs, prisons,
and hospitals. There is a concentration of high-end HRI businesses concentrated in Bali and urban areas.
Bali has the highest number of food service outlets, followed by Jakarta, Surabaya, Bandung, Surabaya,
Jakarta

Yogyakarta, Semarang, Medan, Bogor, Malang, Tangerang, and Solo. Four and five-star hotels,
restaurants, cafés and bars specializing in Western and other non-Indonesian cuisines for tourists are
dominant users of imported food products. Local caterers and restaurants tend to purchase local
products.
Table 1. Indonesia: Food Service Outlets
Description
2012 % Growth
2011/2012
Annual Forecast %
Growth 2012-17 CAGR
No of
Outlets
Value (Rp.
billion)
No of
Outlets Value No of Outlets Value
Cafes and bars (Chain & Independent)
Specialist Coffee
Shop
594 1,912 14.1 19.1 12.0 11.5
Café/Bars total 3,712 35,721 5.0 9.3 4.3 3.3
Full-service restaurants (Chain & Independent)
Asian 98,257 283,097 0.6 8.1 0.4 3.1
European 352 3.235 3.2 8.6 2.4 3.0
Latin American 44 307 4.8 13.0 4.2 5.2
Middle Eastern 31 175 3.3 11.5 3.0 4.1
North American 814 4,407 4.6 9.4 3.7 3.8
Pizza 450 3,653 3.9 9.5 2.7 5.0
Others 544 4,404 4.4 10.9 3.5 6.0
Fast Food (Chain & Independent)
Asian 1,628 5,493 2.3 9.7 2.7 3.3
Bakery products 987 1,403 4.7 15.4 2.9 6.3
Burger 498 2,719 7.6 13.0 6.0 8.7
Chicken 1,128 4,938 4.6 10.7 3.6 6.0
Convenience
Store
516 177 30.0 55.0 16.3 15.1
Ice cream 423 311 27 30.5 17.1 18.6
Middle Eastern 22 32 4.8 6.5 4.2 1.5
Traditional food seller
Street Stalls and
Warungs
93,021 13,381 1.2 5.8 0.8 1.0
Source: Euromonitor
The GOI regulates the expansion of quick service restaurants (QSR) through Ministry of Trade (MOT)
Regulation No. 7/2013. The regulation limits the number of outlets owned by a company to maximum
250 outlets. Companies with more than 250 outlets must franchise the existing outlets or divest them to
a third party within five years. The outlets are also required to use a minimum 80 percent of local
equipment and ingredient products. Additionally Ministry of Health (MOH) regulation No. 30/20013
requires QSRs to provide sugar, salt, and fat content information as well as a health message that reads
“consuming more than 50 grams of sugar, 2,000 milligrams of Sodium, or 67 grams of fat per person
per day increases the risk of hypertension, stroke, diabetes, and heart attack.”
Imported Food Products
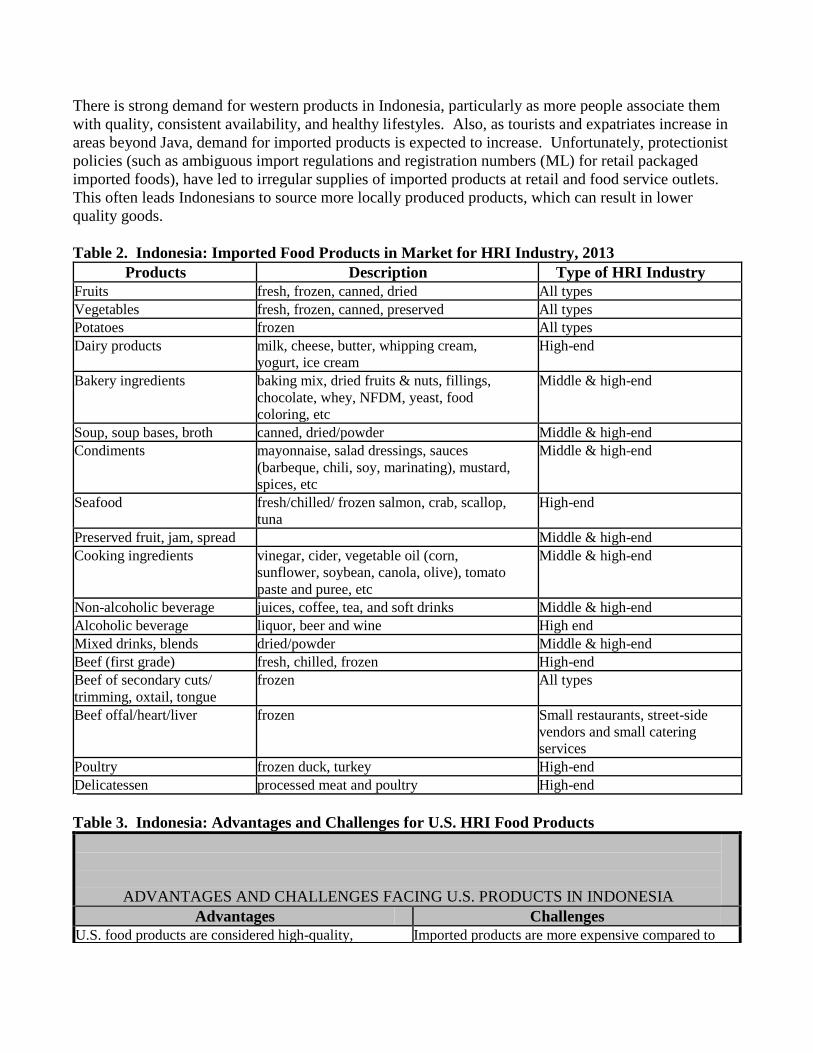
There is strong demand for western products in Indonesia, particularly as more people associate them
with quality, consistent availability, and healthy lifestyles. Also, as tourists and expatriates increase in
areas beyond Java, demand for imported products is expected to increase. Unfortunately, protectionist
policies (such as ambiguous import regulations and registration numbers (ML) for retail packaged
imported foods), have led to irregular supplies of imported products at retail and food service outlets.
This often leads Indonesians to source more locally produced products, which can result in lower
quality goods.
Table 2. Indonesia: Imported Food Products in Market for HRI Industry, 2013
Products Description Type of HRI Industry
Fruits fresh, frozen, canned, dried All types
Vegetables fresh, frozen, canned, preserved All types
Potatoes frozen All types
Dairy products milk, cheese, butter, whipping cream,
yogurt, ice cream
High-end
Bakery ingredients baking mix, dried fruits & nuts, fillings,
chocolate, whey, NFDM, yeast, food
coloring, etc
Middle & high-end
Soup, soup bases, broth canned, dried/powder Middle & high-end
Condiments mayonnaise, salad dressings, sauces
(barbeque, chili, soy, marinating), mustard,
spices, etc
Middle & high-end
Seafood fresh/chilled/ frozen salmon, crab, scallop,
tuna
High-end
Preserved fruit, jam, spread Middle & high-end
Cooking ingredients vinegar, cider, vegetable oil (corn,
sunflower, soybean, canola, olive), tomato
paste and puree, etc
Middle & high-end
Non-alcoholic beverage juices, coffee, tea, and soft drinks Middle & high-end
Alcoholic beverage liquor, beer and wine High end
Mixed drinks, blends dried/powder Middle & high-end
Beef (first grade) fresh, chilled, frozen High-end
Beef of secondary cuts/
trimming, oxtail, tongue
frozen All types
Beef offal/heart/liver frozen Small restaurants, street-side
vendors and small catering
services
Poultry frozen duck, turkey High-end
Delicatessen processed meat and poultry High-end
Table 3. Indonesia: Advantages and Challenges for U.S. HRI Food Products
ADVANTAGES AND CHALLENGES FACING U.S. PRODUCTS IN INDONESIA
Advantages Challenges
U.S. food products are considered high-quality, Imported products are more expensive compared to

healthy, and consistently available. domestic goods.
Expatriates and the growing middle class are potential
HRI customers. As more urban women enter the
workforce, time for shopping & cooking declines and
consumers seek convenience.
Most products
require halal
certification.
Applied duties on most food and agricultural products
are 5%.
Import regulations are often complex and non-
transparent, thus requiring close business
relationships with a local agent.
The U.S. Fresh Food of Plant Origin (FFPO) safety
control system has been recognized. U.S.
horticultural products are allowed to enter Tanjung
Priok – port of Jakarta.
Approximately 39 fruit based products must have
an import recommendation from the MOA and an
import permit from the MOT.
GOI lifted the ban of imported US bone-in meat on
June 17, 2013 Animal based foods must have an import
recommendation from the MOA Director-General
of Livestock and Animal Health Service as well as
an import permit from MOT.
Distribution systems on the island of Java are
improving, providing increased access to a population
of 136.6 million.
Infrastructure outside of the main island of Java,
including ports and cold storage facilities, is poorly
developed.
Indonesia does not produce sufficient quantities of
beef, dairy products, tree nuts, temperate zone fresh
fruit and vegetables.
Competition remains strong, especially from
Australia, New Zealand and China. Food product
imports from Malaysia, Philippines, and Thailand
are also growing.
International restaurants, hotel chains, boutique
hotels, and specialized cafés are increasing. Product shelf life should be considered for
shipments to Indonesia due to the extended
transportation and inconsistent custom clearance
procedures & time.
II. ROAD MAP FOR MARKET ENTRY
A. ENTRY STRATEGY
Most imported products for the HRI industry enter Indonesia by reputable local importers or distributor
agents. They represent imported products, obtain import licenses and permits, understand customs
clearance procedures, and distribute the products all over Indonesia. It is important that U.S. exporters
appoint reliable local importers/agents in order to stay current on any new import requirements or
regulations. Many regulations related to distribution and marketing of imported food and beverage
products are enforced in an ambiguous manner.
Exporters interested in shipping to Indonesia should visit and research the market, and prioritize
building a long-term relationship with a local importer/distributor. Understanding the complexity and
weaknesses of the distribution system is also critical, especially if refrigeration and cold storage
facilities are required. Exporters should familiarize themselves with local tastes and work closely with
chefs, food and beverage professionals, and purchasing staff to modify any food items as necessary. It
is also important for exporters to educate themselves on product knowledge, handling, preparation,
pricing, and specific promotion strategies.
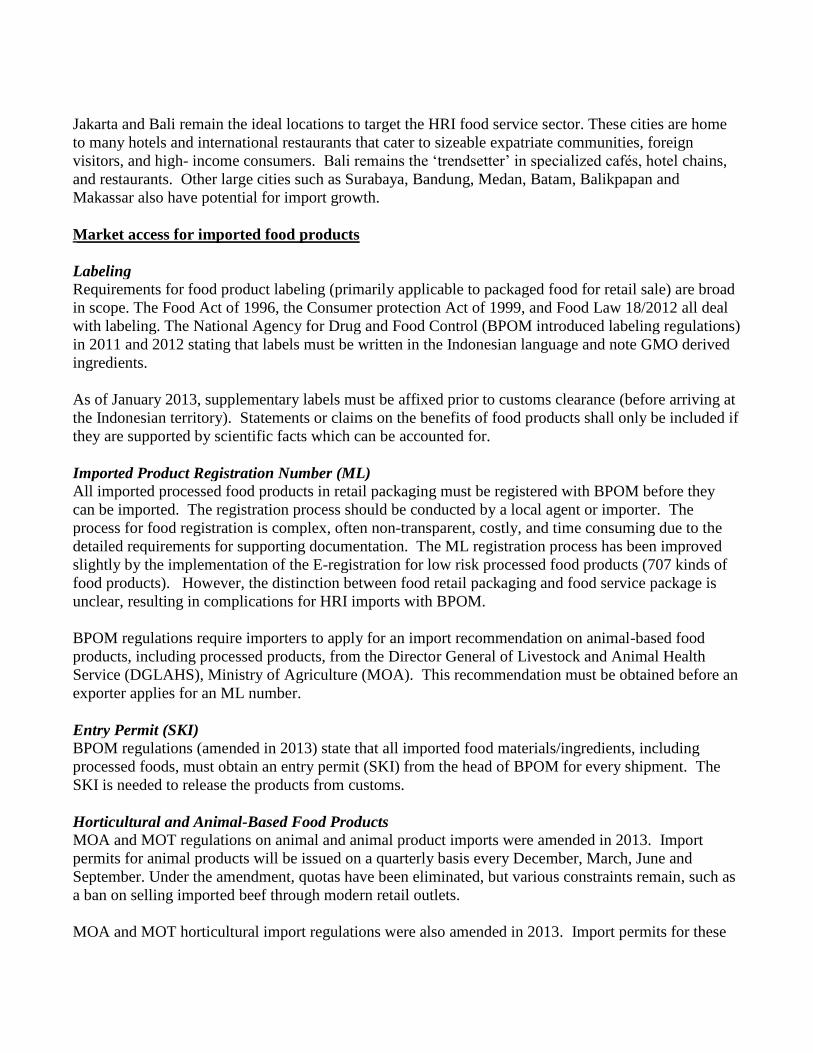
Jakarta and Bali remain the ideal locations to target the HRI food service sector. These cities are home
to many hotels and international restaurants that cater to sizeable expatriate communities, foreign
visitors, and high- income consumers. Bali remains the ‘trendsetter’ in specialized cafés, hotel chains,
and restaurants. Other large cities such as Surabaya, Bandung, Medan, Batam, Balikpapan and
Makassar also have potential for import growth.
Market access for imported food products
Labeling Requirements for food product labeling (primarily applicable to packaged food for retail sale) are broad
in scope. The Food Act of 1996, the Consumer protection Act of 1999, and Food Law 18/2012 all deal
with labeling. The National Agency for Drug and Food Control (BPOM introduced labeling regulations)
in 2011 and 2012 stating that labels must be written in the Indonesian language and note GMO derived
ingredients.
As of January 2013, supplementary labels must be affixed prior to customs clearance (before arriving at
the Indonesian territory). Statements or claims on the benefits of food products shall only be included if
they are supported by scientific facts which can be accounted for.
Imported Product Registration Number (ML) All imported processed food products in retail packaging must be registered with BPOM before they
can be imported. The registration process should be conducted by a local agent or importer. The
process for food registration is complex, often non-transparent, costly, and time consuming due to the
detailed requirements for supporting documentation. The ML registration process has been improved
slightly by the implementation of the E-registration for low risk processed food products (707 kinds of
food products). However, the distinction between food retail packaging and food service package is
unclear, resulting in complications for HRI imports with BPOM.
BPOM regulations require importers to apply for an import recommendation on animal-based food
products, including processed products, from the Director General of Livestock and Animal Health
Service (DGLAHS), Ministry of Agriculture (MOA). This recommendation must be obtained before an
exporter applies for an ML number.
Entry Permit (SKI) BPOM regulations (amended in 2013) state that all imported food materials/ingredients, including
processed foods, must obtain an entry permit (SKI) from the head of BPOM for every shipment. The
SKI is needed to release the products from customs.
Horticultural and Animal-Based Food Products MOA and MOT regulations on animal and animal product imports were amended in 2013. Import
permits for animal products will be issued on a quarterly basis every December, March, June and
September. Under the amendment, quotas have been eliminated, but various constraints remain, such as
a ban on selling imported beef through modern retail outlets.
MOA and MOT horticultural import regulations were also amended in 2013. Import permits for these

products will be issued on a semester basis, (December and June). The GOI has eliminated quotas for
horticultural products.
Halal Indonesian halal concerns continue to challenge U.S. food exporters. Halal, as defined by Indonesian
regulations, includes foods, beverages, drugs, cosmetics, biochemistry products, and genetically
modified products. Indonesia’s Congress, or Dewan Perwakilan Rakyat (DPR), is debating the
Guarantee on Halal Products Law. Post is unsure when the DPR will pass a definitive law on the
Guarantee on Halal Products Law, but expects that a law is forthcoming. Post expects that the law will
mandate that any halal product must be consumed, used, or worn in accordance with Islamic Law.
These products must have a recognized halal certificate and be labeled with the recognized halal
symbol.
Duties and Taxes Although import duties applied to most of food and agricultural products are 5 percent, most imported
products are also assessed a value added tax of 10 percent and sales tax of 2.5 percent. Alcoholic
beverages are imported based on quota set by MOT on April every year.
Competition
Indonesian consumers are generally knowledgeable about U.S. food quality and safety. Prices are
higher than competitors due to higher freight costs from competing origins. Consolidated shipments
with products from several suppliers are highly favored and can be cost effective for Indonesian
importers. Consolidated shipments, however, can create documentation problems.
Third-country competition remains strong, especially from Australia, New Zealand, China and
European countries. Food product imports from ASEAN countries such as Malaysia, Philippines, and
Thailand are also growing.
Indonesian regulations have led to a larger share of local products in retail markets. The quality and
variety of most Indonesian-produced food products are not comparable to those of the U.S. and other
imported products. Local production is largely limited to more Asian types of foods; with utilize
different ingredients and production processes.
B. MARKET STRUCTURE
Distribution System
The Indonesian distribution system for imported products is simple (see distribution chart below).
When U.S. products arrive in Indonesia via an importer or distributor, the products are delivered
directly to HRI operators. Sub-distributors, agents or wholesalers may be necessary for HRI operators
located outside Jakarta. Medium and small HRI operators normally purchase products through local
agents, wholesalers, regular supermarkets and hypermarkets.
Some U.S. chains and upscale HRI operators import items directly from U.S. exporters. Quick Service
Restaurants/fast food operators have exclusive contracts with importers/distributors. For example,

frozen potatoes (french fries/crinkle cuts), fried chicken coating mix, doughnut mix, and pizza cheese
are brought in through exclusive importers in order to ensure that the products meet strict international
franchise standards.
The food distribution system becomes more complex beyond Jakarta and Bali. Supermarkets,
hypermarkets, and small scale agents play important roles in the distribution of imported products for
medium and small HRI operators. Such products are limited to canned and fresh fruits, canned
vegetables, frozen potatoes, preserved fruits/jams, butter, yogurt, condiments, sauces, and dried fruits
(raisins).
Distribution Channel
Figure 1. Indonesia: HRI Sector Distribution Channel
Indonesia: HRI Sector Distribution Channel
U.S. Exporter
Importer/Distributor
Sub-distributor/Agents Wholesaler/Supermarket/
Hypermarket
Hotels Restaurants Caterers Institutions
Insufficient distribution infrastructure results in imported food shortages nationwide. Imported products
mostly arrive in the Jakarta or Surabaya seaports, where the shipments are broken down for re-shipment
via air, truck, or smaller ship to other cities. Imported perishable products are purchased directly from
foreign suppliers or agents to serve upscale HRI industries, and air shipments from Australia and other
origins to Jakarta or Bali are common.
Distribution of domestic products is less complicated compare to imported products. The HRI operators
purchase domestic products directly from local manufacturers and their distributors, agents,
wholesalers, and wet markets located in the same areas.

C. SUB-SECTOR PROFILES
Hotels and Resort (restaurants and catering services)
There are around 1,600 star rated, boutique and resort hotels with roughly 155,000 rooms in Indonesia.
Major concentrations of those hotels are in Bali (218 hotels), West Java (208 hotels), Jakarta (175
hotels), Central Java (139 hotels), East Java (98 hotels), North Sumatera (83 hotels), Riau island (70
hotels), South Sulawesi (57 hotels) and Yogyakarta (52 hotels). International hotel chains include
Pullman, Intercontinental, Crown, The Ritz-Carlton, Le Meredien, Kempinski, J.W. Marriot, Ascot,
Four Season, Grand Hyatt, Mandarin, Conrad, Westin, Novotel, Oberoi, St Regis and locally-owned
boutique and resort hotels. State-owned companies are also entering the hotel business.
Table 4. Indonesia: Major Hotel Chains 2012
Hotel Chain Hotel Name Number
of Rooms
Accor – French
group
Ibis, Formulae, Mecure, Pullman and Novotel 10,837
rooms
Aston International -
Hawaii
Grand Aston, Alana, Royal Alana, Royal Kamuela and
Kamuela, Aston, Aston City, Aston Inn & Quest, Neo Hotels
, Fave Hotel
6,087
rooms
Santika Hotels &
Resorts - domestic
Santika Premier, Santika, Amaris, The Samaya, The Kayana 5,653
rooms
Swiss Bel-Hotel –
Hongkong
Grand Swiss, Swiss Bel Hotel, Swiss Belinn, Zest 4,196
rooms
Starwood W, St. Regis, The Luxury Collection, Westin, Sheratorn, Le
Meredien
2,702
rooms
Tauzia Hotel
management -
domestic
Harris, Preference, POP Hotel 2,319
rooms
Sahid Hotel network
-domestic
2,042
rooms
InterContinental
Hotels Group
InterContinental, Crowne, Holiday Inn 1,995
rooms
Hyatt 1,971
rooms
Discovery Hotels &
Resorts
Borobudur, Discovery Kartika Plaza, Home@36 Bali, Palaca
Hotel Cipanas, Discovery Express Paramita, Gaja Hotel,
Hotel Ebony, Discovery Hotel & Convention Ancol, Kendari
Beach City Hotel
1,918
rooms
Source: HVS Global Hospitality Service data
Bali remains the most visited tourist destination in Indonesia, followed by Jakarta and Batam. A total of
8.0 million tourist visited Indonesia in 2012. GOI data indicated that in 2012, Singapore, Malaysia,
Australia, China, Japan, South Korea, Taiwan and Philippines accounted for the highest numbers of
tourists by nationality, followed by the United States, United Kingdom, India, France, Netherlands,

Germany, and Russia. The number of tourist arrivals is predicted at around 9.5 million in 2014.
Table 5. Indonesia: Tourism Indicators
Description Year
2008 2009 2010 2011 2012
No. of foreign tourists (mil) 6.2 6.3 7.0 7.6 8.0
Revenue (US $bill) 7.3 6.3 7.6 8.6 9.1
Occupancy Rate (%)-rated hotels 48 48 49 51 50
Number of hotel rooms-rated & non rated
hotels
325,218 334,817 353.138 381,457 405,778
Source: National Statistical Agency (BPS)
MICE
The GOI has assigned 10 main cities and 3 potential cities as MICE destinations. The main cities are
Medan, Padang/Bukit Tinggi, Batam, Jakarta, Bandung, Yogyakarta, Surabaya, Bali, Makassar and
Manado, and the potential cities are Palembang, Lombok and Balikpapan. The aggressive expansion of
hotel industry in each provincial capital, however, indicates that many locations are able to support
MICE events.
The rapid expansion of the airline sector, including low-cost carriers provide effective and efficient
access to reach MICE destination cities. Although Indonesia has several tourist destinations, it lacks
transportation infrastructure, an online comprehensive MICE database, and market access for product
samples and souvenirs for MICE activities.
Figure 2. Indonesia: Number of MICE activities
Source: ICCA Statistic Report

Figure 3. ASEAN: Number of MICE Activities
Source: ICCA Statistic Report
Based on International Congress and Conventions Association (ICCA) data, Indonesia was ranked 39 as
a venue for MICE in 2010. The main venue is Bali, Jakarta, and Bandung.
Table 6. Indonesia: Major Hotel Imported Food Products/Ingredients Consumption
Company Name Location Purchasing Agent
(s)
International Chain Hotel
Bvlgary Bali (1) Importer/Distributor
Conrad Bali (1) Importer/Distributor
Four Season Jakarta (1), Bali (2) Importer/Distributor
Hard Rock Bali (1) Importer/Distributor
Hilton Bandung (1) Importer/Distributor
Hyatt Bali (2), Bandung (1) Jakarta (1), Yogyakarta
(1)
Importer/Distributor
Intercontinental Jakarta (1), Bali (1) Importer/Distributor
J.W. Marriot Jakarta (1), Medan (1), Surabaya (1) Importer/Distributor
Kempinski Jakarta (1) Importer/Distributor
Keraton at the Plaza-The
Luxury Collection
Jakarta (1) Importer/Distributor
Mandarin Jakarta (1) Importer/Distributor
Nikko Bali (1) Importer/Distributor
Oberoi Bali (1), Lombok (1) Importer/Distributor
Pullman Jakarta (2), Bali (1) Importer/Distributor
Ritz Carlton Jakarta (2) Importer/Distributor
Shangri-La Jakarta (1), Surabaya (1) Importer/Distributor

Sheraton Lombok (1), Yogayakarta (1), bandung (1),
Jakarta (2), Lampung (1), Surabaya (1), Bali
(1)
Importer/Distributor
St Regis Bali (1) Importer/Distributor
The Chedi (GHM) Bali (4) Importer/Distributor
W Retreat & Spa Bali (1) Importer/Distributor
Westin Bali (1) Importer/Distributor
Domestic Hotel
Alila Bali (1), Jakarta (1) Importer/Distributor
Aryaduta Jakarta (1), Medan (1), Makassar (1),
Palembang (1), Pakanbaru (1),
Manado (1)
Importer/Distributor
Ayana Resort & Spa Bali (1) Importer/Distributor
Borobudur Jakarta (1) Importer/Distributor
Dharmawangsa Jakarta (1) Importer/Distributor
Grand Candi Semarang (1) Importer/Distributor
Grand Mahakam Jakarta (1) Importer/Distributor
Gran Melia Jakarta (1) Importer/Distributor
Melia Bali (1) Importer/Distributor
Mulia Jakarta (1), Bali (2) Importer/Distributor
Nusa Dua Beach Hotel Bali (1) Importer/Distributor
Padma Bandung (1), Bali (1) Importer/Distributor
Papandayan Bandung (1) Importer/Distributor
The Laguna Bali (1) Importer/Distributor
Trans Luxury Hotel Bandung (1) Importer/Distributor
Gumaya Tower Semarang (1) Importer/Distributor
Tugu Malang (1), Bali (1), Lombok (1) Importer/Distributor
Villas & Resorts
Banyan Tree Ungasan Bali (1) Importer/Distributor
Cocotinos Sekotong Lombok (1) Importer/Distributor
Damai Bali (1) Importer/Distributor
Hotel Ombak Sunset Lombok (1) Importer/Distributor
Jamahal Private Resort &
Spa
Bali (1) Importer/Distributor
Jeeva Klui Resort Lombok (1) Importer/Distributor
Jimbaran Puri Bali Bali (1) Importer/Distributor
Kayumanis Nusa Dua
Private Villa & Spa
Bali (1) Importer/Distributor
Kebun Villas & Resort Lombok (1) Importer/Distributor
Komaneka Bali (4) Importer/Distributor
Quinci Villas Lombok (1) Importer/Distributor
Puri Sunia Resort Bali (1) Importer/Distributor
The Chedi Club Bali (1) Importer/Distributor
The Kayana Bali (1) Importer/Distributor

The Legian Beach Bali (1) Importer/Distributor
The Lombok Lodge Lombok (1) Importer/Distributor
The Samaya Bali (2) Importer/Distributor
The Ulin Villa & Spa Bali (1) Importer/Distributor
Sudamala Suites & Villas Lombok (1) Importer/Distributor
Ubud Hanging Garden Bali (1) Importer/Distributor
Uma Bali (1) Importer/Distributor
Viceroy Bali (1) Importer/Distributor
Villa Semana Bali (1) Importer/Distributor
This list is not comprehensive. Source: Website, importers, Media
Sources estimate that there are approximately 6,000 restaurants in Indonesia. Bali has around 2,600
restaurants, followed by Jakarta 2,082 restaurants, Bandung 377, Surabaya 324, Yogyakarta 215,
Semarang 122, Medan 116, Bogor 73, Malang 62, Tangerang 51 and Solo 41
Western style fast food outlets purchase imported foods, but the variety is limited. Restaurants serving
noodles, Japanese food, pizza, and fried chicken, as well as bakery product outlets and coffee houses are
prominent and tend to use imported beef, fresh and canned fruits, frozen potatoes and vegetables,
dressing, sauces, bakery ingredients, juice and mixed drinks, whipping cream, bakery ingredients and
mixes, delicatessen products, and various coffee ingredients, such as creamer, honey, and flavorings.
Irreplaceable food ingredients for French, Italian, Japanese and Korean restaurants depend greatly on
imported products (cheese, condiments, oils, sauces, rice, and canned foods).
Fast food outlets continue to thrive, despite the domination of roadside stalls and vendors in the food
service industry. The most prevalent fast food outlets include Kentucky Fried Chicken (450 outlets as
of October 2013), A&W (240 outlets as of October 2013), California Fried Chicken (270 outlets as of
October 2013), McDonald’s (133 outlets as of October 2013), and Pizza Hut (215 outlets plus 70 outlets
for delivery as of early 2013). These outlets will remain popular due to affordable prices, high
standards and quality, and a pan-Indonesia footprint. More and more burger restaurants (ex: Burger
King, Carl’s Junior, MOS Burger, Fatburger, Wendy’s) and pizza (ex: Domino pizza, Marzano Pizza)
outlets from different companies have opened in Jakarta and its surrounding over the last few years.
Throughout Java and Bali, 24 hour convenience stores like Circle K and Minimart provide tourists and
expatriates with hot coffee, tea, cold beverages, burgers, hotdogs, freshly baked pastries, bread and
cookies. This sector is expected to expand in the future and to offer more food, beverages, and products
with imported food ingredients. In Jakarta, 7-Eleven, Indomaret, Alfamart, Starmart, Lawson, and
Ministop convenience stores are popular.
Table 7. Indonesia: Major Restaurants Consuming Imported Food Products/Ingredients
Company Name Sales in
2012
Outlet Name,
Type &
Number of
Outlets
Location Purchasing Agent
(s)
Franchise Restaurant/Fast Food/Pizza
Biru Fast Food N/A A & W (240 Nation wide Importers/Distributor

Nusantara, PT as of Oct
2013)
Sari Burger
Indonesia, PT
N/A Burger King
(42 as of Oct
2013)
Jakarta, Bandung,
Bali
Importers/Distributor
Pioneerindo
Gourmet
International, PT,
Tbk
Rp. 34.4
billion (total
fro Sapo
Oreintal,
Cal Donuts,
and CFC
California
Fried Chicken
/CFC (270 as
of Oct 2013)
Nation wide Importers/Distributor
Fortune Food
Int’l
N/A Carl’s Jr (5 as
of Oct 2013)
Jakarta Importers/Distributor
Fastfood
Indonesia, PT.
Tbk
Rp. 3.55
trilliun
Kentucky
Fried Chicken
(450 in Oct
2013)
98 cities all over
Indonesia
Importers/Distributor
Lotteria
Indonesia, PT
N/A Lotteria (25 in
May 2013)
Jakarta, Bogor,
Depok, Tangerang,
Cikarang, Karawang
Importers/Distributor
Rekso National
Food
N/A Mc Donald
(133 as of Oct
2013)
Nation wide Importers/Distributor
MOG Indonesia,
PT
N/A MOS Burger
(4)
Jakarta Importers/Distributor
Cipta Selera
Murni, PT
N/A Texas Fried
Chicken (98 as
of Oct 2013)
Nation wide Importers/Distributor
Trans Burger, PT N/A Wendy’s (26
as of Oct
2013)
Jakarta, Bandung,
Yogyakarta,
Surabaya, Bali,
Makassar
Importers/Distributor
Michelindo Food
International, PT
N/A BonChon
Chicken (15 as
of Oct 2013)
Jakarta, Tangerang,
Bali, Bekasi,
Surabya, Depok
Importers/Distributor
Mitra
Adiperkasa, PT
N/A Domino’s
Pizza (51 as of
Oct 2013)
Jakarta, Tangerang,
Depok, Bekasi,
Bogo, Bandung,
Bali
Importers/Distributor
Ismaya Group N/A Pizza E Birra
(5 as of Oct
2013)
Jakarta, Bandung Importers/Distributor
Sari Melati
Kencana, PT
N/A Pizza Hut (215
outlets plus 70
delivery
Nation wide Importers/Distributor
Direct

outlets as of
early 2013)
Mitra
Adiperkasa, PT
N/A Pizza Marzano
(10)
Jakarta, Tangerang Importers/Distributor
Other type of restaurant
Entertainment
Indonesia, PT
N/A Amigos (2) Jakarta Importers/Distributor
Gading Food, PT N/A Fish & Co (13
as of Oct
2013)
Jakarta, Suarabya,
Bali
Importers/Distributor
Mugi Rekso
Abadi Group
(MRA)
N/A Hard Rock
Café (2 as of
Oct 2013)
Jakarta , Bali Importers/Distributor
Superutama
Nusantara, PT
N/A Sizzler
(American
Grill, 6 as of
Oct 2013)
Jakarta Importers/Distributor
Cahaya Sakti, CV N/A Tamani café
(20 as of Oct
2013)
Jakarta, Tangerang Importers/Distributor
Cashwood
Indonesia Group
N/A TGI Friday’s
(2 as of Oct
2013)
Jakarta, Tangerang Importers/Distributor
Mas Millenium
Indonesia, PT
N/A Tony’ Romas
(5 as of Oct
2013)
Jakarta, Bandung Importers/Distributor
Jaddi
international, PT
N/A Vin + (5 as of
October 2013)
Jakarta, Bali Importers/Distributor
OBS Citra
Indonesia, PT
N/A Outback Steak
House (3)
Jakarta Importers/Distributor
Planet Hollywood
Inc.
N/A Planet
Hollywood (2)
Jakarta, Bali Importers/Distributor
Sari Coffe
Indonesia, PT
N/A Starbuck (147
as of April
2013)
Jakarta, Medan,
Bali, Surabaya,
Bogor, Cikampek ,
Balikpapan,
Semarang, Batam,
Makassar, Solo,
Palembang,
Yogyakarta,
Bandung
Importers/Distributor
Excelso
Multirasa, PT
N/A Excelso Café’
(more than 100
outlets in early
2013)
Nation wide Importers/Distributor
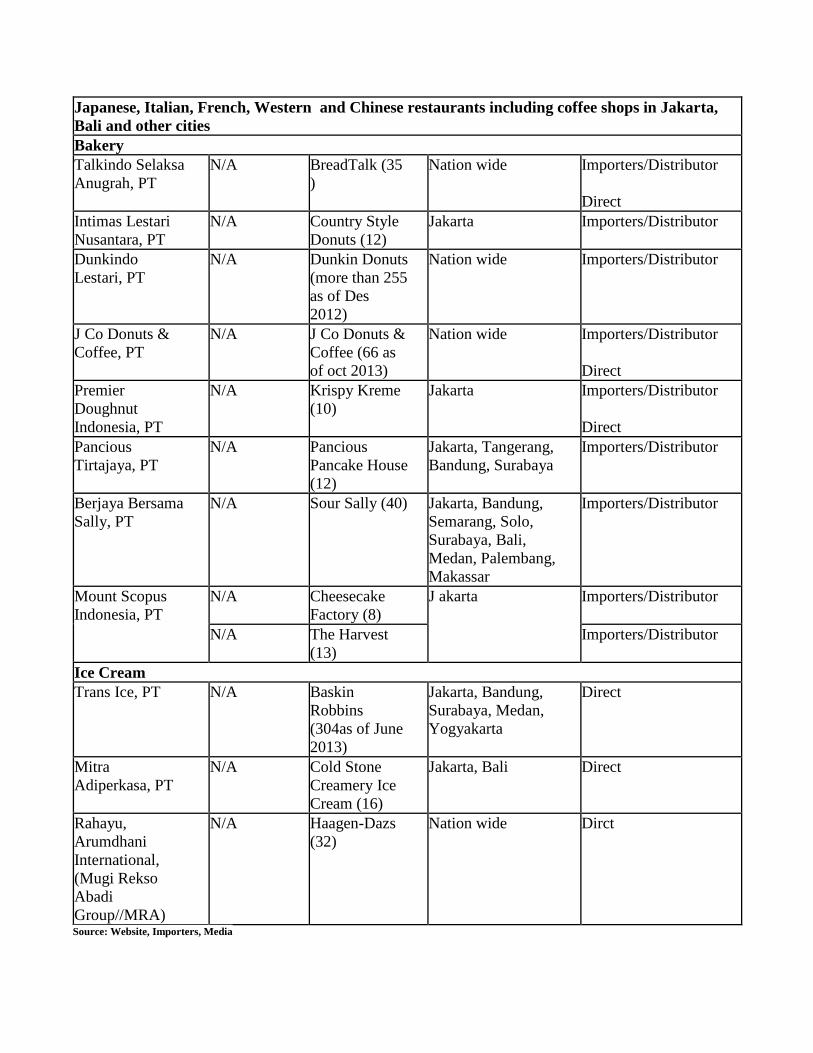
Japanese, Italian, French, Western and Chinese restaurants including coffee shops in Jakarta,
Bali and other cities
Bakery
Talkindo Selaksa
Anugrah, PT
N/A BreadTalk (35
)
Nation wide Importers/Distributor
Direct
Intimas Lestari
Nusantara, PT
N/A Country Style
Donuts (12)
Jakarta Importers/Distributor
Dunkindo
Lestari, PT
N/A Dunkin Donuts
(more than 255
as of Des
2012)
Nation wide Importers/Distributor
J Co Donuts &
Coffee, PT
N/A J Co Donuts &
Coffee (66 as
of oct 2013)
Nation wide Importers/Distributor
Direct
Premier
Doughnut
Indonesia, PT
N/A Krispy Kreme
(10)
Jakarta Importers/Distributor
Direct
Pancious
Tirtajaya, PT
N/A Pancious
Pancake House
(12)
Jakarta, Tangerang,
Bandung, Surabaya
Importers/Distributor
Berjaya Bersama
Sally, PT
N/A Sour Sally (40) Jakarta, Bandung,
Semarang, Solo,
Surabaya, Bali,
Medan, Palembang,
Makassar
Importers/Distributor
Mount Scopus
Indonesia, PT
N/A Cheesecake
Factory (8)
J akarta Importers/Distributor
N/A The Harvest
(13)
Importers/Distributor
Ice Cream
Trans Ice, PT N/A Baskin
Robbins
(304as of June
2013)
Jakarta, Bandung,
Surabaya, Medan,
Yogyakarta
Direct
Mitra
Adiperkasa, PT
N/A Cold Stone
Creamery Ice
Cream (16)
Jakarta, Bali Direct
Rahayu,
Arumdhani
International,
(Mugi Rekso
Abadi
Group//MRA)
N/A Haagen-Dazs
(32)
Nation wide Dirct
Source: Website, Importers, Media

Facts on the restaurant industry:
Chain fast food is appropriate to customers in all income groups because it offers affordable
package prices, creative new menus, menu & facilities for children, and delivery services to time
sensitive customers.
Full service restaurants promote group events, such as televised sports.
Restaurants are found in shopping mall, apartment, hospitals, schools, office buildings, freeway
rest areas, airports, recreational parks and residential areas.
Convenience store expansion increases the probability of selling imported food and beverages
products.
Chains and independent bakeries are growing.
More restaurants are working with credit card companies to offer discounts to increase
transactions.
Gathering, entertaining and socialization in restaurants is growing. Eating out is a common
activity across all socio-economic levels, especially amongst families on weekends.
Social media is a very popular means of publicizing foodservice information targeting young
customers.
The alcoholic beverage market is controlled by the government through quotas.
Warungs and Street Stalls
Warungs and street stalls are very popular and found throughout Indonesia. Various local dishes and
snacks are sold in this type of venue and consumed by lower income consumers. Fried chicken,
burgers, hotdogs, and kebabs are being featured more frequently on their menus. Hygiene is typically
substandard. Soy based food such tofu and tempe are widespread in Java (ketoprak, siomay, kembang
tahu, gado-gado), while meatballs (bakso), fried noodle and chicken noodle (mie ayam) are dishes that
consumed throughout Indonesia. Martabak is a popular street stall snack containing eggs, wheat flour,
condensed milk, chocolate sprinkles and cheese. Commonly imported ingredients for street stall dishes
include soy, wheat/wheat flour, dairy products, and beef heart.
Institutional
Caterers are typically small to medium-sized private enterprises that serve factories, offices, schools,
hospitals, company events, private social functions, and weddings. Caterers typically serve local food
products, although they are likely to use imported beef offal, fresh and canned fruits, frozen potatoes
and vegetables, dressings, bakery ingredients and mixes. Airlines, mining and petroleum companies,
and international standard catering services, hotels and restaurants may use other types of imported
foods.
Table 8. Major Restaurants Consuming Imported Food Products/Ingredients
Company
Name
Sales
in
2012
Outlet Name,
Type &
Number of
Outlets
Location Purchasing Agents
In-flight and industrial catering
Aerofood
Catering
ACS Jakarta, Bali, Surabaya,
Medan, Balikpapan,
Importer/Distributor

Service, PT Yogyakarta, Bandung,
Indocater, PT Indocater Jakarta Importer/Distributor
Pangansari
Utama, PT
PSC Jakarta, Subaraya, Timika,
Balikpapan, Medan,
Pakanbaru, Makassar,
Palembang, Denpasar,
Sorong, Tembagapura,
Batam
Importer/Distributor
Patra Jasa, PT Patra
Catering
Jakarta Importer/Distributor
Prasmanindo
Boga Utama,
PT
PBU Jakarta, Balikpapan,
Gosowong-Sumbawa
Importer/Distributor
Purantara Mitra
Angkasa Dua,
PT
Purantara in-
flight catering
Jakarta Importer/Distributor
Event catering
Akasya
Catering
Akasya Jakarta Importer/Distributor,
wholesaler
Culture Royale,
PT
Culture
Royale
Jakarta Importer/Distributor,
wholesaler
Puspa Catering
Services
Puspa Jakarta Importer/Distributor,
wholesaler
Tiara Royale,
PT
Tiara Royale Jakarta Importer/Distributor,
wholesaler Source: Website
Facts on catering industry:
In-flight catering is expected to expand as tourism grows.
III. COMPETITION
Table 9. Indonesia: Imports Verses Domestically Produced Goods Competition, 2012
Product
Category
Major Supply
Sources
Strengths of Key Supply
Countries
Advantages and
Disadvantages of Local
Suppliers
Fresh Fruit
Net volume
import: 776,679
Ton
Value: $824
million
China 55.7%
Thailand 18%
U.S. 9.2%
Australia 2.6%
China supply: fuji apple:
yalie pear, Shandong pear,
red globe table grape,
mandarin, orange, lemon
Thailand supply: longan,
durian, mangoes
US supply: red delicious and
Only tropical fresh fruit is
produced locally. Supply is
inconsistent.

other varieties of apple, table
grape and orange
Australia supply: pear, red
globe table grape, orange
Fresh Vegetables
Net volume
import: 690,218
Ton
Value: $384
million
China 70%
India 7.5%
Vietnam 5%
Thailand 4.9%
US- minor
supplier (1%
share)
China supply: onion, shallot,
carrot, potato, chili
India supply: onion, shallot
Vietnam supply: shallot, chili
Thailand supply: shallot
No onion is produced
locally. Local shallot and
chili production does not
meet local demand during
rainy season.
Only tropical fresh
vegetables are produced
locally. Supply is
inconsistent.
Red meats fresh,
chilled, frozen
Net volume
import: 41,857
Ton
Value: $165.8
million
Australia 73%
New Zealand
23%
U.S. 3.7%
Australia and New Zealand
have a competitive pricing
and no reported cases of
FMD and BSE
Shortage of supply. Most
domestic production is sold
fresh to traditional markets
and modern retail outlets
Processed fruit &
vegetables
Net volume
import: 126,514
MT
Value: $154
million
China 27.5%
US 21.8%
Thailand
13.6%
Netherlands
6.1%
New Zealand
4%
China and Thailand supply
processed fruit and vegetable
products. Brands are well
known and prices are
competitive
Limited processed fruit and
vegetable products produce
locally.
Malt, mixes &
dough
Net volume
import: 44,429
MT
Value: &145.6
million
Malaysia
53.3%
Singapore
23.3%
Thailand 7.4%
Netherland
3.4%
United
Kingdom
3.7%
Malaysia, Singapore and
Thailand are neighboring
countries with similar tastes
and culture. ASEAN free
trade agreement opens the
Indonesia market.
Domestic production of
premixes for bakery
industry is growing. The
opportunity is still open to
other suppliers to supply the
market.
Butter
Net volume
New Zealand
69.6%
Belgium 14%
New Zealand and Australia
have a competitive pricing
and geographic proximity.
Almost no butter produced
locally.
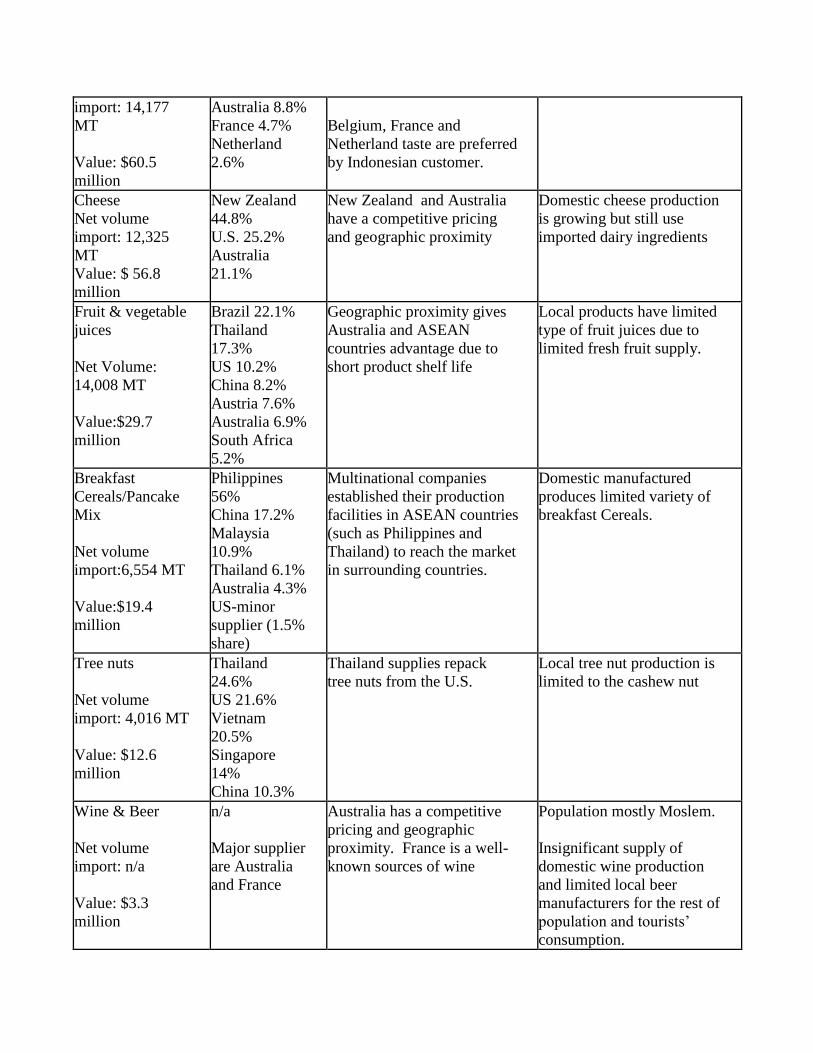
import: 14,177
MT
Value: $60.5
million
Australia 8.8%
France 4.7%
Netherland
2.6%
Belgium, France and
Netherland taste are preferred
by Indonesian customer.
Cheese
Net volume
import: 12,325
MT
Value: $ 56.8
million
New Zealand
44.8%
U.S. 25.2%
Australia
21.1%
New Zealand and Australia
have a competitive pricing
and geographic proximity
Domestic cheese production
is growing but still use
imported dairy ingredients
Fruit & vegetable
juices
Net Volume:
14,008 MT
Value:$29.7
million
Brazil 22.1%
Thailand
17.3%
US 10.2%
China 8.2%
Austria 7.6%
Australia 6.9%
South Africa
5.2%
Geographic proximity gives
Australia and ASEAN
countries advantage due to
short product shelf life
Local products have limited
type of fruit juices due to
limited fresh fruit supply.
Breakfast
Cereals/Pancake
Mix
Net volume
import:6,554 MT
Value:$19.4
million
Philippines
56%
China 17.2%
Malaysia
10.9%
Thailand 6.1%
Australia 4.3%
US-minor
supplier (1.5%
share)
Multinational companies
established their production
facilities in ASEAN countries
(such as Philippines and
Thailand) to reach the market
in surrounding countries.
Domestic manufactured
produces limited variety of
breakfast Cereals.
Tree nuts
Net volume
import: 4,016 MT
Value: $12.6
million
Thailand
24.6%
US 21.6%
Vietnam
20.5%
Singapore
14%
China 10.3%
Thailand supplies repack
tree nuts from the U.S.
Local tree nut production is
limited to the cashew nut
Wine & Beer
Net volume
import: n/a
Value: $3.3
million
n/a
Major supplier
are Australia
and France
Australia has a competitive
pricing and geographic
proximity. France is a well-
known sources of wine
Population mostly Moslem.
Insignificant supply of
domestic wine production
and limited local beer
manufacturers for the rest of
population and tourists’
consumption.
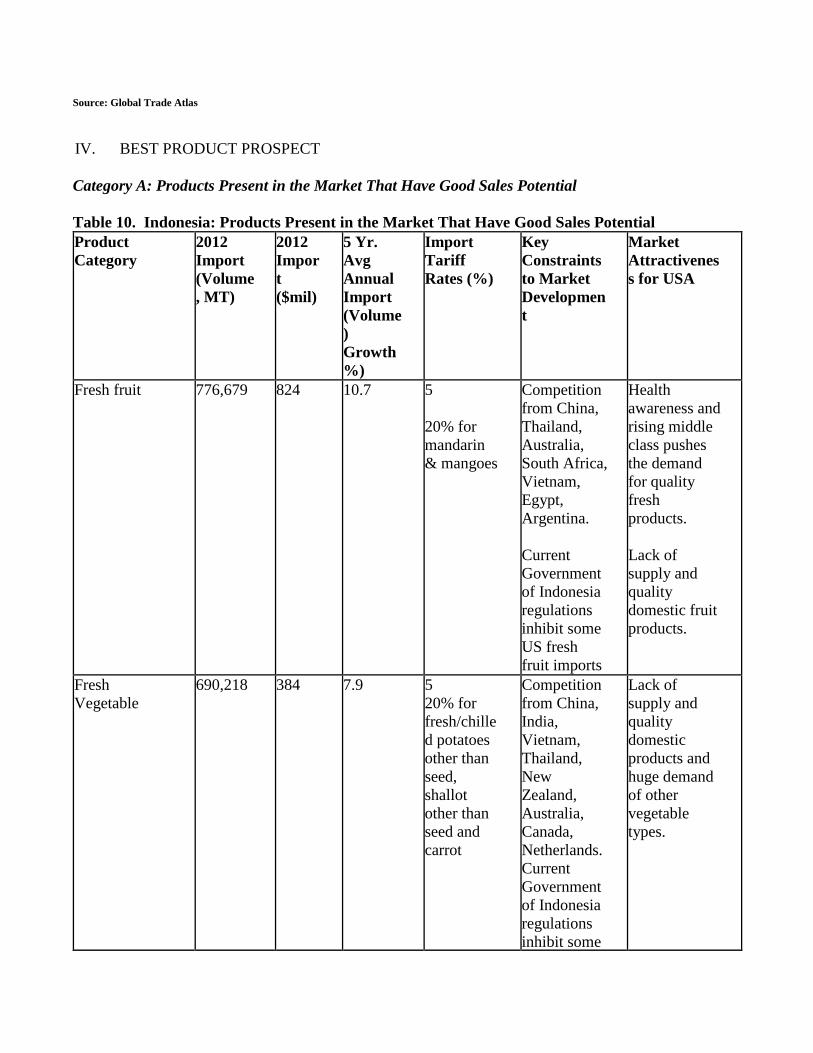
Source: Global Trade Atlas
IV. BEST PRODUCT PROSPECT
Category A: Products Present in the Market That Have Good Sales Potential
Table 10. Indonesia: Products Present in the Market That Have Good Sales Potential
Product
Category
2012
Import
(Volume
, MT)
2012
Impor
t
($mil)
5 Yr.
Avg
Annual
Import
(Volume
)
Growth
%)
Import
Tariff
Rates (%)
Key
Constraints
to Market
Developmen
t
Market
Attractivenes
s for USA
Fresh fruit 776,679 824 10.7 5
20% for
mandarin
& mangoes
Competition
from China,
Thailand,
Australia,
South Africa,
Vietnam,
Egypt,
Argentina.
Current
Government
of Indonesia
regulations
inhibit some
US fresh
fruit imports
Health
awareness and
rising middle
class pushes
the demand
for quality
fresh
products.
Lack of
supply and
quality
domestic fruit
products.
Fresh
Vegetable
690,218 384 7.9 5
20% for
fresh/chille
d potatoes
other than
seed,
shallot
other than
seed and
carrot
Competition
from China,
India,
Vietnam,
Thailand,
New
Zealand,
Australia,
Canada,
Netherlands.
Current
Government
of Indonesia
regulations
inhibit some
Lack of
supply and
quality
domestic
products and
huge demand
of other
vegetable
types.

US fresh
fruit imports
Processed fruit
& Vegetables
126,514 154 13.1 Mostly 5 Competition
from China,
Thailand,
Netherlands,
New
Zealand,
Canada,
India,
Myanmar,
Germany,
Malaysia,
Vietnam,
Singapore,
Belgium
Lack of
processed
fruit and
vegetable
produced
locally.
Malt, mixes &
dough
44,429 145.6 21.1 10% for
mixes and
dough
Price
concerns
Bakery
industry is
growing
Fruit &
vegetable
Juices
14,008 29.7 10.8 Mostly 10 Competition
from Brazil,
Brazil,
Thailand,
China,
Austria,
Australia,
and Taiwan.
Procedure to
obtain an
Import
Registration
Number
(ML) is
complicated
Health
awareness and
rising middle
class drive
demand for
fruit based
products.
Butter 14,177 60.5 2.1 5 Competition
from New
Zealand,
Australia and
several
European
countries
Growing
bakery sector
to include
cookies
production
Cheese 12,325 56.8 23.2 5 Competition
from New
Zealand and
Australia
Cheese
Growing
western style
and traditional
food using
cheese

manufacturer
must be
approved by
GOI before it
can be
exported
Breakfast
Cereals/Pancak
e Mix
6,554 19.4 1.1 5 Competition
from
Philippines,
China,
Malaysia
Procedure to
obtain an
Import
Registration
Number
(ML) is
complicated
Health
awareness and
rising middle
class and life
style drive
demand for
healthy,
western and
convenient
food
products.
Tree nuts
4,016
12.6 6.4 5 Price
concern
Snacking is
very popular
in Indonesian
culture
Bakery sector
is growing
and use tree
nuts as one of
the ingredient. Source: Global Trade Atlas
Category B: Products Not Present in Significant Quantities but That Have Good Sales
There are good opportunities for sales of some U.S. high-value items. Many of these are not yet in the
market in significant quantities. They include alcoholic beverages (beer and wine), egg yolks,
dehydrated & mashed potato, specialty fruits, and certain types of berries. Challenges to entering these
markets include a lack of consumer knowledge, (dehydrated & mashed potato) availability (specialty
fruits), and complicated import and distribution procedures for alcoholic beverages and egg yolk
products.
In the past few years, local wine makers have begun producing wine from local grapes and imported
Australian grape must to avoid imported alcoholic beverage taxes. These wines are readily available
and affordable.
Category C: Products Not Present because They Face Significant Barriers
Indonesia does not produce enough beef and there is little production of high quality beef locally.

Quotas on meat imports (lifted in late 2013), have hampered beef imports to Indonesia. While the
market is currently open without quota, local importers are taking a wait and see approach to determine
if the no-quota policy is sustained.
Chicken parts, poultry processed products and fresh potatoes have a potential market in Indonesia.
However, GOI regulations prevent U.S. suppliers from serving the market.
Table 11. Indonesia: Products Not Present in Significant Quantities Due to a Significant Barrier,
but with Good Sales.
Product
Category
2012
Import
(Volu
me,
MT)
2012
Impo
rt
($mil
)
2012
Import
from
US
($mil)
5Yr.
Avg
Annual
Import
(Volu
me)
Growt
h %)
Import
Tariff
Rates
(%)
Key
Constrain
ts to
Market
Developm
ent
Market
Attractive
ness for
USA
Red Meats,
Fresh/Chilled/Fr
ozen
41,857 165.8 19.3
(bonel
ess
frozen
meat)
-4.8 5 Competiti
on from
Australia
and New
Zealand
GOI
mandated
reference
price
system
inhibits
meat
imports
Lack of
domestic
supply
Wine & Beer N/A 3.3 0.3
(wine
of fresh
grape)
N/A Specific
tariff,
IDR
14,000
and IDR
55,000/li
ter
Competiti
on from
Australia,
France,
Portugal,
Italy,
Chile
Governme
nt of
Indonesia
set a
quota.
Regulation
s inhibit
No
domestic
wine supply
and limited
domestic
beer supply

alcohol
imports
Poultry Meat 439 1.2* 4.3 **
(poultr
y
prepare
d
meals,
frozen
turkey,
prepare
d
/preserv
e
chicken
meat)
-33.1 20 % for
chicken
wing
GOI does
not
allowed
chicken
imports
(whole &
parts).
GOI
determine
the export
allocation
of other
poultry
products
per
semester
Domestic
chicken
prices are
high and no
turkey is
produced
locally
Note: * Global Trade Atlas and ** BICO data
V. POST CONTACT AND FURTHER INFORMATION
The Foreign Agricultural Service (FAS), U.S. Embassy Jakarta, maintains up-to-date information
covering food and agricultural import opportunities in Indonesia and would be pleased to assist in
facilitating U.S. exports and entry to the Indonesian market. Questions or comments regarding this
report should be directed to FAS Jakarta at the following addresses:
International Post: Foreign Agricultural Service
U.S. Embassy Jakarta
Sarana Jaya Building, 8th
Floor
Jl. Budi Kemuliaan I No. 1
Jakarta 10110
Tel: +62 21 3435-9161
Fax: +62 21 3435-9920
e-mail:[email protected]
U.S. mail: Foreign Agricultural Service FAS
Unit 8200 Box 437
DPO, AP 96520-0437
For more information on exporting U.S. agricultural products to Indonesia and other countries, please
visit the Foreign Agricultural Service’s Home Page: http://usdaindonesia.org and
http://www.fas.usda.gov

VI. OTHER RELEVANT REPORTS
1. Ministries of Agriculture and Trade Revise Horticulture Import Regulation
2. The GOI’S New Regulation on Meat and Meat Products Imports
3. Revised GAIN Report ID 1345
4. Indonesia’s New Farmer Empowerment and Protection Law Introduce New Trade Barrier
5. Unofficial Translation of Ministry of Agriculture Decree No 4390/2013
6. Ministry of Agriculture and Trade Revised Regulations on Imported Horticulture Products
7. Ministry of Agriculture and Trade Revised Regulation on Imported Meat
8. FAIRS Export Certificate Report
9. FAIRS Country Report
10. Indonesia Extends Import Requirements on Food and Beverage Products
11. Indonesia Officially Recognize Safety Control System of United State’s Fresh Food of Plant
Origin
12. Phytosanitary Requirement for Fresh Bulb
13. Exporter Guide Update
14. U.S. Fresh Foods and Vegetables Retain Access to the Port of Jakarta
15. New Indonesian Import Duties on Alcoholic Beverages
16. Mandatory Labeling of Imported Food and Beverage Products
17. New Import Duty on Beverage content certain Ethyl Alcohol
18. New Regulation on Alcoholic Beverages Excise Tax
Table 12. Indonesia: Exchange Rate (Rp./1US $) on Month Ending Basis Year Jan Feb Mar Apr May Jun Jul Aug Sep Oct Nov Dec Avg 2006 9,369 9,280 9,117 8,826 9,212 9,353 9,124 9,119 9,205 9,110 9,165 9,020 9,158 2007 9,090 9,160 9,118 9,083 8,828 9,054 9,186 9,410 9,137 9,379 9,376 9,419 9,187 2008 9,304 9,051 9,199 9,234 9,318 9,225 9,118 9,153 9,378 10,995 12,151 10,950 9,756 2009 11,330 11,975 11,575 10,713 10,340 10,225 9,920 10,060 9,681 9,545 9,480 9,400 10,354 2010 9,365 9,335 9,070 9,012 9,180 9,038 8,952 9,041 8,952 8,928 9,013 9,014 9,075 2011 9,057 8,823 8,709 8,574 8,537 8,597 8,508 8,578 8,823 8,835 9,055 9,170 8,772 2012 9,000 9,158 9,188 9,180 9,565 9,468 9,485 9,573 9,588 9,605 9,605 9,670 9,424 2013 9,680 9,713 9,745 9,722 9,811 9,929 10,277 10,936 11,532 11,076 11,997 11,946 10,542
Source: National Statistical Agency (BPS-Badan Pusat Statistik) and Business Indonesia Daily Newspaper