Embed Size (px)
Citation preview
54ECBMonthly BulletinDecember 2014
box 3
inDirect effects of oil price Developments on euro area inflation
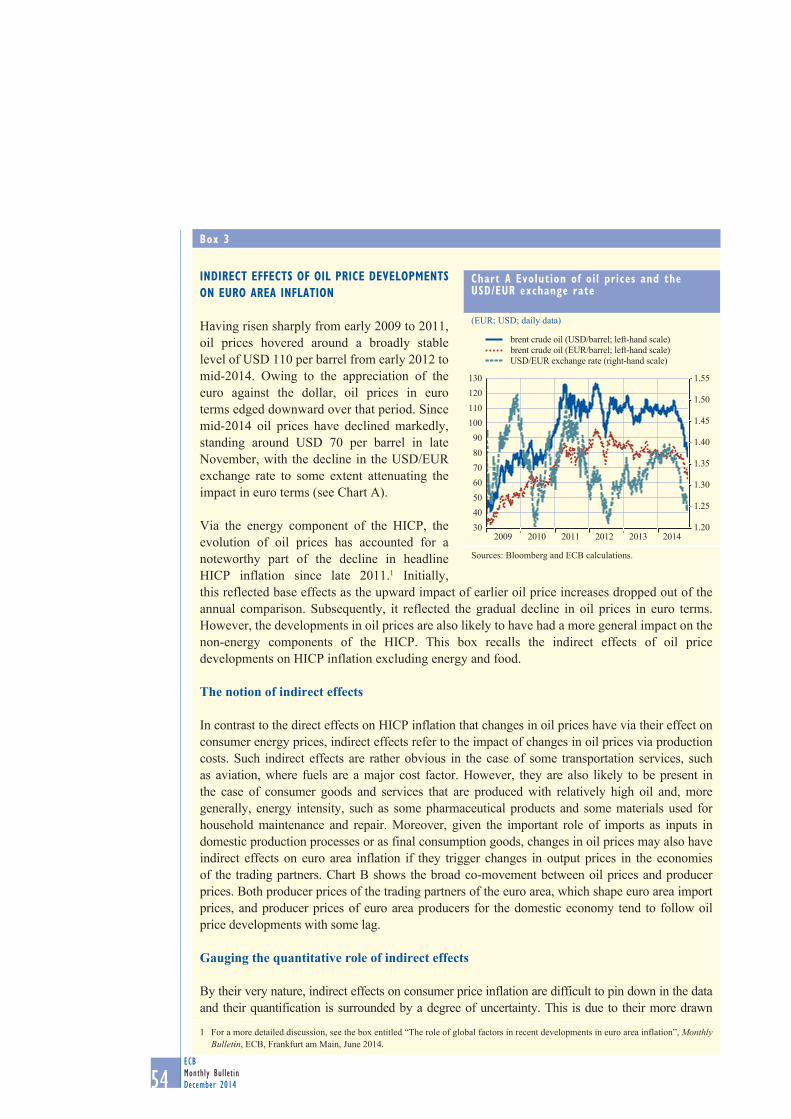
Having risen sharply from early 2009 to 2011, oil prices hovered around a broadly stable level of USD 110 per barrel from early 2012 to mid-2014. Owing to the appreciation of the euro against the dollar, oil prices in euro terms edged downward over that period. Since mid-2014 oil prices have declined markedly, standing around USD 70 per barrel in late November, with the decline in the USD/EUR exchange rate to some extent attenuating the impact in euro terms (see Chart A).
Via the energy component of the HICP, the evolution of oil prices has accounted for a noteworthy part of the decline in headline HICP inflation since late 2011.1 Initially, this reflected base effects as the upward impact of earlier oil price increases dropped out of the annual comparison. Subsequently, it reflected the gradual decline in oil prices in euro terms. However, the developments in oil prices are also likely to have had a more general impact on the non-energy components of the HICP. This box recalls the indirect effects of oil price developments on HICP inflation excluding energy and food.
The notion of indirect effects
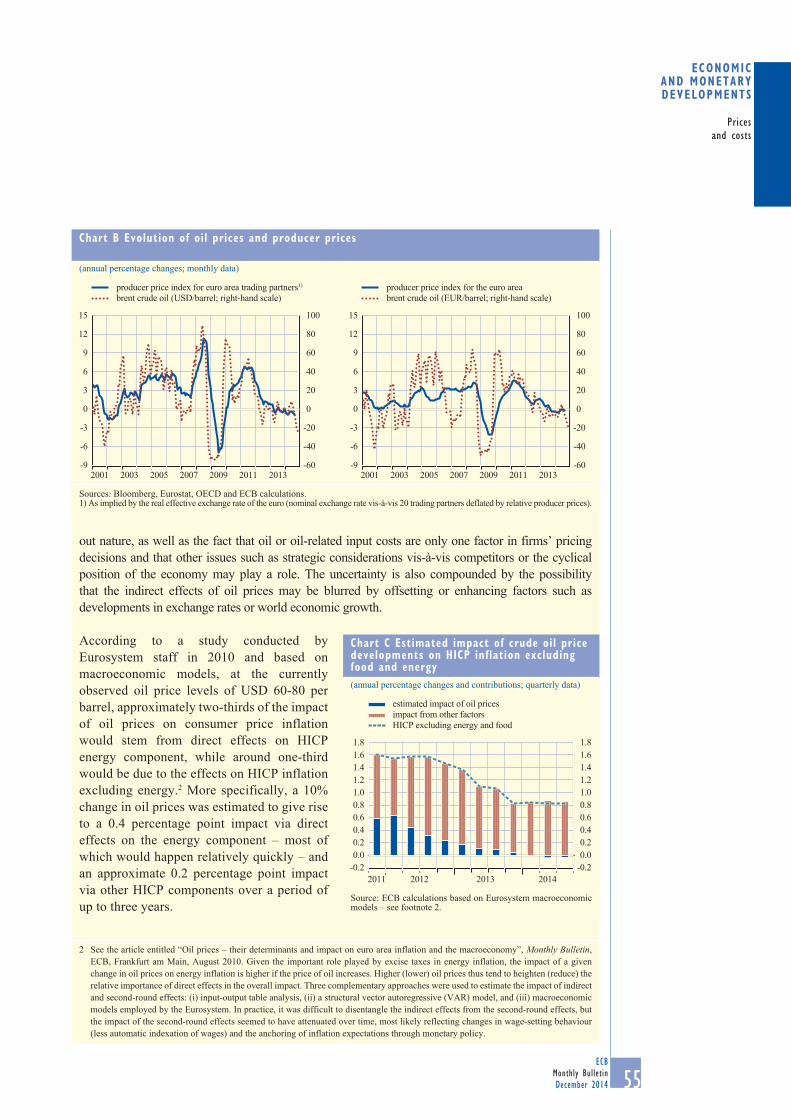
In contrast to the direct effects on HICP inflation that changes in oil prices have via their effect on consumer energy prices, indirect effects refer to the impact of changes in oil prices via production costs. Such indirect effects are rather obvious in the case of some transportation services, such as aviation, where fuels are a major cost factor. However, they are also likely to be present in the case of consumer goods and services that are produced with relatively high oil and, more generally, energy intensity, such as some pharmaceutical products and some materials used for household maintenance and repair. Moreover, given the important role of imports as inputs in domestic production processes or as final consumption goods, changes in oil prices may also have indirect effects on euro area inflation if they trigger changes in output prices in the economies of the trading partners. Chart B shows the broad co-movement between oil prices and producer prices. Both producer prices of the trading partners of the euro area, which shape euro area import prices, and producer prices of euro area producers for the domestic economy tend to follow oil price developments with some lag.
Gauging the quantitative role of indirect effects
By their very nature, indirect effects on consumer price inflation are difficult to pin down in the data and their quantification is surrounded by a degree of uncertainty. This is due to their more drawn
1 For a more detailed discussion, see the box entitled “The role of global factors in recent developments in euro area inflation”, Monthly Bulletin, ECB, Frankfurt am Main, June 2014.
chart a evolution of oil prices and the usD/eur exchange rate
(EUR; USD; daily data)
1.20
1.25
1.30
1.35
1.40
1.45
1.50
1.55
30 40 50 60 70 80 90
100 110 120 130
2009 2010 2011 2012 2013 2014
brent crude oil (USD/barrel; left-hand scale) brent crude oil (EUR/barrel; left-hand scale) USD/EUR exchange rate (right-hand scale)
Sources: Bloomberg and ECB calculations.
55ECB
Monthly BulletinDecember 2014
Pricesand costs
Economic and monEtary dEvElopmEnts
out nature, as well as the fact that oil or oil-related input costs are only one factor in firms’ pricing decisions and that other issues such as strategic considerations vis-à-vis competitors or the cyclical position of the economy may play a role. The uncertainty is also compounded by the possibility that the indirect effects of oil prices may be blurred by offsetting or enhancing factors such as developments in exchange rates or world economic growth.
According to a study conducted by Eurosystem staff in 2010 and based on macroeconomic models, at the currently observed oil price levels of USD 60-80 per barrel, approximately two-thirds of the impact of oil prices on consumer price inflation would stem from direct effects on HICP energy component, while around one-third would be due to the effects on HICP inflation excluding energy.2 More specifically, a 10% change in oil prices was estimated to give rise to a 0.4 percentage point impact via direct effects on the energy component – most of which would happen relatively quickly – and an approximate 0.2 percentage point impact via other HICP components over a period of up to three years.
2 See the article entitled “Oil prices – their determinants and impact on euro area inflation and the macroeconomy”, Monthly Bulletin, ECB, Frankfurt am Main, August 2010. Given the important role played by excise taxes in energy inflation, the impact of a given change in oil prices on energy inflation is higher if the price of oil increases. Higher (lower) oil prices thus tend to heighten (reduce) the relative importance of direct effects in the overall impact. Three complementary approaches were used to estimate the impact of indirect and second-round effects: (i) input-output table analysis, (ii) a structural vector autoregressive (VAR) model, and (iii) macroeconomic models employed by the Eurosystem. In practice, it was difficult to disentangle the indirect effects from the second-round effects, but the impact of the second-round effects seemed to have attenuated over time, most likely reflecting changes in wage-setting behaviour (less automatic indexation of wages) and the anchoring of inflation expectations through monetary policy.
chart c estimated impact of crude oil price developments on hicp inflation excluding food and energy(annual percentage changes and contributions; quarterly data)
-0.20.00.20.40.60.81.01.21.41.61.8
-0.20.00.20.40.60.81.01.21.41.61.8
2011 2012 2013 2014
impact from other factorsestimated impact of oil prices
HICP excluding energy and food
Source: ECB calculations based on Eurosystem macroeconomic models – see footnote 2.
chart b evolution of oil prices and producer prices
(annual percentage changes; monthly data)
-60
-40
-20
0
20
40
60
80
100
-9
-6
-3
0
3
6
9
12
15
2001 2003 2005 2007 2009 2011 2013
producer price index for euro area trading partners1)
brent crude oil (USD/barrel; right-hand scale)
-60
-40
-20
0
20
40
60
80
100
-9
-6
-3
0
3
6
9
12
15
producer price index for the euro areabrent crude oil (EUR/barrel; right-hand scale)
2001 2003 2005 2007 2009 2011 2013
Sources: Bloomberg, Eurostat, OECD and ECB calculations.1) As implied by the real effective exchange rate of the euro (nominal exchange rate vis-à-vis 20 trading partners deflated by relative producer prices).
56ECBMonthly BulletinDecember 2014
In this context, a counterfactual exercise based on such elasticities suggests that oil prices have accounted for approximately 0.6 percentage point of the 0.9 percentage point decline in HICP inflation excluding energy and food since the end of 2011 (see Chart C). This mostly reflects the unwinding of the upward impact associated with the rise in oil prices up to that point in time. As the impact in this exercise is estimated on the basis of the HICP excluding food and energy, it excludes the direct effects on the energy component.
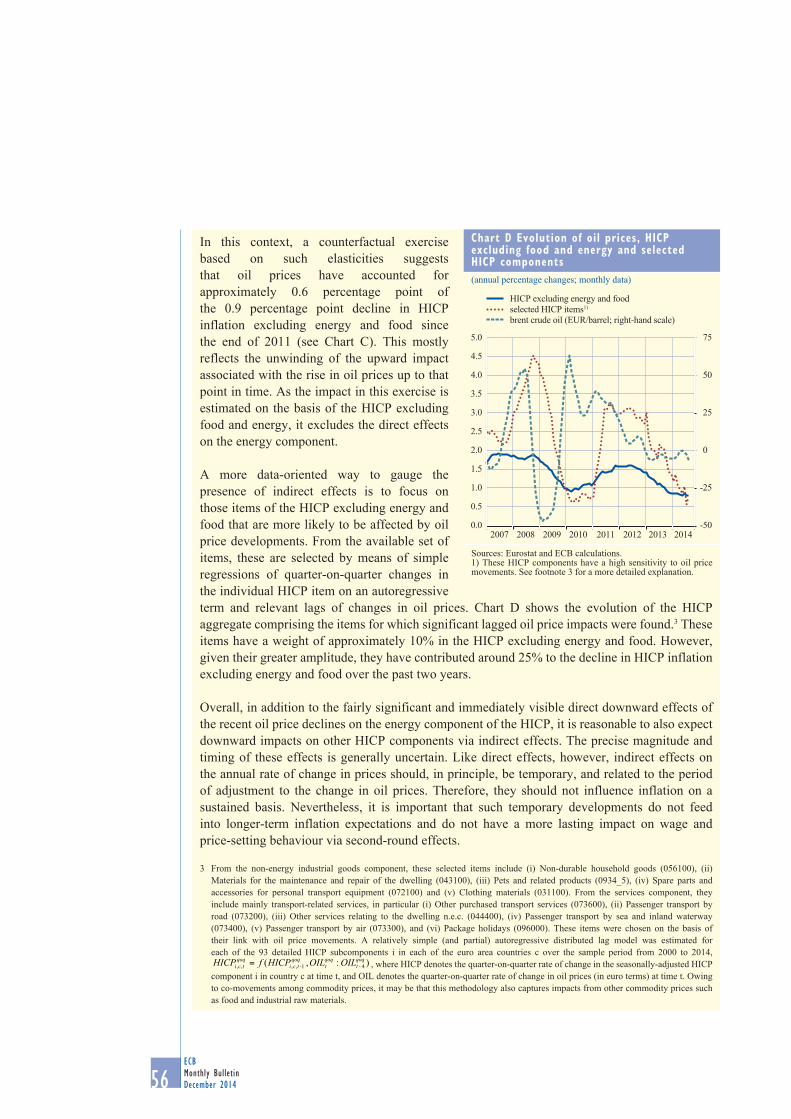
A more data-oriented way to gauge the presence of indirect effects is to focus on those items of the HICP excluding energy and food that are more likely to be affected by oil price developments. From the available set of items, these are selected by means of simple regressions of quarter-on-quarter changes in the individual HICP item on an autoregressive term and relevant lags of changes in oil prices. Chart D shows the evolution of the HICP aggregate comprising the items for which significant lagged oil price impacts were found.3 These items have a weight of approximately 10% in the HICP excluding energy and food. However, given their greater amplitude, they have contributed around 25% to the decline in HICP inflation excluding energy and food over the past two years.
Overall, in addition to the fairly significant and immediately visible direct downward effects of the recent oil price declines on the energy component of the HICP, it is reasonable to also expect downward impacts on other HICP components via indirect effects. The precise magnitude and timing of these effects is generally uncertain. Like direct effects, however, indirect effects on the annual rate of change in prices should, in principle, be temporary, and related to the period of adjustment to the change in oil prices. Therefore, they should not influence inflation on a sustained basis. Nevertheless, it is important that such temporary developments do not feed into longer-term inflation expectations and do not have a more lasting impact on wage and price-setting behaviour via second-round effects.
3 From the non-energy industrial goods component, these selected items include (i) Non-durable household goods (056100), (ii) Materials for the maintenance and repair of the dwelling (043100), (iii) Pets and related products (0934_5), (iv) Spare parts and accessories for personal transport equipment (072100) and (v) Clothing materials (031100). From the services component, they include mainly transport-related services, in particular (i) Other purchased transport services (073600), (ii) Passenger transport by road (073200), (iii) Other services relating to the dwelling n.e.c. (044400), (iv) Passenger transport by sea and inland waterway (073400), (v) Passenger transport by air (073300), and (vi) Package holidays (096000). These items were chosen on the basis of their link with oil price movements. A relatively simple (and partial) autoregressive distributed lag model was estimated for each of the 93 detailed HICP subcomponents i in each of the euro area countries c over the sample period from 2000 to 2014,
):,( 41,,,,qoqt
qoqt
qoqtci
qoqtci OILOILHICPfHICP --= , where HICP denotes the quarter-on-quarter rate of change in the seasonally-adjusted HICP
component i in country c at time t, and OIL denotes the quarter-on-quarter rate of change in oil prices (in euro terms) at time t. Owing to co-movements among commodity prices, it may be that this methodology also captures impacts from other commodity prices such as food and industrial raw materials.
chart D evolution of oil prices, hicp excluding food and energy and selected hicp components(annual percentage changes; monthly data)
-50
-25
0
25
50
75
0.0
0.5
1.0
1.5
2.0
2.5
3.0
3.5
4.0
4.5
5.0
2007 2008 2009 2010 2011 2012 2013 2014
HICP excluding energy and foodselected HICP items1)
brent crude oil (EUR/barrel; right-hand scale)
Sources: Eurostat and ECB calculations.1) These HICP components have a high sensitivity to oil price movements. See footnote 3 for a more detailed explanation.