Embed Size (px)
Citation preview
Indiana Lead Sampling Program for Public Schools
January 2019

Acknowledgements The IFA would like to acknowledge: Indiana University, 120WaterAudit, Indiana Department of Environmental Management, Indiana Public Schools, Indiana Association of Public School Superintendents, and the Indiana Association of School Business Officials.
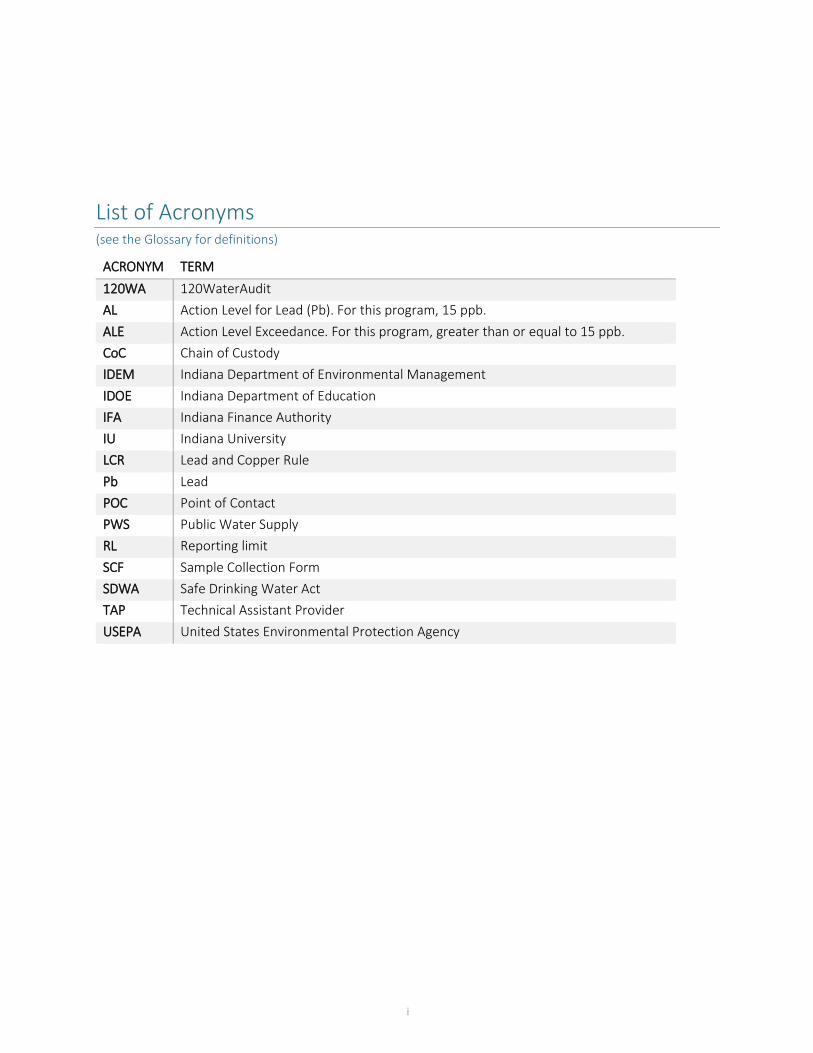
List of Acronyms (see the Glossary for definitions)
ACRONYM TERM 120WA 120WaterAudit AL Action Level for Lead (Pb). For this program, 15 ppb. ALE Action Level Exceedance. For this program, greater than or equal to 15 ppb. CoC Chain of Custody IDEM Indiana Department of Environmental Management IDOE Indiana Department of Education IFA Indiana Finance Authority IU Indiana University LCR Lead and Copper Rule Pb Lead POC Point of Contact PWS Public Water Supply RL Reporting limit SCF Sample Collection Form SDWA Safe Drinking Water Act TAP Technical Assistant Provider USEPA United States Environmental Protection Agency
i

This page left blank intentionally for double-sided printing pagination.
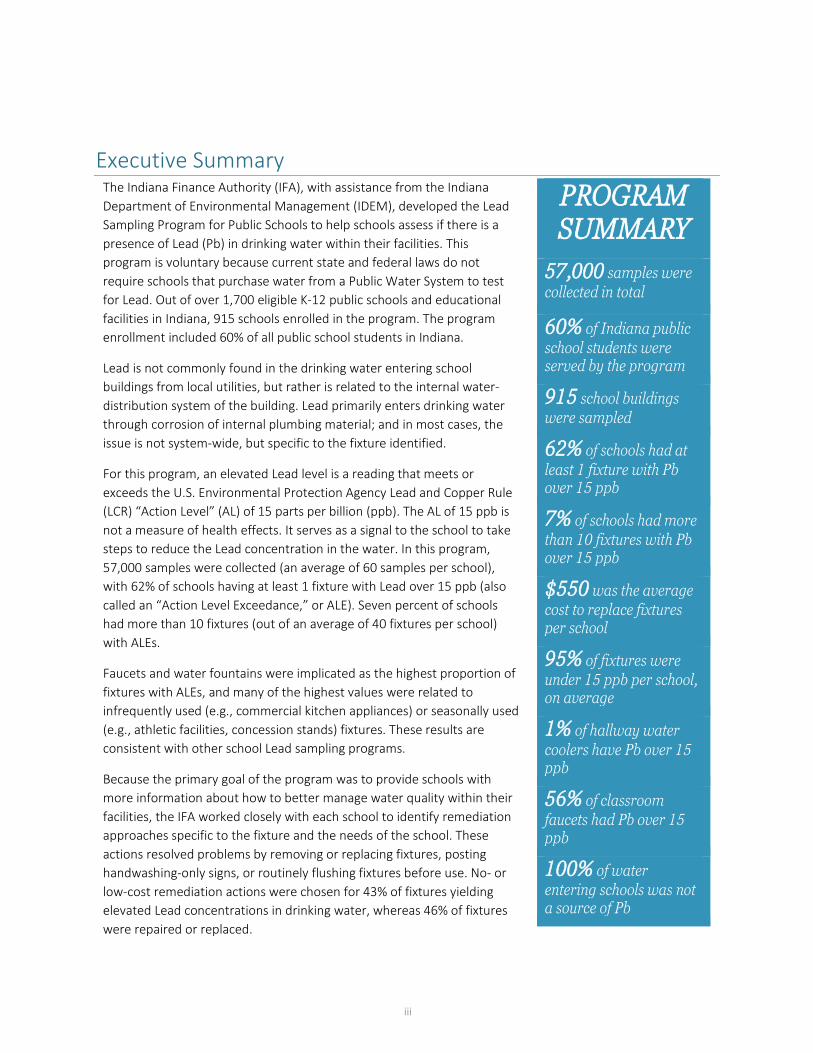
Executive Summary The Indiana Finance Authority (IFA), with assistance from the Indiana Department of Environmental Management (IDEM), developed the Lead Sampling Program for Public Schools to help schools assess if there is a presence of Lead (Pb) in drinking water within their facilities. This program is voluntary because current state and federal laws do not require schools that purchase water from a Public Water System to test for Lead. Out of over 1,700 eligible K-12 public schools and educational facilities in Indiana, 915 schools enrolled in the program. The program enrollment included 60% of all public school students in Indiana.
Lead is not commonly found in the drinking water entering school buildings from local utilities, but rather is related to the internal water-distribution system of the building. Lead primarily enters drinking water through corrosion of internal plumbing material; and in most cases, the issue is not system-wide, but specific to the fixture identified.
For this program, an elevated Lead level is a reading that meets or exceeds the U.S. Environmental Protection Agency Lead and Copper Rule (LCR) “Action Level” (AL) of 15 parts per billion (ppb). The AL of 15 ppb is not a measure of health effects. It serves as a signal to the school to take steps to reduce the Lead concentration in the water. In this program, 57,000 samples were collected (an average of 60 samples per school), with 62% of schools having at least 1 fixture with Lead over 15 ppb (also called an “Action Level Exceedance,” or ALE). Seven percent of schools had more than 10 fixtures (out of an average of 40 fixtures per school) with ALEs.
Faucets and water fountains were implicated as the highest proportion of fixtures with ALEs, and many of the highest values were related to infrequently used (e.g., commercial kitchen appliances) or seasonally used (e.g., athletic facilities, concession stands) fixtures. These results are consistent with other school Lead sampling programs.
Because the primary goal of the program was to provide schools with more information about how to better manage water quality within their facilities, the IFA worked closely with each school to identify remediation approaches specific to the fixture and the needs of the school. These actions resolved problems by removing or replacing fixtures, posting handwashing-only signs, or routinely flushing fixtures before use. No- or low-cost remediation actions were chosen for 43% of fixtures yielding elevated Lead concentrations in drinking water, whereas 46% of fixtures were repaired or replaced.
PROGRAM SUMMARY
57,000 samples werecollected in total
60% of Indiana publicschool students were served by the program
915 school buildingswere sampled
62% of schools had atleast 1 fixture with Pb over 15 ppb
7% of schools had morethan 10 fixtures with Pb over 15 ppb
$550 was the averagecost to replace fixtures per school
95% of fixtures wereunder 15 ppb per school, on average
1% of hallway watercoolers have Pb over 15 ppb
56% of classroomfaucets had Pb over 15 ppb
100% of waterentering schools was not a source of Pb
iii

This page left blank intentionally for double-sided printing pagination.

Table of Contents List of Acronyms ..................................................................................................................................................... i
Executive Summary .............................................................................................................................................. iii
List of Figures ....................................................................................................................................................... vi
List of Tables ......................................................................................................................................................... vi
Background ........................................................................................................................................................... 1
Program Overview ................................................................................................................................................. 2
Partner Roles ..................................................................................................................................................... 3
Program Costs ................................................................................................................................................... 4
Program Enrollment .......................................................................................................................................... 4
Methods ................................................................................................................................................................ 8
Sampling Plan .................................................................................................................................................... 8
Sample Collection .............................................................................................................................................. 9
Results ................................................................................................................................................................. 10
Results by Sample Draw Type .......................................................................................................................... 12
Results by Fixture Type.................................................................................................................................... 12
Results by Fixture Location .............................................................................................................................. 14
Remediation ........................................................................................................................................................ 15
Remediation Strategies ................................................................................................................................... 15
Fixture Removal........................................................................................................................................... 17
Fixture Replacement ................................................................................................................................... 17
Placement of “Handwashing Only” Signs .................................................................................................... 17
Flushing for One Minute Prior to Every Use (for kitchen kettles only) ........................................................ 17
Other ........................................................................................................................................................... 17
Summary of Accepted Remediation Types ...................................................................................................... 17
Remediation Time and Cost ............................................................................................................................ 18
Recommendations .............................................................................................................................................. 19
Clean Fixtures .................................................................................................................................................. 19
Change Water Filters ....................................................................................................................................... 19
Investigate Upstream Lead Sources ................................................................................................................ 19
Re-Test Water ................................................................................................................................................. 19
Conclusions ......................................................................................................................................................... 20
References .......................................................................................................................................................... 20
Glossary ............................................................................................................................................................... 22
v
List of Figures Figure 1. Program tasks, timeline for the 2017-2018 Indiana Lead Sampling Program for Public Schools. ........... 3
Figure 2. Public school student population by grade level .................................................................................... 5
Figure 3. Public school enrollment in the Indiana Lead Sampling Program for Public Schools by grade level. ...... 5
Figure 4. Map showing the proportion of public schools enrolled by county ....................................................... 6
Figure 5. Map showing the spatial distribution of public schools participating in water testing in Indiana. ......... 7
Figure 6. Photo showing a Technical Assistance Provider (TAP) sampling drinking water .................................... 8
Figure 7. Figure showing the distribution of sample results for Total Lead (Pb) ................................................. 11
Figure 8. Total number of impaired fixtures per school requiring a remediation action ..................................... 11
Figure 9. Figure showing the percent of Lead (Pb) ALE concentrations by sample draw type. ........................... 12
Figure 10. Figure showing Pb ALEs by fixture type .............................................................................................. 14
Figure 11. Classrooms and kitchens comprised 65% of the locations with Pb ALEs ............................................ 15
Figure 12. Diagram showing the many possible sources of Lead (Pb) in a water fountain .................................. 16
Figure 13. Photo showing a water cooler strainer clogged with Leaded debris (Elfland, 2010) .......................... 16
Figure 14. Photo showing a clogged faucet aerator. ........................................................................................... 16
Figure 15. Remediation strategies applied to fixture types ................................................................................. 18
List of Tables Table 1. Enrollment status for the Indiana Lead Sampling Program for Public Schools......................................... 4
Table 2. Table showing the number of samples collected from each fixture type, Pb ALEs ................................ 13
Table 3. Table summarizing the accepted remediation strategies for problem fixtures ..................................... 17
Table 4. Average time and cost data for a subset of remediated fixtures ........................................................... 18
vi
Background In 1991, the United States Environmental Protection Agency (USEPA) published the Lead and Copper Rule (LCR) to minimize the corrosivity and amount of Lead (Pb) and Copper (Cu) in water supplied by public water systems (PWS). Lead is a concern in drinking water, especially for vulnerable populations such as school-aged children, because of the risk of exposure to Pb that can cause damage to cells and organs, and extended exposure periods can also result in developmental problems in young children.
Lead is not commonly found in the drinking water entering school buildings from local utilities, but rather is related to the internal water-distribution system of the building. Lead primarily enters drinking water through corrosion of internal plumbing material and is commonly found throughout components of the water infrastructure such as the service connection to the building, piping, solder, as well as fixtures that contain Lead components or trap Lead particulate matter. In most cases, the issue is not system-wide, but specific to the fixture identified.
The LCR requires public water systems to test for Lead in drinking water at customer taps; however, the number of samples collected in a building is dependent on the amount of people served, leaving many fixtures untested. Because water infrastructure components can vary within a single system and multiple drinking water fixtures are located throughout that system, the LCR sampling approach is appropriate for characterizing the safety of the source water, but likely insufficient for identifying all drinking water fixtures that could contribute Lead into drinking water within a building, such as a school. To that end, the USEPA has produced guidance for conducting voluntary building-wide drinking water testing for Lead to identify fixtures that might benefit from remediation measures to limit the exposure of children to ingestion of Lead in schools. That technical guidance document is known as the 3Ts for Reducing Lead in Drinking Water in Schools (USEPA, 2006). The 3Ts refer to: (1) Training, (2) Testing, and (3) Taking action.
The 3Ts website can be accessed via this link: https://www.epa.gov/ground-water-and-drinking-water/3ts-reducing-lead-drinking-water-toolkit
The Indiana Finance Authority (IFA), with assistance from the Indiana Department of Environmental Management (IDEM), developed the Lead Sampling Program for Public Schools to help schools assess if there is a presence of Lead in drinking water within their facilities. This program is voluntary because current state and federal laws do not require schools that purchase water from a municipal PWS to test for Lead. The protocols established for the Indiana Lead Sampling Program for Public Schools were based on the USEPA 3Ts guidance.
1
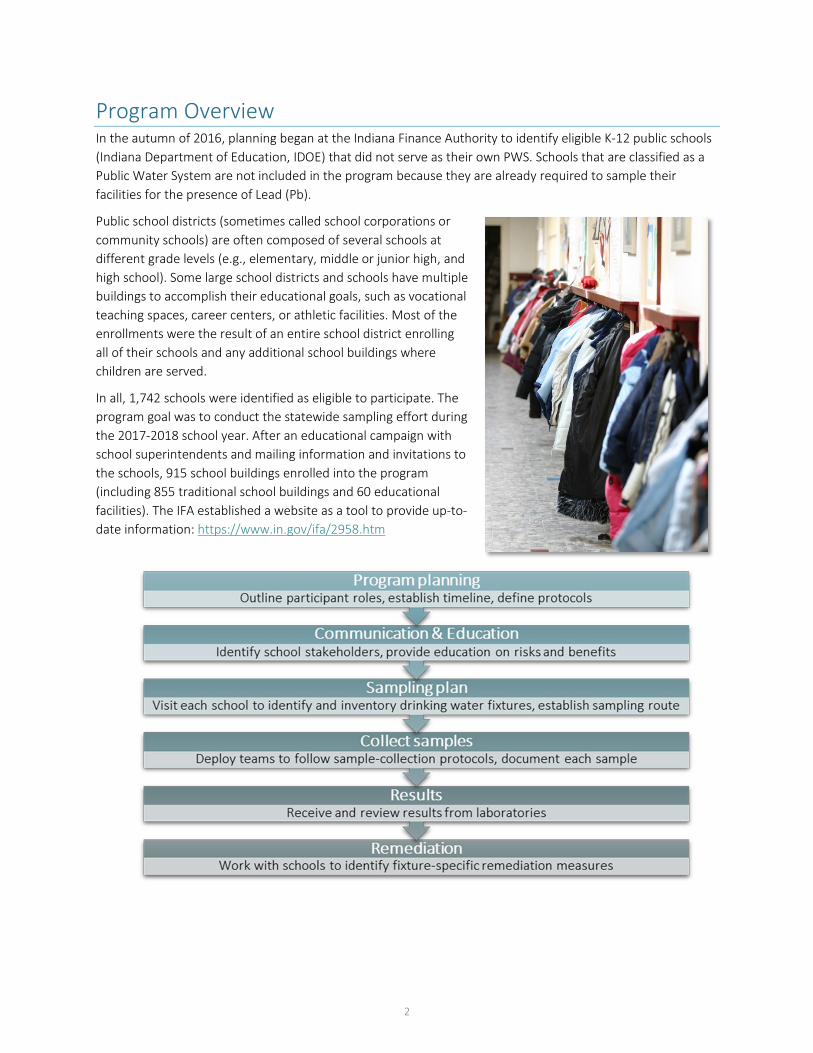
Program Overview In the autumn of 2016, planning began at the Indiana Finance Authority to identify eligible K-12 public schools (Indiana Department of Education, IDOE) that did not serve as their own PWS. Schools that are classified as a Public Water System are not included in the program because they are already required to sample their facilities for the presence of Lead (Pb).
Public school districts (sometimes called school corporations or community schools) are often composed of several schools at different grade levels (e.g., elementary, middle or junior high, and high school). Some large school districts and schools have multiple buildings to accomplish their educational goals, such as vocational teaching spaces, career centers, or athletic facilities. Most of the enrollments were the result of an entire school district enrolling all of their schools and any additional school buildings where children are served.
In all, 1,742 schools were identified as eligible to participate. The program goal was to conduct the statewide sampling effort during the 2017-2018 school year. After an educational campaign with school superintendents and mailing information and invitations to the schools, 915 school buildings enrolled into the program (including 855 traditional school buildings and 60 educational facilities). The IFA established a website as a tool to provide up-to-date information: https://www.in.gov/ifa/2958.htm
2
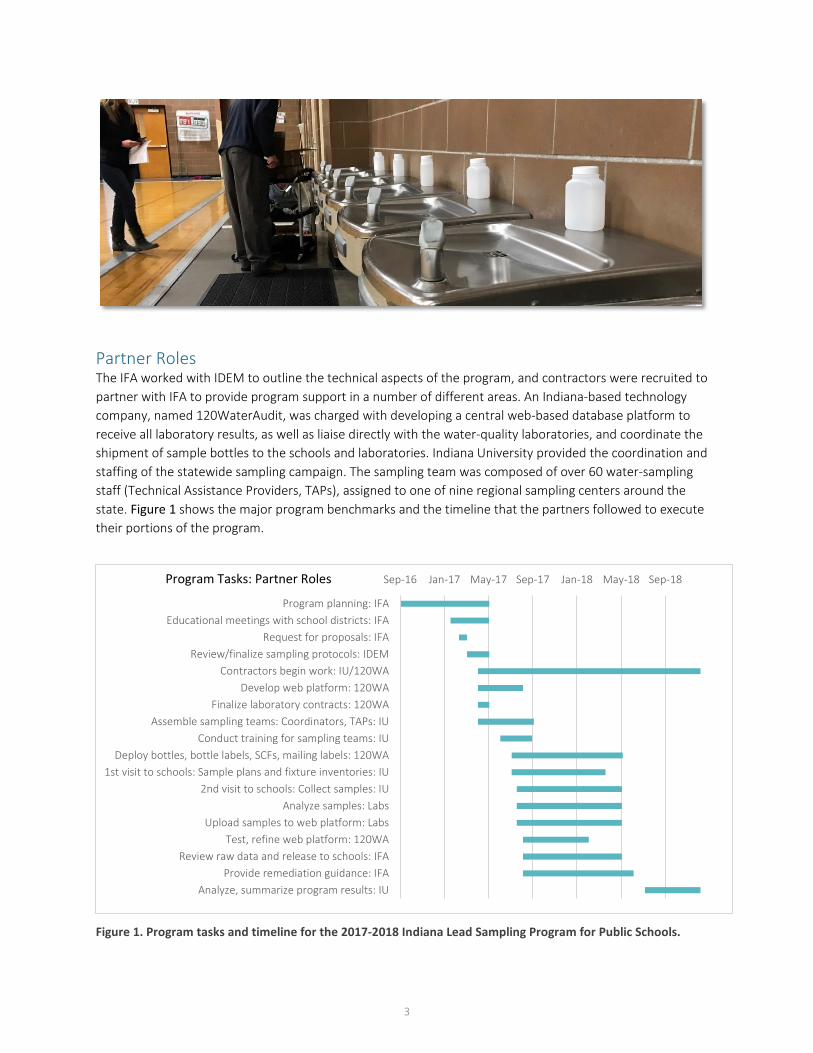
Partner Roles The IFA worked with IDEM to outline the technical aspects of the program, and contractors were recruited to partner with IFA to provide program support in a number of different areas. An Indiana-based technology company, named 120WaterAudit, was charged with developing a central web-based database platform to receive all laboratory results, as well as liaise directly with the water-quality laboratories, and coordinate the shipment of sample bottles to the schools and laboratories. Indiana University provided the coordination and staffing of the statewide sampling campaign. The sampling team was composed of over 60 water-sampling staff (Technical Assistance Providers, TAPs), assigned to one of nine regional sampling centers around the state. Figure 1 shows the major program benchmarks and the timeline that the partners followed to execute their portions of the program.
Figure 1. Program tasks and timeline for the 2017-2018 Indiana Lead Sampling Program for Public Schools.
Sep-16 Jan-17 May-17 Sep-17 Jan-18 May-18 Sep-18
Program planning: IFAEducational meetings with school districts: IFA
Request for proposals: IFAReview/finalize sampling protocols: IDEM
Contractors begin work: IU/120WADevelop web platform: 120WA
Finalize laboratory contracts: 120WAAssemble sampling teams: Coordinators, TAPs: IU
Conduct training for sampling teams: IUDeploy bottles, bottle labels, SCFs, mailing labels: 120WA
1st visit to schools: Sample plans and fixture inventories: IU2nd visit to schools: Collect samples: IU
Analyze samples: LabsUpload samples to web platform: Labs
Test, refine web platform: 120WAReview raw data and release to schools: IFA
Provide remediation guidance: IFAAnalyze, summarize program results: IU
Program Tasks: Partner Roles
3
Program Costs The IFA covered the cost to collect and analyze samples. Schools were responsible for any costs associated with remediation actions identified by sampling and subsequent confirmatory testing.
Total expenditures for the Program were approximately $4.4 million. Costs incurred included sample collection, laboratory analysis, project management, technical assistance, and the development of a web-based data platform. Funding was provided by the Indiana Finance Authority. In addition to these expenses, the IFA provided the equivalent of 3-4 full-time staff to support the Program.
Program Enrollment As mentioned above, over 1,700 schools in Indiana were eligible to enroll in the free voluntary testing program (Table 1); however, only 60% of schools (as defined by the student enrollment population) enrolled. Other schools did not enroll (e.g., Indianapolis, Hammond public schools) because they had already initiated self-funded school-wide testing, similar to the modified 3Ts protocols of the Indiana Lead Sampling Program for Public Schools.
Table 1. Enrollment status for the Indiana Lead Sampling Program for Public Schools. The table also presents the number of schools undertaking their own school-wide testing programs, and those public water system (PWS) schools testing their drinking water under the Lead and Copper Rule (LCR).
Enrollment Status Enrolled? Eligible? Testing? Number of
Schools
Enrolled
915
Self-testing
179
LCR Testing
184
Not Enrolled
678
4
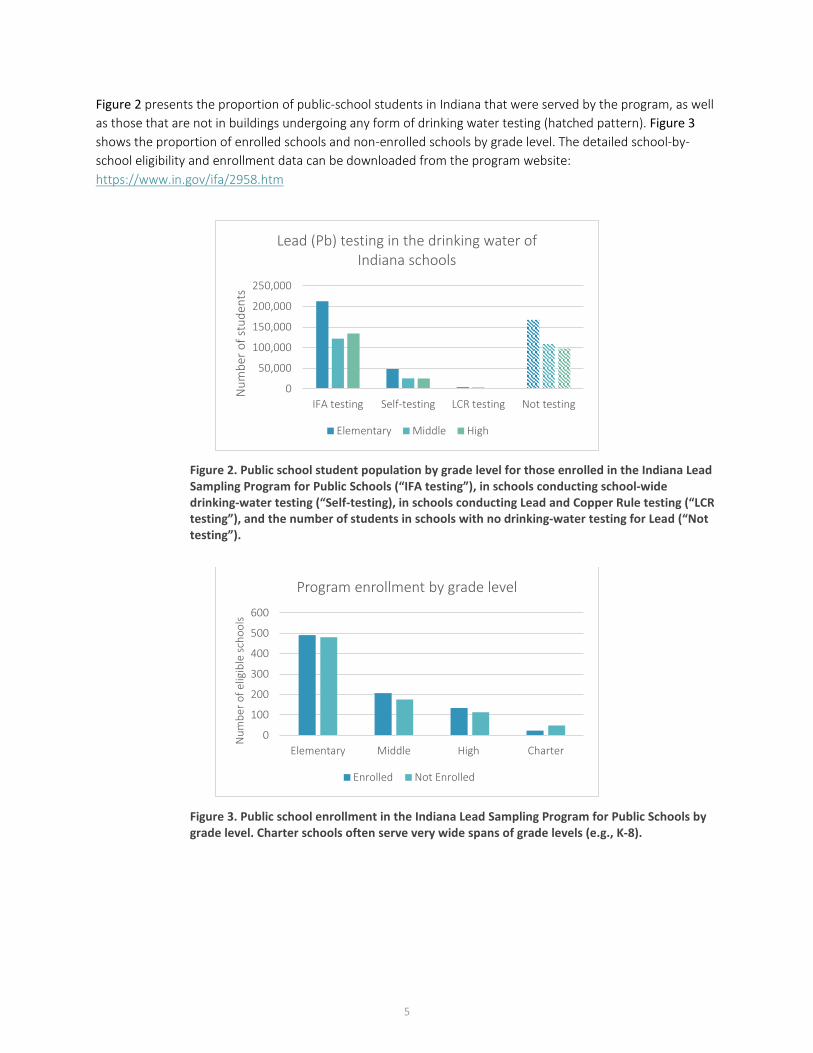
Figure 2 presents the proportion of public-school students in Indiana that were served by the program, as well as those that are not in buildings undergoing any form of drinking water testing (hatched pattern). Figure 3 shows the proportion of enrolled schools and non-enrolled schools by grade level. The detailed school-by-school eligibility and enrollment data can be downloaded from the program website: https://www.in.gov/ifa/2958.htm
Figure 2. Public school student population by grade level for those enrolled in the Indiana Lead Sampling Program for Public Schools (“IFA testing”), in schools conducting school-wide drinking-water testing (“Self-testing), in schools conducting Lead and Copper Rule testing (“LCR testing”), and the number of students in schools with no drinking-water testing for Lead (“Not testing”).
Figure 3. Public school enrollment in the Indiana Lead Sampling Program for Public Schools by grade level. Charter schools often serve very wide spans of grade levels (e.g., K-8).
0
50,000
100,000
150,000
200,000
250,000
IFA testing Self-testing LCR testing Not testing
Num
ber o
f stu
dent
sLead (Pb) testing in the drinking water of
Indiana schools
Elementary Middle High
0
100
200
300
400
500
600
Elementary Middle High Charter
Num
ber o
f elig
ible
scho
ols
Program enrollment by grade level
Enrolled Not Enrolled
5
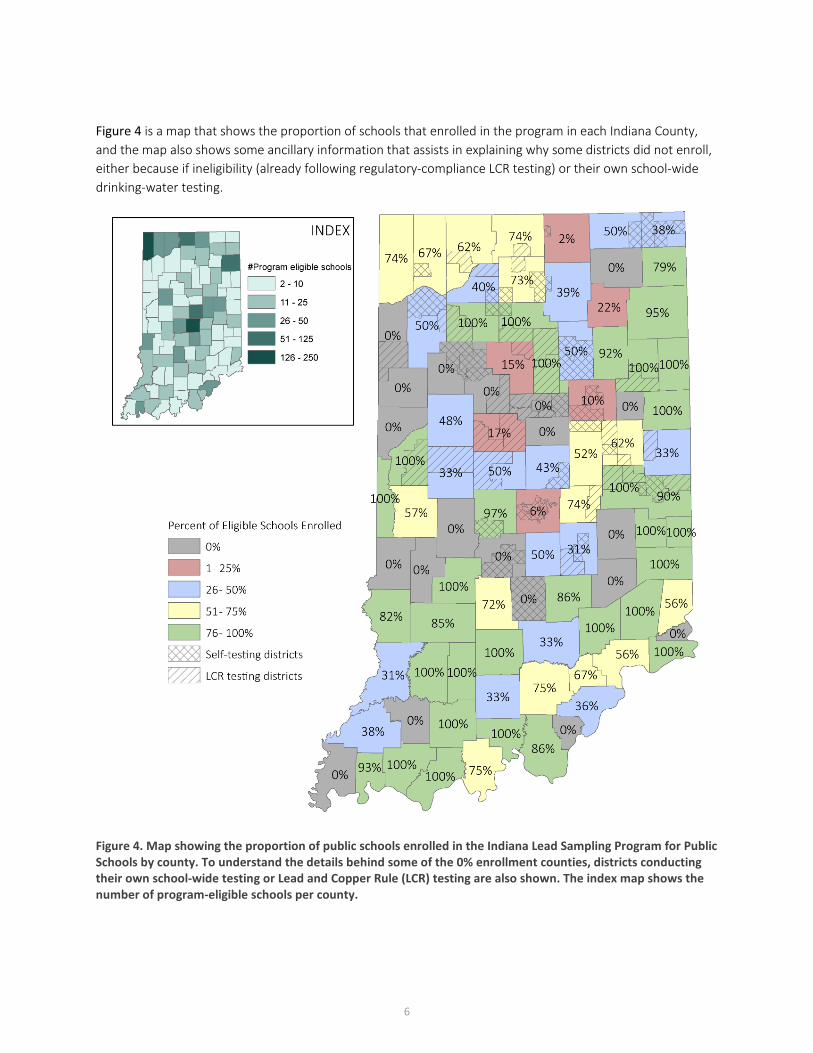
Figure 4 is a map that shows the proportion of schools that enrolled in the program in each Indiana County, and the map also shows some ancillary information that assists in explaining why some districts did not enroll, either because if ineligibility (already following regulatory-compliance LCR testing) or their own school-wide drinking-water testing.
Figure 4. Map showing the proportion of public schools enrolled in the Indiana Lead Sampling Program for Public Schools by county. To understand the details behind some of the 0% enrollment counties, districts conducting their own school-wide testing or Lead and Copper Rule (LCR) testing are also shown. The index map shows the number of program-eligible schools per county.
6
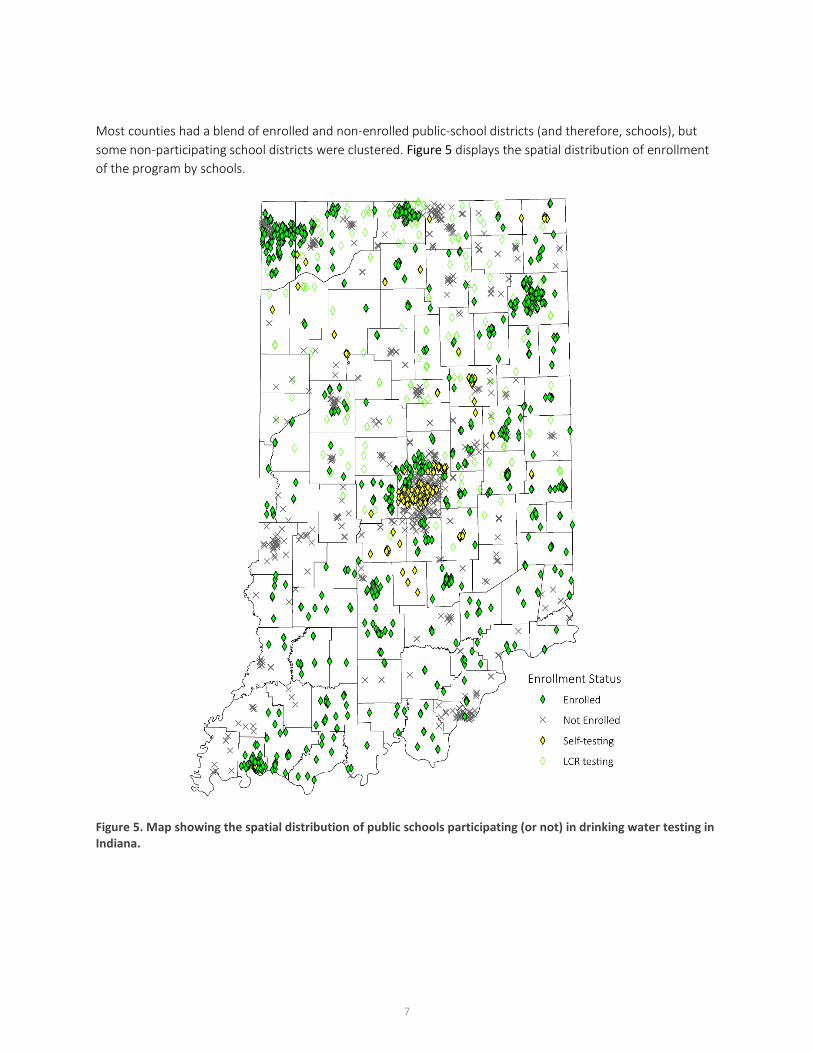
Most counties had a blend of enrolled and non-enrolled public-school districts (and therefore, schools), but some non-participating school districts were clustered. Figure 5 displays the spatial distribution of enrollment of the program by schools.
Figure 5. Map showing the spatial distribution of public schools participating (or not) in drinking water testing in Indiana.
7
Methods The Indiana Finance Authority (IFA) undertook the key program planning, communication, and education tasks described above. The sections below describe the implementation of the program as envisioned by the IFA.
Sampling Plan The methods used in the program included developing a detailed fixture inventory and a sample design (route) for every school in the program. The statewide sampling team was distributed into nine regional sampling centers, and sampling coordinators provided scheduled meetings with points of contact (POC) at each school. The POC was usually a custodian, school nurse, building manager, or plumber. The POC was generally very knowledgeable about the use of the different fixtures in the building, and also gave the sample-design teams access to all parts of the buildings and exterior drinking water locations.
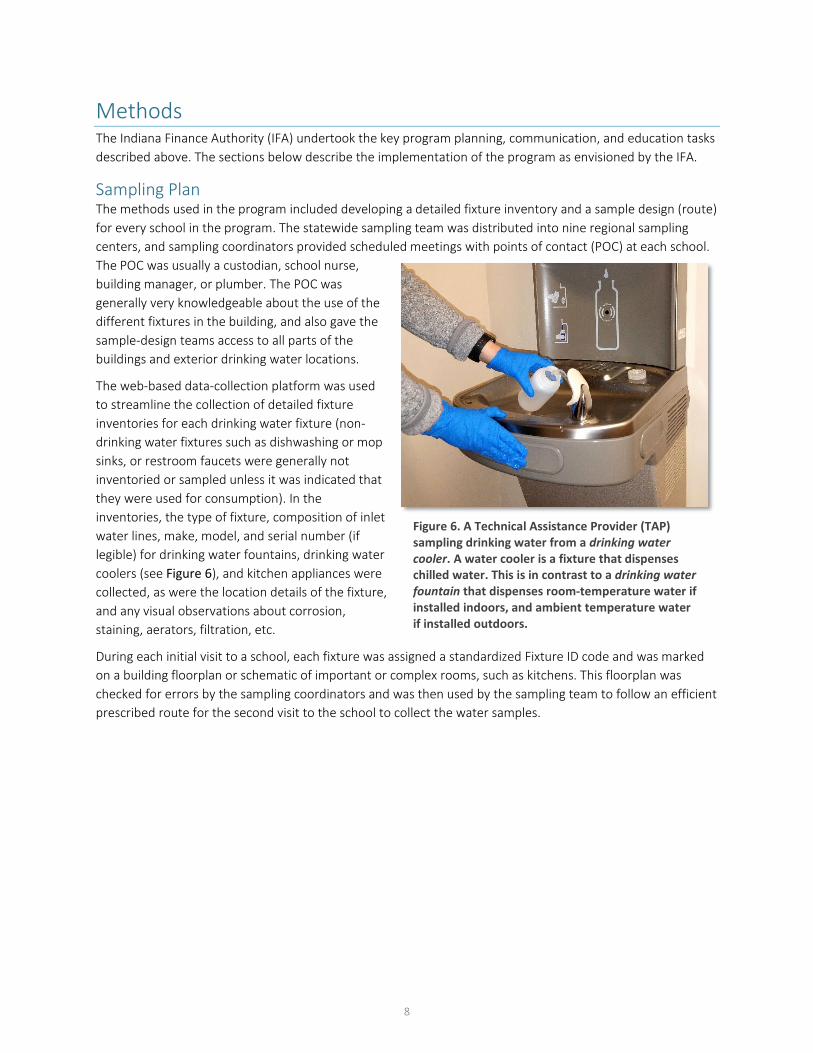
The web-based data-collection platform was used to streamline the collection of detailed fixture inventories for each drinking water fixture (non-drinking water fixtures such as dishwashing or mop sinks, or restroom faucets were generally not inventoried or sampled unless it was indicated that they were used for consumption). In the inventories, the type of fixture, composition of inlet water lines, make, model, and serial number (if legible) for drinking water fountains, drinking water coolers (see Figure 6), and kitchen appliances were collected, as were the location details of the fixture, and any visual observations about corrosion, staining, aerators, filtration, etc.
During each initial visit to a school, each fixture was assigned a standardized Fixture ID code and was marked on a building floorplan or schematic of important or complex rooms, such as kitchens. This floorplan was checked for errors by the sampling coordinators and was then used by the sampling team to follow an efficient prescribed route for the second visit to the school to collect the water samples.
Figure 6. A Technical Assistance Provider (TAP) sampling drinking water from a drinking water cooler. A water cooler is a fixture that dispenses chilled water. This is in contrast to a drinking water fountain that dispenses room-temperature water if installed indoors, and ambient temperature water if installed outdoors.
8
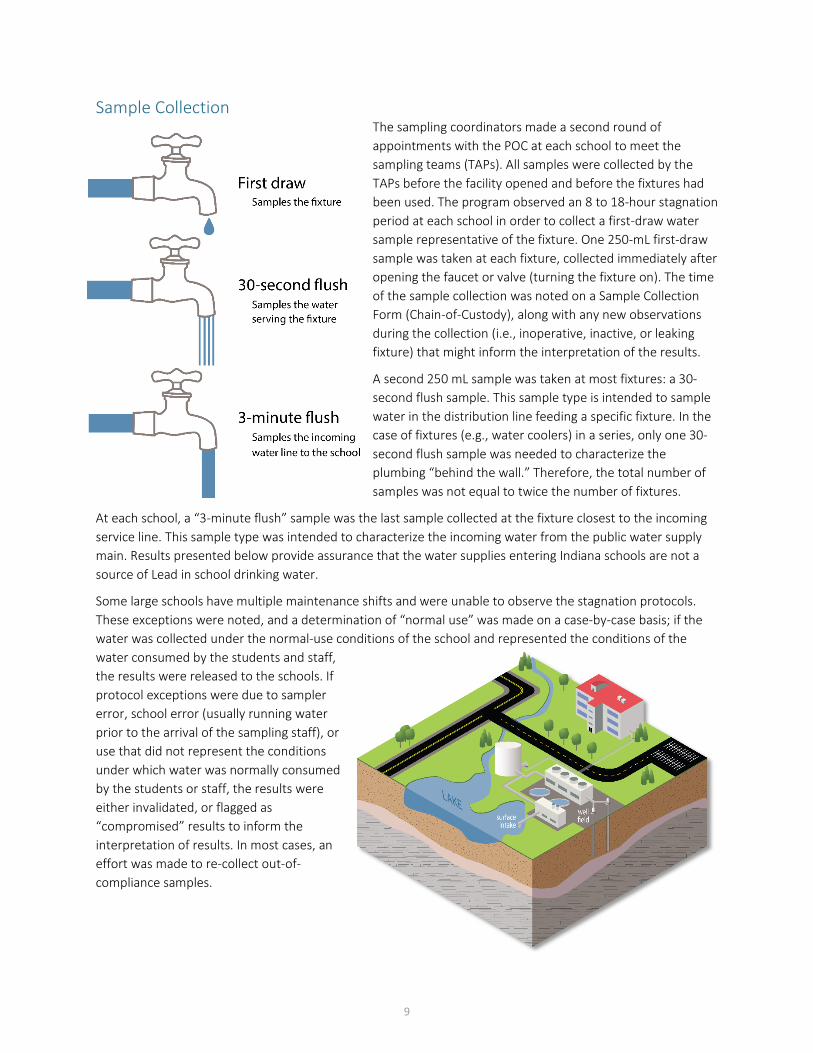
Sample Collection The sampling coordinators made a second round of appointments with the POC at each school to meet the sampling teams (TAPs). All samples were collected by the TAPs before the facility opened and before the fixtures had been used. The program observed an 8 to 18-hour stagnation period at each school in order to collect a first-draw water sample representative of the fixture. One 250-mL first-draw sample was taken at each fixture, collected immediately after opening the faucet or valve (turning the fixture on). The time of the sample collection was noted on a Sample Collection Form (Chain-of-Custody), along with any new observations during the collection (i.e., inoperative, inactive, or leaking fixture) that might inform the interpretation of the results.
A second 250 mL sample was taken at most fixtures: a 30-second flush sample. This sample type is intended to sample water in the distribution line feeding a specific fixture. In the case of fixtures (e.g., water coolers) in a series, only one 30-second flush sample was needed to characterize the plumbing “behind the wall.” Therefore, the total number of samples was not equal to twice the number of fixtures.
At each school, a “3-minute flush” sample was the last sample collected at the fixture closest to the incoming service line. This sample type was intended to characterize the incoming water from the public water supply main. Results presented below provide assurance that the water supplies entering Indiana schools are not a source of Lead in school drinking water.
Some large schools have multiple maintenance shifts and were unable to observe the stagnation protocols. These exceptions were noted, and a determination of “normal use” was made on a case-by-case basis; if the water was collected under the normal-use conditions of the school and represented the conditions of the water consumed by the students and staff, the results were released to the schools. If protocol exceptions were due to sampler error, school error (usually running water prior to the arrival of the sampling staff), or use that did not represent the conditions under which water was normally consumed by the students or staff, the results were either invalidated, or flagged as “compromised” results to inform the interpretation of results. In most cases, an effort was made to re-collect out-of-compliance samples.
9
The TAPs shipped the samples to the laboratories under contract for the program, and standard procedures were followed for testing for Total Lead (Pb) in parts-per-billion. Sample results were uploaded by the drinking-water laboratories to the central database platform. The program uses an Action Level Exceedance (ALE) value of 15 parts per billion (ppb, sometimes referred to as a concentration of 15 µg/L) based on IDEM recommendation, which is the Action Level (AL) for Public Water Systems under the Lead and Copper Rule.
The IFA reviewed the results as well as all documentation (described above) to identify fixtures with ALEs and notify the schools. The IFA sent out results letters to each school, allowing them to inform their own constituents. If any Pb ALEs were found, IFA worked individually with each school to identify remediation measures customized to the fixture and the needs of the school. In most cases, re-testing of remediated fixtures was conducted, finding that elevated levels of Lead no longer presented at those fixtures.
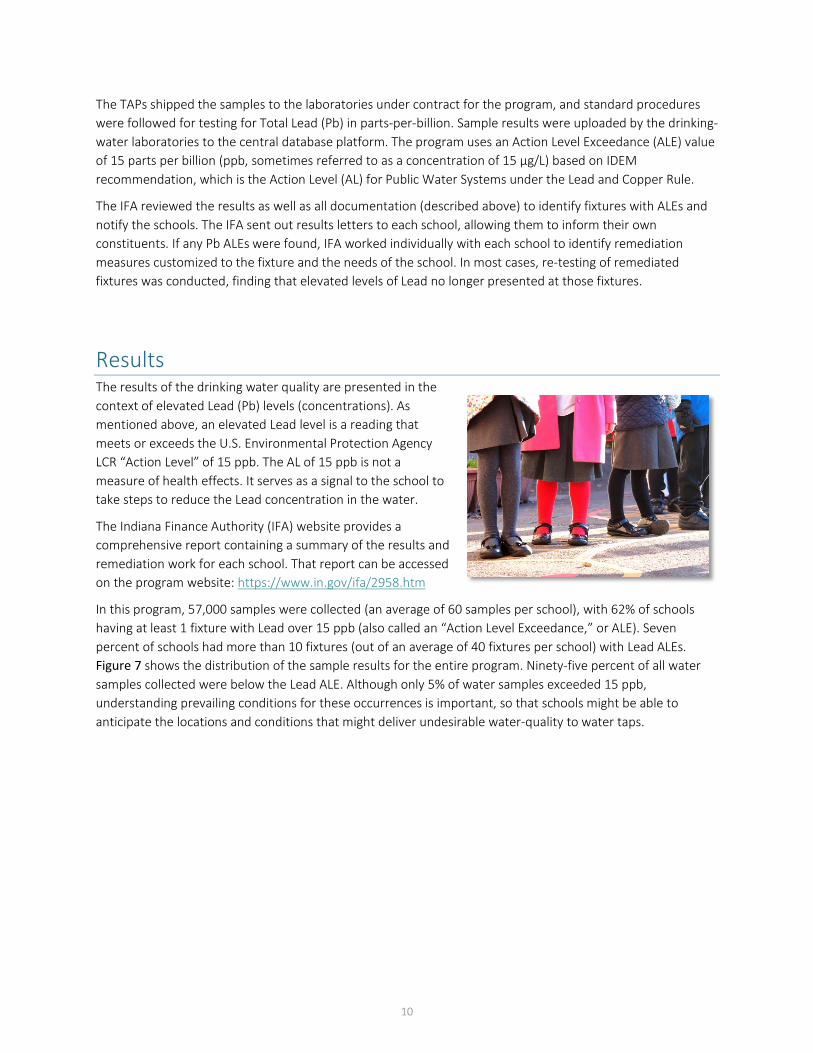
Results The results of the drinking water quality are presented in the context of elevated Lead (Pb) levels (concentrations). As mentioned above, an elevated Lead level is a reading that meets or exceeds the U.S. Environmental Protection Agency LCR “Action Level” of 15 ppb. The AL of 15 ppb is not a measure of health effects. It serves as a signal to the school to take steps to reduce the Lead concentration in the water.
The Indiana Finance Authority (IFA) website provides a comprehensive report containing a summary of the results and remediation work for each school. That report can be accessed on the program website: https://www.in.gov/ifa/2958.htm
In this program, 57,000 samples were collected (an average of 60 samples per school), with 62% of schools having at least 1 fixture with Lead over 15 ppb (also called an “Action Level Exceedance,” or ALE). Seven percent of schools had more than 10 fixtures (out of an average of 40 fixtures per school) with Lead ALEs. Figure 7 shows the distribution of the sample results for the entire program. Ninety-five percent of all water samples collected were below the Lead ALE. Although only 5% of water samples exceeded 15 ppb, understanding prevailing conditions for these occurrences is important, so that schools might be able to anticipate the locations and conditions that might deliver undesirable water-quality to water taps.
10
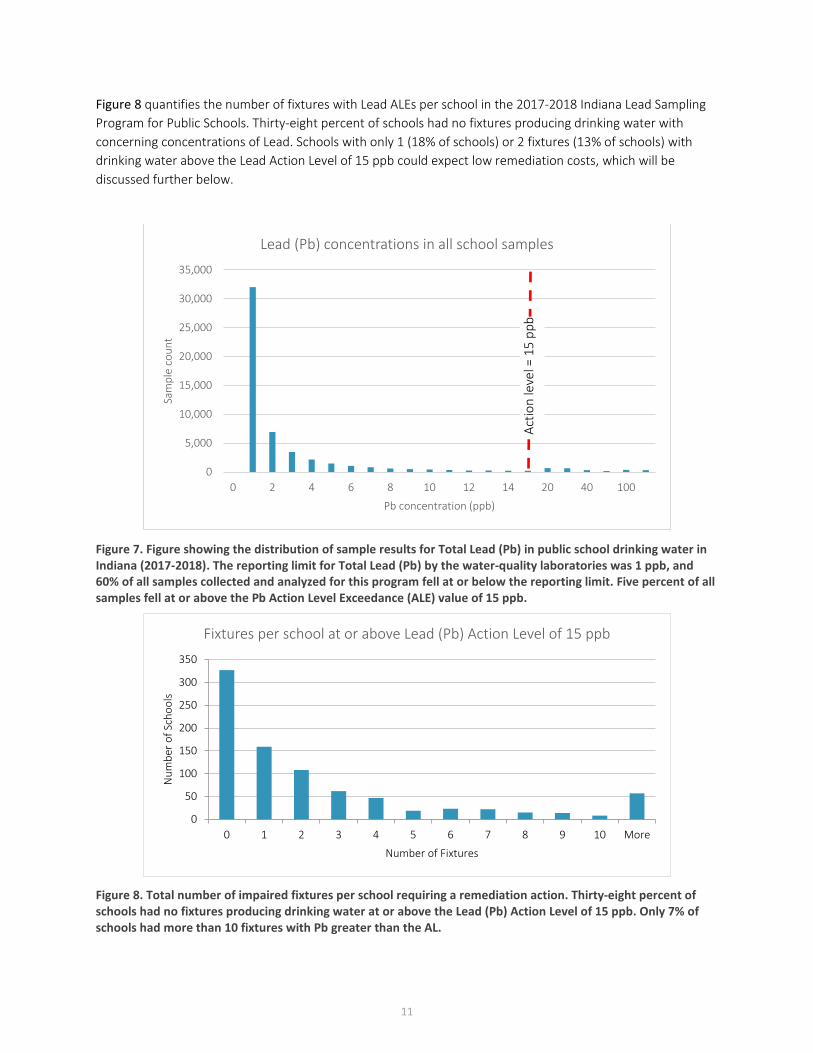
Figure 8 quantifies the number of fixtures with Lead ALEs per school in the 2017-2018 Indiana Lead Sampling Program for Public Schools. Thirty-eight percent of schools had no fixtures producing drinking water with concerning concentrations of Lead. Schools with only 1 (18% of schools) or 2 fixtures (13% of schools) with drinking water above the Lead Action Level of 15 ppb could expect low remediation costs, which will be discussed further below.
Figure 7. Figure showing the distribution of sample results for Total Lead (Pb) in public school drinking water in Indiana (2017-2018). The reporting limit for Total Lead (Pb) by the water-quality laboratories was 1 ppb, and 60% of all samples collected and analyzed for this program fell at or below the reporting limit. Five percent of all samples fell at or above the Pb Action Level Exceedance (ALE) value of 15 ppb.
Figure 8. Total number of impaired fixtures per school requiring a remediation action. Thirty-eight percent of schools had no fixtures producing drinking water at or above the Lead (Pb) Action Level of 15 ppb. Only 7% of schools had more than 10 fixtures with Pb greater than the AL.
0
5,000
10,000
15,000
20,000
25,000
30,000
35,000
0 2 4 6 8 10 12 14 20 40 100
Sam
ple
coun
t
Pb concentration (ppb)
Lead (Pb) concentrations in all school samples
0
50
100
150
200
250
300
350
0 1 2 3 4 5 6 7 8 9 10 More
Num
ber o
f Sch
ools
Number of Fixtures
Fixtures per school at or above Lead (Pb) Action Level of 15 ppb
Actio
n le
vel =
15
ppb
11
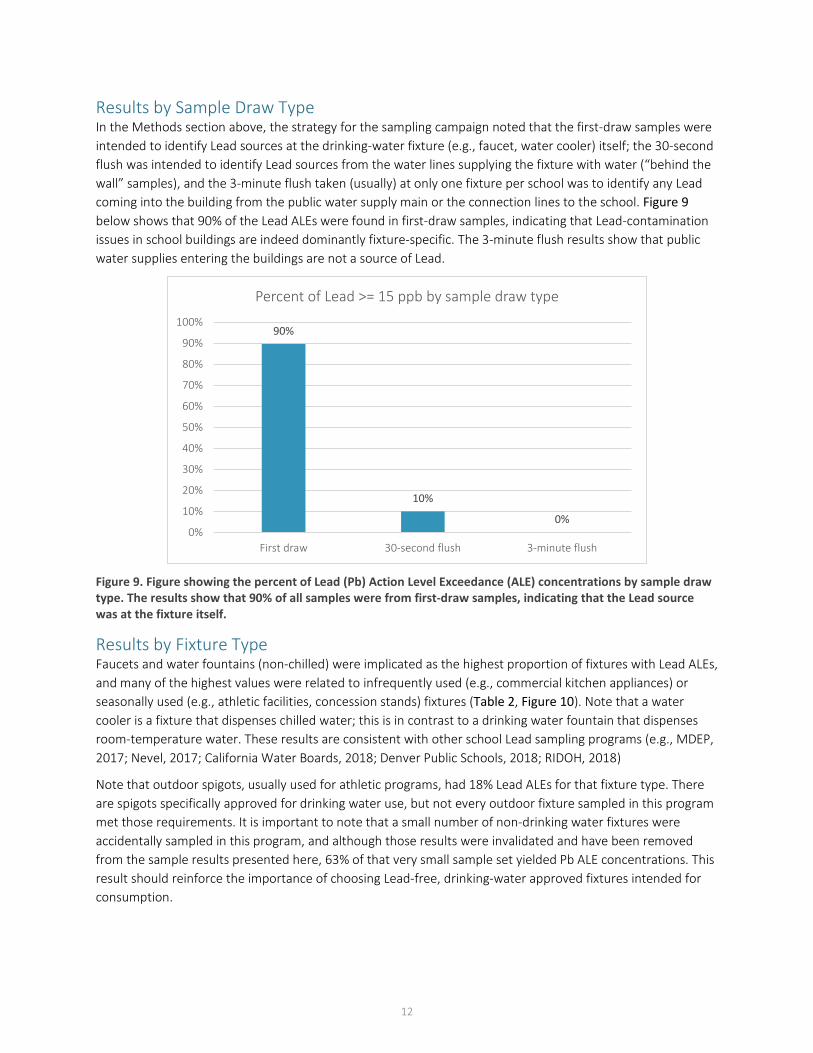
Results by Sample Draw Type In the Methods section above, the strategy for the sampling campaign noted that the first-draw samples were intended to identify Lead sources at the drinking-water fixture (e.g., faucet, water cooler) itself; the 30-second flush was intended to identify Lead sources from the water lines supplying the fixture with water (“behind the wall” samples), and the 3-minute flush taken (usually) at only one fixture per school was to identify any Lead coming into the building from the public water supply main or the connection lines to the school. Figure 9 below shows that 90% of the Lead ALEs were found in first-draw samples, indicating that Lead-contamination issues in school buildings are indeed dominantly fixture-specific. The 3-minute flush results show that public water supplies entering the buildings are not a source of Lead.
Figure 9. Figure showing the percent of Lead (Pb) Action Level Exceedance (ALE) concentrations by sample draw type. The results show that 90% of all samples were from first-draw samples, indicating that the Lead source was at the fixture itself.
Results by Fixture Type Faucets and water fountains (non-chilled) were implicated as the highest proportion of fixtures with Lead ALEs, and many of the highest values were related to infrequently used (e.g., commercial kitchen appliances) or seasonally used (e.g., athletic facilities, concession stands) fixtures (Table 2, Figure 10). Note that a water cooler is a fixture that dispenses chilled water; this is in contrast to a drinking water fountain that dispenses room-temperature water. These results are consistent with other school Lead sampling programs (e.g., MDEP, 2017; Nevel, 2017; California Water Boards, 2018; Denver Public Schools, 2018; RIDOH, 2018)
Note that outdoor spigots, usually used for athletic programs, had 18% Lead ALEs for that fixture type. There are spigots specifically approved for drinking water use, but not every outdoor fixture sampled in this program met those requirements. It is important to note that a small number of non-drinking water fixtures were accidentally sampled in this program, and although those results were invalidated and have been removed from the sample results presented here, 63% of that very small sample set yielded Pb ALE concentrations. This result should reinforce the importance of choosing Lead-free, drinking-water approved fixtures intended for consumption.
90%
10%
0%0%
10%
20%
30%
40%
50%
60%
70%
80%
90%
100%
First draw 30-second flush 3-minute flush
Percent of Lead >= 15 ppb by sample draw type
12
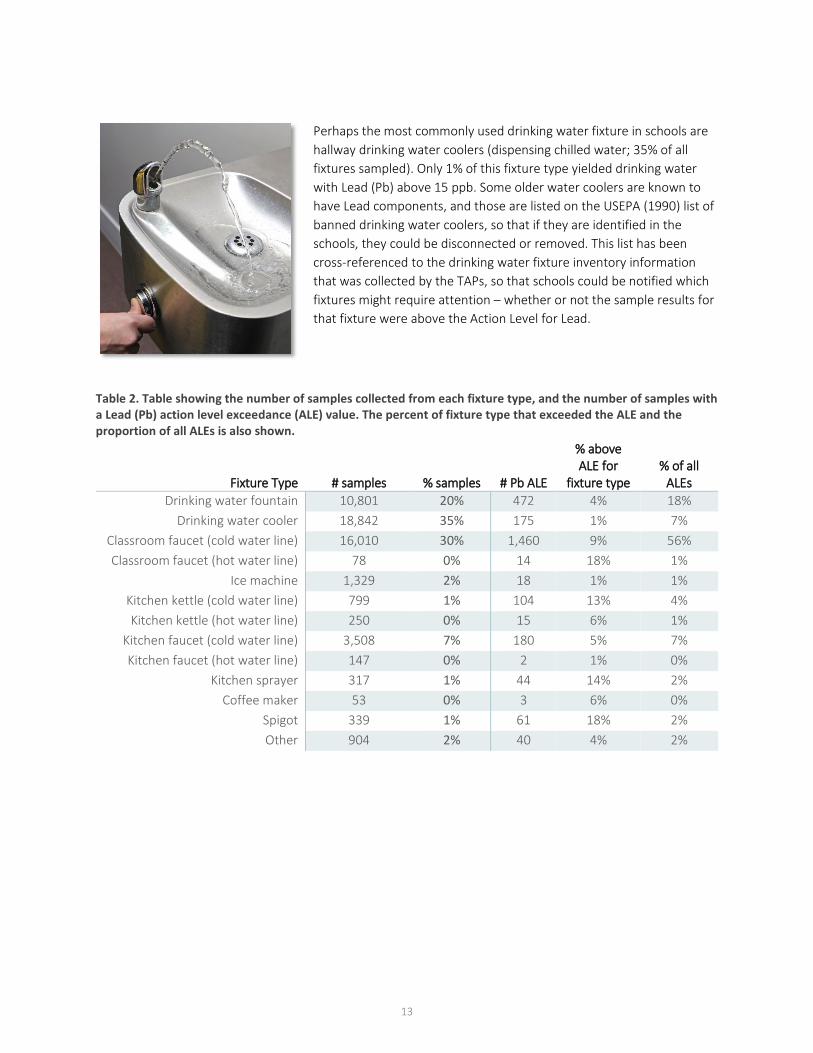
Perhaps the most commonly used drinking water fixture in schools are hallway drinking water coolers (dispensing chilled water; 35% of all fixtures sampled). Only 1% of this fixture type yielded drinking water with Lead (Pb) above 15 ppb. Some older water coolers are known to have Lead components, and those are listed on the USEPA (1990) list of banned drinking water coolers, so that if they are identified in the schools, they could be disconnected or removed. This list has been cross-referenced to the drinking water fixture inventory information that was collected by the TAPs, so that schools could be notified which fixtures might require attention – whether or not the sample results for that fixture were above the Action Level for Lead.
Table 2. Table showing the number of samples collected from each fixture type, and the number of samples with a Lead (Pb) action level exceedance (ALE) value. The percent of fixture type that exceeded the ALE and the proportion of all ALEs is also shown.
Fixture Type # samples % samples # Pb ALE
% above ALE for
fixture type % of all
ALEs Drinking water fountain 10,801 20% 472 4% 18%
Drinking water cooler 18,842 35% 175 1% 7% Classroom faucet (cold water line) 16,010 30% 1,460 9% 56% Classroom faucet (hot water line) 78 0% 14 18% 1%
Ice machine 1,329 2% 18 1% 1% Kitchen kettle (cold water line) 799 1% 104 13% 4% Kitchen kettle (hot water line) 250 0% 15 6% 1%
Kitchen faucet (cold water line) 3,508 7% 180 5% 7% Kitchen faucet (hot water line) 147 0% 2 1% 0%
Kitchen sprayer 317 1% 44 14% 2% Coffee maker 53 0% 3 6% 0%
Spigot 339 1% 61 18% 2% Other 904 2% 40 4% 2%
13
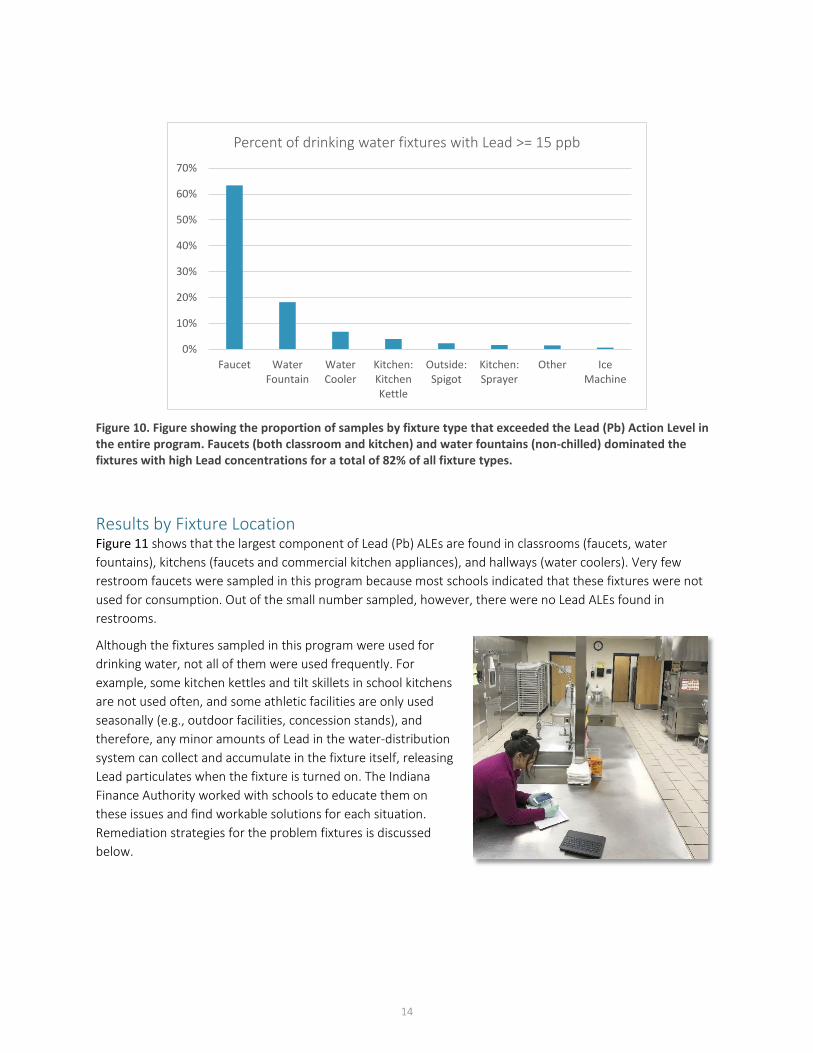
Figure 10. Figure showing the proportion of samples by fixture type that exceeded the Lead (Pb) Action Level in the entire program. Faucets (both classroom and kitchen) and water fountains (non-chilled) dominated the fixtures with high Lead concentrations for a total of 82% of all fixture types.
Results by Fixture Location Figure 11 shows that the largest component of Lead (Pb) ALEs are found in classrooms (faucets, water fountains), kitchens (faucets and commercial kitchen appliances), and hallways (water coolers). Very few restroom faucets were sampled in this program because most schools indicated that these fixtures were not used for consumption. Out of the small number sampled, however, there were no Lead ALEs found in restrooms.
Although the fixtures sampled in this program were used for drinking water, not all of them were used frequently. For example, some kitchen kettles and tilt skillets in school kitchens are not used often, and some athletic facilities are only used seasonally (e.g., outdoor facilities, concession stands), and therefore, any minor amounts of Lead in the water-distribution system can collect and accumulate in the fixture itself, releasing Lead particulates when the fixture is turned on. The Indiana Finance Authority worked with schools to educate them on these issues and find workable solutions for each situation. Remediation strategies for the problem fixtures is discussed below.
0%
10%
20%
30%
40%
50%
60%
70%
Faucet WaterFountain
WaterCooler
Kitchen:KitchenKettle
Outside:Spigot
Kitchen:Sprayer
Other IceMachine
Percent of drinking water fixtures with Lead >= 15 ppb
14
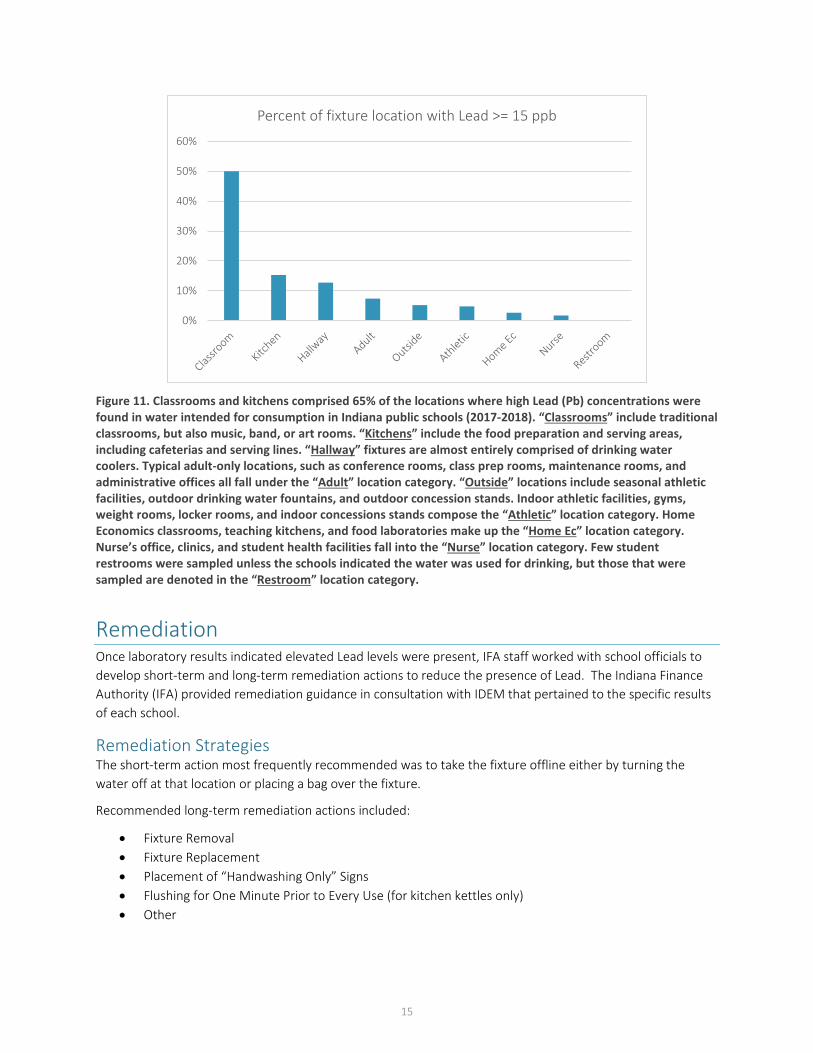
Figure 11. Classrooms and kitchens comprised 65% of the locations where high Lead (Pb) concentrations were found in water intended for consumption in Indiana public schools (2017-2018). “Classrooms” include traditional classrooms, but also music, band, or art rooms. “Kitchens” include the food preparation and serving areas, including cafeterias and serving lines. “Hallway” fixtures are almost entirely comprised of drinking water coolers. Typical adult-only locations, such as conference rooms, class prep rooms, maintenance rooms, and administrative offices all fall under the “Adult” location category. “Outside” locations include seasonal athletic facilities, outdoor drinking water fountains, and outdoor concession stands. Indoor athletic facilities, gyms, weight rooms, locker rooms, and indoor concessions stands compose the “Athletic” location category. Home Economics classrooms, teaching kitchens, and food laboratories make up the “Home Ec” location category. Nurse’s office, clinics, and student health facilities fall into the “Nurse” location category. Few student restrooms were sampled unless the schools indicated the water was used for drinking, but those that were sampled are denoted in the “Restroom” location category.
Remediation Once laboratory results indicated elevated Lead levels were present, IFA staff worked with school officials to develop short-term and long-term remediation actions to reduce the presence of Lead. The Indiana Finance Authority (IFA) provided remediation guidance in consultation with IDEM that pertained to the specific results of each school.
Remediation Strategies The short-term action most frequently recommended was to take the fixture offline either by turning the water off at that location or placing a bag over the fixture.
Recommended long-term remediation actions included:
• Fixture Removal • Fixture Replacement • Placement of “Handwashing Only” Signs • Flushing for One Minute Prior to Every Use (for kitchen kettles only) • Other
0%
10%
20%
30%
40%
50%
60%
Percent of fixture location with Lead >= 15 ppb
15
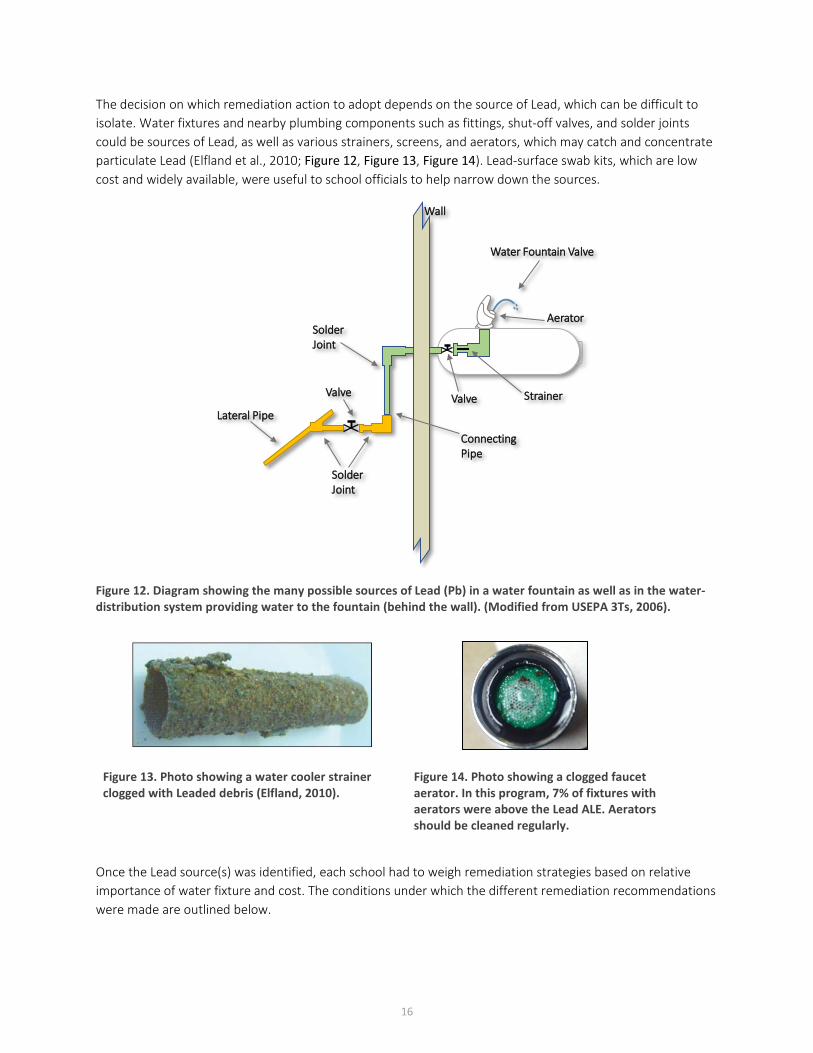
The decision on which remediation action to adopt depends on the source of Lead, which can be difficult to isolate. Water fixtures and nearby plumbing components such as fittings, shut-off valves, and solder joints could be sources of Lead, as well as various strainers, screens, and aerators, which may catch and concentrate particulate Lead (Elfland et al., 2010; Figure 12, Figure 13, Figure 14). Lead-surface swab kits, which are low cost and widely available, were useful to school officials to help narrow down the sources.
Figure 12. Diagram showing the many possible sources of Lead (Pb) in a water fountain as well as in the water-distribution system providing water to the fountain (behind the wall). (Modified from USEPA 3Ts, 2006).
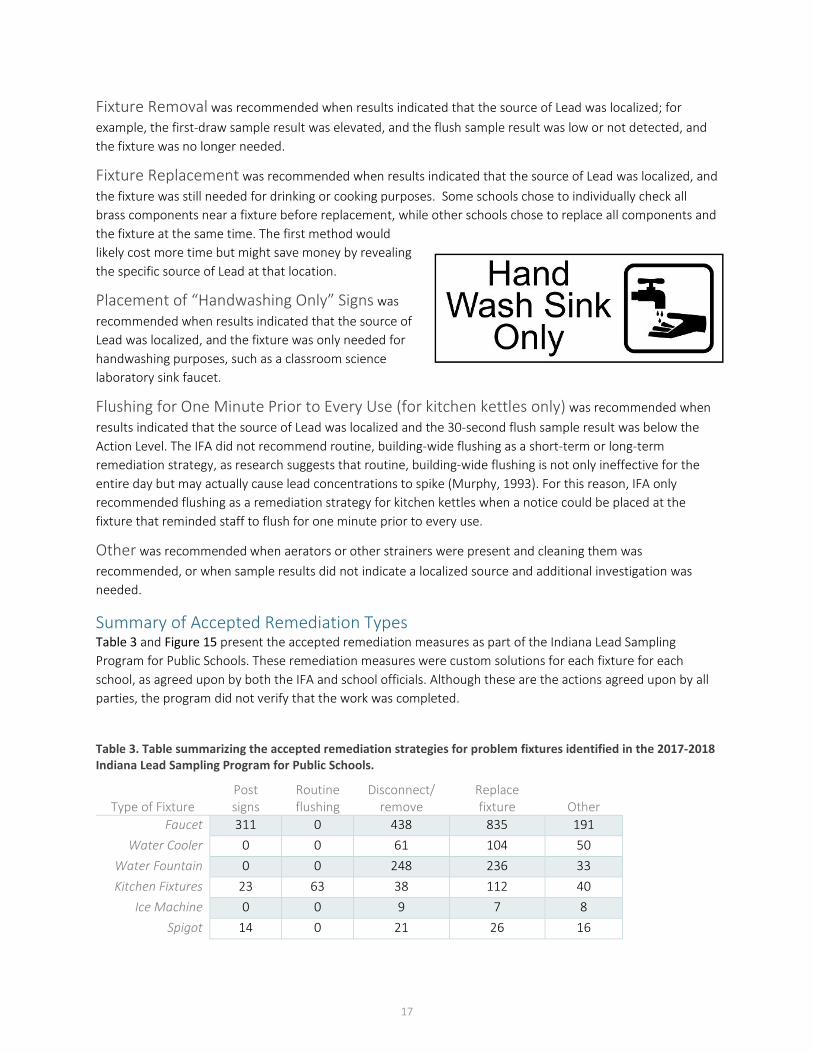
Figure 13. Photo showing a water cooler strainer clogged with Leaded debris (Elfland, 2010).
Figure 14. Photo showing a clogged faucet aerator. In this program, 7% of fixtures with aerators were above the Lead ALE. Aerators should be cleaned regularly.
Once the Lead source(s) was identified, each school had to weigh remediation strategies based on relative importance of water fixture and cost. The conditions under which the different remediation recommendations were made are outlined below.
Water Fountain Valve
Valve
ConnectingPipe
Wall
Lateral Pipe
SolderJoint
Valve
SolderJoint
Aerator
Strainer
16
Fixture Removal was recommended when results indicated that the source of Lead was localized; for example, the first-draw sample result was elevated, and the flush sample result was low or not detected, and the fixture was no longer needed.
Fixture Replacement was recommended when results indicated that the source of Lead was localized, and the fixture was still needed for drinking or cooking purposes. Some schools chose to individually check all brass components near a fixture before replacement, while other schools chose to replace all components and the fixture at the same time. The first method would likely cost more time but might save money by revealing the specific source of Lead at that location.
Placement of “Handwashing Only” Signs was recommended when results indicated that the source of Lead was localized, and the fixture was only needed for handwashing purposes, such as a classroom science laboratory sink faucet.
Flushing for One Minute Prior to Every Use (for kitchen kettles only) was recommended when results indicated that the source of Lead was localized and the 30-second flush sample result was below the Action Level. The IFA did not recommend routine, building-wide flushing as a short-term or long-term remediation strategy, as research suggests that routine, building-wide flushing is not only ineffective for the entire day but may actually cause lead concentrations to spike (Murphy, 1993). For this reason, IFA only recommended flushing as a remediation strategy for kitchen kettles when a notice could be placed at the fixture that reminded staff to flush for one minute prior to every use.
Other was recommended when aerators or other strainers were present and cleaning them was recommended, or when sample results did not indicate a localized source and additional investigation was needed.
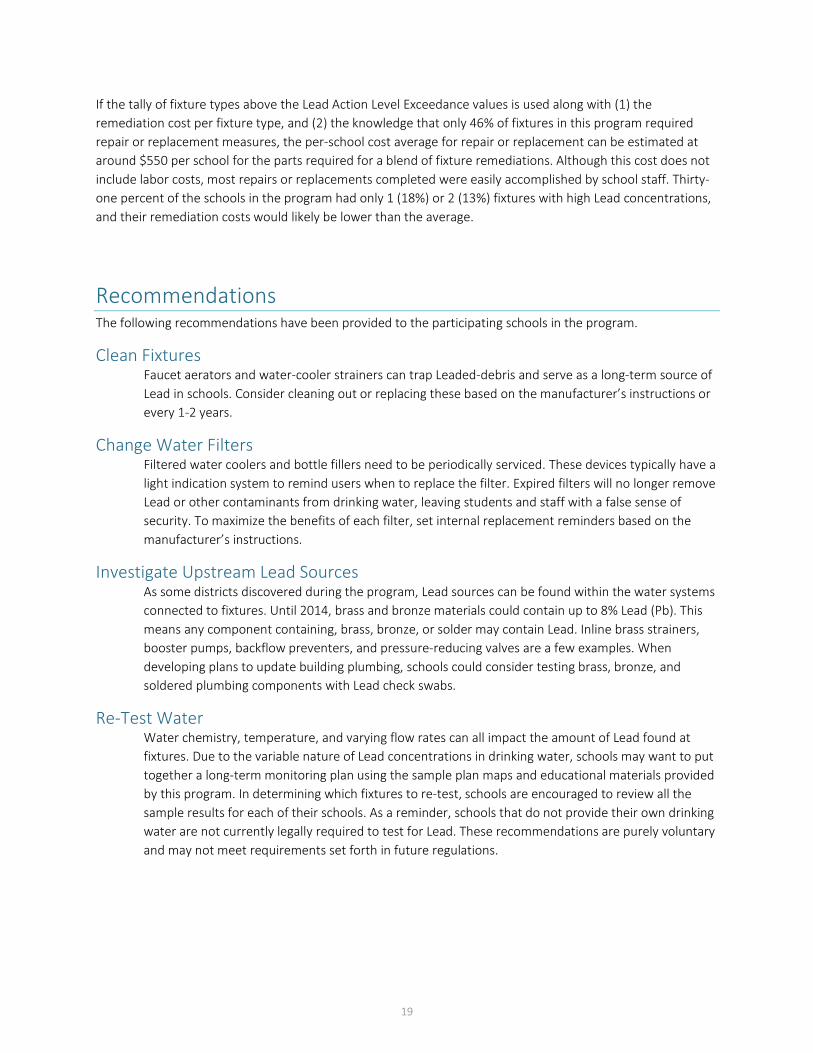
Summary of Accepted Remediation Types Table 3 and Figure 15 present the accepted remediation measures as part of the Indiana Lead Sampling Program for Public Schools. These remediation measures were custom solutions for each fixture for each school, as agreed upon by both the IFA and school officials. Although these are the actions agreed upon by all parties, the program did not verify that the work was completed.
Table 3. Table summarizing the accepted remediation strategies for problem fixtures identified in the 2017-2018 Indiana Lead Sampling Program for Public Schools.
Type of Fixture Post signs
Routine flushing
Disconnect/ remove
Replace fixture Other
Faucet 311 0 438 835 191 Water Cooler 0 0 61 104 50
Water Fountain 0 0 248 236 33 Kitchen Fixtures 23 63 38 112 40
Ice Machine 0 0 9 7 8 Spigot 14 0 21 26 16
17
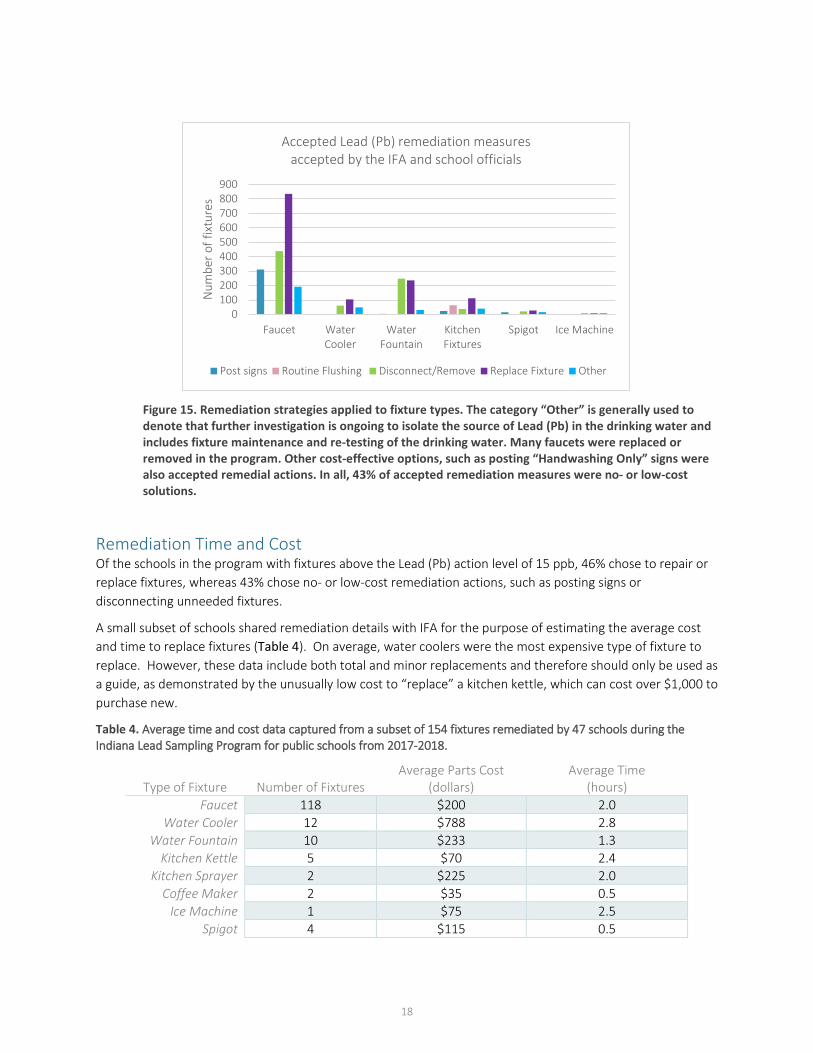
Figure 15. Remediation strategies applied to fixture types. The category “Other” is generally used to denote that further investigation is ongoing to isolate the source of Lead (Pb) in the drinking water and includes fixture maintenance and re-testing of the drinking water. Many faucets were replaced or removed in the program. Other cost-effective options, such as posting “Handwashing Only” signs were also accepted remedial actions. In all, 43% of accepted remediation measures were no- or low-cost solutions.
Remediation Time and Cost Of the schools in the program with fixtures above the Lead (Pb) action level of 15 ppb, 46% chose to repair or replace fixtures, whereas 43% chose no- or low-cost remediation actions, such as posting signs or disconnecting unneeded fixtures.
A small subset of schools shared remediation details with IFA for the purpose of estimating the average cost and time to replace fixtures (Table 4). On average, water coolers were the most expensive type of fixture to replace. However, these data include both total and minor replacements and therefore should only be used as a guide, as demonstrated by the unusually low cost to “replace” a kitchen kettle, which can cost over $1,000 to purchase new.
Table 4. Average time and cost data captured from a subset of 154 fixtures remediated by 47 schools during the Indiana Lead Sampling Program for public schools from 2017-2018.
0100200300400500600700800900
Faucet WaterCooler
WaterFountain
KitchenFixtures
Spigot Ice Machine
Num
ber o
f fix
ture
s
Accepted Lead (Pb) remediation measures accepted by the IFA and school officials
Post signs Routine Flushing Disconnect/Remove Replace Fixture Other
Type of Fixture Number of Fixtures Average Parts Cost
(dollars) Average Time
(hours) Faucet 118 $200 2.0
Water Cooler 12 $788 2.8 Water Fountain 10 $233 1.3
Kitchen Kettle 5 $70 2.4 Kitchen Sprayer 2 $225 2.0
Coffee Maker 2 $35 0.5 Ice Machine 1 $75 2.5
Spigot 4 $115 0.5
18
If the tally of fixture types above the Lead Action Level Exceedance values is used along with (1) the remediation cost per fixture type, and (2) the knowledge that only 46% of fixtures in this program required repair or replacement measures, the per-school cost average for repair or replacement can be estimated at around $550 per school for the parts required for a blend of fixture remediations. Although this cost does not include labor costs, most repairs or replacements completed were easily accomplished by school staff. Thirty-one percent of the schools in the program had only 1 (18%) or 2 (13%) fixtures with high Lead concentrations, and their remediation costs would likely be lower than the average.
Recommendations The following recommendations have been provided to the participating schools in the program.
Clean Fixtures Faucet aerators and water-cooler strainers can trap Leaded-debris and serve as a long-term source of Lead in schools. Consider cleaning out or replacing these based on the manufacturer’s instructions or every 1-2 years.
Change Water Filters Filtered water coolers and bottle fillers need to be periodically serviced. These devices typically have a light indication system to remind users when to replace the filter. Expired filters will no longer remove Lead or other contaminants from drinking water, leaving students and staff with a false sense of security. To maximize the benefits of each filter, set internal replacement reminders based on the manufacturer’s instructions.
Investigate Upstream Lead Sources As some districts discovered during the program, Lead sources can be found within the water systems connected to fixtures. Until 2014, brass and bronze materials could contain up to 8% Lead (Pb). This means any component containing, brass, bronze, or solder may contain Lead. Inline brass strainers, booster pumps, backflow preventers, and pressure-reducing valves are a few examples. When developing plans to update building plumbing, schools could consider testing brass, bronze, and soldered plumbing components with Lead check swabs.
Re-Test Water Water chemistry, temperature, and varying flow rates can all impact the amount of Lead found at fixtures. Due to the variable nature of Lead concentrations in drinking water, schools may want to put together a long-term monitoring plan using the sample plan maps and educational materials provided by this program. In determining which fixtures to re-test, schools are encouraged to review all the sample results for each of their schools. As a reminder, schools that do not provide their own drinking water are not currently legally required to test for Lead. These recommendations are purely voluntary and may not meet requirements set forth in future regulations.
19
Conclusions A majority of public schools and students were served by the 2017-2018 Indiana Lead Sampling Program for Public Schools. In this program, 57,000 samples were collected (an average of 40 fixtures and 60 samples per school), with 62% of schools having at least 1 fixture with Pb over 15 ppb (also called an “Action Level Exceedance,” or ALE). Ninety-five percent of all drinking water fixtures in the program were under the Pb AL. Only seven percent of schools had more than 10 fixtures (out of an average of 40 fixtures per school) with ALEs.
Ninety percent of the ALEs were from the initial draw sample type, which reflects that the fixture itself, rather than “behind the wall” plumbing or water from the incoming public supply water main, is the primary source of Lead contamination found in the drinking water of the schools in Indiana. That is good news because individual fixtures can be more easily remediated than can issues in the water distribution of the schools. No water contamination was found for water supplying the schools from municipal water supplies.
Water faucets and water fountains in classrooms were the fixture types with the highest proportion of fixtures with Lead (Pb) concentrations above the Action Level Exceedance value of 15 ppb. Many of the highest Lead concentrations in drinking water revealed in the program were related to infrequently used (e.g., commercial kitchen appliances) or seasonally used (e.g., athletic facilities, concession stands) fixtures. These results are consistent with other school Lead-sampling programs. However, the most commonly used drinking water fixtures in each school, hallway water coolers, had only 1% of Lead ALEs across the entire program.
Because the primary goal of the program was to provide schools with more information about how to better manage water quality within their facilities, the IFA worked closely with each school to identify remediation approaches specific to the fixture and the needs of the school. These actions resolved problems by removing or replacing fixtures, posting handwashing-only signs, or routinely flushing fixtures before use. No- or low-cost remediation actions such as posting “Handwashing Only” signs or disconnecting unneeded fixtures were acceptable remedial activities for 43% of problem fixtures, whereas 46% of fixtures were repaired or replaced, at a higher cost to the school.
References California Water Boards, 2018, Lead Sampling of Drinking Water in California Schools website:
https://www.waterboards.ca.gov/drinking_water/certlic/drinkingwater/leadsamplinginschools.html <date accessed: January 4, 2018>
Denver Public Schools, 2018, Lead Testing Information for Families & Community, Lead Testing Results website: https://facilities.dpsk12.org/leadtesting/results, <date accessed: January 4, 2018>
Elfland, C., Scardina, P., and Edwards, M., 2010, Lead-contaminated water from brass plumbing devices in new buildings. Journal AWWA, pp 102-11.
MDEP (Massachusetts Department of Environmental Protection), 2017. Massachusetts Assistance Program for Lead in School Drinking Water. Massachusetts.
Murphy, E. A.,1993, Effectiveness of flushing on reducing lead and copper levels in school drinking water. Environmental Health Perspectives, v. 101, no. 3, pp240.
20
Nevel, J., 2017, Lead in the water: Schools make fixes after mandated tests: The State Journal-Register (Springfield, Illinois) https://www.sj-r.com/news/20171223/lead-in-water-schools-make-fixes-after-mandated-tests <date accessed: January 4, 2018>
Rhode Island Department of Health (RIDOH), 2018, Lead in School and Daycare Facility Drinking Water website: http://health.ri.gov/data/schools/water <date accessed: January 4, 2018>
USEPA, 1990, Drinking Water Coolers that Are Not Lead Free, [WH-FRL-3705-8] 55 FR 1772, January 18, 1990.
USEPA, 1991, Lead and Copper Rule (LCR), 56 FR 26460 - 26564, June 7, 1991.
USEPA, 2005, Lead and Copper Rule: A Quick Reference Guide for Schools and Child Care Facilities that are Regulated Under the Safe Drinking Water Act, USEPA 816-F-05-030. Can be accessed at: https://nepis.epa.gov/Exe/ZyPDF.cgi?Dockey=P10058C5.txt
USEPA, 2006, 3Ts for Reducing Lead in Drinking Water in Schools. Revised Technical Guidance, USEPA 816-B-05-008, Washington
21
Glossary Term Definition
120WaterAudit 120WA, private partner that coordinated directly with laboratories, and developed a web platform to receive sample results from laboratories.
3-Minute Flush Sample Sample collected immediately after letting water run into drain for 3 minutes, always last sample collected from the fixture closest to the building service line. This sample type is intended to sample the water provided to the school from a water utility.
30-Second Flush Sample Sample collected immediately after letting water run into drain for 30 seconds. This sample type is intended to sample the water line feeding a specific fixture or series of fixtures.
Aerator A screen located where the water exits from a fixture to improve flow (by slight back-pressure) from a faucet or water fountain. With respect to Lead contamination, these screens can trap and collect sediment, degrading water quality. They should be cleaned regularly.
Action Level AL. The concentration of a contaminant above which triggers a remediation action. In this program, a Total Lead (Pb) concentration in drinking water of 15 ppb.
Action Level Exceedance ALE. Any drinking water sample with a Total Lead (Pb) concentration greater than or equal to 15 ppb (µg/L).
Banned Water Coolers Drinking water coolers documented and banned by the USEPA (1990) to have Lead (Pb) components sufficient to produce Lead (Pb)-contaminated drinking water.
Chain of Custody CoC, documentation used to document samples collected or cancelled. Used interchangeably with “Sample Collection Form.”
Clean Water Act CWA (1972) is the federal law in the United States that governs water pollution. https://www.epa.gov/laws-regulations/summary-clean-water-act
Detection Limit The lowest detectable concentration measurable by drinking water laboratory analysis instrumentation.
First Draw Sample Sample collected immediately when turning on fixture after a stagnation period; required at every drinking water fixture. This sample type is intended to sample the individual fixture.
Indiana Department of Environmental Management
IDEM, assisted with development of program and provided technical assistance.
Indiana Finance Authority IFA, funding agency and primary program coordinator. Responsible for recruiting districts into the program, establishing program protocols, releasing sample results to schools, working with individual schools to remediate fixtures with ALEs.
22
Indiana University IU, provided coordination and staffing of the statewide drinking-water sampling campaign
Infrequent Use With respect to the Indiana School Lead Sampling Program, fixtures that are not used frequently, such as large commercial kitchen fixtures, or athletic facilities or concessions that are only used seasonally. These fixtures are more likely to have Pb ALEs.
Kitchen Kettle Large vessel of water that is heated to cook, warm, or steam food in a commercial kitchen.
Lead Elemental symbol is Pb. Considered a contaminant in drinking water, usually entering the drinking water system by plumbing or drinking-water fixtures with Lead (Pb) components.
Lead and Copper Rule LCR, a regulatory rule from the Clean Water Act that applies to Public Water Systems (PWS) and requires routine sampling of Lead and Copper from a subset of the drinking water fixtures in residential structures that are served by that PWS.
Lead Check Swabs A single-use, direct-contact, instant Lead test that can help determine if Lead is present in paint on walls or on metal pipes or solder, if the solder is exposed. A chemical reaction yields a color indicator (usually red), turning color if Lead is detected.
Lead-free Fixture A fixture not containing more than 0.20% Lead (Pb) solder (or solder flux), and not more than 0.25% Lead components that will come into contact with drinking water that could be consumed. Lead-free fixtures are a requirement of the Reduction in Lead Drinking Water Act of 2011.
Non-detect A water sample analysis result below the instrumentation detection limit for the constituent of interest, in this case Total Lead (Pb). In this program, non-detects (ND) are interchangeable with the term “reporting limit.”
Program Website Lead Sampling Program for Public Schools website developed by IFA. https://www.in.gov/ifa/2958.htm
Public Water System PWS, water utilities that distribute water from either surface-water or groundwater sources. A PWS can be a community system that serves a large population, or a non-community non-transient (NCNT) system such as a school that has their own water well(s). PWS are subject to the LCR.
Reporting Limit A concentration below which a lab does not report laboratory analysis results. This value is often higher than the minimum instrumentation detection limit and is intended to represent the lowest concentration certainty by the laboratory.
Safe Drinking Water Act SDWA (1974) is the federal law that protects public drinking water supplies in the United States, implemented by USEPA. Part of the program is the designation of drinking water quality standards. https://www.epa.gov/sdwa
Sample Collection Second visit to a school where TAPs collected samples.
23
Sample Design Plan First visit to a school to create a sampling plan, which includes identifying every drinking water fixture and designing an efficient route to collect samples on the second visit to the school.
Sample Inventory Documentation of the characteristics of every drinking water fixture.
Sample Collection Form SCF, documentation used to document samples collected or cancelled. Used interchangeably with “Chain of Custody.”
Service Line Sometimes called a connection line. A pipe that provides water from a public water main to a building, such as a school or residence. Because of the malleability of Lead (Pb), service lines often contained a short segment of Lead piping, couplings, or fittings prior to 1988 when they were prohibited. http://www.ncsl.org/research/environment-and-natural-resources/lead-water-service-lines.aspx
Solder A metallic compound used to seal joints or connections between metal pipes. Because a malleable material is needed to make these connections between pipes, it was common prior to 1986 to use solder with a high proportion of Lead (Pb).
Stagnation Period The period of time when the water distribution system of a school is not used (stagnant) for no less than 8 hours and no greater than 18 hours.
Strainer An interior screen located within a water fountain or water cooler that collects sediment or debris. They should be regularly cleaned so they don’t contribute to drinking water contamination, and because they are out of sight and sometimes difficult to access, strainers require special attention to maintain.
Technical Assistant Provider
TAP, staff performing sample designs, conducting fixture inventories, and conducting sample collections.
Tilt Skillet Large tilting pan used to simmer or braise food in a commercial kitchen.
Water Cooler Drinking water fixture with a refrigeration unit that dispenses cold water. Older models contained small tanks; newer models are usually tankless, using dual-coiled water and refrigeration lines to cool the water prior to consumption.
Water Fountain Drinking water fountain without a refrigeration unit. Sometimes referred to as a “bubbler.” These fixtures dispense room-temperature water if installed indoors, and ambient temperature water if installed outdoors.
24