Embed Size (px)
Citation preview

INDIAN CONTAINER MARKET REPORT 2019
BY SPONSORED BY

Indian container market is witnessing incremental double digit growth year-on-year with several policy reforms in place bolstering the container trade against the global slowdown. Improvement in transshipment numbers at Indian ports, direct port delivery (DPD), direct port entry (DPE), increase in authorized economic operators (AEOs), port community systems (PCS), digitization and automation of cargo movement through port gates, etc are some of the key areas of improvement notably aiding the market towards upward trend. Healthy competition among major and private ports is improving the container volume growth at each port year-over-year.
In FY 2018-19, total throughput of Indian container terminals registered was 16.99 million teus with year-on-year growth of 10.5 per cent. In the same year, total installed capacity available is 28.65 million teus, with capacity utilization of 60 per cent. West coast ports capture 66 per cent of overall Indian capacity by contributing 72 per cent of total Indian container volumes majorly supported by largest container terminals of JNPT and Mundra terminals. East coast ports handled 28 per cent of overall Indian container volume out of 34 per cent of total Indian container capacity.
This seventh edition of Indian Container Market Annual Report developed by Maritime Gateway in collaboration with Drewry Maritime Research and Consulting Firm, aims to delve deeper into logistics cost which has been a major stumbling block in the trade and industry with many non-transparency issues affecting India’s containerised trade and the performance of ports and terminals. Through this report, we are trying to address some of these points to pinpoint some areas which need to be transparent for the betterment of trade.
Notwithstanding, keeping in view to cater to the current business needs, we are happy to share with you a comprehensive Indian container market Report 2019. We believe this insightful report would address some of the trade challenges and helps in making informed decision.
Sincerely
RamprasadEditor-in-chief and PublisherMaritime Gateway
FOREWORD

Dr. Subrata Kumar Behera Drewry, (Manager – Ports and Containers Research)
Dr. Subrata Kumar Behera with an industry experience of 12 years is well versed in international trade and transport. He works in the container and ports team at Drewry. He has worked on the India and other emerging market Container Business Analysis. He is a Doctorate from the School of International Studies, Jawaharlal Nehru University, New Delhi. Besides his doctoral thesis, he has number of research publications to his credit.
Mr Rakesh Oruganti Gateway Media Pvt Ltd
With an overall experience of 11 years in market research, including around 5 years in container market, shipping and logistics, Mr Rakesh has handled several complex research projects for shipping lines, ports, terminals, dry ports, shipping agents, CHA’s, forwarders...etc. Presently, he heads the research department of Gateway Media Pvt Ltd.
Drewry is proud to be associated with Maritime Gateway as Knowledge Partner for Containers India 2018. It is our pleasure to present this white paper.
BEHIND THE REPORT

This report is a proprietary of Maritime Gateway and no part of this report may be copied/reproduced in any form or any manner whatsoever without a written consent by us. We have taken utmost care in preparing this report. Information has been obtained from sources considered to be reliable. However, we do not guarantee the accuracy, adequacy or completeness of information and are not responsible for any errors in transmission.
1. Indian Container Market Overview 06
2. Top Commodity – Partner Matrix 12
3. Shipping Capacity – Average Vessel Size at Indian Ports 15
4. The Dilemma of High Logistics Cost 16
5. Cost Variations - Service Providers 21
6. Terminals Ranking 24
7. Terminals Fact Sheet 26
8. Terminals Performance 28
9. TerminalsProfiles
• APM Terminals Mumbai 29
• Adani International Container Terminal 30
• Jawaharlal Nehru Port Container Terminal 31
• Adani Mundra Container Terminal 32
• Chennai International Terminals 33
• Nhava Sheva India Gateway Terminal 34
• APM Terminals Pipavav 35
• Mundra International Container Terminal 36
• Adani CMA Mundra Terminal 37
• Chennai Container Terminal 38
• Bharat Kolkata Container Terminal 39
• Vallarpadam International Container Transshipment Terminal 40
• Kattupalli International Container Terminal 41
• Nhava Sheva International Container Terminal 42
• Adani Hazira Container Terminal 43
• Bharat Mumbai Container Terminal 44
• NAVAYUGA Container Terminal 45
• Visakha Container Terminal 46
• Dakshin Bharat Gateway Terminal 47
• PSA SICAL Tuticorin Container Terminal 48
• Kandla International Container Terminal 49
• Haldia International Container Terminal 50
• Adani Ennore Container Terminal 51
• PSA Kakinada Container Terminal 52
CONTENTS

In 2018, India has become the world’s fifth largest economy by leaving France & the UK behind in World Bank ranking.
Although China registered single digit growth in container throughput in last three years, In-dia’s container throughput grew by 11.4% in 2018. All Indian ports registered positive growth during the year except one or two unfortunate ones. Overall, India’s container traffic in last four years has grown significantly with a CAGR of close to 12%.
INDIAN CONTAINER MARKET OVERVIEW
Figure 1: Development of container traffic in India
30%
25%
20%
15%
10%
5%
0%
-5%
-10%
18
16
14
12
10
8
6
4
2
02005 2006 2007 2008 2009 2010 2011 2012 2013 2014 2015 2016 2017 2018
Thro
ughp
ut (m
illio
ns te
us)
Throughput Annual growth - RHS
14%17%
26%
18%
7%
3%5%
12%
2%
11%
13%11%10%
-5%
06

INDIAN CONTAINER MARKET REPORT- 2019
Market Segmentation-2019Major Vs Non-major ports Major ports have continuously lost a significant share of container traffic to non-major ports in last decade. The market share of non-major ports has increased by more than five times in last 14 years (since 2005). The market share of major ports declined from 92% in 2005 to 58% in 2018. Rapid expansion of private terminal operators in the non-major ports diverted significant chunk of cargo. The market share of non-major ports collectively rose to a whopping 42% in 2018 from a paltry 8% in 2005. Krishnapatnam and Katupalli on the east coast of India have amassed significant volume in last four/five years and they are adding to the growth story of non-major ports which were driven previously by Mundra and Pipavav. The largest Indian port JNPT registered a healthy close to 8% growth in 2018 which is the highest y-o-y growth in last four years. Nevertheless, its share has been reduced to almost half in last 15 year. Mundra is rapidly approaching to become the largest shareholder of total container traffic and handled 11% more boxes in 2018 over the previous year. Mundra’s share was just 3% less than the largest port JNPT in total container traffic.
East coast ports Vs west coast portsPorts on the west coast will continue to dominate in total container throughput, so as in the container infrastructure. Around 72% of the country’s container throughput is handled by the west coast ports.
Figure 2: Rising Share of Non-Major Ports
Figure 3: Containers Handled at west and east coast ports
2005
2005
0%
0%
20%
40%
40%
20%
60%
60%
80%
80%
100%
100%20
16
12
8
4
0
2006
2006
2007
2007
East Coast Ports West Coast Ports
2008
2008
Major Ports
Thro
ughp
ut (m
illio
n te
u)
Shar
e of
por
ts %
Share of major ports (RHS) Share of non-major ports%
Non-Major Ports
2009
2009
2010
2010
2011
2011
2012
2012
2013
2013
2014
2014
2015
2015
2016
2016
2017
2017
2018
2018
07

Major containerised/containerisable exim cargoFor analysis, we have divided all traded commodities into 33 major categories, such as Phar-maceuticals, Fabric/Yarn, Steel Products, Reefer Food Products and Readymade Garments (RMG)/Textiles. As we do not have precise definitions of containerised and non-container-ised cargo from any authoritative source, the data has some subjectivity built in.
In this year’s report we have used the volume of cargo (tonnes) as our basis of analysis in contrast to trade values which was reported in 2018 edition of Containers India report.
In terms of volume, various mineral products which are either containerised or container-isable are the major product group being exported from India. In 2018, this product group constituted 17% of the total containerised or containerisable exports of India. This product group’s export volume has increased from 4.5 million tonnes in 2008 to 19.8 million tonnes in 2018, nearly 20 times over the decade.
Reefer food products follow the minerals and constitute 14% of India’s total exports. Rising demand for fish and meat has increased the commercial farming of fish and livestock in India over the years. As per the data available to us, export volume of reefer foods increased five times over decade from 4.6 million tonnes in 2008 to 15.6 million tonnes in 2018.
Figure 4: Major commodities exported from India 2018
On the import side, chemical segment is the largest group of commodities being imported in India. In 2018, the country imported 24.7 million tonnes of chemicals compared with 6.8 million tonnes in 2008.
Steel and steel products ranks second in the list of imports in India. Growing industrial and infrastructural needs has kept steel product demand high in the country. Steel product imports increased from 12.4 million tonnes in 2008 to 20.5 million tonnes in 2018.
Similarly, rising income levels in the country has given rise to increased demand for imported food products. Imports of food products increased by three times over the decade to reach 18.8 million tonnes in 2018.
08
Stones 9% Chemicals 9%
Others 37%
Steel Product 14%
Reefer Food Product 14%
Minerals 17%

Major trade partnersChina dominates as a partner on both export and import side when analysed by trade vol-ume (million tonnes). Although the US is the top export destination of Indian exports in value terms, it ranks third when export volume is concerned.
China had 15.7% of market share in India’s total containerised or containerisable exports in 2018 and has been consistently on the top position over the last decade. Bangladesh however, has increased its ranking in India’s export from 4th position in 2008 to 2nd position in 2018.
The US has consistently remained at the third position in India’s export market while export to Oman has increased in last decade. Oman was at the 33rd position in 2008 and reached 4th position in 2018.
Figure 5: Major commodities imported by India 2018
INDIAN CONTAINER MARKET REPORT- 2019
09
Others 42%
Minerals 7%
Paper & Paper Products 9%
Food Product 12%
Steel Product 14%
Chemicals 16%
Rank 2008 Rank 2018 Trend Country Share in India's total exports
1 1 China 15.7%
4 2 Bangladesh 6.5%
3 3 United States 6.0%
33 4 Oman 5.4%
17 5 Nepal 5.0%
2 6 United Arab Emirates 4.0%
5 7 Vietnam 3.7%
7 8 .Korea, Rep 3.3%
9 9 Saudi Arabia 3.1%
10 10 Malaysia 2.6%
59 11 Maldives 2.6%
8 12 Indonesia 2.3%
26 13 Qatar 2.0%
14 14 Thailand 1.9%
13 15 Italy 1.9%
6 16 Japan 1.7%
16 17 United Kingdom 1.6%
12 18 Belgium 1.5%
11 19 Sri Lanka 1.5%
18 20 Netherlands 1.3%
Source: UNCOMTRADE database, August 2019, compiled byDrewry Maritime Research
Ranking improvedNo Change in Ranking Ranking decreased
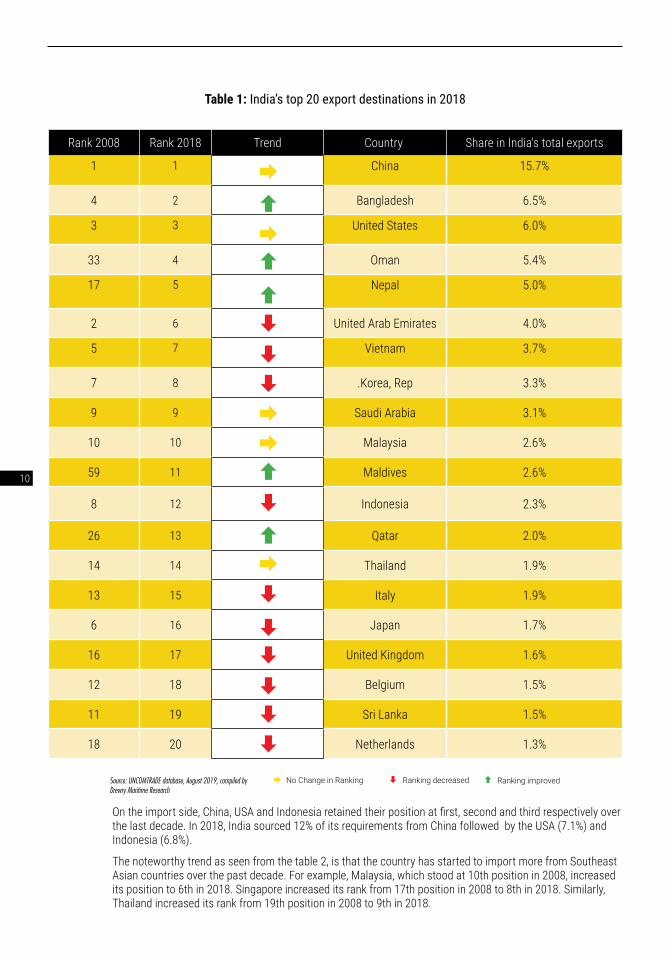
Table 1: India’s top 20 export destinations in 2018
On the import side, China, USA and Indonesia retained their position at first, second and third respectively over the last decade. In 2018, India sourced 12% of its requirements from China followed by the USA (7.1%) and Indonesia (6.8%).
The noteworthy trend as seen from the table 2, is that the country has started to import more from Southeast Asian countries over the past decade. For example, Malaysia, which stood at 10th position in 2008, increased its position to 6th in 2018. Singapore increased its rank from 17th position in 2008 to 8th in 2018. Similarly, Thailand increased its rank from 19th position in 2008 to 9th in 2018.
10

Rank 2008 Rank 2018 Trend Country Share in India's total imports
1 1 China 12.1%
2 2 USA 7.1%
3 3 Indonesia 6.8%
8 4 UAE 5.9%
6 5 South Korea 4.9%
10 6 Malaysia 4.3%
9 7 Saudi Arabia 3.7%
17 8 Singapore 3.2%
19 9 Thailand 2.7%
18 10 Iran 2.6%
16 11 Japan 2.4%
37 12 Brazil 2.4%
12 13 Ukraine 2.4%
5 14 Canada 2.3%
51 15 Bhutan 2.1%
7 16 Oman 2.1%
4 17 Russia 2.0%
13 18 UK 1.7%
33 19 Argentina 1.7%
56 20 Vietnam 1.6%
Ranking improved Source: UNCOMTRADE database, August 2019, compiled byDrewry Maritime Research
Ranking decreasedNo Change in Ranking
Table 2: India’s top 20 import sources in 2018
INDIAN CONTAINER MARKET REPORT- 2019
11

As discussed above, Minerals is the product group which has the highest share in India’s exports. More than 63% of the total mineral exports are concentrated to top five countries. They are: China, South Korea, Saudi Arabia, Japan and the USA.
Reefer food products are the second largest exported product. Middle East and North Africa regions are the major demand drivers for Indian meat. They import more than half of the reefer products that India exports, Oman being the largest consumer. Among counties in other regions, Maldives is the major consumer of India’s reefer product.
TOP COMMODITY-PARTNER MATRIX
12

Rank 1 Rank 2 Rank 3 Rank 4 Rank 5 World Exports
Top 5 share
Minerals China South Korea Saudi Arabia Japan USA
7.8 1.7 1.2 1.0 0.9 19.8 63.3%
Reefer food Products
Oman Maldives Qatar Vietnam UAE 5.3 2.2 0.9 0.9 0.6 15.6 63.8%
Steel Products
Nepal UAE Italy USA Belgium 2.3 1.1 1.1 0.8 0.8 15.6 38.5%
Chemicals China Saudi Arabia Malaysia USA Indonesia
2.4 0.7 0.6 0.6 0.6 10.4 46.7%
Stones China Bangladesh Maldives UK USA
4.2 3.2 0.7 0.6 0.2 10.1 88.0%
Fabric/Yarn China Bangladesh Pakistan USA Turkey
0.9 0.7 0.4 0.3 0.3 5.3 50.6%Polymer and polymer Products
China USA Italy Turkey UAE
0.9 0.3 0.2 0.2 0.2 4.6 39.6%
Sugar Sudan Myanmar Sri Lanka Somalia Netherlands
0.6 0.4 0.3 0.3 0.2 3.3 53.5%
Ceramic Products
Saudi Arabia Nepal UAE Iraq Oman
0.4 0.2 0.2 0.1 0.1 2.9 35.8%
Ores and concentrates
Nepal China Saudi Arabia Bangladesh Japan 0.8 0.3 0.2 0.2 0.1 2.3 69.8%
Table 3: India’s top exported products and their respective top destinations, 2018 (million tonnes)
INDIAN CONTAINER MARKET REPORT- 2019
Source: UNCOMTRADE database, August 2019, compiled by Drewry Maritime Research
13
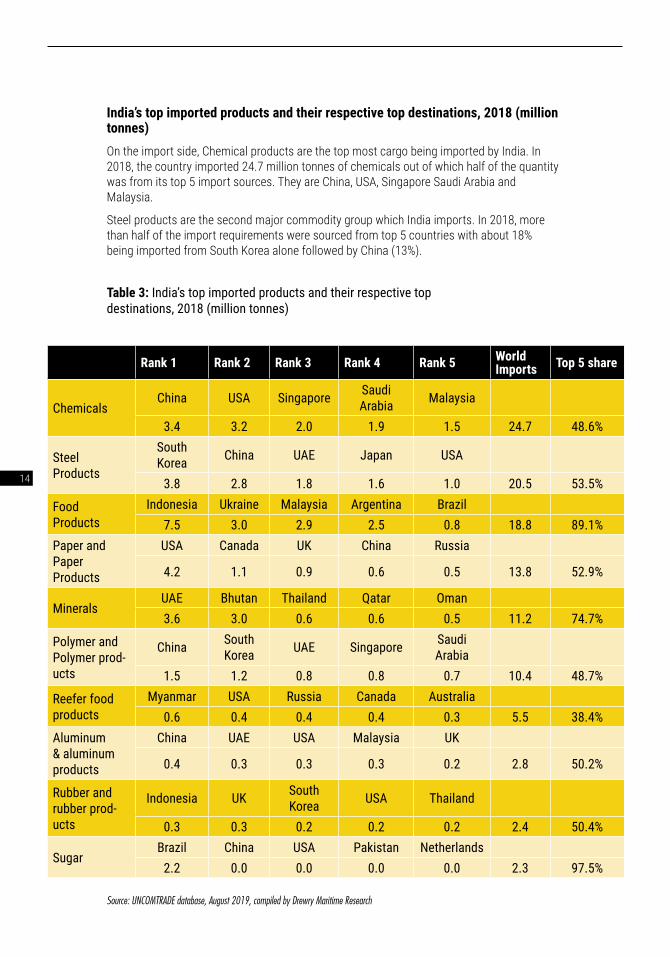
Table 3: India’s top imported products and their respective top destinations, 2018 (million tonnes)
Rank 1 Rank 2 Rank 3 Rank 4 Rank 5 World Imports Top 5 share
Chemicals China USA Singapore Saudi
Arabia Malaysia
3.4 3.2 2.0 1.9 1.5 24.7 48.6%
Steel Products
South Korea China UAE Japan USA
3.8 2.8 1.8 1.6 1.0 20.5 53.5%
Food Products
Indonesia Ukraine Malaysia Argentina Brazil 7.5 3.0 2.9 2.5 0.8 18.8 89.1%
Paper and Paper Products
USA Canada UK China Russia
4.2 1.1 0.9 0.6 0.5 13.8 52.9%
Minerals UAE Bhutan Thailand Qatar Oman 3.6 3.0 0.6 0.6 0.5 11.2 74.7%
Polymer and Polymer prod-ucts
China South Korea UAE Singapore Saudi
Arabia
1.5 1.2 0.8 0.8 0.7 10.4 48.7%
Reefer food products
Myanmar USA Russia Canada Australia 0.6 0.4 0.4 0.4 0.3 5.5 38.4%
Aluminum & aluminum products
China UAE USA Malaysia UK
0.4 0.3 0.3 0.3 0.2 2.8 50.2%
Rubber and rubber prod-ucts
Indonesia UK South Korea USA Thailand
0.3 0.3 0.2 0.2 0.2 2.4 50.4%
Sugar Brazil China USA Pakistan Netherlands
2.2 0.0 0.0 0.0 0.0 2.3 97.5%
Source: UNCOMTRADE database, August 2019, compiled by Drewry Maritime Research
India’s top imported products and their respective top destinations, 2018 (million tonnes)On the import side, Chemical products are the top most cargo being imported by India. In 2018, the country imported 24.7 million tonnes of chemicals out of which half of the quantity was from its top 5 import sources. They are China, USA, Singapore Saudi Arabia and Malaysia.
Steel products are the second major commodity group which India imports. In 2018, more than half of the import requirements were sourced from top 5 countries with about 18% being imported from South Korea alone followed by China (13%).
14

INDIAN CONTAINER MARKET REPORT- 2019
Figure 6: Trade route-wise average vessel size calling at Indian ports (teu)
With the increase in cargo volume and the proliferation of private ports in India, the nominal shipping capacity has increased over the years.
India is on the main east-west trade route (Asia-Europe) and the average vessel size calling at Indian ports has also increased. The average vessel size at Indian ports was 3,715 teu in 2011, which strengthened to 6,239 teu in 2018 and to 6,685 teu in 2019. An illustration of average vessel sizes for major trade lanes is shown in the figure below.
SHIPPING CAPACITY – AVERAGE VESSEL SIZE AT INDIANPORTS
2018 2019
5,3236,473
3,6614,054
7,7018,585
6,794 6,581
9,3167,849
6,6865,858
Asia-South Asia Asia-South Asia, South Asia-North
America
Middle east / South
Asia-Africa
South Asia Europe
South Asia-North America
Asia-South Asia Middle East / South Asia
Africa
15

Even though the government has granted Infrastruc-ture status to Logistics, still industry is chasing to find the actual logistics cost which is high for
both imports and exports making them uncompetitive in the global markets. Government is aiming to reduce logistics cost to less than 10 per cent by 2022 but until digitalization gets implemented at every vertical of the Logistic value chain along with elimination of unnecessary intermediaries, it will be a herculean task to achieve. However, India’s logistics cost has been standing high, making products costlier.
The reason behind different views and approaches in calculating logistic cost value is the many interme-diaries involved in moving cargo. It could be difficult to bring together for calculating all the variable cost components involved in it. The industry has given such enormous impetus to the intermediary service provid-ers who impose high charges that ultimately need to be borne by shippers. Deriving the logistic cost from many unorganized players across the value chain of EXIM cycle is arduous. The value always varies based on many variable components like terminal handling charges, customs charges, sea freight charges, cargo
consolidation charges, forwarder & CHA charges, stor-age charges, haulage charges, dry port charges, land transportation, mode of transportation, intermediary charges…etc.
Logistic cost is being calculated till now based on the percentage on total GDP. Another argument raised in the industry is that it should be calculated on the basis of consignment. Logistics cost to the GDP in the US (9.5 per cent) and Germany (8 per cent). If Logistic cost need to be calculated on the basis of GDP then services industry alone contributes more than 50 per cent to the GDP, which cannot be the best practice to follow.
Industry has been under the assumption that it could be anywhere in between 13-18 per cent based on the value that is floating around in the trade without any strong base. The global average is hovering in between 6-9 percent. Estimated logistic cost for some bulk car-goes like coal and cement is 17-18 per cent. In case of agri produce logistics cost is in between 25-30 percent, and for electronic goods it is 13-17 percent. Pharma-ceutical and biotechnology industries logistic cost is always on upside as the majority of the pharma hubs and clusters are located in southern part and cargo
THE DILEMMA OF HIGHLOGISTICS COST16

INDIAN CONTAINER MARKET REPORT- 2019
moves by truck to western ports with empties in return. Similarly in terms of domestic cargo movement in India, automobile manufacturing zones are in northern part of India and consumption centres are in southern India. In terms of exports, cargo generating centres location plays vital role in some cases in determining the logistic cost as if the distance between hinterland and gateway port is high, thus keeps logistics cost on higher side.
Also, the logistics division is likely to map out the most cost and time effective modes across India through a digital platform. After all, why should the costlier road-ways be allowed to capture 60-70 per cent of India’s freight, where in the Indian Railways handles less than half of the road traffic with 20-30 per cent , or 1.1 billion tonnes of freight, even though the rail is a cheaper mode of transport for journeys beyond 500 kilometres. cargo movement from NCR Delhi region to Mundra by road costs double inland transportation costs when compared to exports.
There is a dearth of digital platforms which can allo-cate the import boxes to the nearest exporters as and when demand arises to reduce the cost of repositioning empties to the exporters. In most of the cases, shipper need to bear empty return charges of the truck which is indeed an unnecessary expense that makes logistics expensive. It results from inefficiency on the part of multiple parties, and a lack of location-based planning. The current wastage or value loss in India’s transport ecosystem is around $80 billion, and it is expected the inefficiencies will go up, because 90 percent of the logistics business in India is unorganised, and is run by truckers who own one or two trucks.
Even after implementation of Goods and Services Tax (GST) to facilitate cargo producers and manufacturers to ease taxation it is not helping as expected, unless the transportation system run by different agents. The costs are not going to come down until there is an organized single window platform created for the benefit of trade to track and ensure the entire spectrum of cargo supply chain.
However, the logistics industry is on its way to becom-ing a $200-billion opportunity by 2020, and is expected to have eight primary warehouse hubs across India. Organised logistics ecosystem could lead to a boom in manufacturing, e-commerce and agriculture. However, this would first require estimating demand and organis-ing the road and rail network. The railways is stepping up its act by doubling its capex plan. But the bulk of goods continue to move by road and the logistics in-dustry continues to be dependent on small-time agents and truckers. There is a need to estimate the demand from one city to another, so that trucks and rail racks do not have to ply empty.
The situation in India will be no different. Logistics ser-vice providers/CHAs/ small trucking and shipping firms must look to upgrade their skill for the new environ-ment. India’s logistics costs are 40 per cent higher than in most developed countries. A reduction will result in more competitive goods and services, resulting in more trade and commerce. Changes in the logistics sector will deeply integrate India with global supply chains.
Factors affecting logistic cost and time
The logistic cost can be derived from direct and indirect costs involved in carrying export or import cargo. Direct cost is incurred in the process of moving goods, such as sea freight, inland transportation cost, warehousing cost, storage cost, and value-added services. Indirect costs are nothing but hidden charges which include inventory carrying costs, theft, pilferage, damages and losses in transit which account for 30-40 per cent of
CountriesLogistics Cost Percentage of
GDP
GDP -2018 (in USD)
India 14.0% 27,26,322.62US 8.0% 2,04,94,099.85
China 9.8% 1,36,08,151.86Singapore 8.0% 3,64,156.66Germany 8.6% 39,96,759.29Denmark 6.1% 3,51,299.59France 9.5% 27,77,535.24Sweden 7.3% 5,51,031.68
25000000
20000000
15000000
10000000
5000000
0
16.0%
14.0%
12.0%
10.0%
8.0%
6.0%
4.0%
2.0%
0.0%
India
GDP - 2018 (in USD) Logistics Cost Percentage of GDP
US China
Singap
ore
German
y
Denmark
Franc
e
Sweden
17

India’s total logistics costs. Indirect costs are caused by inefficiencies in the supply chain, which will be less than 10 per cent of the total in developed countries.
Total inland transit time till loading on vessel can vary from 6-14 days for an export container from NCR Delhi to nearby ports, while the same for a similar route in China would be 4-6 days. Even though transit time and cost is high in India, this directly increases inventory carrying cost. Improvement in supply chain procedures and increasing the transparency can cut inventory costs up to 40-60 per cent.
The logistic cost for agriculture produce is about 25-30 per cent and exposes the inefficiencies in the agricul-tural supply chain, such as insufficient transportation, warehouses, cold storage.
Another major challenge that adds cost in road trans-portation is the poor quality of roads, trucks and driv-ers. Road transportation accounts more than 60-70% of inland cargo movement in India, hence better roads can decrease logistic cost significantly. There is a shortage of around 20% in commercial drivers. Low skill levels and less experience of drivers can create more delays and damages which increases indirect costs.
Indian Logistic Performance
India jumped to 44th rank in 2018 from 54th rank in 2014 in terms of overall logistics performance based
on 6 pre-defined parameters defined by World Bank.
Under National Logistic Index Gujarat and Punjab in west coast and Andhra Pradesh in east coast are best performing states based on parameters such as the competitiveness of pricing, timeliness and availability of infrastructure and that of services, among others.
Sagarmala Projects
Under this programme, government is going to invest Rs. 8.8 lakh crore in more than 605 projects. Out of these, 89 projects worth Rs. 0.14 lakh crore are com-pleted and 443 projects worth Rs 4.32 lakh crore are under various stages of implementation and develop-ment. Sagarmala Programme aims to promote port-led development with a view to reducing logistics cost for EXIM and domestic trade.
Reduction in Logistic cost between India & Bangladesh trade
India and Bangladesh agreed to find out the technical feasibility to operate Dhulian - Rajshani protocol route up to Aricha and the reconstruction and opening up of Jangipur navigational lock on river Bhagirathi subject to the provisions of the Treaty between India and Ban-gladesh on Sharing of Ganga Waters at Farakka, 1996. This move has the potential to reduce the distance to Assam by more than 450 kms on the protocol routes.
2.72
3.11
2.88
2014 2016 2018
3.23.03
3.34 3.36 3.39
2.91
3.213.13
3.51 3.52 3.74 3.53.32
3.17
54
3.08
2014 2016 2018
35
3.42 3.18
44
2.96
2014
2014
2016
2016
2018
2018
Customs
Tracking & Tracing
Infrastructure International Shipments
Logistics Competence
Timeliness
LPI ScoreLPI Rank
18

To bring about significant reduction in logistics cost and faster delivery of Bangladesh export cargo, Indian side raised the point regarding permitting ‘Third coun-try’ EXIM Trade under Coastal Shipping Agreement and PIWTT by allowing transhipment through ports on the East Cost of India. Bangladesh agreed to hold stake-holder consultations and revert on the matter.
The following Agreement/Standard Operating Procedure (SOP) were signed by the two countries.
• To facilitate connectivity to North Eastern States through Kolkata and Haldia ports, movement of EXIM cargo and reduce logistic costs, an agree-ment on the use of Chattogram and Mongla Port for movement of goods to and from India between the people’s Republic of Bangladesh and the Republic of India.
• To open up connectivity for passengers and tourists from the two countries through Indo-Bangladesh
INDIAN CONTAINER MARKET REPORT- 2019
Protocol route, a Standard Operating Procedure (SOP) of MoU on Passenger and Cruise Services on the Coastal and Protocol route between India and Bangladesh.
• To add Pangaon from Bangladesh and Dhubri in Assam as new Ports of Call, an Addendum to the Protocol on Inland Water Transit and Trade (PIWTT).
India- Nepal
The Prime Ministers of India and Nepal are under consensus to introduce inland waterways connectivity between the two countries, Technical Scoping Missions have visited each other’s facilities and discussions have been held at Kathmandu and Kolkata. The devel-opment and training requirements of Nepal IWT sector, reduction of logistic cost, transshipment options through Sahibganj (Jharkhand) & Kalughat (Patna) to Nepal from Kolkata are on the anvil.
VARIABLE COST COMPONENTS - IMPORTS
Service Provider Cost ComponentsPort Names
JNPT (Cost) Mundra (Cost)
Shipping Line / Port/Terminal
Demurrage Charges USD 110/day/contr + USD 110/day/contr +
Detention Charges USD 110/day/contr + USD 110/day/contr +
Maersk - THC Rs 6,615 Rs 16,020
MSC -THC Rs 11,375/40” Rs 10,850/40”
CMA CGM - THC Rs 7,800 Rs 15,500
One Line - THC Rs 6,800- 7,950 Rs 12,500
Hapag-LIoyd - THC Rs 6,900 NA
B/E Charges Rs 2,800-4,500 Rs 2,800-4,500
Lift on/lift off - ICD cost INR 1,000-2,000 INR 1,000-2,000
Inland Transportation
Road transporation Cost INR 10,000 (ICD - Factory) INR 10,000 (ICD - Factory)
Energy Charges 20 ft - Rs 250, 40 ft - Rs 350
20 ft - Rs 250, 40 ft - Rs 350
Storage charges- Ground rental
After 15th day, Rs 350 - 20 ft, Rs 700 - 40 ft
After 15th day, Rs 350 - 20 ft, Rs 700 - 40 ft
Rail Transportation Cost INR 55,000-80,000/40” INR 55,000-1,00,000/40”
Dry ports ICD Charges INR 15,000/40 INR 10,000-15,000/40
19

VARIABLE COST COMPONENTS - EXPORTS
Service Providers Cost ComponentsPort Names
JNPT (Cost) Mundra (Cost)
Shipping Line
Demurrage Charges USD 60/day onwards USD 60/day onwards
Detention Charges USD 60/day onwards USD 60/day onwards
Maersk - THC Rs 6,615 Rs 16,020
MSC -THC Rs 9,020/40” Rs 15,740/40”
CMA CGM - THC Rs 7,800 Rs 15,500
One Line - THC Rs 6,800- 7,950 Rs 12,500
Hapag-LIoyd - THC Rs 6,900 Rs 10,750/40”
Dryport surcharges Rs 6,750/40” Rs 3,050/40”
B/L Charges Rs 2,800-4,500 Rs 2,800-4,500
Seal Charges(RFID) INR 150-200/seal INR 150-200/seal
Lift on/lift off - ICD cost INR 900-1100/40” (private yards) INR 15,000+/40” (CON-COR-LDH)
INR 900-1100/40” (private yards) INR 15,000+/40” (CONCOR-LDH)
Port/Terminal
Vessel related charges NA for shipper NA for shipper
Port Dues 0.1449 $ per GRT NA for shipper
Ground Rent 7-10 USD /box/day 7-10 USD /box/day
Inland Transportation
Road transporation Cost Rs 59,000-61,000 Rs 44,500-46,000
Energy Charges NA 20 ft - Rs 250, 40 ft - Rs 350
Storage charges- Ground rental
After 15th day, Rs 350 - 20 ft, Rs 700 - 40 ft
After 15th day, Rs 350 - 20 ft, Rs 700 - 40 ft
Rail Transportation Cost Rs 69,000 Rs 53,500
Documentation and Custom clearance cost
2000/contr 2000/contr
Forwarder
Forwarder Service Charges Rs 4,000-5,000 Rs 4,000-5,000
Document Correction Charges
Variable Variable
Cargo Consolidation Stuffing charges INR 900-1100/CBM THC NA
Other Costs Empty Repositioning Cost Up to 15,000 NA
20

INDIAN CONTAINER MARKET REPORT- 2019
21
COST VARIATIONS - SERVICE PROVIDERS
SHIPPING LINE CHARGES
SHIPPING LINE (Conditionality Charges)
INTERMEDIARIES CHARGES
• Sea Freight• THC• IHC• Documentation Charges• Survey Charges• Repairs, Washing & Cleaning • Imbalance Costs
• Sea Freight Mark up• Documentation Charges additional• Congestion Charges• LOLO Charge• CBL Pass thru Charge• Detention Invoice Release Charge• Warehouse Special Charge• Urgent Examination Expenses• CFS Nomination Charges• Empty Yard offloading• Cost Recovery Charges• Late DO Charges• CFS Receiving Charges• Supply Chain Security Charges• Transport Union Charge• NOC For HBL’s• Custom Clearance and duty• Agency Charges• Energy / Power Charges for Reeder Containers
• COD Charges• Detention• IGM Amendments• Port Congestion• Winter Season• VTMS Charges• ENS Charges• Do Revalidation Charges

ROAD TRANSPORTATION - COSTINGEXPORT
Delhi-MundraIMPORT
Mundra-Delhi (Rs)
Freight @1.15 on 26 MT 2,9900 (Freight @ 3.00 on 26 MT) 78,000
Expenses Diesel 400 liter @Rs 66.69 26,676 26,676
Toll tax 10,500
Driver per day Charge 4days@400 1,600 (Driver per day charge 6days @400)
Other factors are common. Like salary, wear and tear /maintenance
Total exp per trip 38,776 39,576
Gross Profit or loss -8,876 +38,424
Gross Profit of two way trip (Three trips Per Month)
+29,548 (Salary/Maintenance/Tire/road tax,
truck EMI paid from this
22
COST COMPARISION: FACTORY STUFFING BY TRUCK & CONCORBY CONCOR (Rs) BY TRUCK (Rs)
ICD-Factory in Delhi-ICD 10,000
THC Delhi ICD 8,500
Delhi –Mundra 43,500 29,900
CWC 11000 (Central Warehousing for container stuffing)
Mundra THC 11,000 8,500
Total 73,000 49,400
Refund of Taxes on Fuel 10,260 (Taxes on Diesel Rs 25.65 X 400 Ltr)
Cost after tax refund 73,000 39,140* (After tax refund)
Saving 28140 (If CWC avoided, by offering direct stuffing)
100% 38.54% (41%saving over CONCOR 55% saving if CWC avoided by DPE)
If return- Toll Tax 18,140*** (Toll tax Rs 10,000)
For cost-26 MT Rice value 18,20,000 4% 0.99%
Sea freight to main European Port $ 750X73 (Variable) 54,750 54,750
Cost of logistics for 26 MT Basmati Rice 1,27, 750 72,890 (After taking tax and CWC charges)
Logistic cost 7.01% 4.00%
*** When fuel and toll tax will return transporter try to re-adjust export and import dynamics. but definitely it will come down
This is not actual trip cost as wear & tear , deprication etc not inculded

23
Recommendations based on Shipper’s perspective1. Removal of repositioning cost of containers
2. Increasing the share of DPE similar to DPD can save approximately Rs 11,000 per FCL
3. TOLL TAX: Further, trucks from Delhi to Mundra can reach within 24-36 hrs (with two drivers) or average 48 hrs (With two drivers) from North India leaving hill states aside. With the fast track tags, now trucks normally won’t stop at Toll Plaza’s for much time. It is surprised to note that on 1200 KM route (Delhi to Kandla/Mundra), one side Total Toll Charges are said to be Rs 10,000-11,000 (Rs 8.33/
KM). Trucks make their profit on import cargo & lose money on export cargo to catch next import cargo as early as possible. For example Delhi –Mundra rate is Rs 1.15 per kg (26000 kg Rice X Rs1.15=29900) , while returning it will be Rs 2.5- 3.00 per kg (Rs 65,000-75,000 for same load)
Approximate saving: Any concession/refund on TOLL TAX up to Rs 10,000
In the present scenario, exporters are trading on paltry margins of 2-3% whereas service providers and intermediaries including Government agencies are betting on high profits.
INDIAN CONTAINER MARKET REPORT- 2019


I N D I A N C O N T A I N E R T E R M I N A L S
Container Terminal Name Called as Operated by Year of
CommissionDraft (m) Berths
Quay Length
(m)
Installed Capacity (TEUs)
Throughput Import share
Export share
Yard Area (Hectares)
Total Ground
Slots (TGS)
Reefer Plugs Quay Cranes
Rubber Tyred Gantry Cranes (RTGC)
Rail Mounted Gantry Cranes
(RMGC)
Reach Stackers Fork Lifts Capacity
Utilization(%)
APM Terminals Pipavav APMT-P APM Terminals Pipavav 2002 15.5 2 735 1,350,000 903,344 NA NA 36 3409 525 "3 Panamax and 5 Post Panamax" 20 4 9 2 67%
Mundra International Container Terminal MICT DP World 2003 14.5 2 631 1,500,000 835,825 NA NA 25 5400 366 "4 Super post panamax
and 2 Post panamax" 18 2 2 4 56%
Adani Mundra Container Terminal AMCT Adani Ports & SEZ Ltd 2007 15.5 2 631 1,200,000 1,051,298 46% 48% 24 4014 366 6 Super Post Panamax 20 NA 2 NA 88%
Adani International Container Terminal AICT JV of Adani Ports & SEZ Ltd
and MSC 2012 16.5 4 1460 3,000,000 1,918,070 49% 51% 65 13903 405 14 Super Post Panamax 45 3 3 NA 64%
Adani CMA Mundra Terminal ACMT JV of APSEZ and CMA
CGM SA 2017 16.5 2 650 800,000 740,786 48% 52% 28 6500 400 4 Super Post Panamax 12 NA 3 NA 62%
Adani Hazira Container terminal AHCT Adani Ports & SEZ Ltd 2012 13.0 2 637 1,200,000 559,330 49% 51% 20 3500 120 4 Post Panamax and 2
Super Post Panamax 12 NA 2 NA 47%
Kandla International Container Terminal KICTL ICTIPL & JM Baxi Group 2016 13.0 2 545 600,000 244,371 50% 50% 14 NA 48 4 Super Post Panamax 8 NA 4 NA 41%
Jawaharlal Nehru Port Container Terminal JNPCT Jawaharlal Nehru Port Trust 1989 14.0 3 680 1,350,000 1,056,368 NA NA 62 10482 576 9 Super Post panamax 27 5 11 3 78%
Nhava Sheva International Container Terminal
NSICT DP World 1999 14.0 2 600 1,200,000 560,661 NA NA 26 6222 778 6 Post Panamax and 2 Super Post Panamax 29 3 11 2 47%
Nhava Sheva India Gateway Terminal NSIGT DP World 2015 14.0 1 330 800,000 938,512 51% 49% 25 NA 336 4 16 3 1 NA 117%
APM Terminals Mumbai APMT-M APM Terminals and CONCOR 2006 14.0 2 712 2,000,000 2,048,454 53% 47% 30 9723 880 10 Post Panamax 40 3 2 6 102%
Bharat Mumbai Container Terminals BMCT PSA International 2018 16.5 3 1000 2,400,000 520,110 51% 49% 45 9366 1620 12 4 36 2 3 22%
New Mangalore Port - Containers NMPT-C New Mangalore Port Trust NA NA NA NA NA 131,613 49% 51% NA NA 150 Mobile Harbour cranes NA NA 3 NA NA
Mormugao Port - Containers MPT-C Mormugao Port Trust NA 13.1 1 250 NA 37,000 NA NA 2 489 84 2 Mobile Harbour
Cranes NA NA 2 NA NA
Vallarpadam International Container Transhipment Terminal
ICTT DP World 2011 14.5 2 600 1,000,000 594,592 51% 49% 61 2500 450 4 Super Post Panamax 15 NA 3 NA 59%
Paradip International Container Terminal PICT ICTIPL - JM Baxi NA 17.1 1 450 NA 13,000 NA NA 5 NA 15 3 Mobile Harbour Crane 2 NA 1 6 NA
Chennai Container Terminal CCTL DP World 2001 15.0 4 885 1,200,000 653,675 55% 45% 18 3960 355 8 Super Post Panamax 23 3 2 1 54%
Chennai International Terminal CITPL PSA Chennai 2009 15.5 3 832 1,200,000 963,167 58% 42% 28 5424 306 3 Post Panamax and 4
Super Post Panamax 18 NA 6 NA 80%
Adani Ennore Container Terminal AECT Adani Ports & SEZ Ltd 2017 18.0 1 400 1,400,000 56,987 74% 26% NA 4000 NA 4 Super Post Panamax
Cranes 12 NA 1 NA NA
Visakha Container Terminal VCTPL ICTIPL & DP World 2003 16.5 2 450 600,000 450,406 51% 50% 8 2500 204 2 Panamax and 2 Post
Panamax 10 0 5 3 75%
Navayuga Container Terminal NCT NCT 2012 16.5 3 650 2,000,000 506,168 45% 55% 36 5000 400 5 Super Post Panamax 9 0 16 2 25%
Kattupalli International Container Terminal KICT Adani Ports & SEZ Ltd 2013 14.0 2 710 1,200,000 592,399 34% 66% 18 5120 360 6 Super Post Panamax 15 NA 2 4 49%
Bharat Kolkata Container Terminal BKCT PSA International
Provides O & M services 1979 8.5 5 812 850,000 652,000 NA NA 13 3000 NA Mobile Harbour Cranes NA NA 9 NA 77%
Haldia International Container Terminal HICT ICTIPL - JM Baxi 1977 8.5 2 432 250,000 178,262 46% 54% 5 3000 NA 2 Panamax 4 NA 3 NA 71%
PSA SICAL Tuticorin Container Terminal TCT Sical and PSA International 1999 11.9 1 370 450,000 352,010 50% 50% 10 1000 84 3 Post Panamax 8 0 2 1 78%
Dakshin Bharat Gateway Terminal DBGT Dakshin Bharat Gateway
Terminal Pvt Ltd 2014 14.2 1 345 600,000 386,376 50% 50% 10 1725 112 3 (Twin) 9 0 2 1 64%
PSA - Kakinada Container Terminal KCTPL
Bothra Shipping, Kakinada Infrastructure Holdings and PSA Chennai Investments
2016 14.5 2 300 100,000 24,337 52% 48% 5 400 90 2 Post Panamax 0 0 2 NA 24%
Mumbai Port - Containers MbPT-C Mumbai Port NA NA NA NA NA 27,202 95% 5% NA NA NA NA NA NA NA NA NA

Names Volume Handled Annual Growth
APM Terminals Pipavav Medium High
Mundra International Container Terminal Medium Low
Adani Mundra Container Terminal High Medium
Adani International Container Terminal High High
Adani CMA Mundra Terminal Medium High
Adani Hazira Container terminal Medium High
Kandla International Container Terminal Low High
Jawaharlal Nehru Port Container Terminal High Low
Nhava Sheva International Container Terminal Medium Low
Nhava Sheva India Gateway Terminal Medium High
APM Terminals Mumbai High Low
Bharat Mumbai Container Terminals Medium High
New Mangalore Port - (Containers) Low High
Mormugao Port -Containers Low High
Vallarpadam International Container Transhipment Terminal Medium High
Paradip Port - Containers Low High
Chennai Container Terminal Medium Low
Chennai International Terminal Medium Medium
Adani Ennore Container Terminal Low High
Visakha Container Terminal Low High
Navayuga Container Terminal Medium Medium
Kattupalli International Container Terminal Medium High
Bharat Kolkata Container Terminal Medium Low
Haldia International Container Terminal Low High
PSA SICAL Tuticorin Container Terminal Low Low
Dakshin Bharat Gateway Terminal Low High
PSA - Kakinada Container Terminal Low High
Mumbai Port Low Low
Reference Volume(Mi TEUs)* Annual GrowthLow 0-0.5 <5%Medium 0.5-1 5-10%High >1 10%+
* Mi TEUs - Million Twenty Foot Equivalent Units
PERFORMANCE OF INDIAN CONTAINER TERMINALS (FY 2017-18)
28

INDIAN CONTAINER MARKET REPORT- 2019
29
APM TERMINALS MUMBAIGTI House, JNPT, Sheva, Navi Mumbai,Taluka - Uran, District Raigad,Maharastra - 400 707, India.Tel :+ 91 22 6681 1000
Terminal Address
THROUGHPUT 2,048,454 TEUINSTALLED CAPACITY 2,000,000 TEUCAPACITY UTILIZATION 102.5%OPERATOR APM TERMINAL & CONCOR
201920172016
-3.64%
-7.56%
13.13%
7.07%
1.01%
20182015
APM Terminals Mumbai recorded highest through-put among all Indian Container Terminals clocking
throughput of 2.05 million TEUs in FY 2018-19, con-secutively surpassing the 2 million handled volume for the second year. This terminal is considered to be the busiest terminal in the country with highest capacity utili-zation of 102.5 per cent. This terminal is a Joint Venture company of APM Terminals and the Container Corpora-tion of India (CONCOR) in a 74 percent and 26 per cent partnership, respectively. APMT Mumbai is stepping towards digitization which creates new opportunities. A Web portal was introduced by the terminal to enable ease of doing business for DPD customers in the FY 2018-19. Additional Service Request (ASR) is the new feature added to the online portal by the terminal. This feature will replace manual system and claims to be simple and transparent for customers.The terminal registered a growth of 1.01% against previous year volume being the high base of container volume handled. The gross crane productivity is 29.26 moves per hour and the berth productivity is 101.37 moves per hour. The terminal has acquired and installed 14 new RTGs with spreaders for the FY 2018-19. The Compounded annual growth rate (CAGR) for the last five years is 1.7%. Import volume is 1.08 million TEUs and export volume is 0.96 million TEUs with significant rise in in exports. The terminal handled transshipment volume of 28,884 TEUs in JNPT, along with Coastal volume of 31,075 TEUs with a sharp rise against last year volume. APM Terminals also welcomed Nhava Sheva – Mun-dra-Gulf (NMG) service, a weekly service connecting var-ious ports in middle east, its rotation is APM Terminals Mumbai – Mundra – Khalifa – Jebel Ali – Sohar.
The import and export services can be requested online, other services such as priority of delivery, seal fixing, inter-terminal transfers, empty container storage can be done through Additional Service Request (ASR). APM Terminals Mumbai has a competitive edge over its peers due to their grip over digitization of services. As a result, the company has enjoyed industry best productivi-ty rates and steady growth.
THROUGHPUT GROWTH Y-O-Y DURING FY 2015-19

ADANI INTERNATIONALCONTAINER TERMINAL
New Mundra PortNavinal, Mundra, Kutch - 370 421 Gujarat, India
Terminal Address
THROUGHPUT 1,918,070 TEUINSTALLED CAPACITY 3,000,000 TEUCAPACITY UTILIZATION 63.9%OPERATOR APSEZ LTD & MSC
AICTPL is a joint venture with APSEZ and Terminal Investment Limited (Terminal arm of Mediterranean
Shipping Company, the second largest shipping liner in the world). AICTPL has a total quay length of 1,460 me-ters and cargo handling capacity of 3 million TEUs with 15 Super Post Panamax Quay cranes and 45 eRTG. It is a transshipment hub for Middle East, south Asia and India. Due to its deep draft of 17 meters, it is capable of handling Ultra large container vessels (ULCV).AICTPL handled a throughput of 1.93 million TEUs in FY 2018-19 surpassing previous year volume of 1.57 Million TEUs registering an impressive growth of 23 percent. Growth in average berth productivity and growth in gross crane rate are 9% and 13% in FY 2018-19 respectively as compared to FY 2017-18. AICTPL has set new productivi-ty benchmark by successfully handling MSC MARGRIT. A total of 6797 moves / 9667 TEUs were safely completed surpassing the earlier record of 6286 moves in Sep-17 in MSC BRUXELLES. Equally important, new berth pro-ductivity (BMPH) record was achieved at 252.14 moves per hour in MSC ESTHI, surpassing the earlier record of 230.14 mph in Oct-18.AICT has achieved fully VMT Driven terminal operations. It also Implemented Remote Terminal In-gate, upgraded its Terminal Operating System from ACTOS to IPOS, initiated use of E-ITV for terminal operations which is in Testing Phase and Berth extension, deployment of addi-tional quay cranes are the ongoing expansions in it.
THROUGHPUT GROWTH Y-O-Y DURING FY 2015-19
30
20192017
34.41%
18.31%
8.93%
22.91%
34.38%
20182015 2016

INDIAN CONTAINER MARKET REPORT- 2019
31
JAWAHARLAL NEHRU PORTCONTAINER TERMINAL
Jawaharlal Nehru Port Trust1107, Raheja Centre, FPJ Marg,Nariman Point, Mumbai – 400021.
Terminal Address
THROUGHPUT 1,056,368 TEUINSTALLED CAPACITY 1,350,000 TEUCAPACITY UTILIZATION 78.2%OPERATOR JNPT
-28.71%
201920172016
7.33%10.45%
-3.40%-1.43%20182015
Despite being the largest major port by volume by crossing 5million TEUs of throughput in India, JNPT
Port owned and operated container terminal Jawaharlal Nehru Port Container Terminal (JNCPT) has registered negative growth in the last two financial years. Lack of digitalization at gate entry procedures and low quay crane productivity are major setbacks which are hinder-ing the growth of this terminal. There are some other key challenges attributed to the negative growth of the ter-minal which are longer lead time for import out-gate due to Equipment Interchange Receipt (EIR) generation at the gate. Its gate utilization is much lower than its peers due to longer processing time required for CISF seal number verification. Currently, its yard storage utilization is also lowest among all. However, JNPCT has already started working towards the improvement in these areas to ease the operations. The terminal handled container volume of 1,056,368 TEU’s for the FY 2018-19 with current handling capacity of 1,350,000 TEU’s per annum. Capacity utilization of the terminal is clocked at 78 per cent which requires expansion in the near future. The total traffic handled in March 2019 is 70,965 TEU’s which is approximately -36% less than the previous year volume for the same month. The compounded annual growth rate (CAGR) during last five years from FY 2014-15 to FY 2018-19 is -4.3%. Presently, JNPCT operates with 11 truck gates which includes five for exports, four for imports, and two for empty movement. Recently, JNPCT has upgraded its gate entry procedures for the ease of trailers and trucks which enter the port. The terminal implemented more-advanced electronic, radio frequency identification
technology (RFID) gate operating procedure. This will result in enhancement of gate productivity.The major improvement areas of the terminal are dual cycling, efficient yard planning, twin lifts quay cranes, quay crane operator skills and productivity enhancement through monetary incentives.
THROUGHPUT GROWTH Y-O-Y DURING FY 2015-19

32
THROUGHPUT GROWTH Y-O-Y DURING FY 2015-19
ADANI MUNDRACONTAINER TERMINAL
New Mundra Port,Navinal, Mundra, Kutch - 370 421Gujarat, India
Terminal Address
THROUGHPUT 1,051,298 TEUINSTALLED CAPACITY 1,200,000 TEUCAPACITY UTILIZATION 87.6%OPERATOR APSEZ LTD
Adani Mundra Container Terminal (AMCT) is owned and operated by Adani Ports and SEZ Ltd. The termi-
nal has been developed using the latest state of the art technologies and offers unparalleled services bench-marked to international standards. In FY 2018-19, AMCT has witnessed throughput of 1.05 million TEUs with a growth of 14 percent against previous year volume. The growth in Berth Productivity and the Gross Crane Rate are 14% and 12% respectively in FY 2018-19 compared to FY 2017-18. 544 vessels are handled in FY 2018-19 with a growth of 14 percent as compared to FY 2017-18. The terminal has also registered decent capacity uti-lization of 88 percent with sufficient installed capacity available for the trade. This terminal also handled 0.05 million TEUs of transhipment in its total volume handled in FY 2018-19. AMCT consists of two in-line berths with a total quay length of 631 metres and alongside draft of 15.5 metres. It also has the flexibility to handle double stack container trains for faster evacuation of containers to northern and western India.AMCT is true leader in port automation in the country, as it has Electrical RTG which are remotely operated. In this the operators work in a safe and ergonomic office environment and can operate different cranes at different times. AMCT has several other innovations to its credit like automated gate operations.This terminal has achieved a milestone by handling of M.V.EVER CONQUEST in may-19 by handling 5738 TEUs in just 29 hours of vessel’s port stay.
20192017
11.82% 11.05%
-7.05%
13.92%
6.01%
20182015 2016

INDIAN CONTAINER MARKET REPORT- 2019
33
Regus Citi Centre Level 6,Chennai Citi Centre,10/11, |Dr. Radhakrishnan Salai,Chennai - 600 004.INDIA+91 44 25613000
Terminal Address
THROUGHPUT 963,167 TEUINSTALLED CAPACITY 1,200,000 TEUCAPACITY UTILIZATION 80.3%OPERATOR PSA INTERNATIONAL
Chennai International Terminals Pvt Ltd (CITPL) in Chennai Port is a subsidiary of PSA International
(PSA), one of the leading global port groups. This terminal handled 0.96 million TEUs in FY 2018-19 sur-passing previous year volume of 0.87 million TEUs while registering 9.66 percent year-on- year growth. Import volume is 0.55 million TEUs increased by 7.4 per cent in FY 2018-19 compared to previous year volume of 0.51 million TEUs. Export volume is 0.39 million TEUs with 9.8 per cent growth in FY 2018-19 compared to previous year volume of 0.36 million TEUs. The terminal handled coastal volume of 10,773 TEUs. It is one of the most productive terminals on east coast of India with highest market share of 21%.The terminal recorded average turnaround time of 2.01 days with a growth of 13.93%, average output per ship berth day is 2566.32 TEU’s with a growth of 6.77% and average crane productivity is 28.59 moves per hour with a growth of 4.23%.CITPL has again raised the bar for terminal productivity in South and East India. Achieving a vessel rate of 171 moves per hour translates directly into cost savings for shipping lines and port users. This achievement surpassed the earlier South and East India record of 168 moves per hour, which was also set by CITPL in August 2016. The terminal handled 3,023 moves in just under 19 hours on 12 September 2019, for the 4,252 TEU (Twen-ty-foot Equivalent Unit) vessel “Wan Hai 507”.PSA’s Chennai International Terminals Pvt Ltd (“CITPL”) and Container Corporation of India (“CONCOR”) have relaunched shuttle trains between CITPL and Concor’s Tondiarpet Inland Container Depot (“TNPM”), with the
departure of a full rake of 80 twenty-foot equivalent units (“TEU”) from CITPL to TNPM at a distance of 7 km on 15th October 2018 (operational from 1st May 2018).CITPL and CONCOR enhanced Last Mile Connectiv-ity with relaunch of rail bridging from CITPL to ICD Tondiarpet at distance of 7 km. CITPL can handle two rakes simultaneously and has been handling regular train services plying to and from ICD Whitefield.
201920172016
3.98%
21.43%
-3.03% -3.39%
9.66%
20182015
CHENNAI INTERNATIONAL TERMINALS PVT LTD
THROUGHPUT GROWTH Y-O-Y DURING FY 2015-19

34
NHAVA SHEVA INDIAGATEWAY TERMINAL
Operation Center, Sheva,Navi Mumbai- 400707. INDIA+ 91 22 5590 1234
Terminal Address
THROUGHPUT 938,512 TEUINSTALLED CAPACITY 800,000 TEUCAPACITY UTILIZATION 117.3%OPERATOR DP WORLD
201920172016
119.94%
46.42% 44.04%
20182015
Nhava Sheva (India) Gateway Terminal (NSIGT) is one of the two terminal concessions DP World holds
at Jawaharlal Nehru Port Trust (JNPT), India’s busiest container harbor. DP World considers this terminal as its futuristic investment and trade enabler in India’s emerg-ing market economy.This terminal recorded handling parcel size of 4,568 Moves i.e. 6,017 TEU’s with a remarkable Gross Crane Rate of 34.5 moves per hour. As this terminal boast an addition of a new feather in to DP world’s portfolio of terminals in India with exponential growth year-over-year. The Terminal is equipped with the largest and most ad-vanced remote-operated quay cranes, automated gates powered by Optical Character Recognition (OCR) tech-nology, an advanced Reefer Monitoring System and revo-lutionary Electrical Rubber-Tyred Gantry cranes (E-RTGs). The terminal registered throughput of 9.38 lakh TEU’s for the FY 2018-19 which has grown by 44% compared to previous year. The average gross crane productivity is 31.3 moves per hour for the current financial year.NSIGT is first in India to use “Remote Quay Cranes Operations Capability”. A 24x7 RFR monitoring with no human interface is installed which increases efficiency of recording temperature and reducing errors.Automated Gates with OCR technology at NSIGT ensures uninterrupted gate transactions. The OCR and RFID technology has resulted in faster gate turnaround time, reducing errors and improving data accuracy at contain-er gates. A Smart Control Room (Video Wall) has been installed at NSIGT that includes advanced Video Wall with integrated
systems and communications features for real-time governance, operations monitoring and exceptional man-agement to gain efficiency from a single location within the Operations Centre. It also has a system to enable constant two-way communications to provide high-visi-bility of entire operations on a real-time basis.NSIGT has overtaken NSICT in terms of volumes in 3 years. DP world is diverting its business to NSICT as the terminal is more commercially beneficial than NSICT.
THROUGHPUT GROWTH Y-O-Y DURING FY 2015-19

INDIAN CONTAINER MARKET REPORT- 2019
35
THROUGHPUT GROWTH Y-O-Y DURING FY 2015-19
APM TERMINALS PIPAVAVPost Uchaiya via RajulaDistrict Amreli, Gujarat 365 560. IndiaT +91 2794 302400
Terminal Address
THROUGHPUT 903,344 TEUINSTALLED CAPACITY 1,350,000 TEUCAPACITY UTILIZATION 66.9%OPERATOR APM TERMINALS - PIPAVAV
Digitization is the new trend that terminals follow to save time and improve efficiency. The latest digital solution from Pipavav terminal is e-form 13, the online version of Form-13(gate-in permits issued by terminals). This will save both paper and time.
APM Terminals Pipavav (APMT Pipavav) is a part of APM Terminals global terminal network, currently
has 1.35 million TEU’s of capacity. The Container volume is increased by 29 per cent in FY 2018-19 on account of new service additions with the healthy mix of EXIM, Transshipment and Coastal volumes. The compounded annual growth rate of container volume for the last five years during FY 2014-2019 is 5.6 per cent. The company also registered positive growth in terms of consolidated income during the April-June quarter in FY 2019-20 at Rs 189.9 crore from Rs 186.6 crore in the year-ago same period.APMT Pipavav has streamlined shift changes, which is a key change to boost efficiency. Shift changes are made 15- 20 minutes faster. This measure led to reduction in vessel idle times and impact on cranes per hour is reduced around 16 per cent. Clearly marked parking bays make sure that terminal trailers are parked at an angle and in a line, which results in reduction of exit time for drivers. The terminal has also introduced parking pro-cess for RTG’s contributed to higher efficiency. A parking process for Rubber Tyre Gantry cranes (RTGs) was also introduced at the end of the yard block. This has reduced pedestrian hazards for RTGs while executing shift change for operators. Pedestrian hazards for Rubber Tyre Gantry cranes (RTGs) are reduced due to implemen-tation of parking process for RTG’s.New rail connectivity named POLYMER express was established by CONCOR from ICD Kanpur (JRY) to Port Pipavav to help exporters and importers move their cargo faster. Weekly scheduled block train which has a capacity of 180 TEUs was started by CMA CGM from port Pipavav to Garhi Harsaru (NCR Region). This will help the trade to optimize the supply chain.
20192017
15.45%
-12.48%
-4.50%
28.50%
5.97%
20182015 2016

MUNDRA INTERNATIONALCONTAINER TERMINAL
Mundra International container terminal (MICT) is one of the DP world’s operated terminal in the
largest private port in Gujarat, Adani Mundra port. This terminal has been surrounded by three Adani owned and partnered container terminals. The terminal has recorded negative growth of 22.7 per cent in FY 2018-19 with handled volume of around 0.835 million TEU’s. The compounded annual growth rate (CAGR) during FY 2014-15 to FY 2018-19 is -3.6 per cent.MICT has handled more than 11 million TEUs since it commenced its operations in 2003. The terminal steadily invested in infrastructure and technology to provide faster and cost-effective trade. MICT added a remotely controlled rail-mounted gantry crane and electrified rub-ber-tyred gantry cranes. This terminal features a berth length of 2,073 feet, a 48-foot draft, a 59-acre storage yard, and dedicated rail-road connectivity. MICT has attained a new milestone of highest berth productivity which is approximately 179.38 shipshore moves i.e. 1.29 times higher than average berth produc-tivity. It has stood in top quartile of the best performing container terminals globally by achieving average gross crane rate (GCR) at approximately 34.3 moves per hour. The terminal also achieved highest berth productivity i.e approx. 208 shipshore moves for another vessel deployed under service connected to East Africa.This terminal emphasis continues to be on enhancing its productivity by constantly modernizing terminal infrastructure and IT systems to provide faster and cost effective trade solutions to our customers. The terminal focus continues to be on facilitating a reliable and swift
flow of cargo, thus making its customers’ product reach the market faster, reduce the cost of logistics and im-prove effectiveness of the supply chain in North Western India.
New Mundra PortNavinal, Mundra, Kutch - 370 421 Gujarat, India
Terminal Address
THROUGHPUT 835,825 TEUINSTALLED CAPACITY 1,500,000 TEUCAPACITY UTILIZATION 55.7%OPERATOR DP WORLD
-22.56%
2015
-6.05%
1.94%
2018 201920172016
16.55%
THROUGHPUT GROWTH Y-O-Y DURING FY 2015-19
36

INDIAN CONTAINER MARKET REPORT- 2019
37
ADANI CMA MUNDRATERMINAL
ACMTPL Operations Building, Post Box -1, South Port, APSEZ, near Navinal Island, Kutch, Gujarat.
Terminal Address
THROUGHPUT 740,786 TEUINSTALLED CAPACITY 1,200,000 TEUCAPACITY UTILIZATION 61.7%OPERATOR AP SEZ LTD & CMA CGM SA
Declared, as a Pedestrian Free terminal, the first of its kind in country, this state of the art and technology
savvy container terminal, ensures premium service quality to its customers. This terminal is an amalgam of partnership between APSEZ, the largest Indian port oper-ator and CMA-Terminal, the world’s 4th largest shipping conglomerate.The container terminal which has a total installed capacity of 8,00,000 TEUs (with 4 QCs, 12 RTGs, 3 Reach stackers and 1 Empty Container Handler) has added another 4,00,000 TEUs (2 QCs and 5 RTGs) capacity in the last financial year. The terminal handled a throughput of 740,786 TEU’s with a growth of around 42% for the FY 2018-19. The total yard area is 27.27 hectares.The terminal is a true leader in overall operational excel-lence as the capacity utilization rate is at about 61.7% and it improved growth in average turnaround time (YOY) by 13% and average output per ship berth day by 30% and significantly improved its average crane movements per hour. Its dedicated, highly skilled and motivated work force, has been consistently delivering a gross crane rate of 30+ moves per hour and Truck Turn Around of less than 30 mins.It’s new, state of the art QCs boast of latest technolo-gy with 65 meters’ outreach, 18 meter back reach, 50 meters’ lift height, 35 meters’ span. It implements laser guided anti-collision system – crane to crane, crane to ship. Cameras are fitted with recording facility at the terminal for effective monitoring of operations. Fire sup-pression system is an added advantage. Each crane has a dedicated man cage and over height frame for safety
purpose. These cranes have the potential to handle the largest containerships afloat in the world right now. The terminal operator has also implemented various technological upgradations and several innovative tech-niques during the financial year. E- Survey at gate along with Pole Seal Cam is one of such initiatives. Surveyors are equipped with the pole seal cam, which enables them to read the seal number from a distance without going in the path of the traffic. The terminal also implement-ed electric seal cutter to remove seals on the empty containers for its survey which saves lot of time. The company is also working on a new Terminal Operating System and is experimenting on few innovative ideas and latest technologies on a pilot basis.The terminal provides the gateway connectivity to Europe, Middle East, U.S.A, Africa and south Asia, Africa and all along the coastal ports of the Indian subconti-nent.

CHENNAI CONTAINERTERMINAL
Chennai Port Trust Administrative Building,Ground Floor, 1 Rajaji Salai, Chennai, Tamil Nadu-600001
Terminal Address
THROUGHPUT 653,675 TEUINSTALLED CAPACITY 1,200,000 TEUCAPACITY UTILIZATION 54.5%OPERATOR DP WORLD
Chennai Container Terminal (CCT) is a state-of-the-art terminal operated by DP world to cater for growing
local demand for traded goods. The terminal can berth vessels up to 9,000 TEUs with a recent call of CMA CGM. CCT serves to China, West Africa, Europe and US for the export and import needs of the city and its hinterland. This terminal also features a container freight station, with a covered area of 6,500 square metres also enables transshipment of cargo to inland destinations such as Bangalore, Hyderabad, Cochin, Pondicherry and the wider region. Meanwhile, its container rail service (CRRS) provides customers services beyond the terminal gate into our customers’ logistics chain across India’s vast hinterland. CCT need to increase the yard equipment to balance the dockside operations and the yard operations to ensure smooth flow of containers. There is also a need to provide additional yard space for CCT.CCTPL handled 0.65 million TEUs in FY 2018-19 with a paltry growth of 1 per cent against previous year volume of 0.64 million TEUs. Import volume is 3,56,370 TEU’s and Export volume is 2,92,035 TEU’s and the terminal handled 381 vessels, along with transshipment volume of 452 TEUs. Capacity utilization of the terminal is 54.4 per cent. CCTPL handled total of 2,73,747 TEU’s with Imports of 1,45,238 TEU’s and Exports of 1,28,509 TEU’s upto the mid of September 2019 for the current financial year 2019-20Global trade enabler, DP World operated CCT has achieved yet another landmark by safely berthing MV CMA CGM RHONE, the largest container vessel to visit India’s south and eastern coast, calling on Chennai Port. Another 299.95m long Malta container vessel has a
capacity of 9,365 TEU also docked at this terminal. The vessel arrived from Singapore, with 2,434 TEU of imports and loaded 1,345 TEU of exports. It is one of the 14 ships deployed on the NEMO (North Europe Med Oceania) service run by CMA CGM and Hapag Lloyd.
201920172016
0.03%
12.36%
5.04%
-25.50%
1.11%
20182015
THROUGHPUT GROWTH Y-O-Y DURING FY 2015-19
38

Bharat Kolkata Container Terminals Pvt. Ltd.,6A Middleton Street, 8th Floor, Chhabildas Tower, Kolkata 700071Telephone : (033) 40373800
Terminal Address
THROUGHPUT 652,000 TEUINSTALLED CAPACITY 850,000 TEUCAPACITY UTILIZATION 76.7%OPERATOR KOLKATA PORT TRUST (PSA INTERNATIONAL O & M CONTRACTOR)
PSA’s container terminal at Kolkata Port, Bharat Kolkata container terminal (BKCT) has registered
652,000 TEU’s for the FY 2018-19 a growth of 1.85% compared to FY 2017-18 which handled 640,182 TEU’s. Competition from the Vizag port is intensifying in terms of handling third country cargo of Nepal and so BKCT is taking slew of measures to bring back the lost cargo of Nepalese importers by improving transparency, reducing the turnaround time and ironing out procedural hassles. This terminal is situated at a distance of 704 kilometres from Nepal’s only rail-linked Inland Clearance Depot, Birgunj. BKCT is nearest container terminal to Nepal by distance as even Haldia is also located around 100 km faraway from Nepal compared to BKCT. There are other ICDs coming up in the borders of India- Nepal to serve the increasing demand of cargo movement in between these two countries. At KDS about 40,000 sq. meters of additional hard standing area was added in last FY 2018-19, which takes the total area of container terminal to 1.45 lakh sq.m. Another 45,000 sq. meters is to be redeveloped in FY 2019-20. A 140 plug reefer park will be coming up soon at KDS taking total number of reefer plugs in the terminal to 300.KDS had 168 Coastal calls for container vessels from and to the upcoming transhipment hubs in Eastern Port and Bangladesh. About 47 calls were to Bangladesh Ports of Chittagong and Panagaon. 101 calls were from/to Navayuga Container Terminal and the rest were to/from Vizag. Regarding the foreign Vs coastal carriers, at Kolkata, the terminal has witnessed some of the foreign vessels
handling coastal runs after the cabotage relaxation. Presently about 4 services perform coastal runs on foreign flagged vessels per month to other eastern ports from Kolkata. Overall in FY 2018-19, 57 coastal calls were made on foreign vessels to/from Kolkata. Apart from the usual gains stated from Cabotage relax-ation giving impetus to coastal shipping, the biggest gain that this has brought is the reduced time for a vessel to complete a voyage.
BHARAT KOLKATA CONTAINER TERMINAL
201920172016
0.68%
17.55%
10.20%9.25%
1.85%
20182015
THROUGHPUT GROWTH Y-O-Y DURING FY 2015-19
INDIAN CONTAINER MARKET REPORT- 2019
39
Willingdon Island, N.End, Cochin -682009 Kerala
Terminal Address
THROUGHPUT 594,592 TEUINSTALLED CAPACITY 1,000,000 TEUCAPACITY UTILIZATION 59.5%OPERATOR DP WORLD
201920172016
12.57%
5.83%
14.51%
9.04%
15.46%
20182015
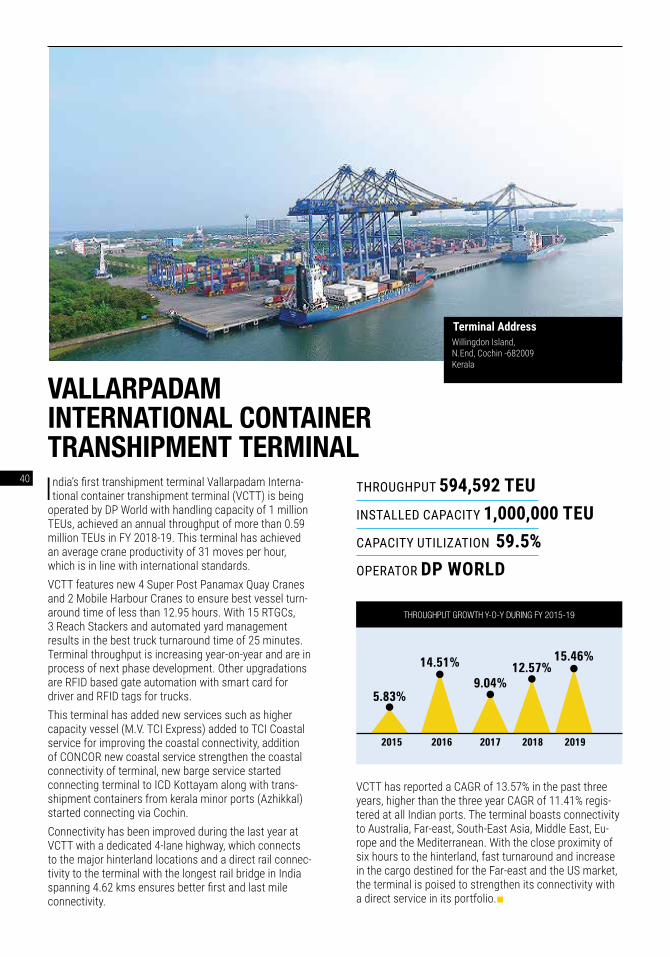
India’s first transhipment terminal Vallarpadam Interna-tional container transhipment terminal (VCTT) is being
operated by DP World with handling capacity of 1 million TEUs, achieved an annual throughput of more than 0.59 million TEUs in FY 2018-19. This terminal has achieved an average crane productivity of 31 moves per hour, which is in line with international standards.VCTT features new 4 Super Post Panamax Quay Cranes and 2 Mobile Harbour Cranes to ensure best vessel turn-around time of less than 12.95 hours. With 15 RTGCs, 3 Reach Stackers and automated yard management results in the best truck turnaround time of 25 minutes. Terminal throughput is increasing year-on-year and are in process of next phase development. Other upgradations are RFID based gate automation with smart card for driver and RFID tags for trucks. This terminal has added new services such as higher capacity vessel (M.V. TCI Express) added to TCI Coastal service for improving the coastal connectivity, addition of CONCOR new coastal service strengthen the coastal connectivity of terminal, new barge service started connecting terminal to ICD Kottayam along with trans-shipment containers from kerala minor ports (Azhikkal) started connecting via Cochin. Connectivity has been improved during the last year at VCTT with a dedicated 4-lane highway, which connects to the major hinterland locations and a direct rail connec-tivity to the terminal with the longest rail bridge in India spanning 4.62 kms ensures better first and last mile connectivity.
VCTT has reported a CAGR of 13.57% in the past three years, higher than the three year CAGR of 11.41% regis-tered at all Indian ports. The terminal boasts connectivity to Australia, Far-east, South-East Asia, Middle East, Eu-rope and the Mediterranean. With the close proximity of six hours to the hinterland, fast turnaround and increase in the cargo destined for the Far-east and the US market, the terminal is poised to strengthen its connectivity with a direct service in its portfolio.
VALLARPADAM INTERNATIONAL CONTAINER TRANSHIPMENT TERMINAL
THROUGHPUT GROWTH Y-O-Y DURING FY 2015-19
40

INDIAN CONTAINER MARKET REPORT- 2019
41
KATTUPALLI INTERNATIONALCONTAINER TERMINAL
Kattupalli Village, Ponneri Taluk, Tiruvallur District, Chennai – 600120, Tamil Nadu, India.Phone: 044-27968400
Terminal Address
THROUGHPUT 592,399 TEUINSTALLED CAPACITY 1,200,000 TEUCAPACITY UTILIZATION 49.4%OPERATOR APSEZ LTD
Adani Kattupalli International Container Terminal has many advantages with its unique location of 30 kilo-
meters towards north of Chennai and has connectivity with hinterland of North Tamil Nadu, Chennai, Bengaluru region and South Andhra Pradesh locations which are highly industrialized.This terminal handled 0.59 million TEUs in FY 2018-19 against previous year volume of 0.49 million TEUs regis-tering continuous double digit growth of 20.81 percent. Import volume is 0.19 million TEUs increased by 44.3 per cent in FY 2018-19 compared to previous year volume of 0.13 million TEUs. Export volume is 0.38 million TEUs with 10 per cent growth in FY 2018-19 compared to previous year volume of 0.35 million TEUs. The terminal handled coastal volume of 69,777 TEUs. In terms of operational efficiency, the terminal recorded a growth of 14.28% in average turnaround time of 0.8 days, average output per ship berth day is 2,168 TEU’s with a growth of 2% and average crane productivity is 29.20 moves per hour with a growth of 2%. It also started new service CI3 (China - India service III) Chennai/ Kattupalli / Port Klang / Singapore/ Haiphong/ Shanghai/ Hong Kong / Ningbo/ Shekou for the FY 2018-19.This terminal implemented N Curve Intelligence, the motion of the quay crane spreader which moves from sea side to land side and vice versa while loading and unloading vessel in a path. Non-optimized n-curve oper-ation results into unnecessary energy consumption, and increased cycle time. For optimizing n-curve, terminal in-stalled 2D laser scanners in trolley to capture the vessel
container stack profile. The scanner exactly giving the required lifting height and restrict the unwanted hoisting operation. By this way, operation cycle increased and operator efficiency increased from 62% to 72%.
201920172016
40.93%
683.61%
201.97%146.64%
20.81%
20182015
THROUGHPUT GROWTH Y-O-Y DURING FY 2015-19

42
NHAVA SHEVA INTERNATIONALCONTAINER TERMINAL PVT LTD
Operation Center, Sheva,Navi Mumbai- 400707. INDIA+91 22 5590 1234
Terminal Address
THROUGHPUT 560,661 TEUINSTALLED CAPACITY 1,200,000 TEUCAPACITY UTILIZATION 46.7%OPERATOR DP WORLD
-12.55%
201920172016
19.68%
-12.00%-13.84%
-27.12%
20182015
One of the oldest terminals of DP World in JNPT port is Nhava Sheva International Container Terminal
(NSICT). It features a berth length of 1,969 feet, yard area of 26 acres, 6 Post Panamax and 2 Super Post Panamax quay cranes, 3 rail-mounted gantry cranes, and 29 rubber-Tyre gantry cranes, with a capacity to handle 1.2 million TEU annually. The terminal has recorded container volume of 560,661 TEU’s in the FY 2018-19, registered negative growth of 12.5% compared to the previous year. Short run dip of containers for specific months attributed to the slow-down of operations of unionized crane workers due to their issue with implementation of a new wage contract. This terminal registered negative growth in terms of Compounded annual growth rate (CAGR) which is -10.4 per cent during the last five years from FY 2014-15 to FY 2018-19.Container volumes handled by NSICT have been steadily declining when Tariff Authority of Major ports (TAMP), the rate regulator for major ports, notified a rate cut of around 28 per cent at the facility.NSICT via Container Corporation of India (Concor), operated a “Direct Port Delivery rail service” to Karambeli, near Vapi in January 2019. This can help in improvement of its volume. This terminal is investing in improvement of its cargo handling equipments at the gantry area by adding 15 rubber-tyred gantry (RTG) cranes which are designed to offer fuel savings, low emissions and easy maintenance as they utilize a combination of both diesel and electric technology. These RTGs will be fitted with a variable
speed generator (VSG) that will automatically optimize RPM as per the power demand. This offers a high fuel economy and cuts emissions.
THROUGHPUT GROWTH Y-O-Y DURING FY 2015-19

INDIAN CONTAINER MARKET REPORT- 2019
43
ADANI HAZIRA CONTAINERTERMINAL
Hazira Container terminal has made few technology upgradations for the FY 2018-19. Installation of VMT in Internal trailers is done for reducing involvement of checkers in vessel operation. Commencement of new port gate facility which led to regulation of traffic at entry and reduction in turnaround time inside the port.
At & Post Hazira, Tal. Choriyasi, Surat, Gujarat 394270
Terminal Address
THROUGHPUT 559,330 TEUINSTALLED CAPACITY 1,200,000 TEUCAPACITY UTILIZATION 46.6%OPERATOR APSEZ LTD
14.27%
2018 201920172016
96.11%
37.06%17.97%
157.31%
2015
Adani Hazira container terminal (AHCT) is strategically located in the vicinity of industrial hubs.
The terminal has recorded a growth of 14 per cent for the FY 2018-19 compared to previous year with 0.55 million TEUs of throughput surpassing previous year volume of 0.48 million TEUs. Import volume is 0.27 million TEUs increased by 13.2 per cent in FY 2018-19 compared to previous year volume of 0.24 million TEUs. Export volume is 0.28 million TEUs with 13.9 percent growth in FY 2018-19 compared to previous year volume of 0.24 million TEUs. The terminal handled transship-ment volume of 5769 TEUs, along with Coastal volume of 27,587 TEUs. AHCT recorded one of the highest compounded annual growth rate (CAGR) of 56.3% during FY 2014-15 to FY 2018-19. In FY 2018-19, the terminal has recorded positive growth in efficiency parameters which includes average turn-around time of 0.61 days with a growth of 13%, average pre-berthing detention time is 0.11 days with a growth of 6%, average output per ship berth day is 2,525 TEU’s with a growth of 20% and average crane productivity is 30 moves per hour with a growth of 3.4%.In Container segment there is a new service added called “FIVE” i.e. Fareast Indian Vietnam Exp in the FY 2018-19. This service is basically to connect far east countries such as Hazira, Colombo, Port Kelang, Singapore, Haiphong, Qingdao, Shanghai, Ningbo, Dachan bay, Nha-va Sheva, Mundra. With “FIVE” service, Hazira container terminal entered Far East market.
THROUGHPUT GROWTH Y-O-Y DURING FY 2015-19

44
BHARAT MUMBAICONTAINER TERMINAL
Windsor, Building, Off CST Road Sunder Nagar Rd, Vidya NagariKalina, Santacruz EastMumbai - 400098, Maharashtra.
Terminal Address
THROUGHPUT 520,110 TEUINSTALLED CAPACITY 2,400,000 TEUCAPACITY UTILIZATION 21.7%OPERATOR PSA INTERNATIONAL
Bharat Mumbai Container Terminals (BMCT), a sub-sidiary of PSA international Pte Ltd, had commenced
operations on February 2018. The terminal being the newest addition to the Jawaharlal Nehru Port (JNP), has enhanced the much required capacity and operational flexibility to meet the trade’s pent up demand.BMCT is well equipped with advanced technology and infrastructure to offer fastest Turnaround Time for all types of Vessels. Further, the terminal provides unique service advantages such as having no restrictions on move count, including on Reefers and Out-of-Gauge (OOG) containers.With a contiguous berth of 1000m quay length, 45-hect-are storage yard with 9,336 ground slots, 1,620 reefer slots BMCT is capable of handling super post-panamax vessels supported by its 12 Quay Cranes and 36 RTGs and other supporting equipment.The terminal has handled container volume of 520,119 TEUs with a dramatic growth rate of 2140% for the FY 2018-19. BMCT’s market share increased to almost 19% of total JNPT volume. BMCT has continued to achieve higher productivity, surpassing the 200 moves per hour mark on 3 vessels within a month in August 2019. BMCT’s rail volume increased to 14 % of total volume in August 2019 and continues to maintain a month on month growth. The rail yard is well equipped with four twin lift-capable Rail Mounted Gantry (RMG) cranes serving four lines. With completion of Dedicated Freight Corridor (“DFC”), BMCT is poised to become the most preferred Terminal for the Indian logistics sector, with an added advantage as the only terminal in JNP that han-
dles the 1.5km double stack capable Dedicated Freight Corridor (DFC) trains.BMCT’s connectivity reaches out to the major trading markets in Maharashtra, Gujarat, and the National Cap-ital Region of India and is catering to the key industrial and manufacturing centers and cities in Northwest India. The terminal has entered the East Africa, Far East and Europe markets in the FY 2018-19. Currently BMCT hosts four weekly services the Swahili Express (SWAX) jointly operated by CMA CGM, Emirates Shipping Line and Hapag-Lloyd in the India-Africa trade, the Europe-Pakistan-India Consortium 2 (EPIC2) under a vessel sharing agreement among Hapag-Lloyd, CMA CGM, and COSCO. The China-India Express (CIX) oper-ated by HMM and the China India Pakistan Service (CI1) under VSA among COSCO, CMA CGM, PIL and OOCL.As the largest standalone container terminal in India, BMCT is set to change the landscape of the container trade in Mumbai and all the hinterland supporting it. The terminal continues to deliver consistent high productivity which is a major consideration for the customers to select a terminal of call, especially with the upcoming maritime regulations.

INDIAN CONTAINER MARKET REPORT- 2019
45
NAVAYUGA CONTAINER TERMINAL
P.O. Bag No. 1, Muthukur, Dist. Nellore - 524 344,Andhra Pradesh, India.Tel: +91 861 2377 999/ +91 970 4123 987 / 989
Terminal Address
THROUGHPUT 506,168 TEUINSTALLED CAPACITY 2,000,000 TEUCAPACITY UTILIZATION 25.3%OPERATOR NCT
201920172016
88.06%
56.33%
114.97%
29.54%5.55%
20182015
The largest transshipment cargo handling container terminal on the east coast is Navayuga Container Ter-
minal (NCT), it handled 0.50 million TEUs in FY 2018-19 against previous year volume of 0.47 million TEUs while registering 5.55 percent year-on- year growth. Import volume is 107,503 TEUs increased by 6.6 percent in FY 2018-19 compared to previous year volume of 100,843 TEUs. Export volume is 149,149 TEUs with 0.56 percent growth in FY 2018-19 compared to previous year volume of 148,306 TEUs. The terminal handled transshipment volume of 230,682 TEUs, along with Coastal volume of 16757 TEUs. This terminal recorded average turnaround time of 0.88 days with 25% reduction year-over-year against previous year, average output per ship berth day is 1387 TEU’s with a growth of 5.15% and average crane productivity is 28.5 moves per hour with a growth of 2.1%.It has started the construction of 30-acre facility which includes stuffing and de-stuffing (off dock handling), 3 warehouses of 60,000 Sq. feet each and gate & crane au-tomation (container health inspection) is under testing. The current fiscal witnessed several developments at NCT. This includes five new e-RTGS getting commis-sioned, increase in yard capacity to 5,000 ground slots, rise in reefer points to 200, installation of a sophisticated drive-through container scanner and permission to handle unshredded scrap imports. It is also constructing 3rd Berth of 200mtrs Length and 4 Lane to 6 Lane Road Expansion is under progress.Container Corporation of India (Concor) has deepened its newfound interest in coastal shipping activity by opening
a regional service between India and Bangladesh — the latest step in its “integrator” push. The service will connect the Krishnapatnam Port, an emerging privately operated gateway in eastern India, to the ports of Chit-tagong and Chattogram in Bangladesh.Navayuga Container Terminal has added new services such as CKX (CCU – NCT – CCU), VCH1 (NCT - CMB - HAL), ECX (NCT - CMB - HAL), KBPS (NCT-CCU-PORT BLAIR). It has entered in new markets of South Korea, China, Australia.
THROUGHPUT GROWTH Y-O-Y DURING FY 2015-19

46
VISAKHA CONTAINERTERMINAL
Opposite Town Hall, Beach Road, Beside Fishing Harbour, Port Area, Visakhapatnam, Andhra Pradesh 530001
Terminal Address
THROUGHPUT 450,406 TEUINSTALLED CAPACITY 600,000 TEUCAPACITY UTILIZATION 75.1%OPERATOR ICTIPL-JM BAXI & DP WORLD
Visakha Container Terminal (VCT) is one of the key container terminals on the east coast serving Indian
EXIM trade apart from serving as gateway port for third country cargo of Nepal. The terminal handled a container volume of 450,406 TEU’s for the FY 2018-19 with an installed capacity of 600,000 TEU’s per annum. VCT registered a growth of 18% for the FY 2018-19. Capacity utilization of the terminal is 75 per cent. The Imports laden volumes grew by 15% whereas exports by 13.5%. The transshipment cargo handled at terminal is 13,448 TEU’s. The terminal also recorded a CAGR of 11.4% during last five years during FY 2014-15 to FY 2018-19. In the month of May’18, VCT handled highest parcel size of 3,187 TEUs in a vessel, and in the month of Aug’18 rake volumes of 6,484 TEUs.This terminal added 2 Post Panamax rail mounted quay cranes and handled over 317 rakes for the FY 2018-19. Construction of new berth of 395 meter is under process which will be completed by 2021. VCT has provided web access to post form 13 elec-tronically. Pre-gate system is introduced for parking the external trucks and verifying the document. The terminal entry passes for the trailer drivers are generated by bio metric verification which reduced waiting time for trucks. Initiatives such as Visitor Management System, Digital Container Tracking System and Waste to Wealth are commissioned for the FY 2018-19.New equipment configured to quickly identify the con-tainer damage through cameras to the Quay Cranes & Rubber Tyred Gantry Cranes.It has Pedestrian free container yard, thereby eliminating man-machine interface, Traffic Management Plan in
place for movement of vehicles inside the terminal and Uni-Directional movement of container trailers in the Yard.Latest technology such as NAVIS SPARCS N 4 software, more than 366 reefer plug points, adequate power back up, 2 full length rail sidings makes this terminal more productive. The organization has Navis N4 as the Terminal Operating System (TOS) and has moved a step further integrating with SAP.
THROUGHPUT GROWTH Y-O-Y DURING FY 2015-19
201920172016
4.09%
25.16%
18.15%
-5.34%
17.99%
20182015

INDIAN CONTAINER MARKET REPORT- 2019
47
DAKSHIN BHARATGATEWAY TERMINAL
Berth No: 8, V.O.C Port Trust, Tuticorin Container Terminal Rd, Harbour Estate, Muttayyapuram, Tamil Nadu 628004
Terminal Address
THROUGHPUT 386,376 TEUINSTALLED CAPACITY 600,000 TEUCAPACITY UTILIZATION 64.4%OPERATOR DAKSHIN BHARAT GATEWAY TERMINAL PVT LTD
20192017
8.77%
92.14%82.52%78.83%
20182015 2016
of 55,000 TEUs with only 345 meters berth length. In port account, the terminal recorded average turnaround time of 0.55 days with a growth of 200 per cent, average output per ship berth day is 1,920 TEU’s with a growth of 74 per cent and average crane productivity is 33 moves per hour with a growth of 45 per cent.
Dakshin Bharat Gateway Terminal (DBGT) is contin-uously striving to achieve improvement in overall
performance. It is accounting for 91 per cent of the total container volumes handled at VO Chidambaranar port. This terminal features a total yard area of 10 hectares. The container terminal has registered a stellar 200% growth in average turnaround time in 2018-19 compared to 2017-18. And, it has also registered an impressive 75% growth in average output per ship berth day in the last fiscal. The terminal has reported 45% growth in crane productivity during the financial year under review.In the current financial year ending August, DBGT has majorly contributed to the growth in container handling of VOC port by handling 90 to 100 hourly vessel moves with three quay cranes. All brand new quay cranes are installed with twin spreaders for better productivity. It is also planning to increase cargo handling equipment with 4 quay cranes, 12 eRTG’s, and 30 trailers in order to be more efficient.The terminal has handled 386,376 TEUs in FY 2018-19 with 92 per cent y-o-y growth, compared to previous year volume of 201,093 TEUs in FY 2017-18. Import volume is 0.13 million TEUs increased by 153 per cent in FY 2018-19 compared to previous year volume of 0.05 million TEUs. Export volume is 0.15 million TEUs with 179 per cent growth in FY 2018-19 compared to previous year volume of 0.05 million TEUs. The terminal handled trans-shipment volume of 21,668 TEUs, along with coastal volume of 74,632 TEUs. The Compounded annual growth rate is 61.6 per cent for the last five years i.e. 2015-2019.In terms of efficiency, DBGT is the only container terminal in India handling monthly average through put
THROUGHPUT GROWTH Y-O-Y DURING FY 2015-19

48
Tuticorin Container Terminal Building, Berth No 7, Harbour Estate, ThoothukudiTamil Nadu - 628004
Terminal Address
THROUGHPUT 352,010 TEUINSTALLED CAPACITY 450,000 TEUCAPACITY UTILIZATION 78.2%OPERATOR PSA INTERNATIONAL
The two giants in their respective fields of expertise, SICAL and PSA International terminal operate Tuticio-
rin Container Terminal (TCT) in V. O. Chidambaranar Port Trust known for efficiency, reliability and swiftness. This terminal is strategically located within 26 km from inter-national shipping routes. The container terminal has a capacity of 450,000 TEUs with an operational period of 30 years. This terminal handled 352,010 TEUs in FY 2018-19 with a dip compared to previous year volume of 495,264 TEUs while registering negative growth of 28.92 percent year-on-year. This terminal has been continuously regis-tering downfall in yearly volumes since last two years. TCT is adequately supported with excellent road and rail framework that serves to connect it with all the ICDs (Inland Container Depot) of South India. The smooth four lane roads facilitate fast and unhindered passage of container trailers. In addition to this, the terminal is well connected to Bangalore, Chennai and Kochi by means of a rail network. This has enabled the shipping lines and shippers doing business with TCT to benefit from the quality and value added services offered by it.TCT has twelve container freight stations and a solo ICD unit. The terminal has in place modernistic container handling equipment and operating systems. Additional infrastructural support to the terminal comes by way of 30 MLOs, NVOCCs, 150 C&F agents and 25 transporters. This has enabled TCT to offer fast, reliable and custom made solutions to inland transportation.For faster processing of business information TCT has deployed EDI systems. In tune with its environmental concerns a remote EIR (Environmental Impact Report) facility has been set up.
TCT is built on a strong foundation of congenial rela-tionships with the local port community and Customs. This has enabled consolidation and value addition to the solutions offered by TCT.
PSA SICAL TUTICORIN CONTAINER TERMINAL
20192017
-7.09%
-1.90%
4.50%2.42%
-28.92%
20182015 2016
THROUGHPUT GROWTH Y-O-Y DURING FY 2015-19

INDIAN CONTAINER MARKET REPORT- 2019
49
KANDLA INTERNATIONALCONTAINER TERMINAL
301-306, Chetna Chambers, Plot 38, Sec 9, Gandhidham, Kutch-370201 Gujarat, INDIA.Tel : +91 2836 227779 / 227010 / 225554
Terminal Address
THROUGHPUT 244,371 TEUINSTALLED CAPACITY 600,000 TEUCAPACITY UTILIZATION 40.7%OPERATOR JM BAXI
108.46%
2018 201920172016
75.07%
2131.99%
2015
With new operator in place, Kandla International Container Terminal (KICTPL) is moving with break-
neck pace in achieving great milestones. This terminal remains the first choice for majority of EXIM cargo which gets stored at Gandhidham due to its proximity. The ter-minal features a draft of 13 meters which can accommo-date 65,000-75,000 DWT vessels, with a quay length of 545 meters. The berths are equipped with 4 rail mounted quay cranes, 8 rubber-tyred gantry cranes (RTGC’s), 4 reach stackers and 24 Tractor trailers. KICTPL handled container volume of 244,371 TEUs for the FY 2018-19 with a growth of 108 per cent compared to FY 2017-18 on account of the number of registered shipping lines with the terminal has drastically increased from 79 to 104 Lines in March 2018. The number of services has increased from 10 (FY 2017-18) to 14 with a growth of 40 per cent for the FY 2018-19. Import volume is 0.12 million TEUs increased by 101.7 per cent in FY 2018-19 compared to previous year volume of 0.06 mil-lion TEUs. Export volume is 0.12 million TEUs with 115.6 per cent growth in FY 2018-19 compared to previous year volume of 0.05 million TEUs. The terminal handled transshipment volume of 550 TEUs, along with coastal volume of 146,688 TEUs. This terminal also performed positively in terms of effi-ciency parameters as it has recorded average turnaround time of 1 day with a growth of 2.73 per cent, average output per ship berth day is 932 TEU’s with a growth of 28 per cent and average crane productivity is 30.66 moves per hour with a growth of 4.96 per cent.Rail operators such as CONCOR, INDIALINKS, ICTIPL,
KRIBCO, HIND TERMINALS are working at the terminal. In the FY 2018-19, terminal has stepped into east coast shipping through CWCS Service operated by CONCOR.
THROUGHPUT GROWTH Y-O-Y DURING FY 2015-19

HALDIA INTERNATIONALCONTAINER TERMINAL
Old P & T Building, Chiranjibpur Camp, Dock Zone, Haldia - 721604. West Bengal. INDIA+ 91 03224 - 251014/ 17
Terminal Address
THROUGHPUT 178,262 TEUINSTALLED CAPACITY 250,000 TEUCAPACITY UTILIZATION 71.3%OPERATOR ICTIPL - JM BAXI
Haldia Container Terminal (HIT) is operated and main-tained by Haldia International Container Terminal
Ltd (HICT) a 100% subsidiary of International Cargo Ter-minals and Infrastructure Private Ltd of JM Baxi group. This terminal achieved throughput of 178,262 TEUs with a growth of approximately 14% over 156,690 TEUs in FY 2017-18.Haldia international container terminal has improve-ments in rail connectivity from Balasore to Haldia and Haldia to Durgapur for the FY 2018-19. It also entered in Bangladesh market this year. HICT Introduced rope changing winch for hoist rope change to Increase the safety of personnel and for reduction in rope changing time to enhance safety of personnel and eliminate the risk while working under the suspended load at wharf, concept of pinning and unpinning station is being intro-duced. HICT installed Anti-collision devices on RMQC and RTG crane to reduce the frequent accidents between ITV and crane while crane moving.Fears of a privately-run Tajpur port weaning away cargo from Haldia Dock had pushed the shipping ministry to sign a Memorandum of Understanding (MoU) with the state government to develop the new port with majority stake of 74 per cent from the Centre and West Bengal government holding the balance as minor share partner.The first ever containerized movement from Haldia Inter-national Container Terminal (HICT), kick started its jour-ney via inland waterways - National Waterway 1 at the Haldia Dock Complex (KoPT) on July 30 2019. A barge with 52 containers of edible oil belonging to the Fortune brand of Adani Wilmar on Tuesday (July 30, 2019) began its voyage from Haldia to Patna on the Hooghly, marking
the formal start of such cargo trips along the river.Haldia is serving the trade with many expansion and upgradation plans to counteract the increased compe-tition among existing and upcoming players and also made around 1 crore investment for development of the terminal.
201920172016
15.36%
-9.57%
59.80%
-16.61%
13.77%
20182015
THROUGHPUT GROWTH Y-O-Y DURING FY 2015-19
50

No: 17, Jawahar BuildingRajaji Salai, Chennai – 600001
Terminal Address
THROUGHPUT 56,987 TEUINSTALLED CAPACITY 1,400,000 TEUCAPACITY UTILIZATION 4%OPERATOR ADANI PORTS & SEZ LTD
Adani Ennore Container Terminal (AECT) has been commissioned to counteract the prevailing conges-
tion issues at the busiest port in Tamil Nadu “Chennai Port”. This terminal is located about 15 miles north of Chennai with a dedicated highway connectivity, com-bined with yard equipment shortages. AECT is envisaged as an ideal alternative to the congested Chennai Port op-erating within the city. This terminal offers 24x7 conges-tion-free approach roads for seamless cargo movement and on-dock rail siding services to Bengaluru presenting deep hinterland reach. It is also well connected with 60 per cent of Chennai Container Freight Stations (CFSs) cluster and 4 National Highways.Ennore commenced its container operation in Octo-ber 2018 with a regular weekly service by Maersk. In FY2018-19, this terminal handled volume of 57,000 TEUs. This terminal features a 400 meter wharf, 4 quay cranes, 12 rubber-tire gantry cranes(RTGCs), with a ca-pacity to handle 0.8 million TEU’s annually. Despite these advantages, the terminal has struggled initially to attract fixed ocean vessel calls as vessel related charges were high. However, the addition of Maersk call indicated that the price variations cannot be the major stumbling block.
The weekly service CHX, operates a fleet of six ves-sels rotates as follows: Qingdao and Xingang, China; Busan, South Korea; Shanghai and Nansha, China; Tanjung Pelepas, Malaysia; Ennore, Krishnapatnam, and Visakhapatnam, India; Tanjung Pelepas; Busan; and back to Qingdao.Due to high competition from private and government terminals in the near proximity, this terminal started offering high discounts to carriers on service rates. Thus, improved the cargo volume. Ennore Container Terminal is known for its customer centric approach by providing higher productivity, innova-tion logistics solutions, faster turnaround of vessels and faster evacuation of containers from the Port.
ADANI ENNORE CONTAINER TERMINAL
INDIAN CONTAINER MARKET REPORT- 2019
51
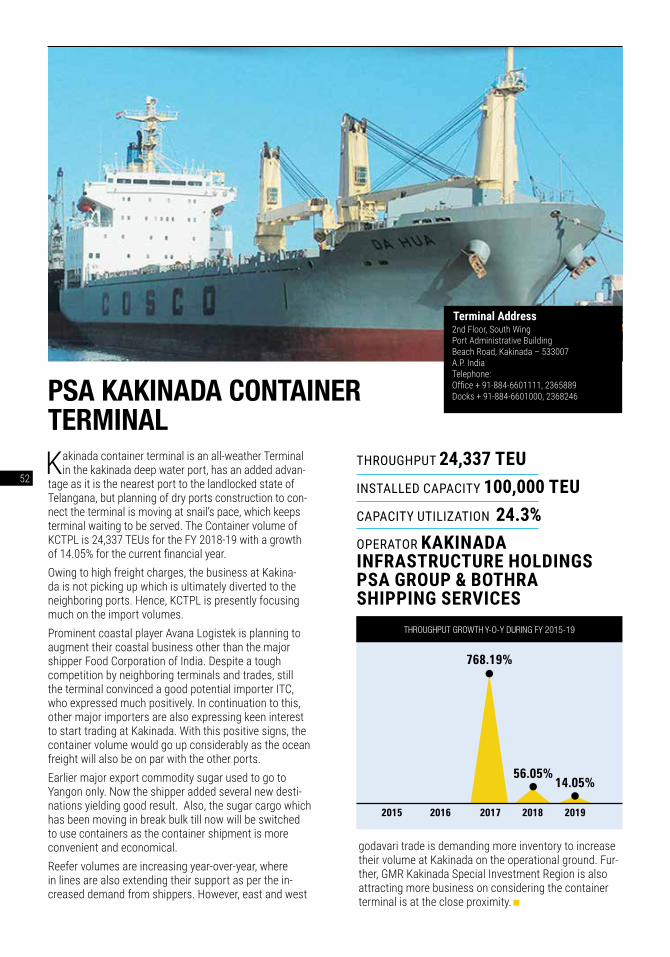
52
PSA KAKINADA CONTAINERTERMINAL
2nd Floor, South WingPort Administrative BuildingBeach Road, Kakinada – 533007A.P. IndiaTelephone:Office + 91-884-6601111, 2365889Docks + 91-884-6601000, 2368246
Terminal Address
THROUGHPUT 24,337 TEUINSTALLED CAPACITY 100,000 TEUCAPACITY UTILIZATION 24.3%OPERATOR KAKINADA INFRASTRUCTURE HOLDINGS PSA GROUP & BOTHRA SHIPPING SERVICES
20192017
768.19%
14.05%56.05%
20182015 2016
Kakinada container terminal is an all-weather Terminal in the kakinada deep water port, has an added advan-
tage as it is the nearest port to the landlocked state of Telangana, but planning of dry ports construction to con-nect the terminal is moving at snail’s pace, which keeps terminal waiting to be served. The Container volume of KCTPL is 24,337 TEUs for the FY 2018-19 with a growth of 14.05% for the current financial year. Owing to high freight charges, the business at Kakina-da is not picking up which is ultimately diverted to the neighboring ports. Hence, KCTPL is presently focusing much on the import volumes. Prominent coastal player Avana Logistek is planning to augment their coastal business other than the major shipper Food Corporation of India. Despite a tough competition by neighboring terminals and trades, still the terminal convinced a good potential importer ITC, who expressed much positively. In continuation to this, other major importers are also expressing keen interest to start trading at Kakinada. With this positive signs, the container volume would go up considerably as the ocean freight will also be on par with the other ports. Earlier major export commodity sugar used to go to Yangon only. Now the shipper added several new desti-nations yielding good result. Also, the sugar cargo which has been moving in break bulk till now will be switched to use containers as the container shipment is more convenient and economical.Reefer volumes are increasing year-over-year, where in lines are also extending their support as per the in-creased demand from shippers. However, east and west
godavari trade is demanding more inventory to increase their volume at Kakinada on the operational ground. Fur-ther, GMR Kakinada Special Investment Region is also attracting more business on considering the container terminal is at the close proximity.
THROUGHPUT GROWTH Y-O-Y DURING FY 2015-19

INDIAN CONTAINER MARKET REPORT- 2019
53

54

Lynkit is privileged to be associated with the Indian Container Market Report 2019. The consistently high standards of research and in-depth reporting by Maritime Gateway Research and Drewry Shipping Consultants have come to set a gold standard for the Indian Ports and Terminals industry.
Port logistics is in the midst of unprecedented change as digitisation takes hold and cus-tomer expectations increase exponentially. New technologies are enabling greater effi-ciency and optimisation, all of which translate into savings and new revenue streams. The Govt. of India has been driving digitisation of port operations. Indian Customs' quest to rank within the top 50 countries in the Ease of
“Through our global knowledge sharing partnerships, we have brought in state of the art tech-nologies, such as blockchain, supply chain analytics, track-ing & tracing and 3D imaging for port logistics”
of Doing Business ranking has seen a number of changes and simplifications taking root in the port eco-system. Adopting latest technologies is no longer an option for the logis-tics industry but imperative for staying competitive.
Starting out in the e-commerce logistics space in early 2017, Lynkit rapidly moved into the track & trace industry realising that visibility and timeliness were the drivers of com-petitive advantage. Scaling opportunities came through building large enterprise solu-tions and the company leveraged the knowledge and experience for evolving its propri-etary platform – Lynktrac – by innovatively combining GPS and RFID technologies. “Once we entered the world of telematics, there were inefficiencies to be seen all around and tremendous scope for optimisation”, says Sadhika Kumar, COO. Lynkit's application development team started to experiment with real time kinematics and 3D imaging. It did not take long to get noticed internationally and partnerships for knowledge sharing began with Incheon Port, Korea Logistics Network (KL-Net) and CUPIA. This became the springboard for development of Lynkgrid. This product is a state-of-the-art application, which has been developed through deep innovation and combines 3D imaging, RFID and GNSS to fully automate the process from gate-in to stacking, locating and evacuating containers.
“Simultaneously, we were watching the amazing momentum being gathered by IBM-Maersk's blockchain platform – Tradelens®. This inspired our team to develop a plug in for hinterland movement of cargo, which could also serve the burgeoning road transport industry”, says Sadhika Kumar. Lynkit.io is India's first blockchain application digitising e-consignment notes and all associated documents in the supply chain. The application has been selected by The Linux Foundation as a part of the Global Blockchain Showcase as one out of the twenty-four “in production” applications.
Lynkit is on a speed mission to become a single stop shop for all that's digital in supply chain management.