Embed Size (px)
Citation preview
India Security Buying Priority Report (2017) & FireCompass Top Viewed Products, Popular
Comparisons
Background
• Security Technology Adoption Report 2017 is a study by FireCompass & CISO platform. This survey was conducted where CISO’s were invited to take the survey online. The results discussed in the report are based on the responses of CISO’s across the country.
• Data Points: There are more than 350+ data points of CISO across the country.
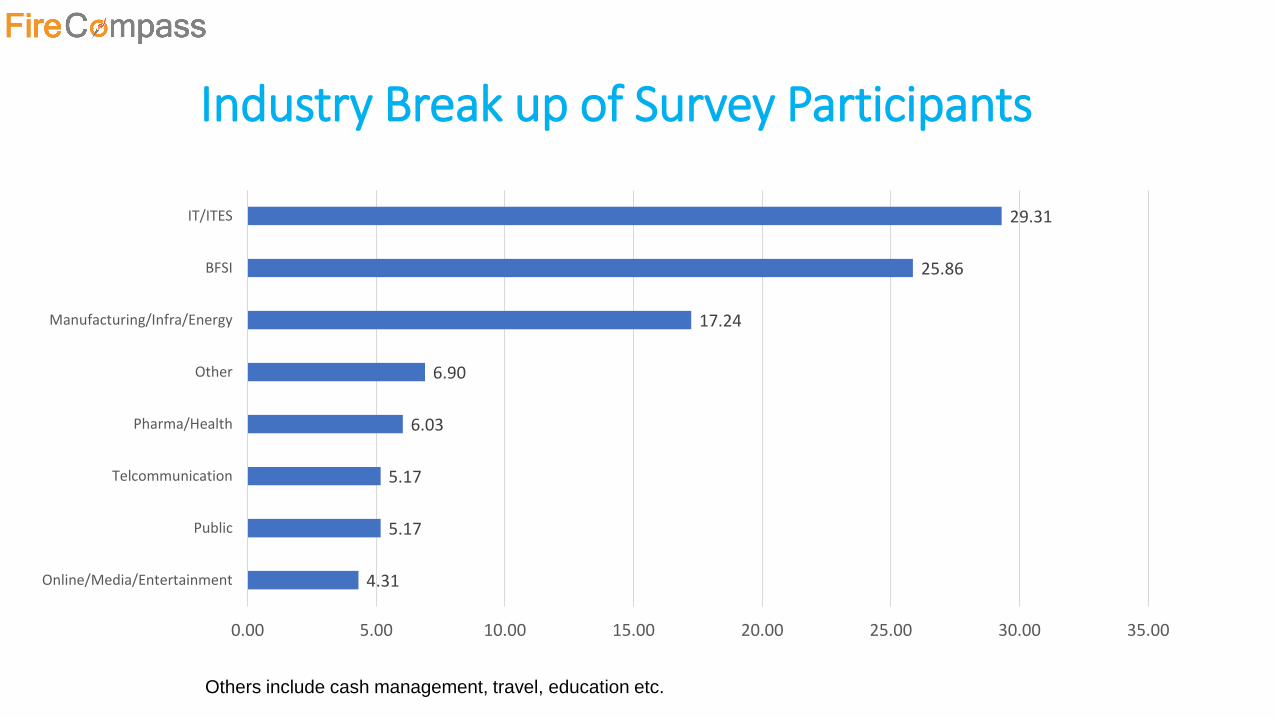
Industry Break up of Survey Participants
4.31
5.17
5.17
6.03
6.90
17.24
25.86
29.31
0.00 5.00 10.00 15.00 20.00 25.00 30.00 35.00
Online/Media/Entertainment
Public
Telcommunication
Pharma/Health
Other
Manufacturing/Infra/Energy
BFSI
IT/ITES
Others include cash management, travel, education etc.
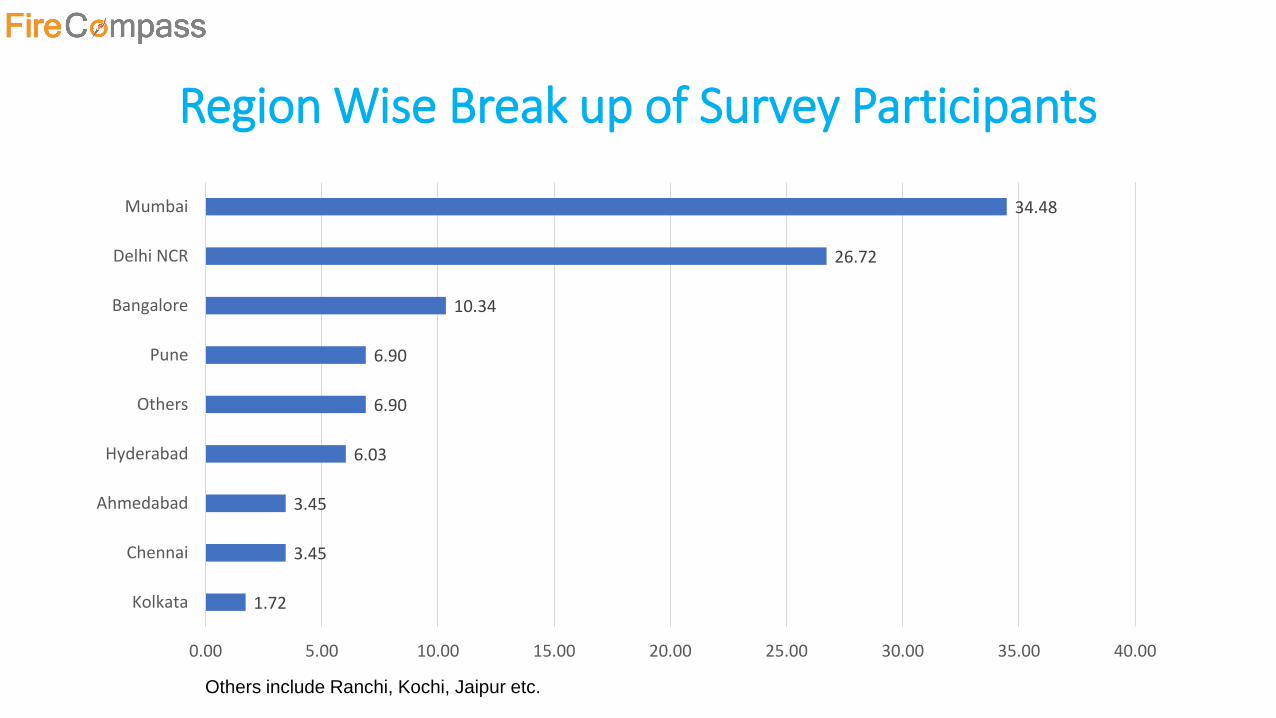
Region Wise Break up of Survey Participants
1.72
3.45
3.45
6.03
6.90
6.90
10.34
26.72
34.48
0.00 5.00 10.00 15.00 20.00 25.00 30.00 35.00 40.00
Kolkata
Chennai
Ahmedabad
Hyderabad
Others
Pune
Bangalore
Delhi NCR
Mumbai
Others include Ranchi, Kochi, Jaipur etc.

Most Matured Technologies
75.8681.03
86.21 87.9393.97
0.00
10.00
20.00
30.00
40.00
50.00
60.00
70.00
80.00
90.00
100.00
Encryption Vulnerability Assessment Email Security IDS-IPS End Point Security
% Implemented Already
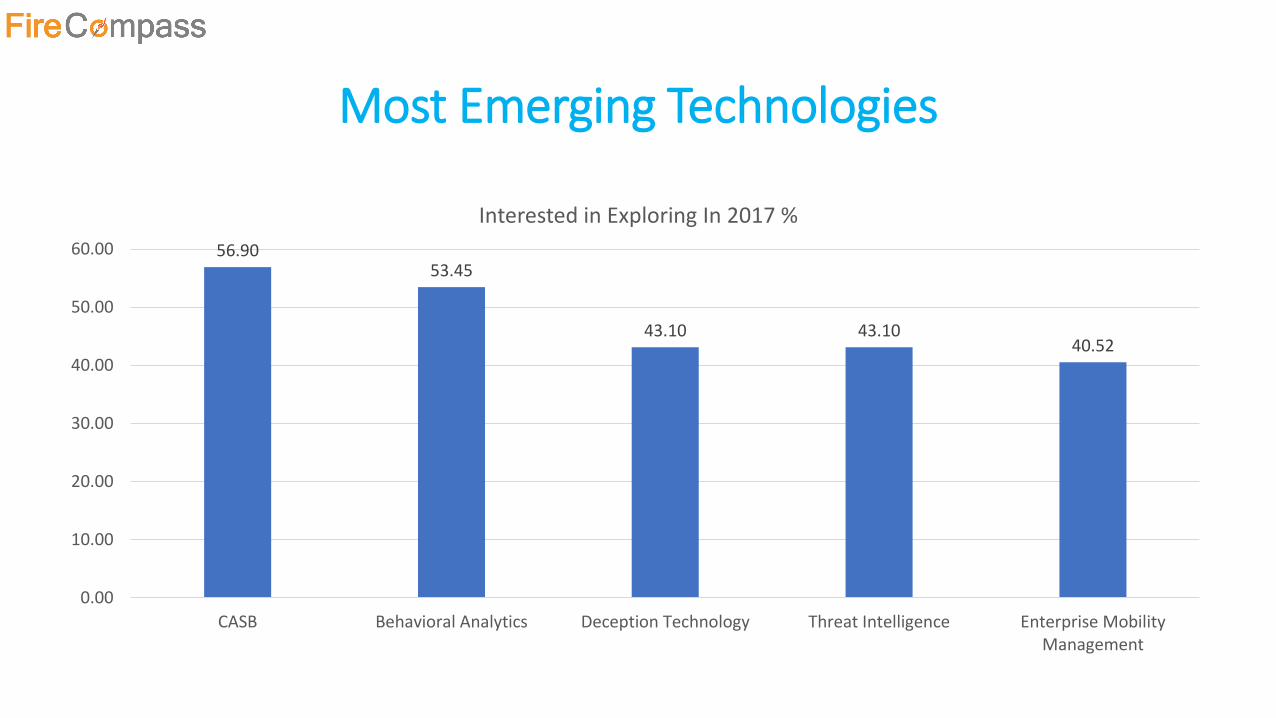
Most Emerging Technologies
56.9053.45
43.10 43.1040.52
0.00
10.00
20.00
30.00
40.00
50.00
60.00
CASB Behavioral Analytics Deception Technology Threat Intelligence Enterprise MobilityManagement
Interested in Exploring In 2017 %
Application Security Testing
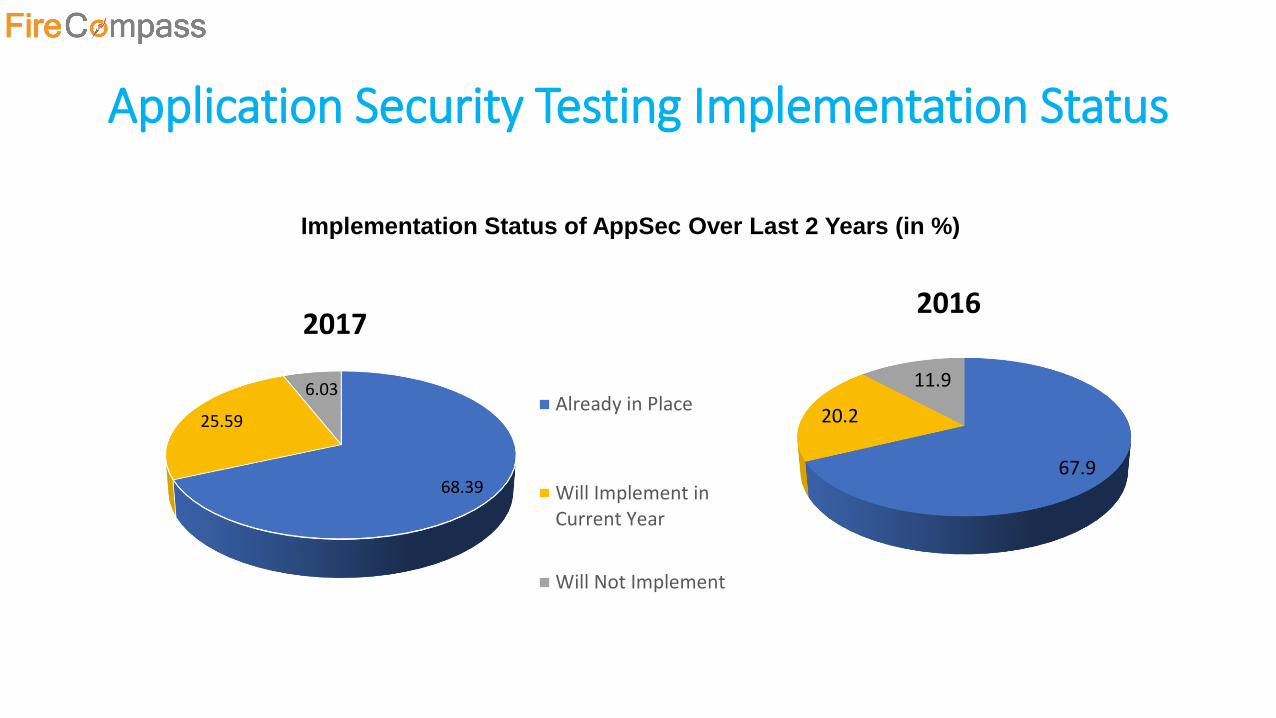
Application Security Testing Implementation Status
67.9
20.2
11.9
2016
Implementation Status of AppSec Over Last 2 Years (in %)
68.39
25.59
6.03
2017
Already in Place
Will Implement inCurrent Year
Will Not Implement
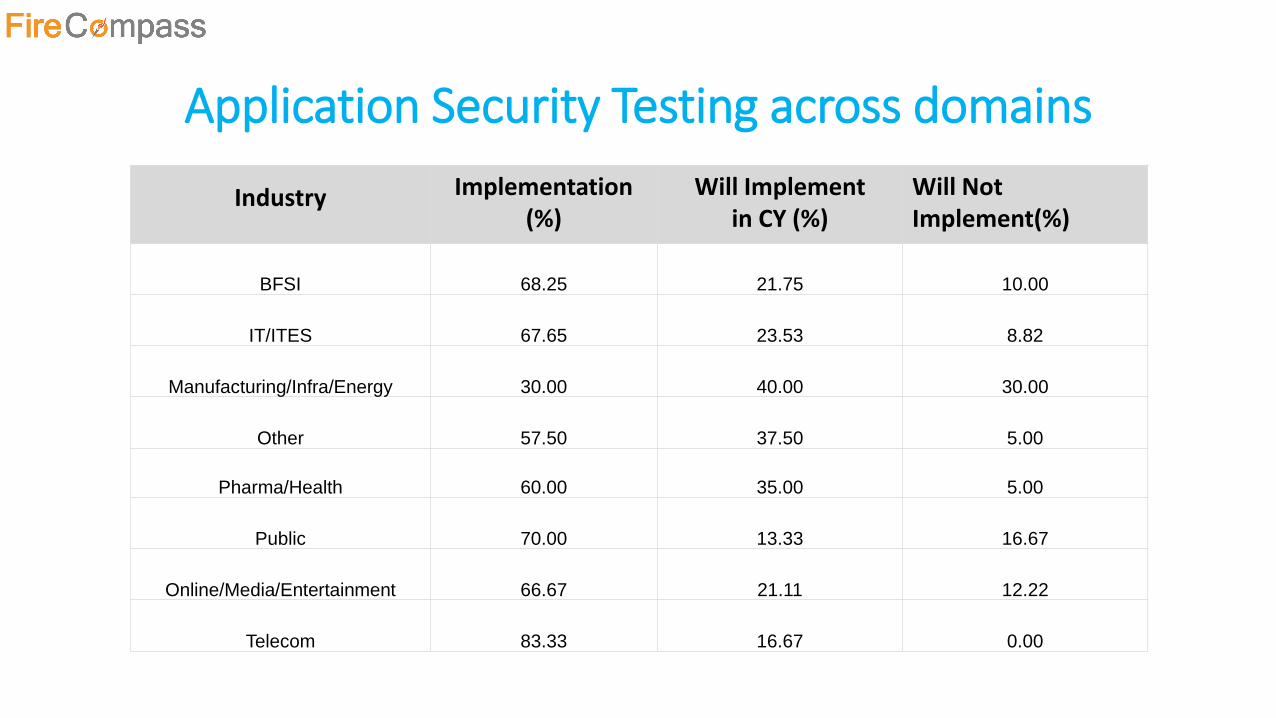
Application Security Testing across domains
Industry Implementation (%)
Will Implement in CY (%)
Will Not Implement(%)
BFSI 68.25 21.75 10.00
IT/ITES 67.65 23.53 8.82
Manufacturing/Infra/Energy 30.00 40.00 30.00
Other 57.50 37.50 5.00
Pharma/Health 60.00 35.00 5.00
Public 70.00 13.33 16.67
Online/Media/Entertainment 66.67 21.11 12.22
Telecom 83.33 16.67 0.00
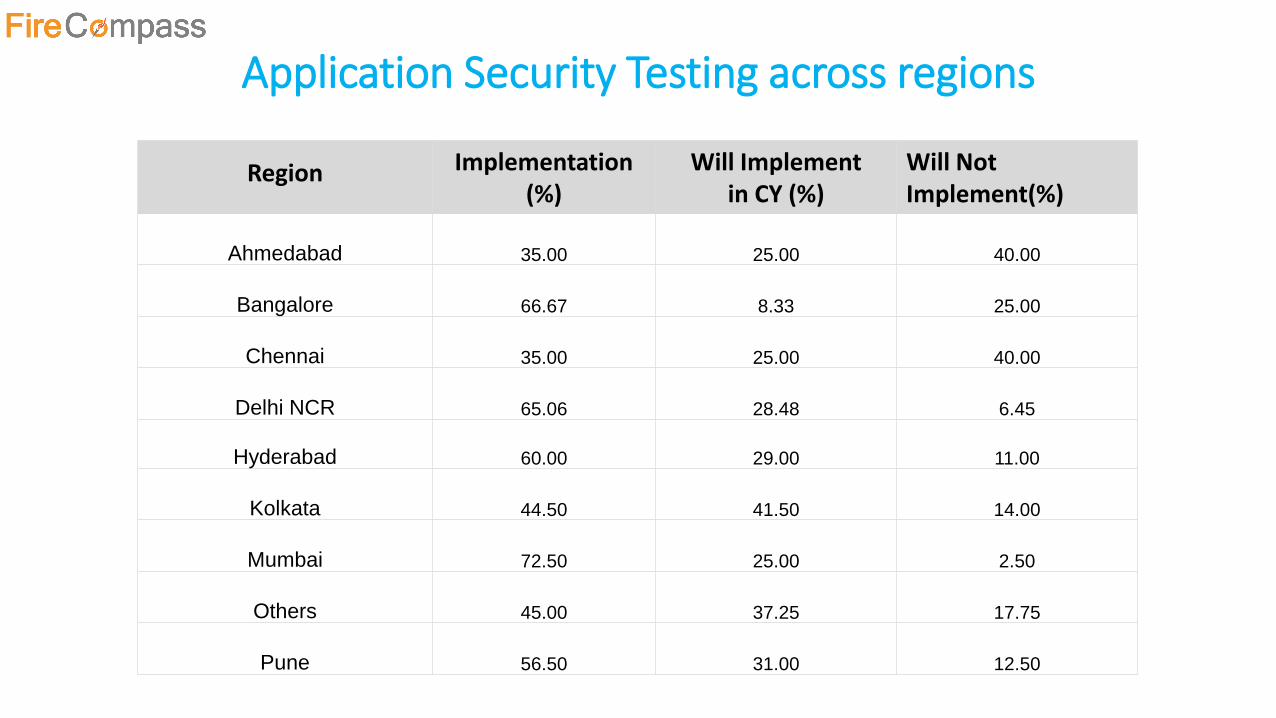
Application Security Testing across regions
Region Implementation (%)
Will Implement in CY (%)
Will Not Implement(%)
Ahmedabad 35.00 25.00 40.00
Bangalore 66.67 8.33 25.00
Chennai 35.00 25.00 40.00
Delhi NCR 65.06 28.48 6.45
Hyderabad 60.00 29.00 11.00
Kolkata 44.50 41.50 14.00
Mumbai 72.50 25.00 2.50
Others 45.00 37.25 17.75
Pune 56.50 31.00 12.50
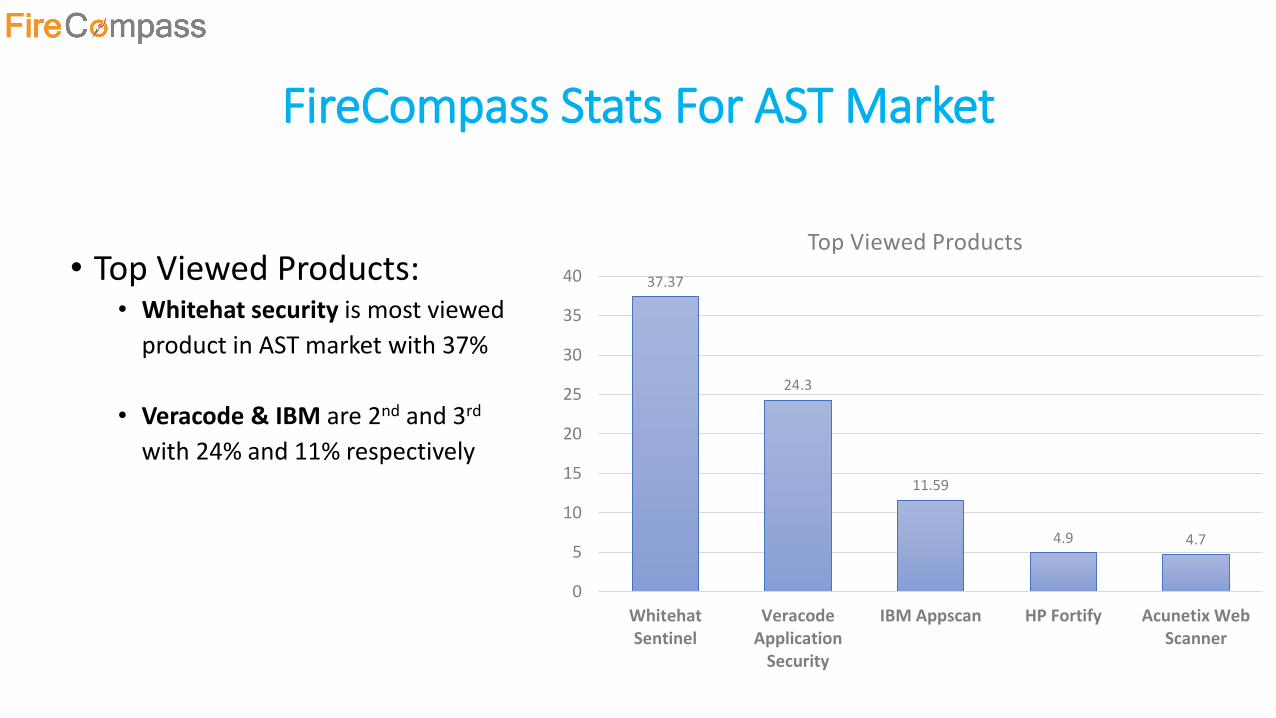
FireCompass Stats For AST Market
• Top Viewed Products:• Whitehat security is most viewed
product in AST market with 37%
• Veracode & IBM are 2nd and 3rd
with 24% and 11% respectively
37.37
24.3
11.59
4.9 4.7
0
5
10
15
20
25
30
35
40
WhitehatSentinel
VeracodeApplication
Security
IBM Appscan HP Fortify Acunetix WebScanner
Top Viewed Products
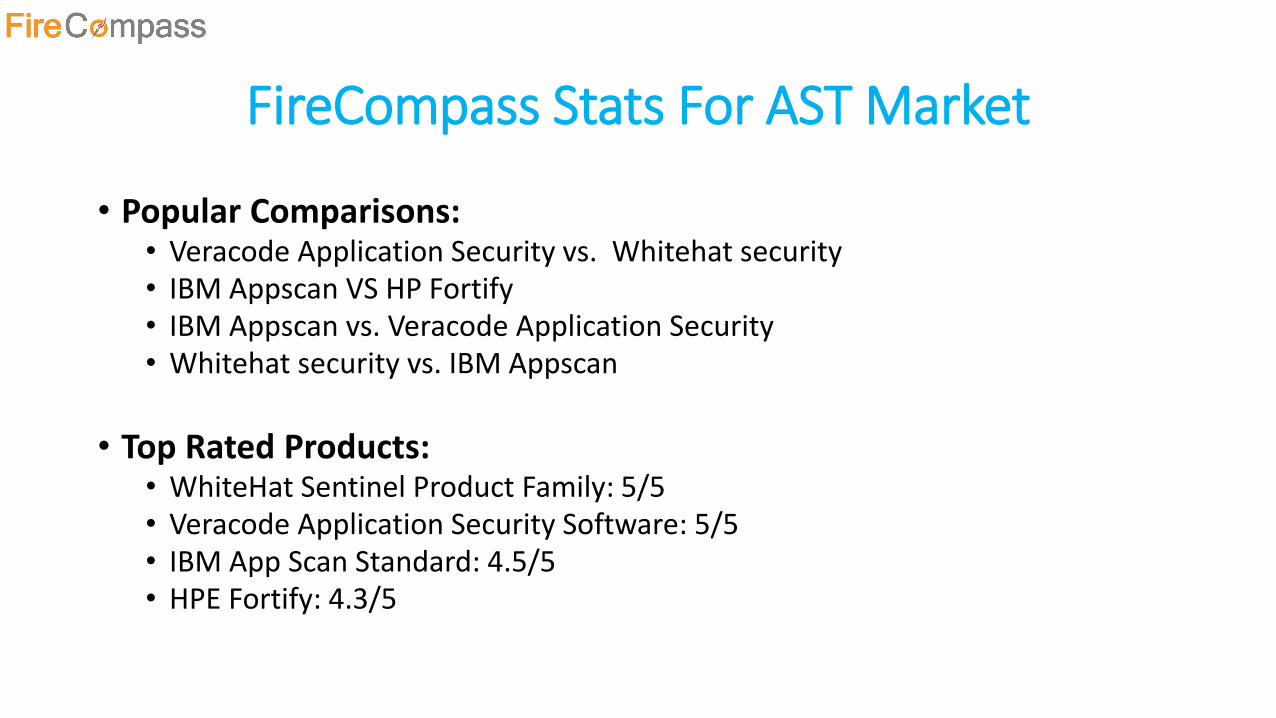
FireCompass Stats For AST Market
• Popular Comparisons:• Veracode Application Security vs. Whitehat security• IBM Appscan VS HP Fortify• IBM Appscan vs. Veracode Application Security • Whitehat security vs. IBM Appscan
• Top Rated Products:• WhiteHat Sentinel Product Family: 5/5• Veracode Application Security Software: 5/5• IBM App Scan Standard: 4.5/5• HPE Fortify: 4.3/5

Distributed Denial of Service
(DDOS)
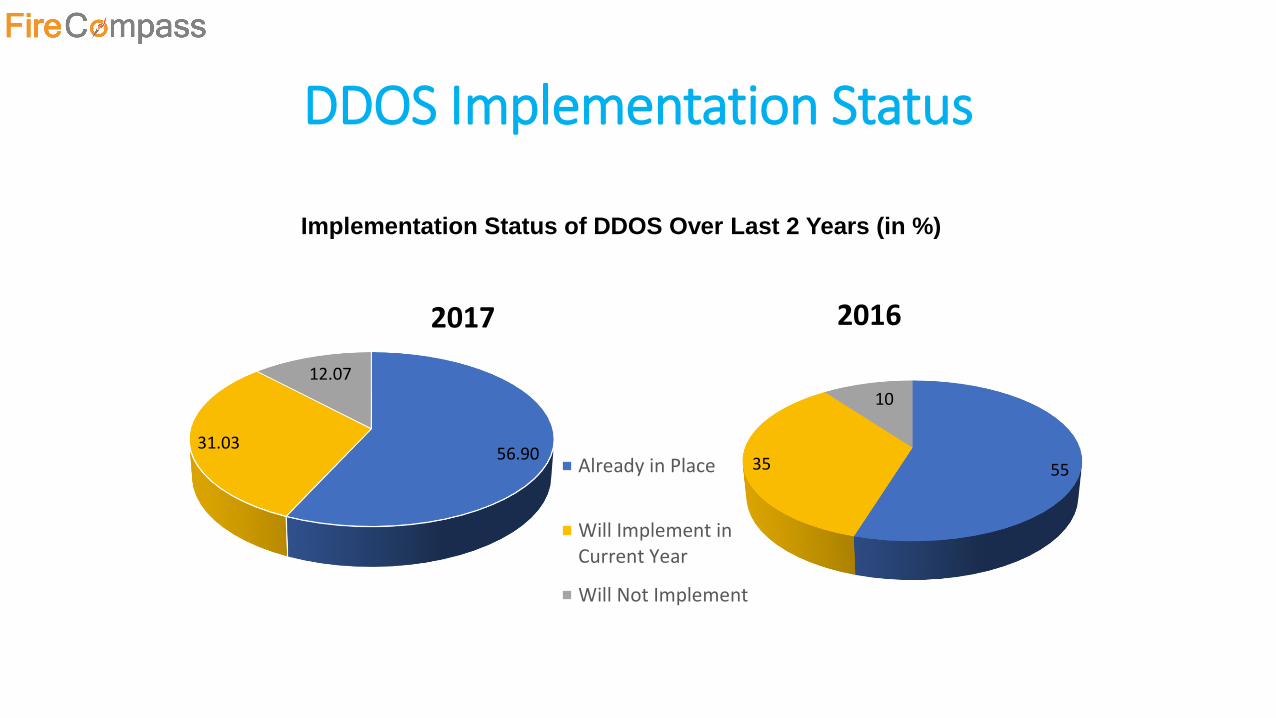
DDOS Implementation Status
Implementation Status of DDOS Over Last 2 Years (in %)
5535
10
2016
56.9031.03
12.07
2017
Already in Place
Will Implement inCurrent Year
Will Not Implement
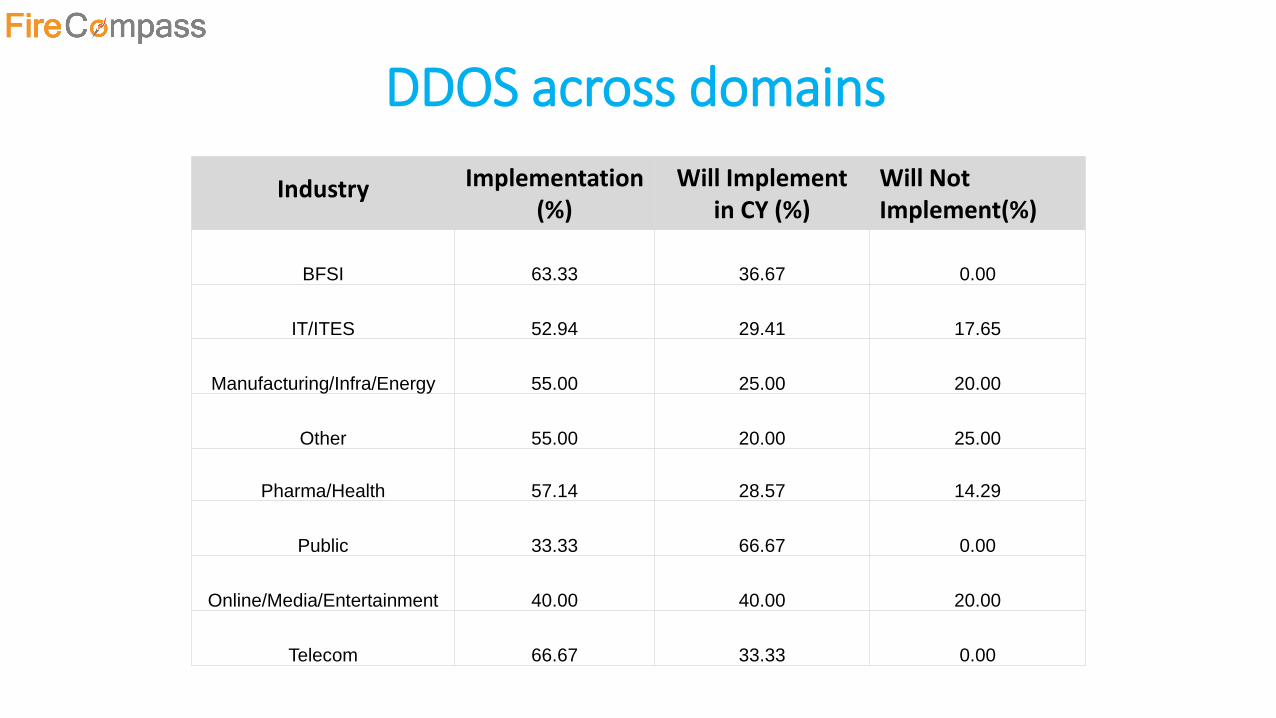
DDOS across domains
Industry Implementation (%)
Will Implement in CY (%)
Will Not Implement(%)
BFSI 63.33 36.67 0.00
IT/ITES 52.94 29.41 17.65
Manufacturing/Infra/Energy 55.00 25.00 20.00
Other 55.00 20.00 25.00
Pharma/Health 57.14 28.57 14.29
Public 33.33 66.67 0.00
Online/Media/Entertainment 40.00 40.00 20.00
Telecom 66.67 33.33 0.00
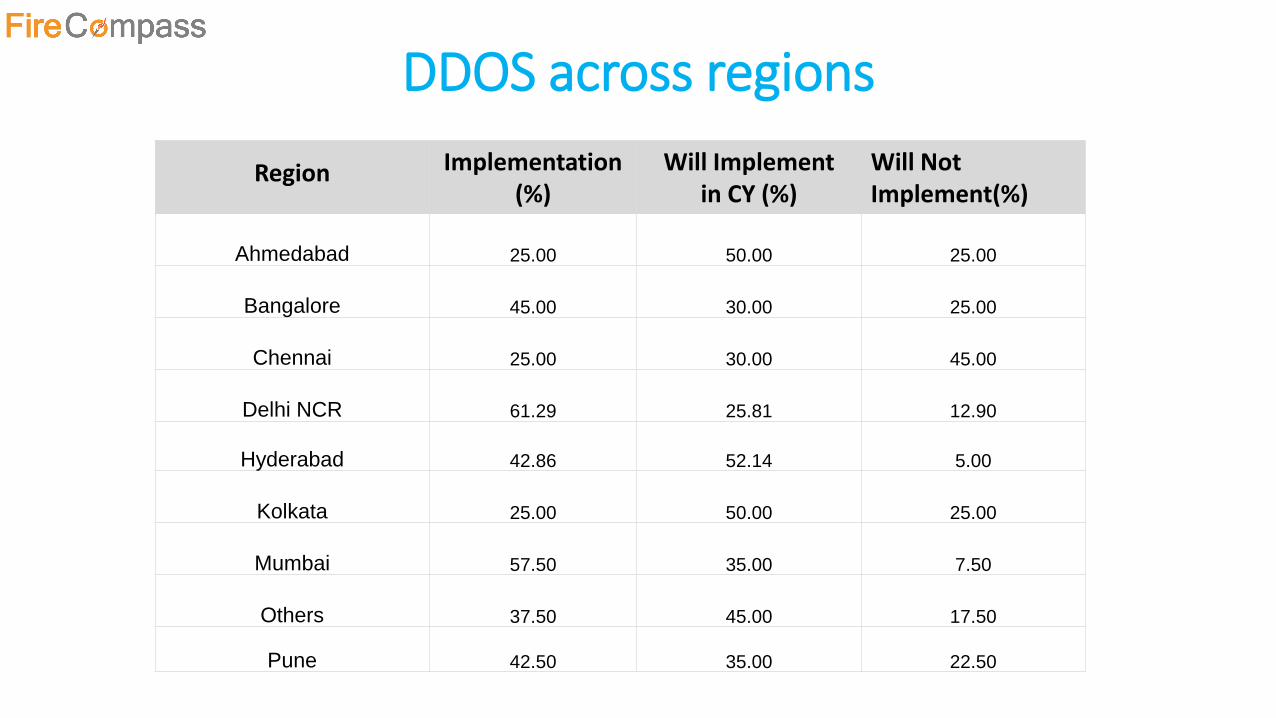
DDOS across regions
Region Implementation (%)
Will Implement in CY (%)
Will Not Implement(%)
Ahmedabad 25.00 50.00 25.00
Bangalore 45.00 30.00 25.00
Chennai 25.00 30.00 45.00
Delhi NCR 61.29 25.81 12.90
Hyderabad 42.86 52.14 5.00
Kolkata 25.00 50.00 25.00
Mumbai 57.50 35.00 7.50
Others 37.50 45.00 17.50
Pune 42.50 35.00 22.50
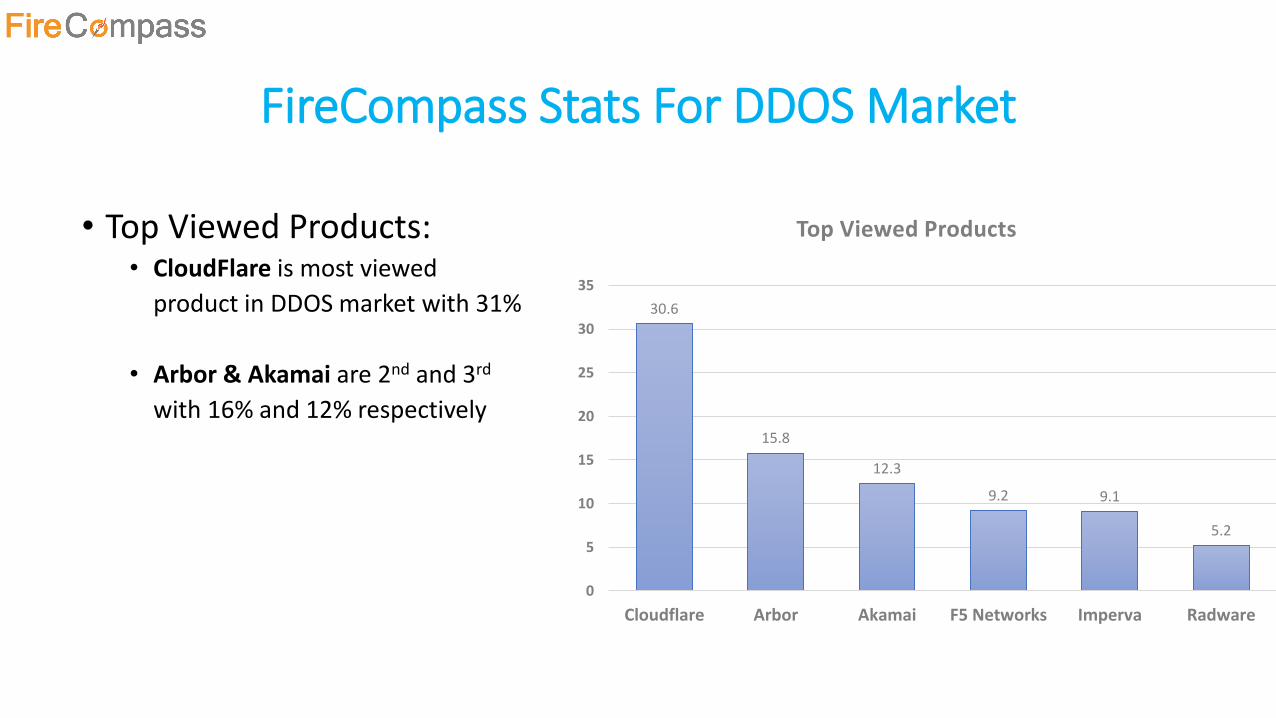
FireCompass Stats For DDOS Market
• Top Viewed Products:• CloudFlare is most viewed
product in DDOS market with 31%
• Arbor & Akamai are 2nd and 3rd
with 16% and 12% respectively
30.6
15.8
12.3
9.2 9.1
5.2
0
5
10
15
20
25
30
35
Cloudflare Arbor Akamai F5 Networks Imperva Radware
Top Viewed Products
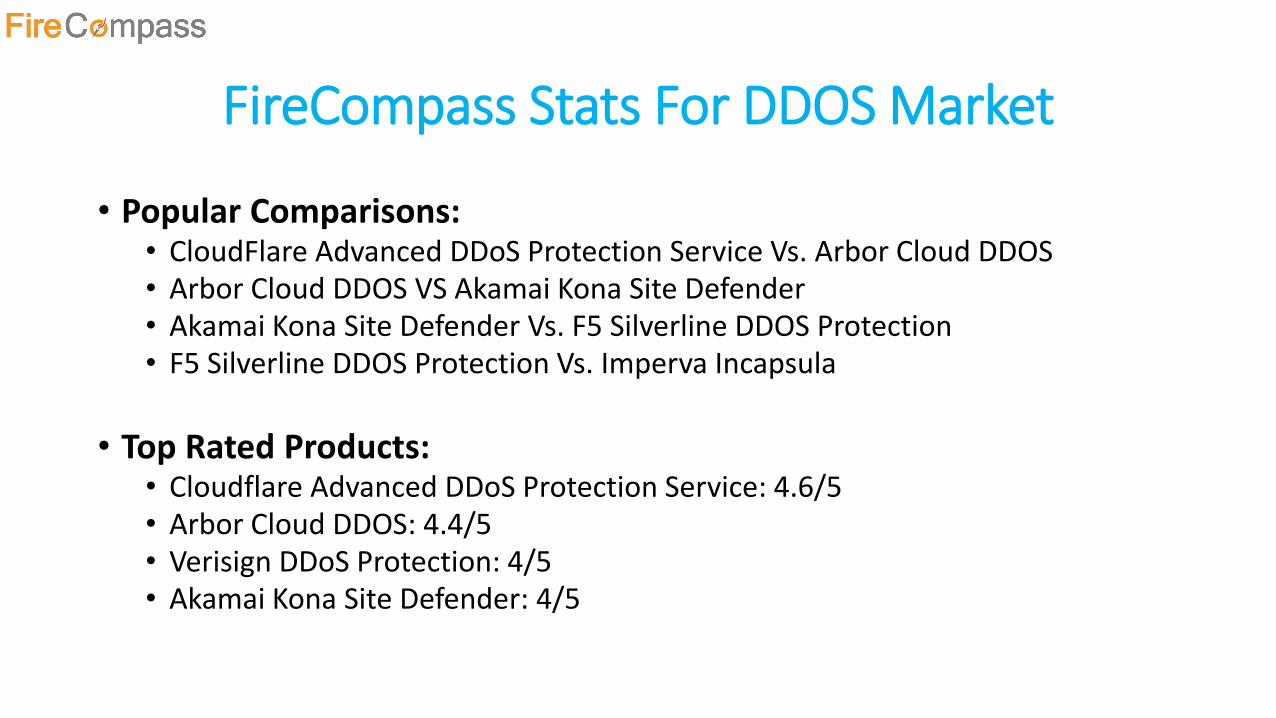
FireCompass Stats For DDOS Market
• Popular Comparisons:• CloudFlare Advanced DDoS Protection Service Vs. Arbor Cloud DDOS• Arbor Cloud DDOS VS Akamai Kona Site Defender• Akamai Kona Site Defender Vs. F5 Silverline DDOS Protection • F5 Silverline DDOS Protection Vs. Imperva Incapsula
• Top Rated Products:• Cloudflare Advanced DDoS Protection Service: 4.6/5• Arbor Cloud DDOS: 4.4/5• Verisign DDoS Protection: 4/5• Akamai Kona Site Defender: 4/5
Identity and Access Management
(IAM)
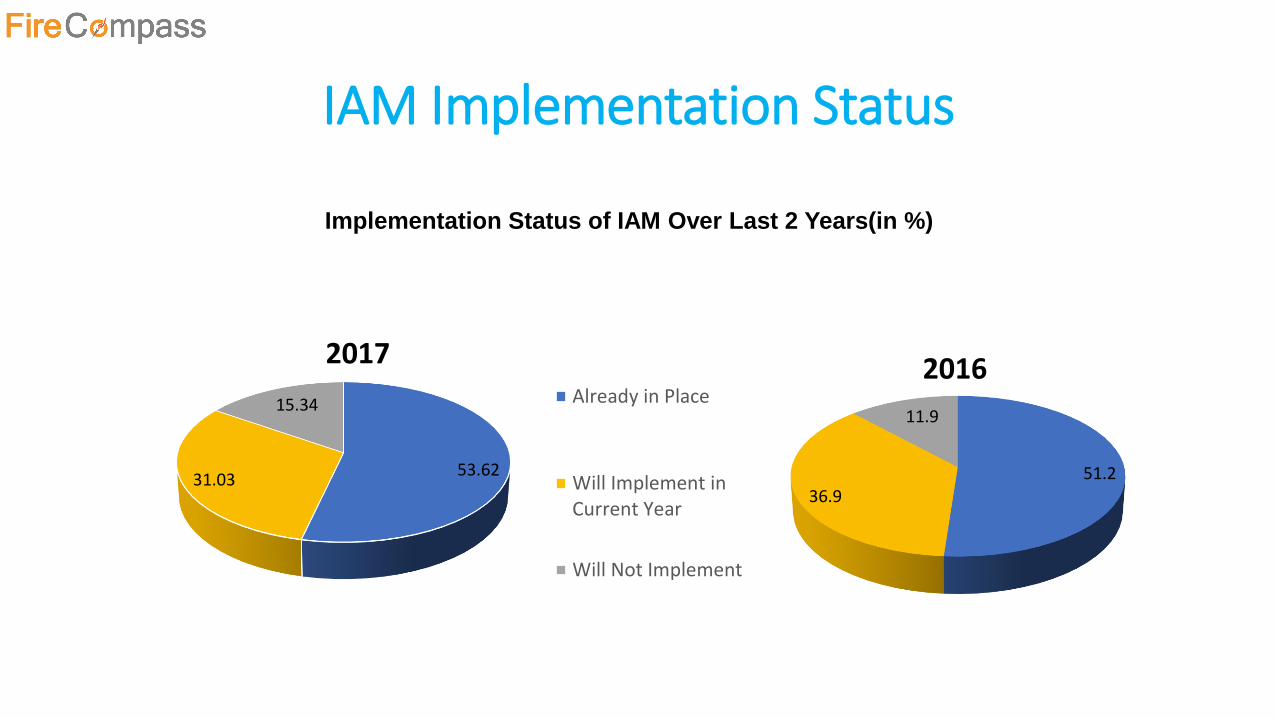
IAM Implementation Status
51.236.9
11.9
2016
Implementation Status of IAM Over Last 2 Years(in %)
53.6231.03
15.34
2017Already in Place
Will Implement inCurrent Year
Will Not Implement
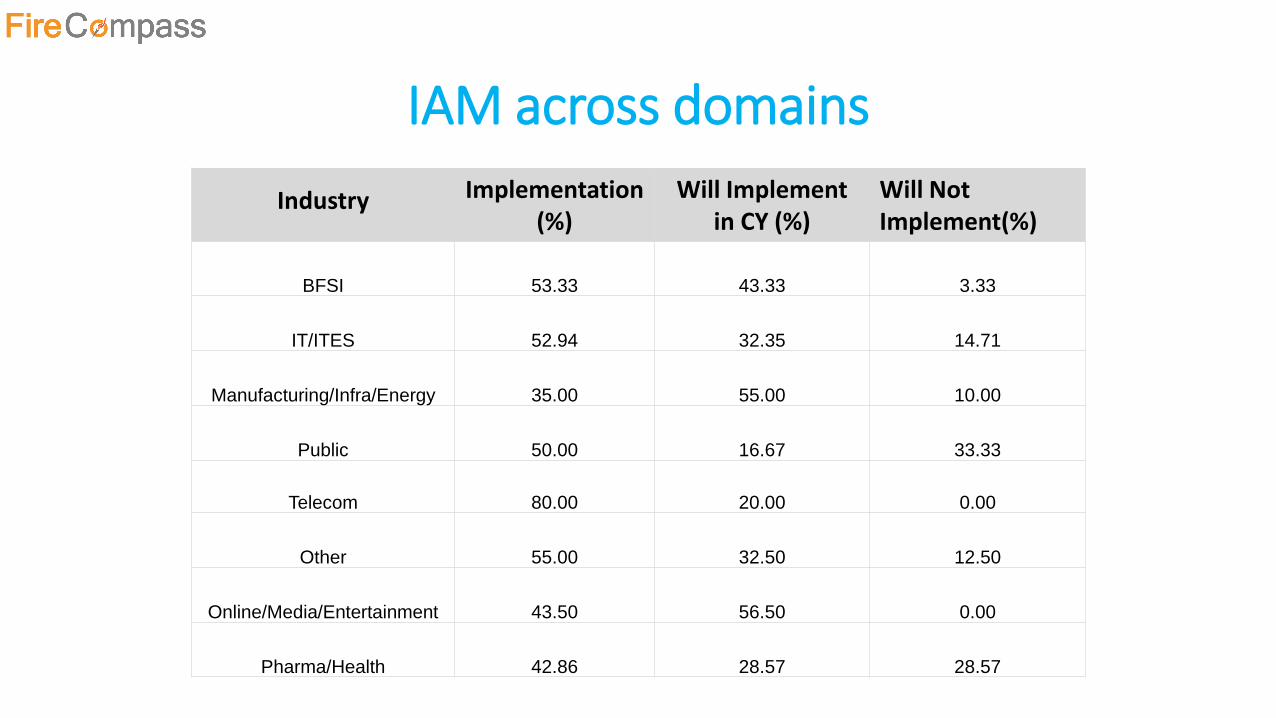
IAM across domains
Industry Implementation (%)
Will Implement in CY (%)
Will Not Implement(%)
BFSI 53.33 43.33 3.33
IT/ITES 52.94 32.35 14.71
Manufacturing/Infra/Energy 35.00 55.00 10.00
Public 50.00 16.67 33.33
Telecom 80.00 20.00 0.00
Other 55.00 32.50 12.50
Online/Media/Entertainment 43.50 56.50 0.00
Pharma/Health 42.86 28.57 28.57
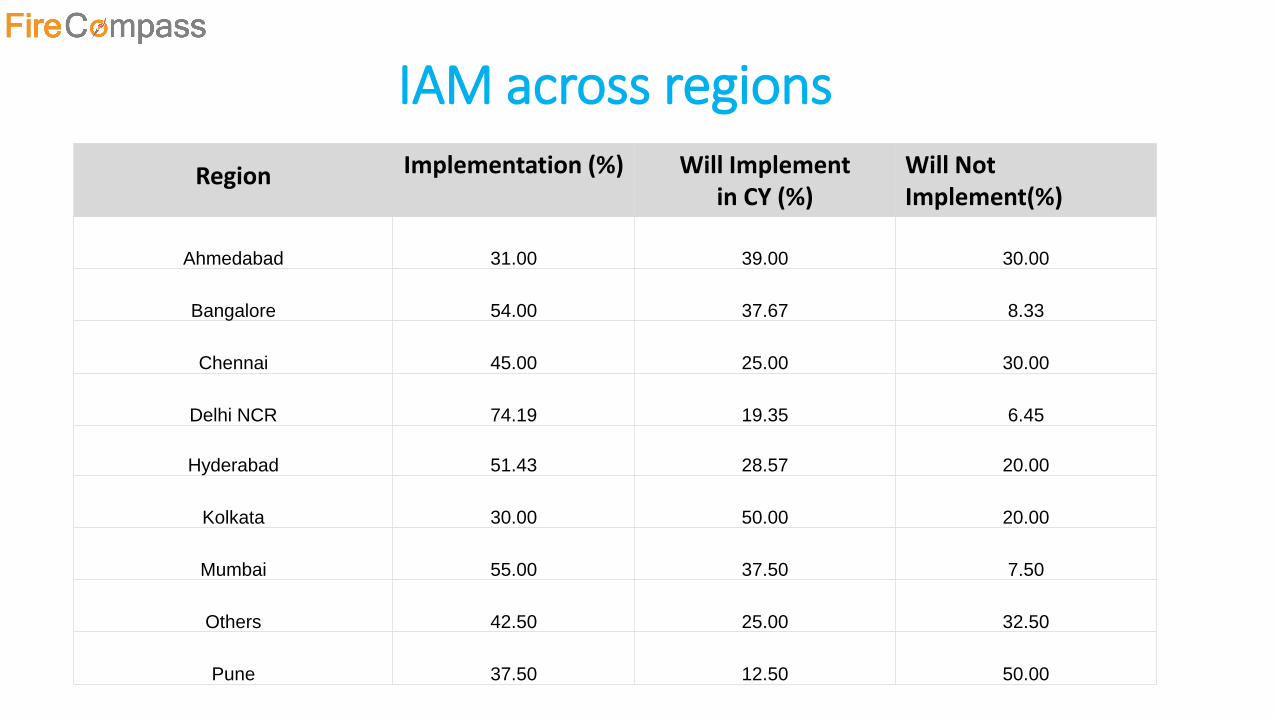
IAM across regions
Region Implementation (%) Will Implement in CY (%)
Will Not Implement(%)
Ahmedabad 31.00 39.00 30.00
Bangalore 54.00 37.67 8.33
Chennai 45.00 25.00 30.00
Delhi NCR 74.19 19.35 6.45
Hyderabad 51.43 28.57 20.00
Kolkata 30.00 50.00 20.00
Mumbai 55.00 37.50 7.50
Others 42.50 25.00 32.50
Pune 37.50 12.50 50.00
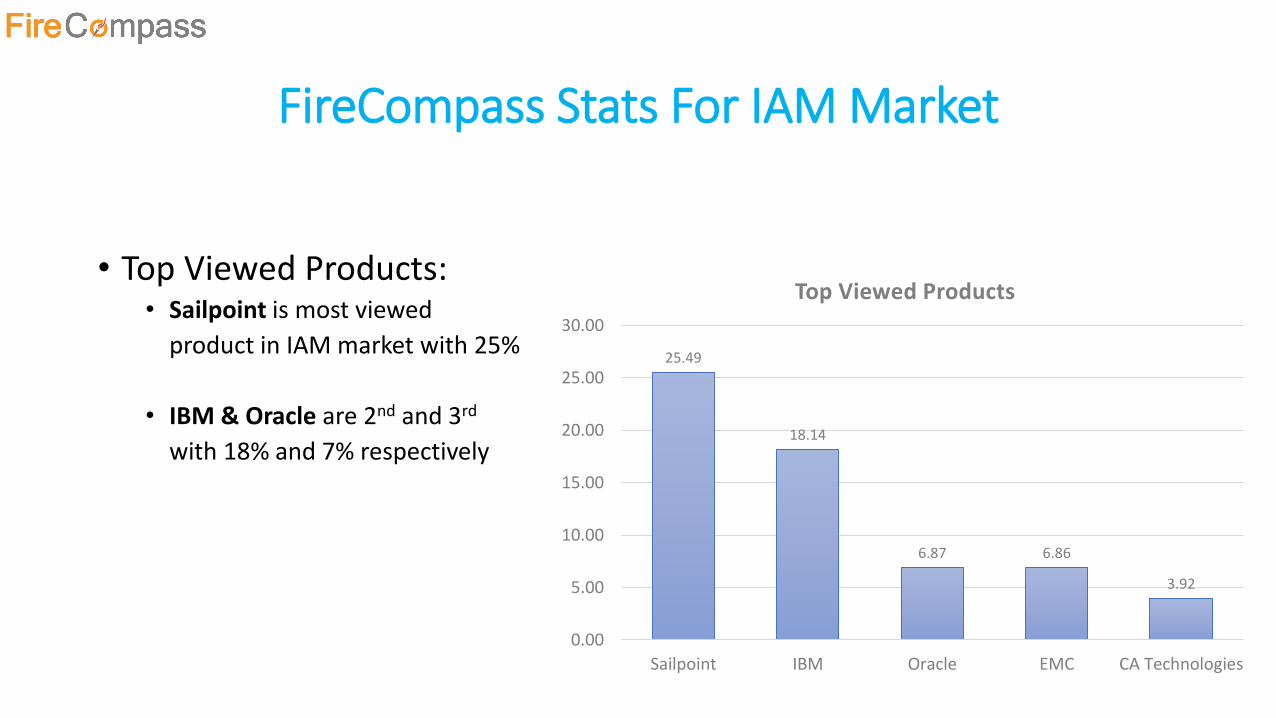
FireCompass Stats For IAM Market
• Top Viewed Products:• Sailpoint is most viewed
product in IAM market with 25%
• IBM & Oracle are 2nd and 3rd
with 18% and 7% respectively
25.49
18.14
6.87 6.86
3.92
0.00
5.00
10.00
15.00
20.00
25.00
30.00
Sailpoint IBM Oracle EMC CA Technologies
Top Viewed Products
FireCompass Stats For IAM Market
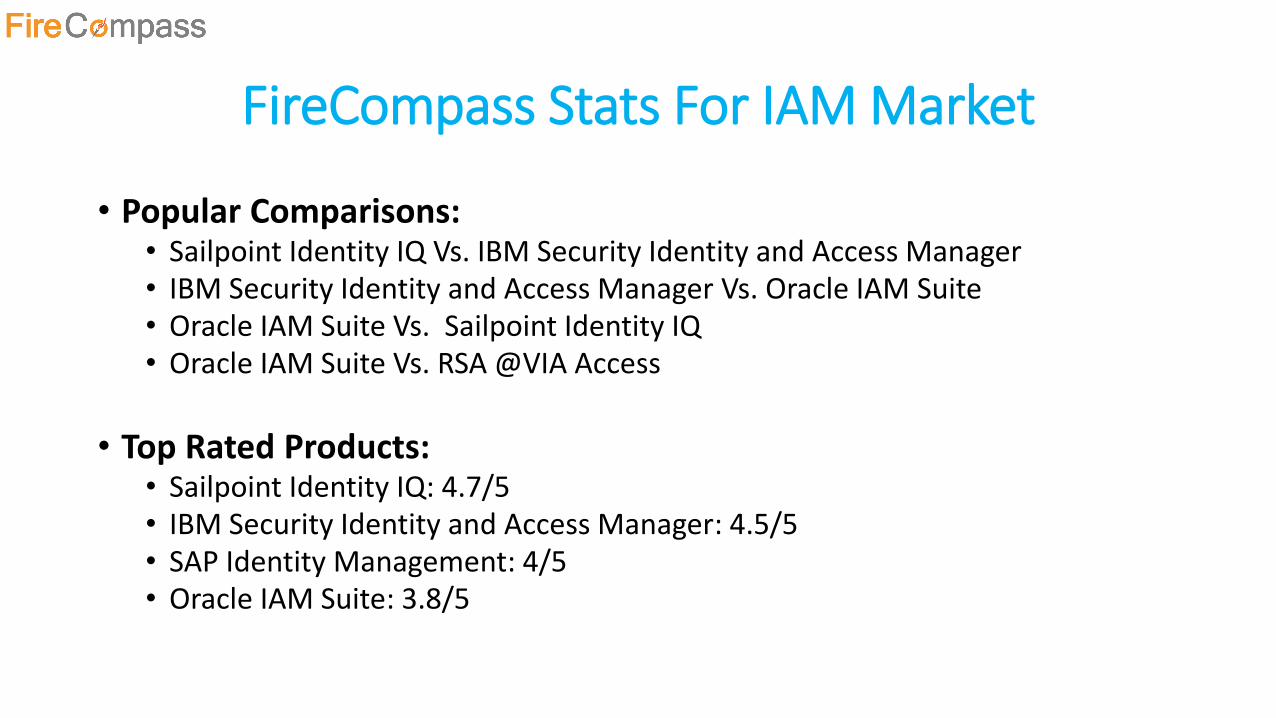
• Popular Comparisons:• Sailpoint Identity IQ Vs. IBM Security Identity and Access Manager• IBM Security Identity and Access Manager Vs. Oracle IAM Suite• Oracle IAM Suite Vs. Sailpoint Identity IQ • Oracle IAM Suite Vs. RSA @VIA Access
• Top Rated Products:• Sailpoint Identity IQ: 4.7/5• IBM Security Identity and Access Manager: 4.5/5• SAP Identity Management: 4/5• Oracle IAM Suite: 3.8/5
Security Information &
Event Management
(SIEM)
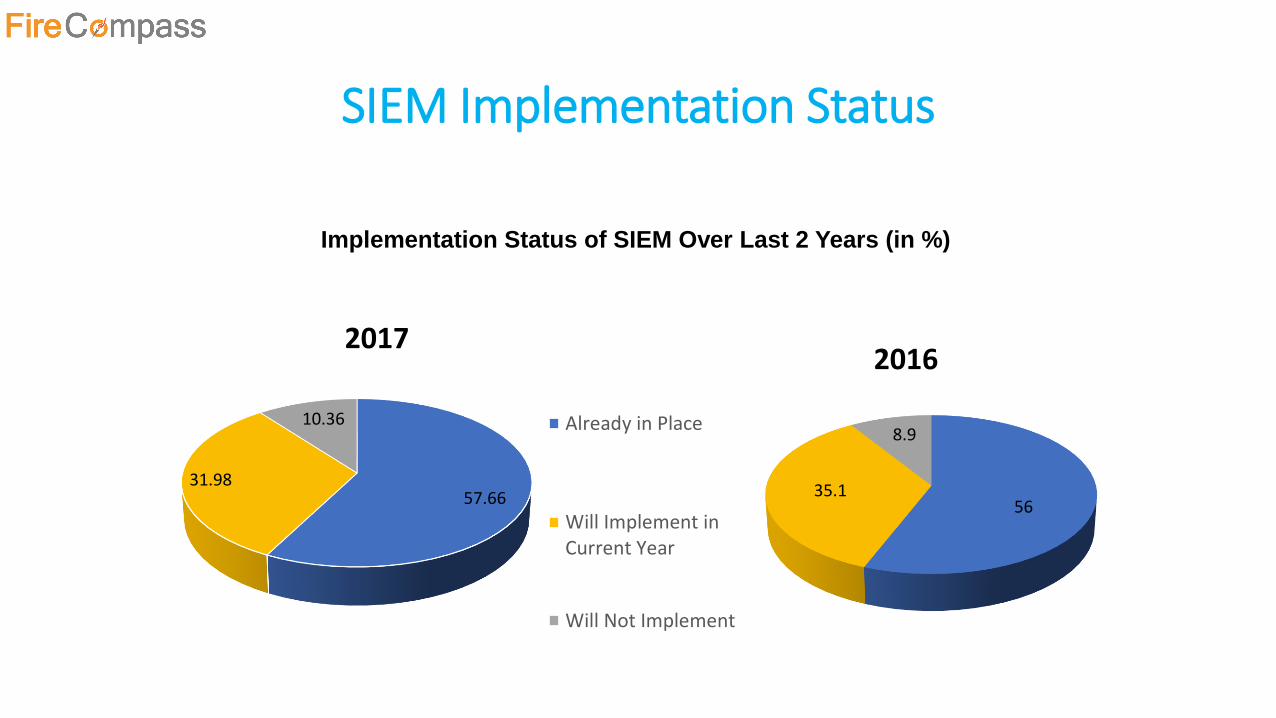
SIEM Implementation Status
Implementation Status of SIEM Over Last 2 Years (in %)
5635.1
8.9
2016
57.6631.98
10.36
2017
Already in Place
Will Implement inCurrent Year
Will Not Implement
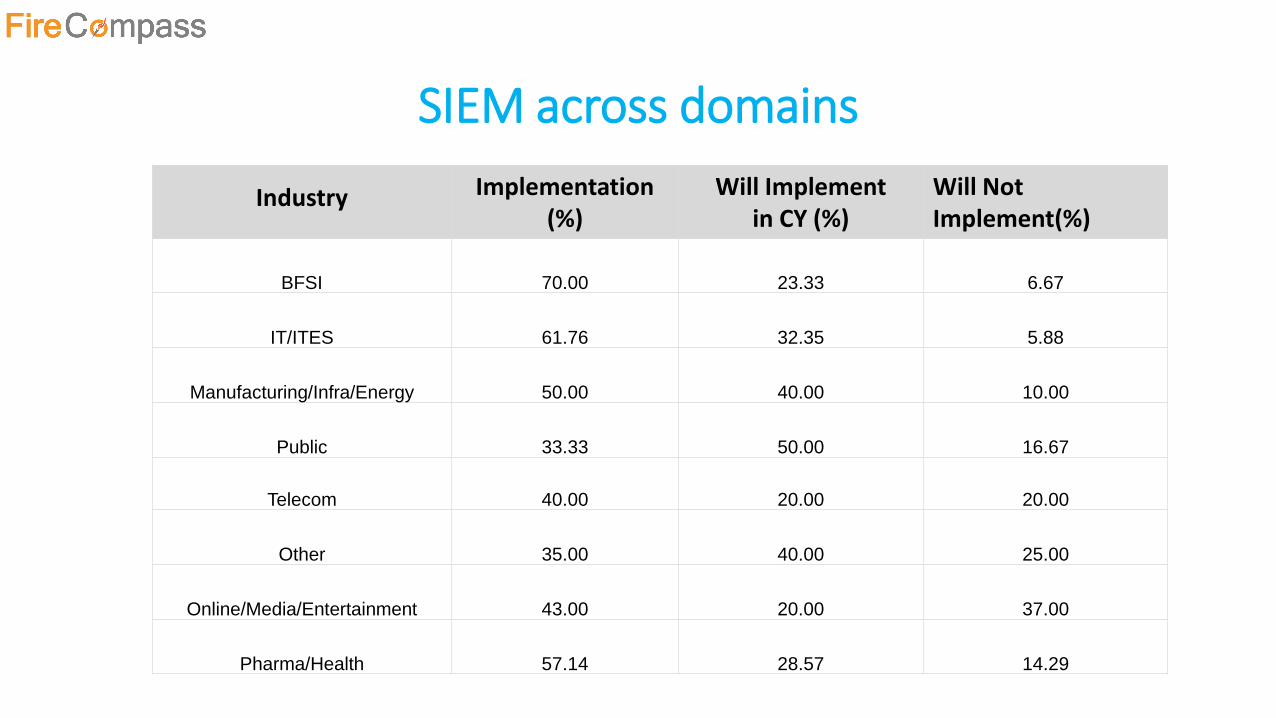
SIEM across domains
Industry Implementation (%)
Will Implement in CY (%)
Will Not Implement(%)
BFSI 70.00 23.33 6.67
IT/ITES 61.76 32.35 5.88
Manufacturing/Infra/Energy 50.00 40.00 10.00
Public 33.33 50.00 16.67
Telecom 40.00 20.00 20.00
Other 35.00 40.00 25.00
Online/Media/Entertainment 43.00 20.00 37.00
Pharma/Health 57.14 28.57 14.29
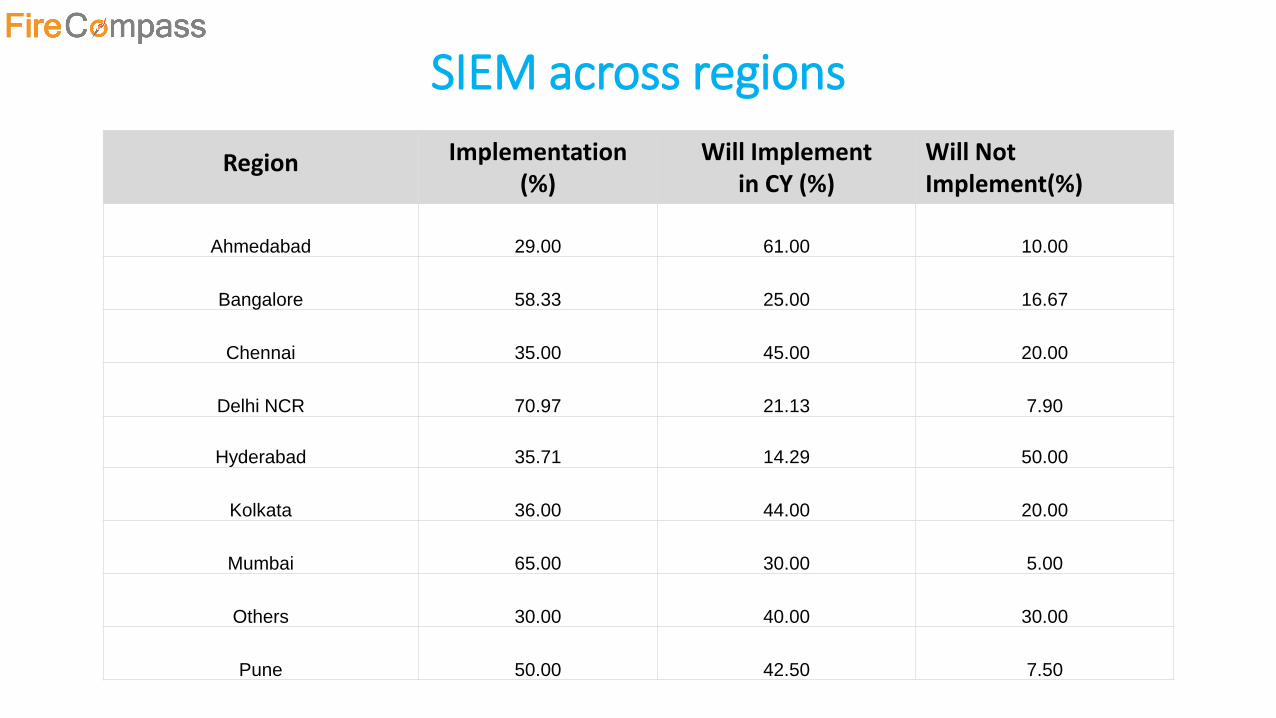
SIEM across regions
Region Implementation (%)
Will Implement in CY (%)
Will Not Implement(%)
Ahmedabad 29.00 61.00 10.00
Bangalore 58.33 25.00 16.67
Chennai 35.00 45.00 20.00
Delhi NCR 70.97 21.13 7.90
Hyderabad 35.71 14.29 50.00
Kolkata 36.00 44.00 20.00
Mumbai 65.00 30.00 5.00
Others 30.00 40.00 30.00
Pune 50.00 42.50 7.50
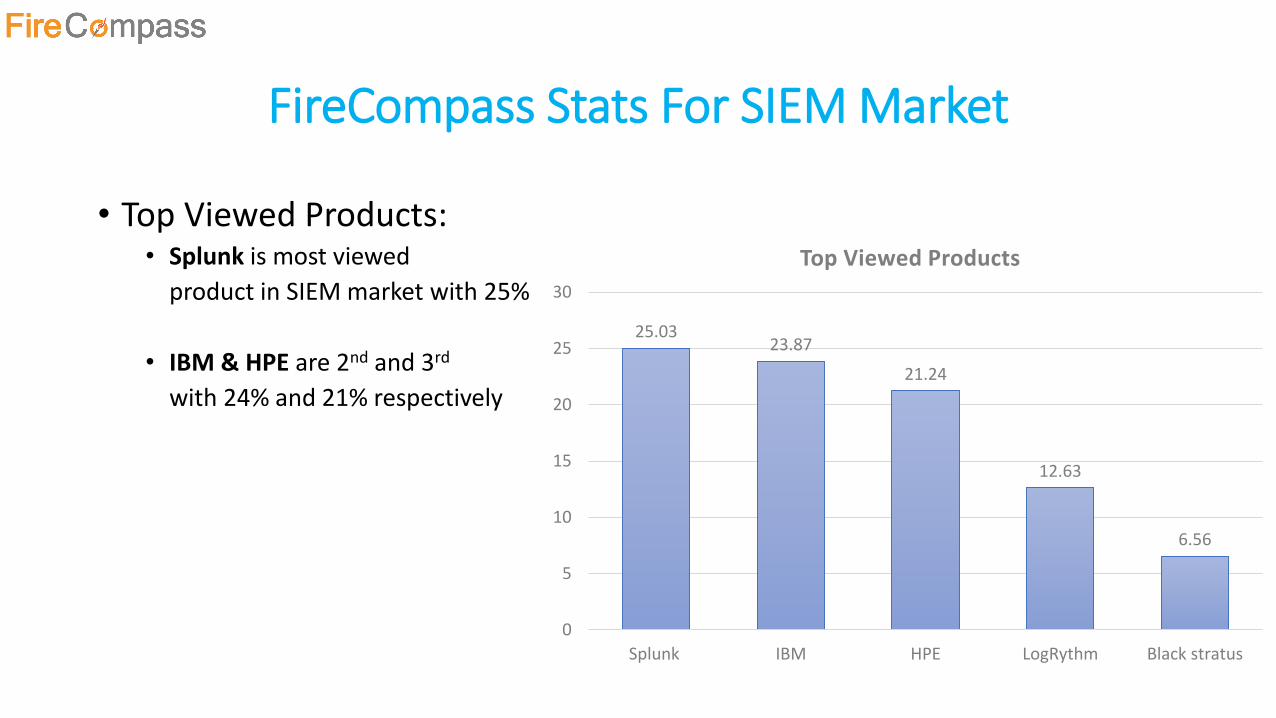
FireCompass Stats For SIEM Market
• Top Viewed Products:• Splunk is most viewed
product in SIEM market with 25%
• IBM & HPE are 2nd and 3rd
with 24% and 21% respectively
25.0323.87
21.24
12.63
6.56
0
5
10
15
20
25
30
Splunk IBM HPE LogRythm Black stratus
Top Viewed Products
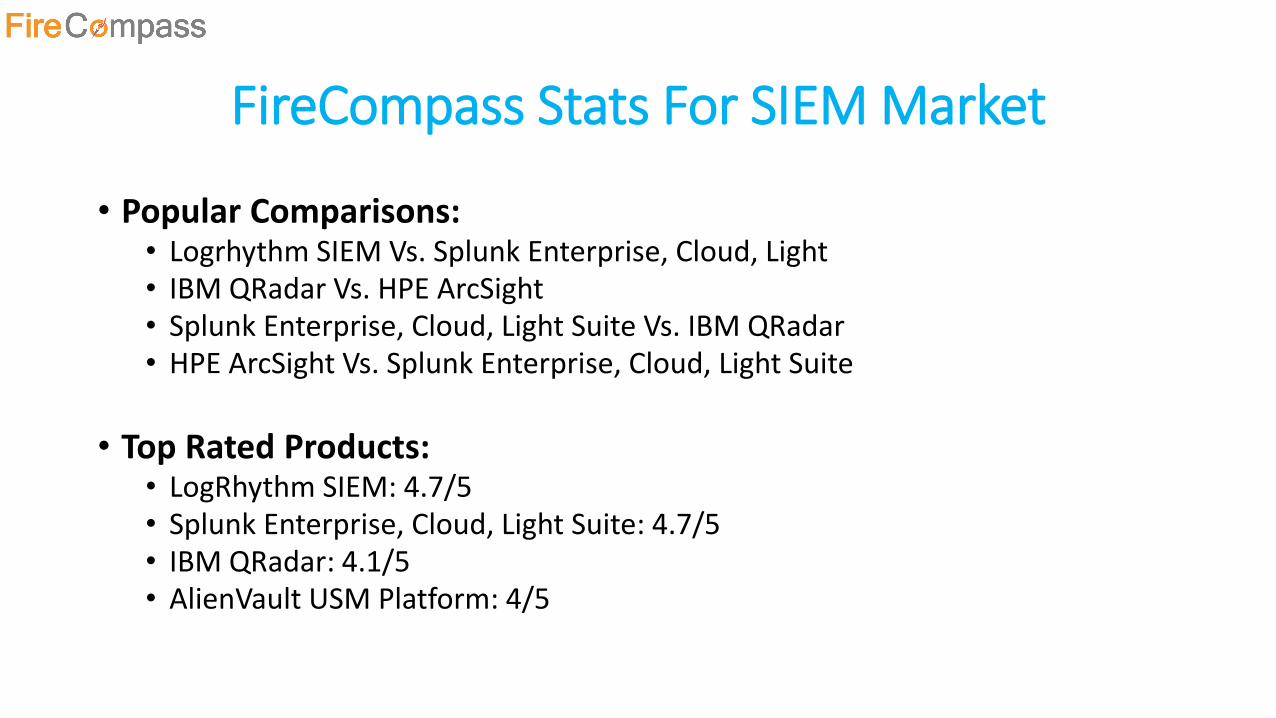
FireCompass Stats For SIEM Market
• Popular Comparisons:• Logrhythm SIEM Vs. Splunk Enterprise, Cloud, Light• IBM QRadar Vs. HPE ArcSight• Splunk Enterprise, Cloud, Light Suite Vs. IBM QRadar • HPE ArcSight Vs. Splunk Enterprise, Cloud, Light Suite
• Top Rated Products:• LogRhythm SIEM: 4.7/5• Splunk Enterprise, Cloud, Light Suite: 4.7/5• IBM QRadar: 4.1/5• AlienVault USM Platform: 4/5
Enterprise Mobility Management (EMM)
EMM Implementation Status
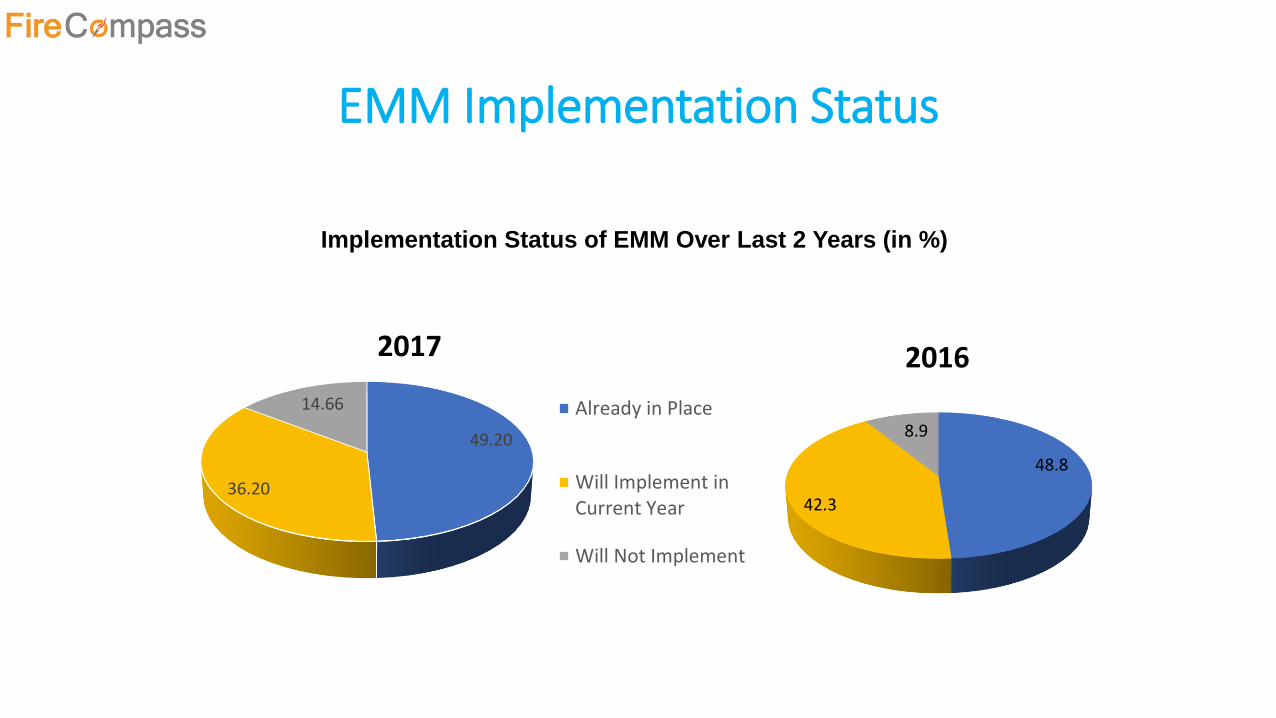
Implementation Status of EMM Over Last 2 Years (in %)
48.8
42.3
8.9
2016
49.20
36.20
14.66
2017
Already in Place
Will Implement inCurrent Year
Will Not Implement
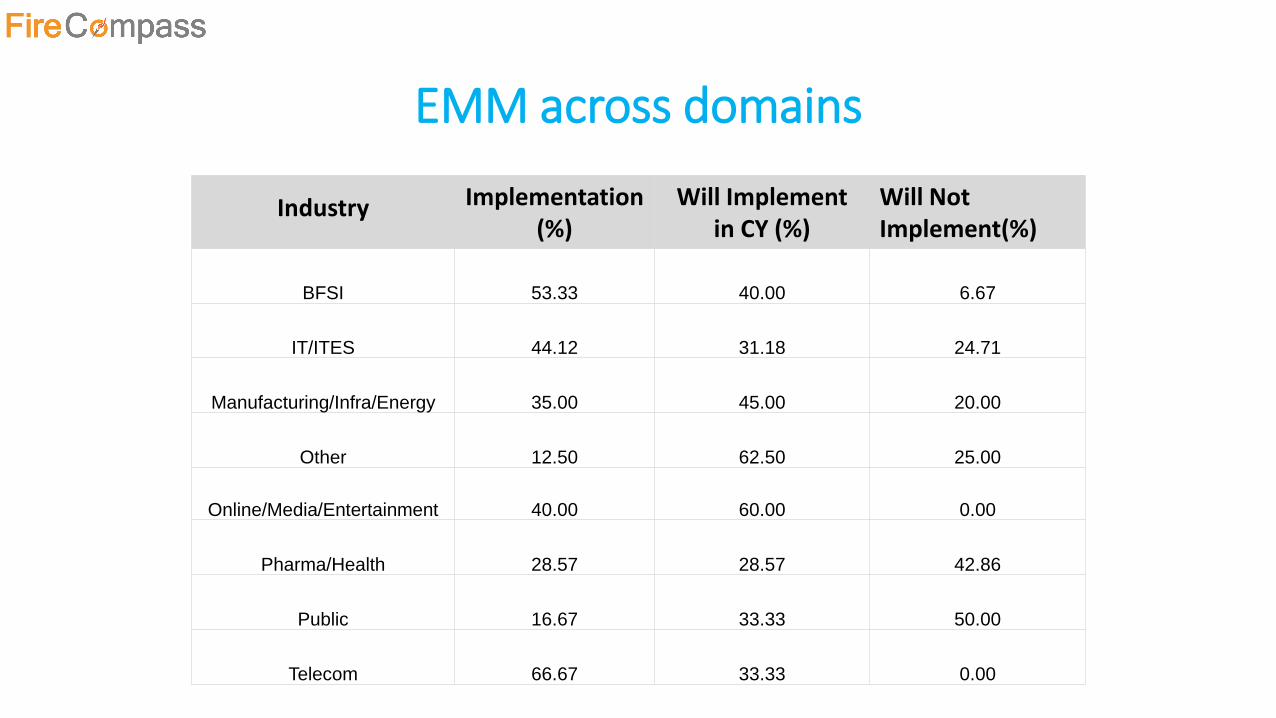
EMM across domains
Industry Implementation (%)
Will Implement in CY (%)
Will Not Implement(%)
BFSI 53.33 40.00 6.67
IT/ITES 44.12 31.18 24.71
Manufacturing/Infra/Energy 35.00 45.00 20.00
Other 12.50 62.50 25.00
Online/Media/Entertainment 40.00 60.00 0.00
Pharma/Health 28.57 28.57 42.86
Public 16.67 33.33 50.00
Telecom 66.67 33.33 0.00
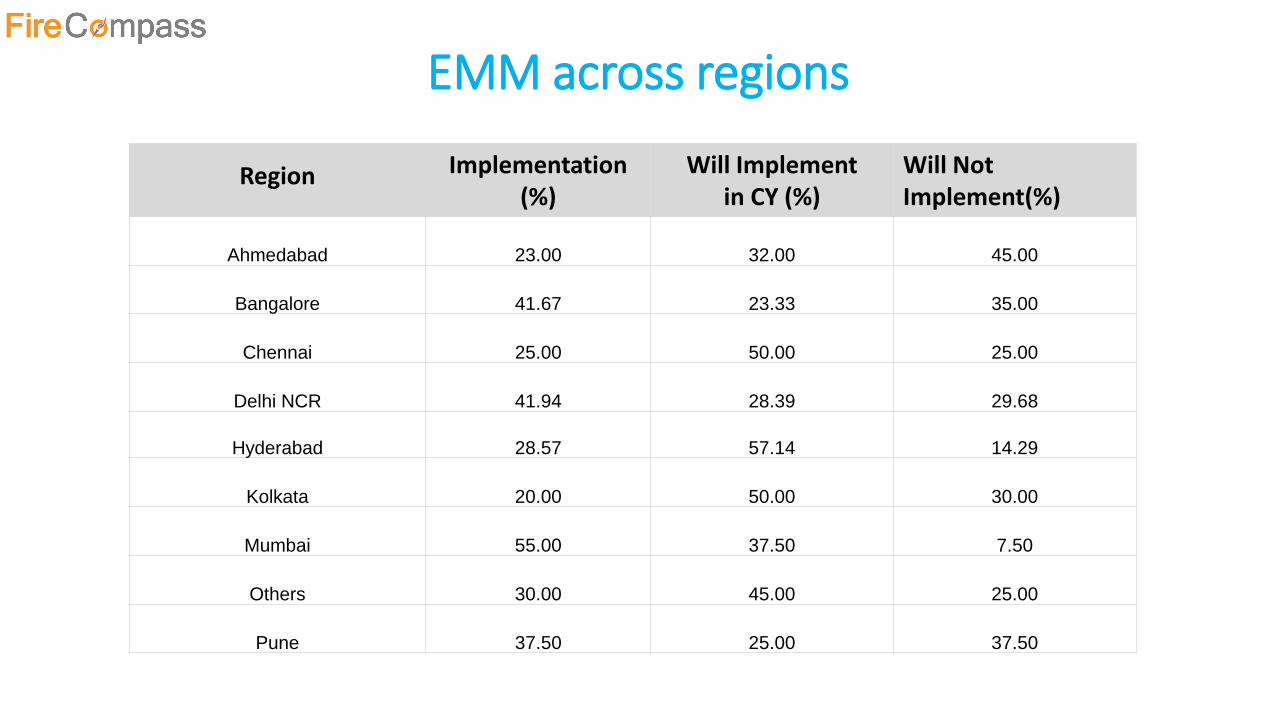
EMM across regions
Region Implementation (%)
Will Implement in CY (%)
Will Not Implement(%)
Ahmedabad 23.00 32.00 45.00
Bangalore 41.67 23.33 35.00
Chennai 25.00 50.00 25.00
Delhi NCR 41.94 28.39 29.68
Hyderabad 28.57 57.14 14.29
Kolkata 20.00 50.00 30.00
Mumbai 55.00 37.50 7.50
Others 30.00 45.00 25.00
Pune 37.50 25.00 37.50
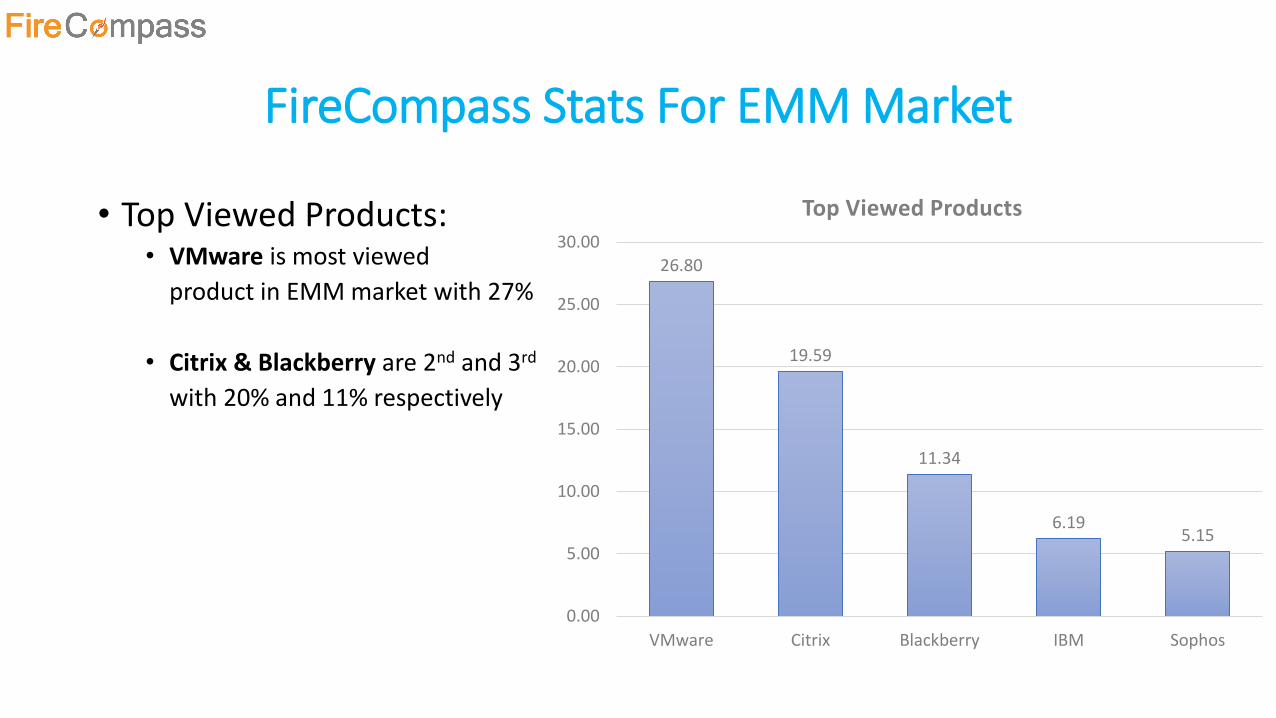
FireCompass Stats For EMM Market
• Top Viewed Products:• VMware is most viewed
product in EMM market with 27%
• Citrix & Blackberry are 2nd and 3rd
with 20% and 11% respectively
26.80
19.59
11.34
6.195.15
0.00
5.00
10.00
15.00
20.00
25.00
30.00
VMware Citrix Blackberry IBM Sophos
Top Viewed Products
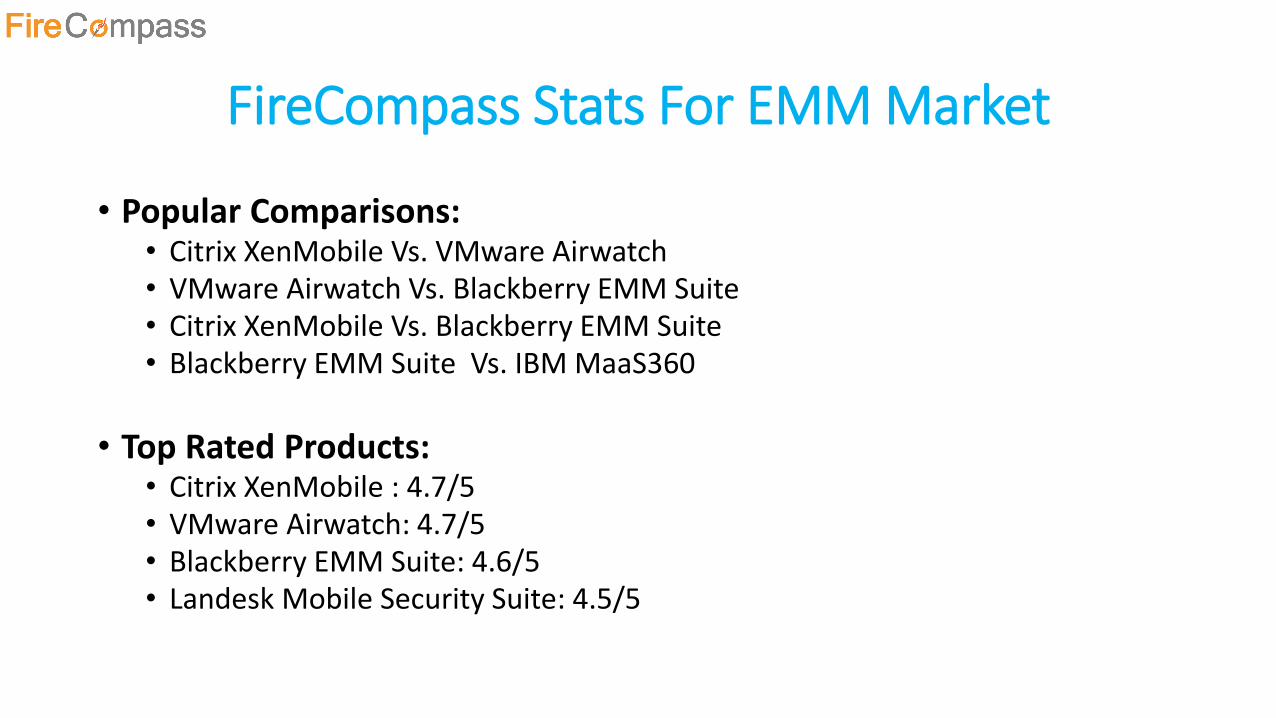
FireCompass Stats For EMM Market
• Popular Comparisons:• Citrix XenMobile Vs. VMware Airwatch• VMware Airwatch Vs. Blackberry EMM Suite• Citrix XenMobile Vs. Blackberry EMM Suite• Blackberry EMM Suite Vs. IBM MaaS360
• Top Rated Products:• Citrix XenMobile : 4.7/5• VMware Airwatch: 4.7/5• Blackberry EMM Suite: 4.6/5• Landesk Mobile Security Suite: 4.5/5
Next Generation Firewall
(NGFW)
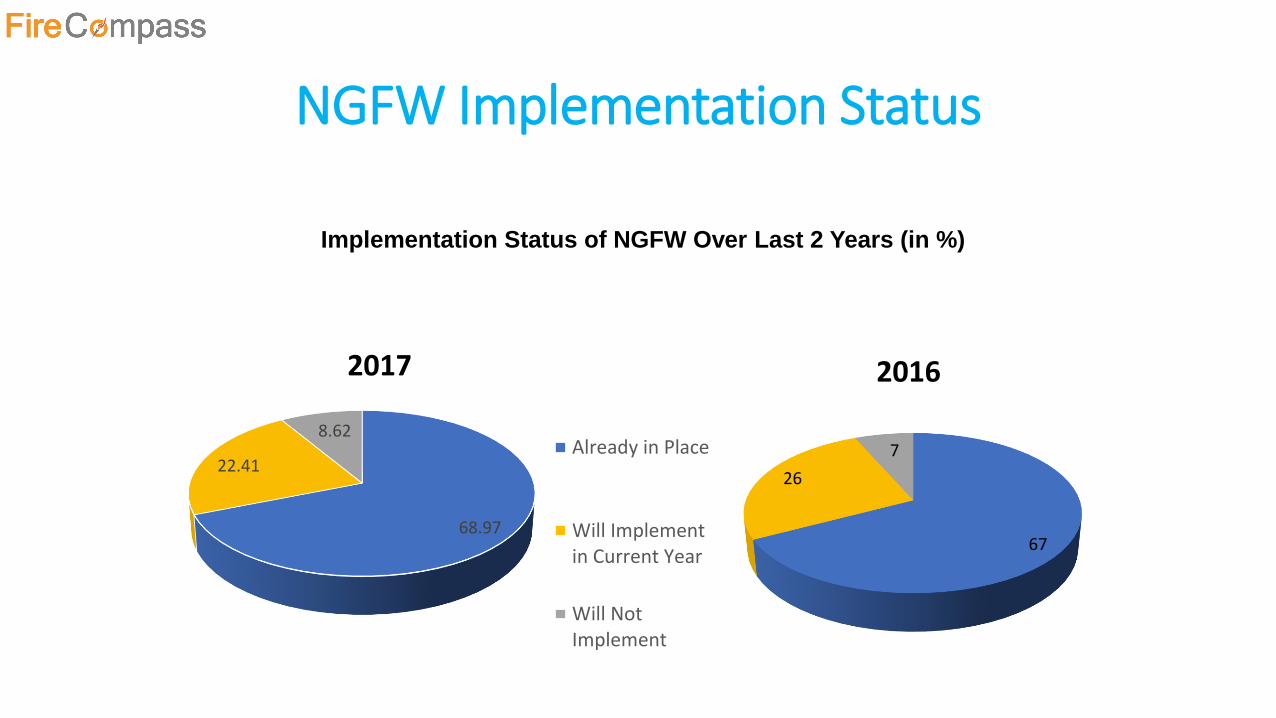
NGFW Implementation Status
Implementation Status of NGFW Over Last 2 Years (in %)
67
26
7
2016
68.97
22.41
8.62
2017
Already in Place
Will Implementin Current Year
Will NotImplement
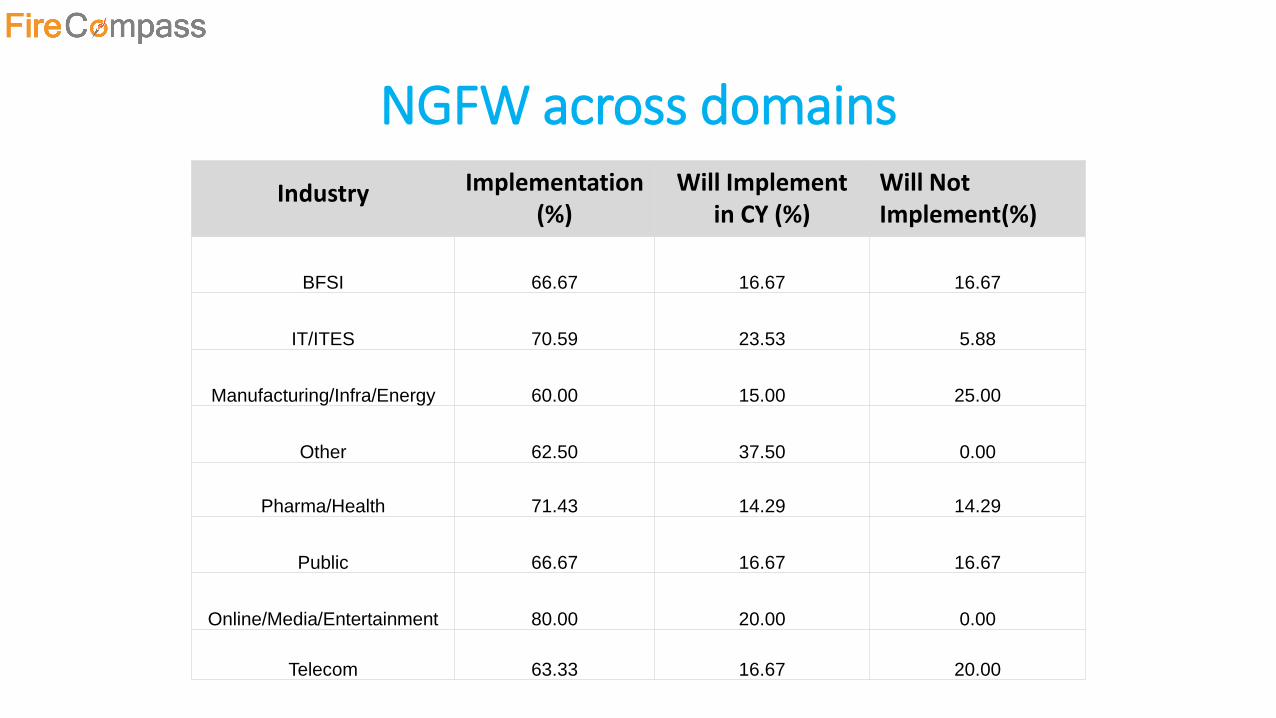
NGFW across domains
Industry Implementation (%)
Will Implement in CY (%)
Will Not Implement(%)
BFSI 66.67 16.67 16.67
IT/ITES 70.59 23.53 5.88
Manufacturing/Infra/Energy 60.00 15.00 25.00
Other 62.50 37.50 0.00
Pharma/Health 71.43 14.29 14.29
Public 66.67 16.67 16.67
Online/Media/Entertainment 80.00 20.00 0.00
Telecom 63.33 16.67 20.00
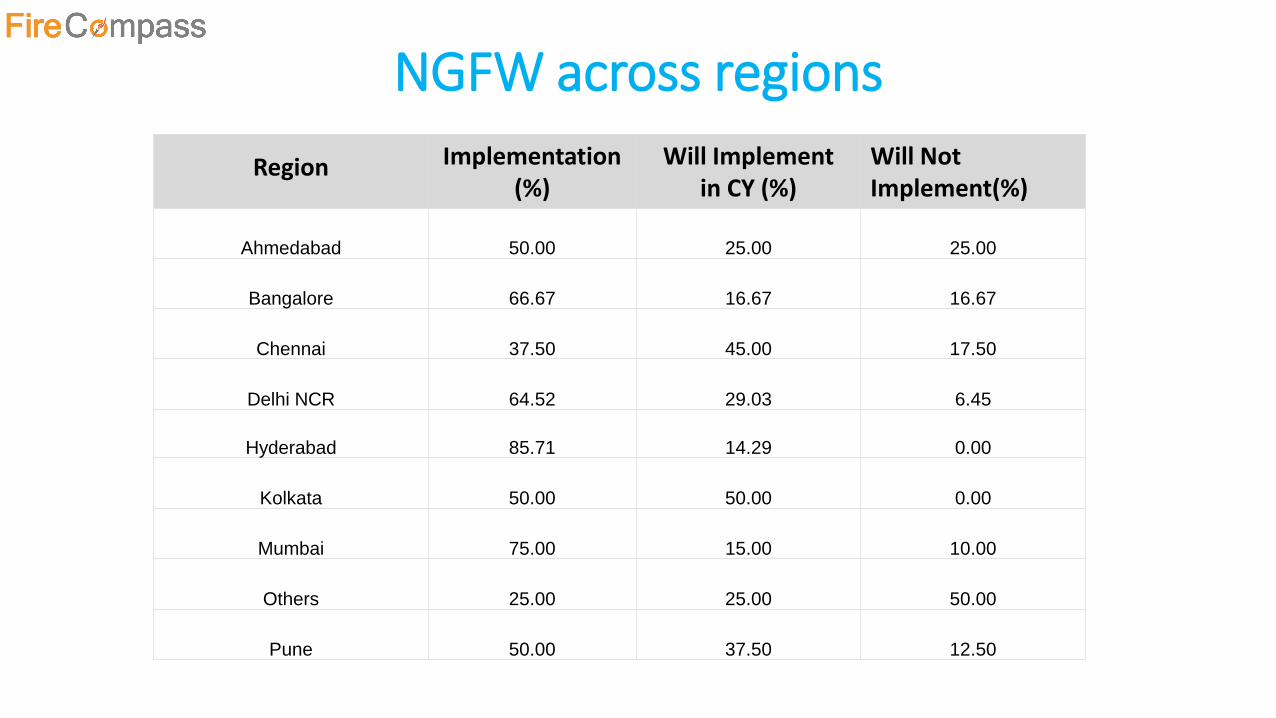
NGFW across regions
Region Implementation (%)
Will Implement in CY (%)
Will Not Implement(%)
Ahmedabad 50.00 25.00 25.00
Bangalore 66.67 16.67 16.67
Chennai 37.50 45.00 17.50
Delhi NCR 64.52 29.03 6.45
Hyderabad 85.71 14.29 0.00
Kolkata 50.00 50.00 0.00
Mumbai 75.00 15.00 10.00
Others 25.00 25.00 50.00
Pune 50.00 37.50 12.50
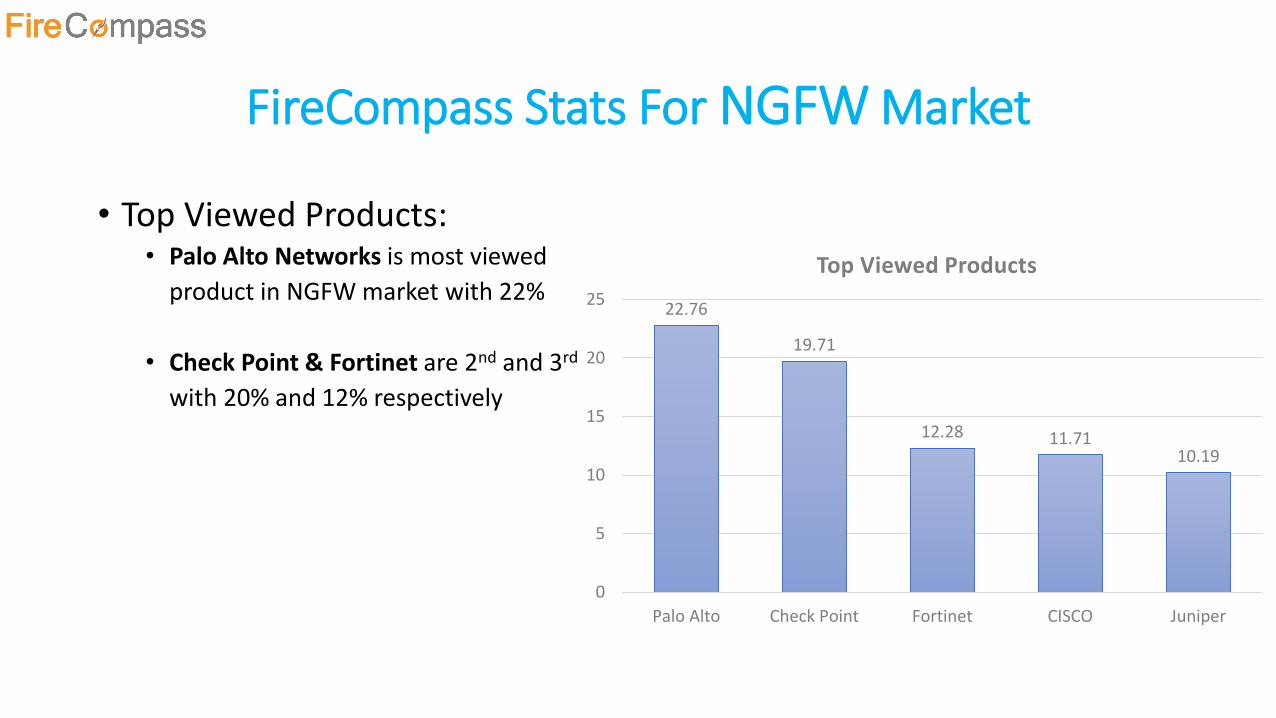
FireCompass Stats For NGFW Market
• Top Viewed Products:• Palo Alto Networks is most viewed
product in NGFW market with 22%
• Check Point & Fortinet are 2nd and 3rd
with 20% and 12% respectively
22.76
19.71
12.28 11.7110.19
0
5
10
15
20
25
Palo Alto Check Point Fortinet CISCO Juniper
Top Viewed Products
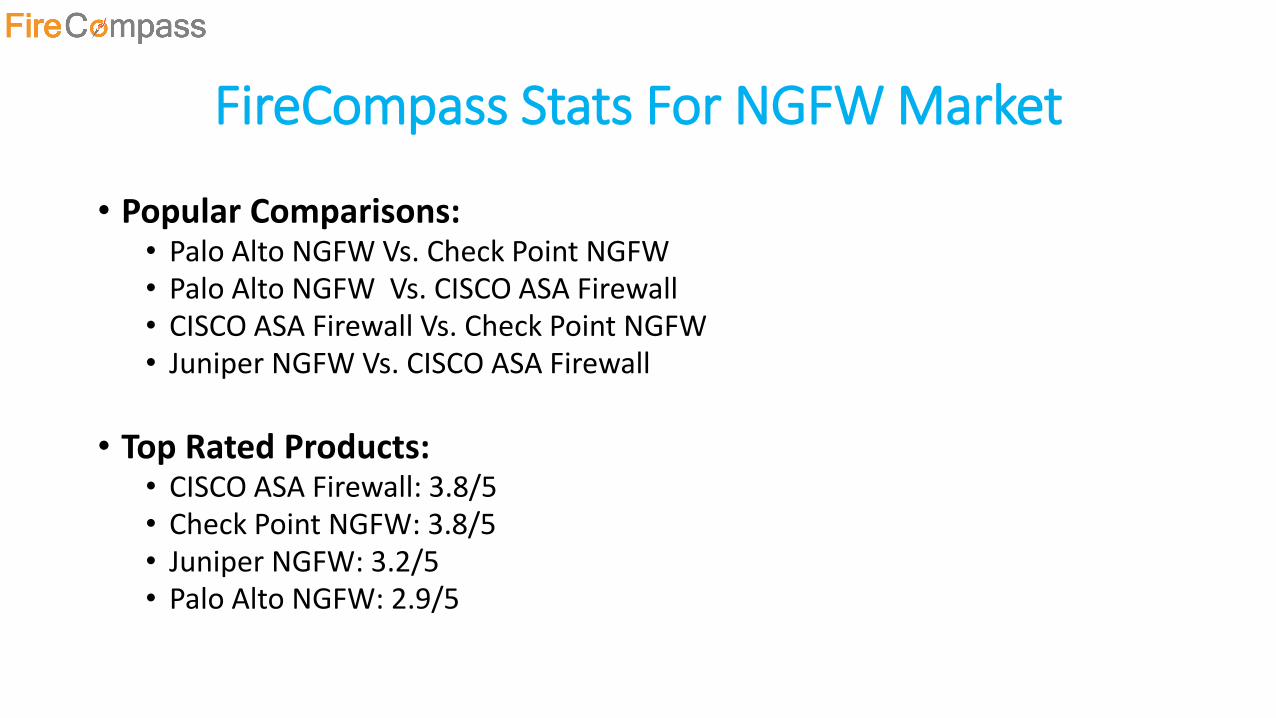
FireCompass Stats For NGFW Market
• Popular Comparisons:• Palo Alto NGFW Vs. Check Point NGFW• Palo Alto NGFW Vs. CISCO ASA Firewall• CISCO ASA Firewall Vs. Check Point NGFW• Juniper NGFW Vs. CISCO ASA Firewall
• Top Rated Products:• CISCO ASA Firewall: 3.8/5• Check Point NGFW: 3.8/5 • Juniper NGFW: 3.2/5 • Palo Alto NGFW: 2.9/5
Data Loss Prevention
(DLP)
DLP Implementation Status
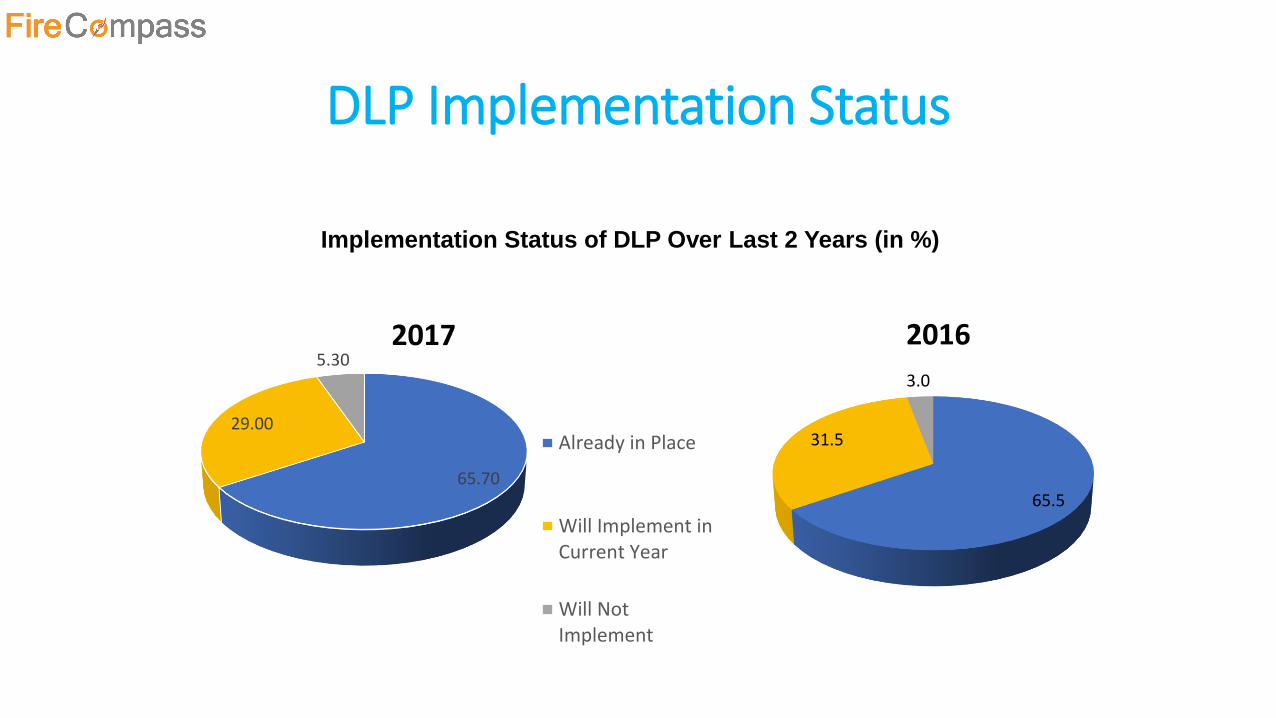
Implementation Status of DLP Over Last 2 Years (in %)
65.5
31.5
3.0
2016
65.70
29.00
5.302017
Already in Place
Will Implement inCurrent Year
Will NotImplement
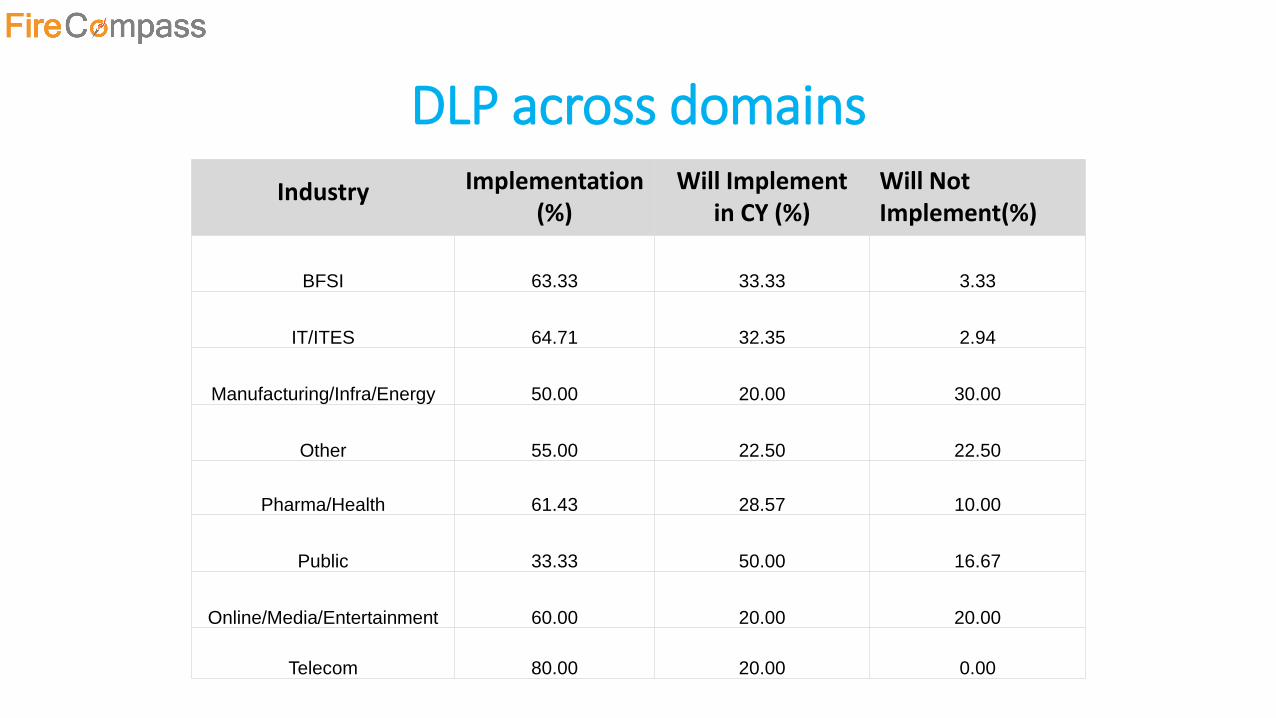
DLP across domains
Industry Implementation (%)
Will Implement in CY (%)
Will Not Implement(%)
BFSI 63.33 33.33 3.33
IT/ITES 64.71 32.35 2.94
Manufacturing/Infra/Energy 50.00 20.00 30.00
Other 55.00 22.50 22.50
Pharma/Health 61.43 28.57 10.00
Public 33.33 50.00 16.67
Online/Media/Entertainment 60.00 20.00 20.00
Telecom 80.00 20.00 0.00
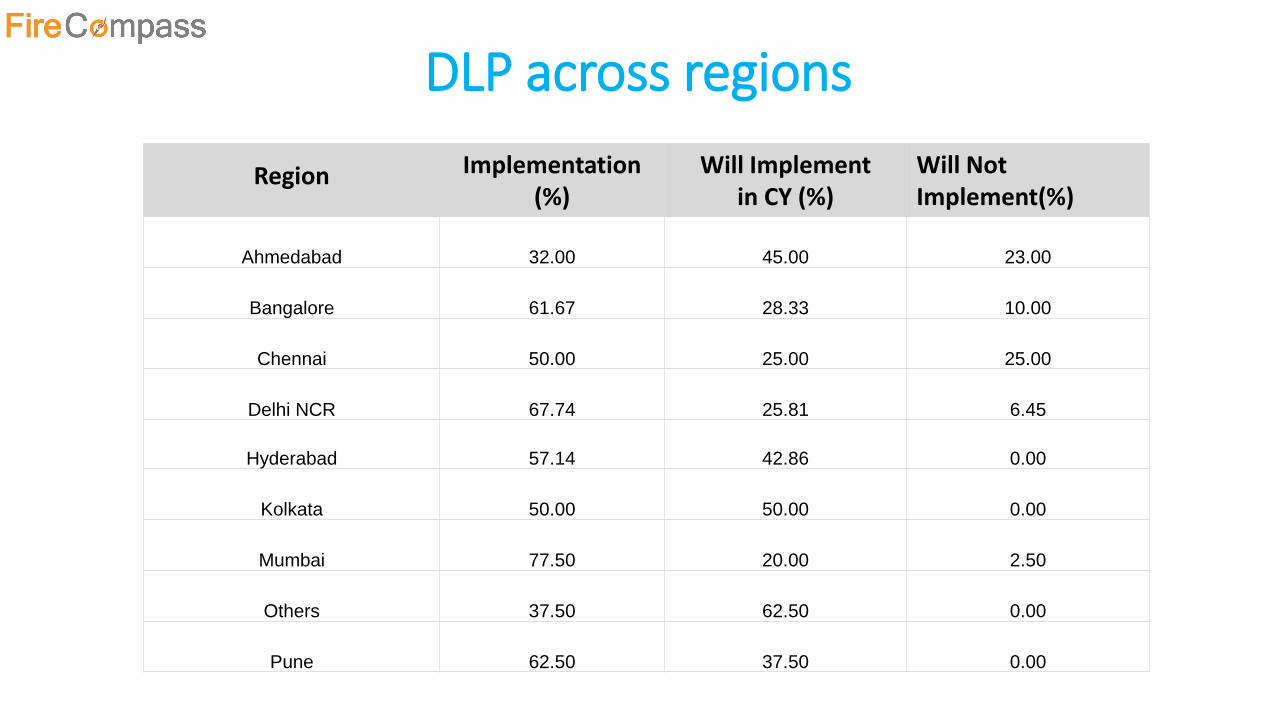
DLP across regions
Region Implementation (%)
Will Implement in CY (%)
Will Not Implement(%)
Ahmedabad 32.00 45.00 23.00
Bangalore 61.67 28.33 10.00
Chennai 50.00 25.00 25.00
Delhi NCR 67.74 25.81 6.45
Hyderabad 57.14 42.86 0.00
Kolkata 50.00 50.00 0.00
Mumbai 77.50 20.00 2.50
Others 37.50 62.50 0.00
Pune 62.50 37.50 0.00
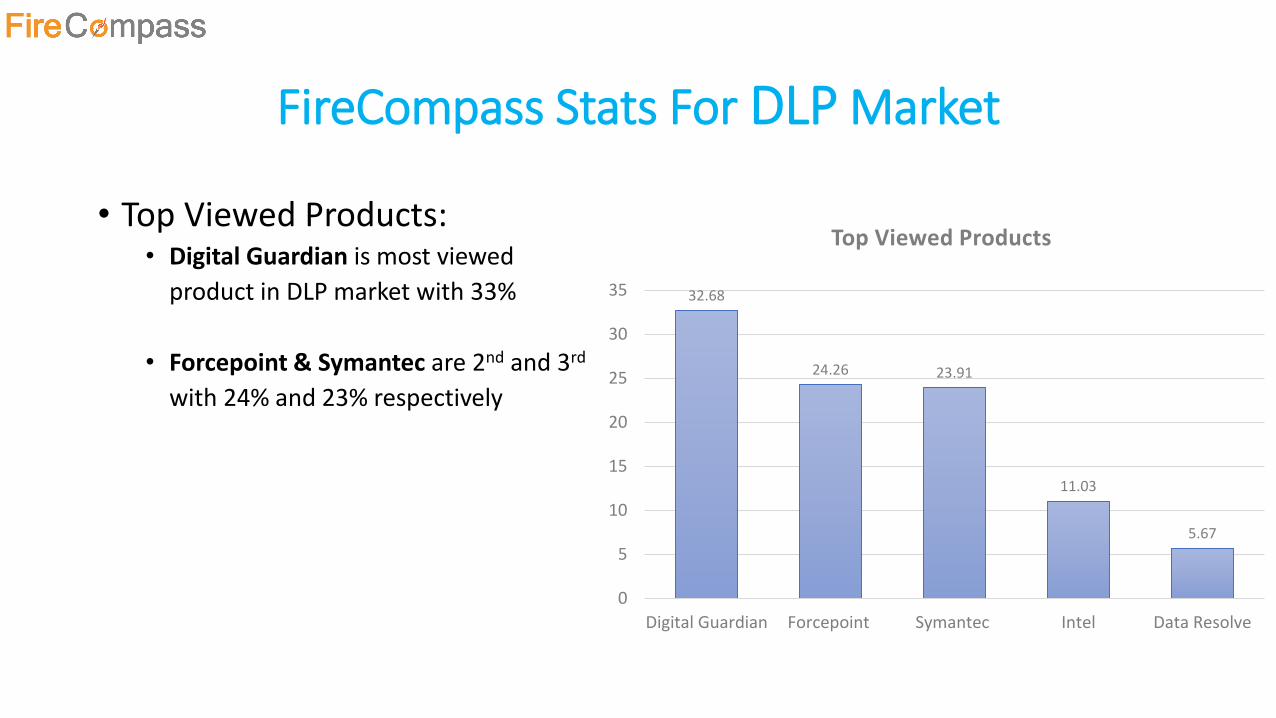
FireCompass Stats For DLP Market
• Top Viewed Products:• Digital Guardian is most viewed
product in DLP market with 33%
• Forcepoint & Symantec are 2nd and 3rd
with 24% and 23% respectively
32.68
24.26 23.91
11.03
5.67
0
5
10
15
20
25
30
35
Digital Guardian Forcepoint Symantec Intel Data Resolve
Top Viewed Products
FireCompass Stats For DLP Market
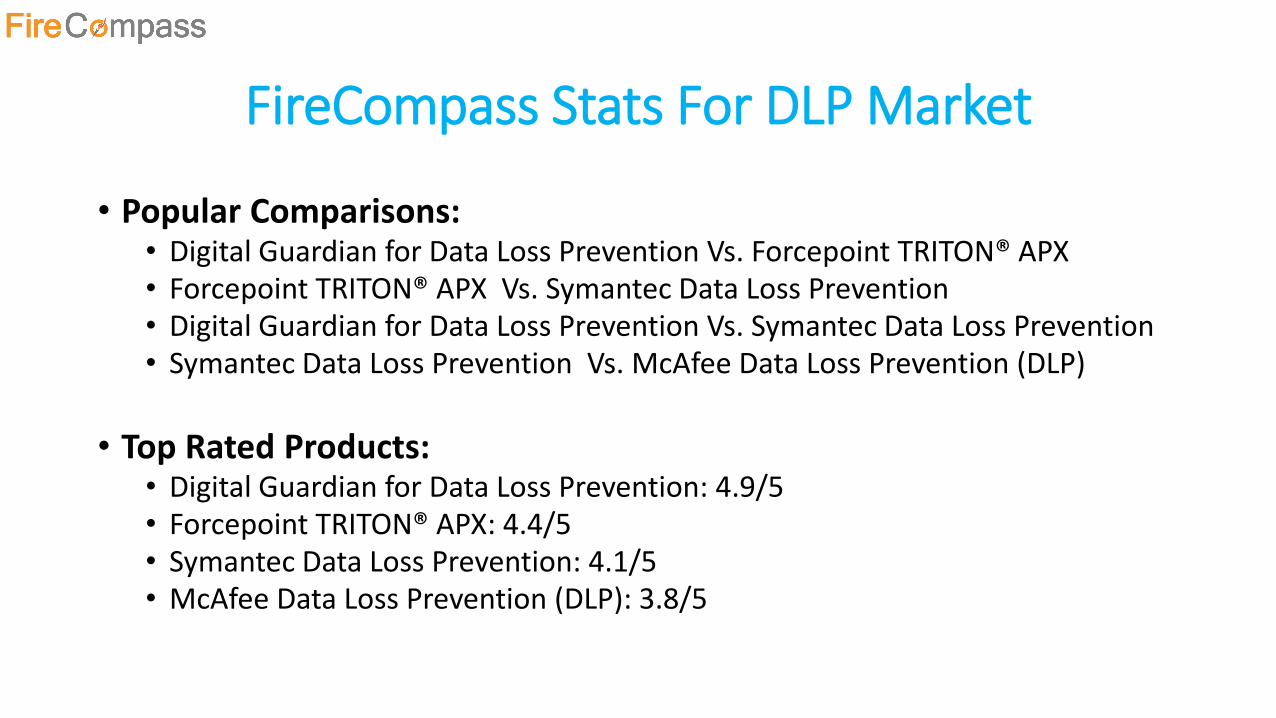
• Popular Comparisons:• Digital Guardian for Data Loss Prevention Vs. Forcepoint TRITON® APX• Forcepoint TRITON® APX Vs. Symantec Data Loss Prevention• Digital Guardian for Data Loss Prevention Vs. Symantec Data Loss Prevention• Symantec Data Loss Prevention Vs. McAfee Data Loss Prevention (DLP)
• Top Rated Products:• Digital Guardian for Data Loss Prevention: 4.9/5• Forcepoint TRITON® APX: 4.4/5 • Symantec Data Loss Prevention: 4.1/5 • McAfee Data Loss Prevention (DLP): 3.8/5
Network Advanced Threat Protection
(ATP)
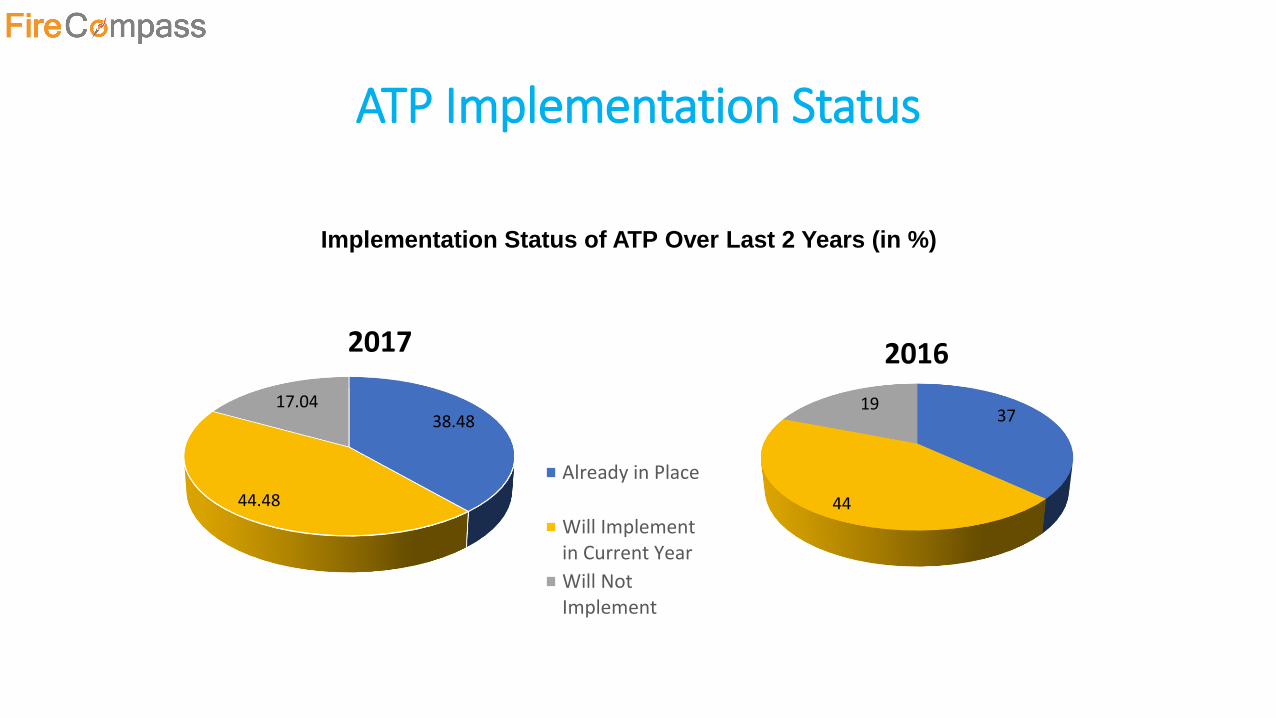
ATP Implementation Status
Implementation Status of ATP Over Last 2 Years (in %)
37
44
19
2016
38.48
44.48
17.04
2017
Already in Place
Will Implementin Current Year
Will NotImplement
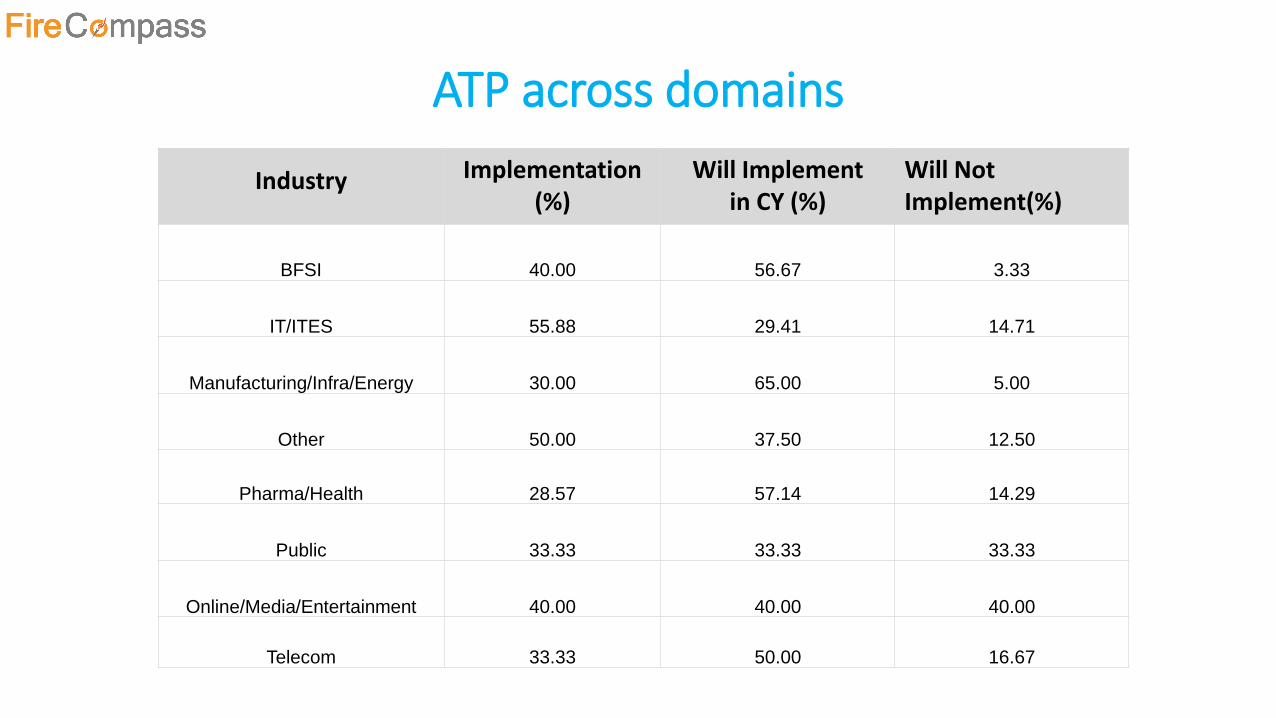
ATP across domains
Industry Implementation (%)
Will Implement in CY (%)
Will Not Implement(%)
BFSI 40.00 56.67 3.33
IT/ITES 55.88 29.41 14.71
Manufacturing/Infra/Energy 30.00 65.00 5.00
Other 50.00 37.50 12.50
Pharma/Health 28.57 57.14 14.29
Public 33.33 33.33 33.33
Online/Media/Entertainment 40.00 40.00 40.00
Telecom 33.33 50.00 16.67
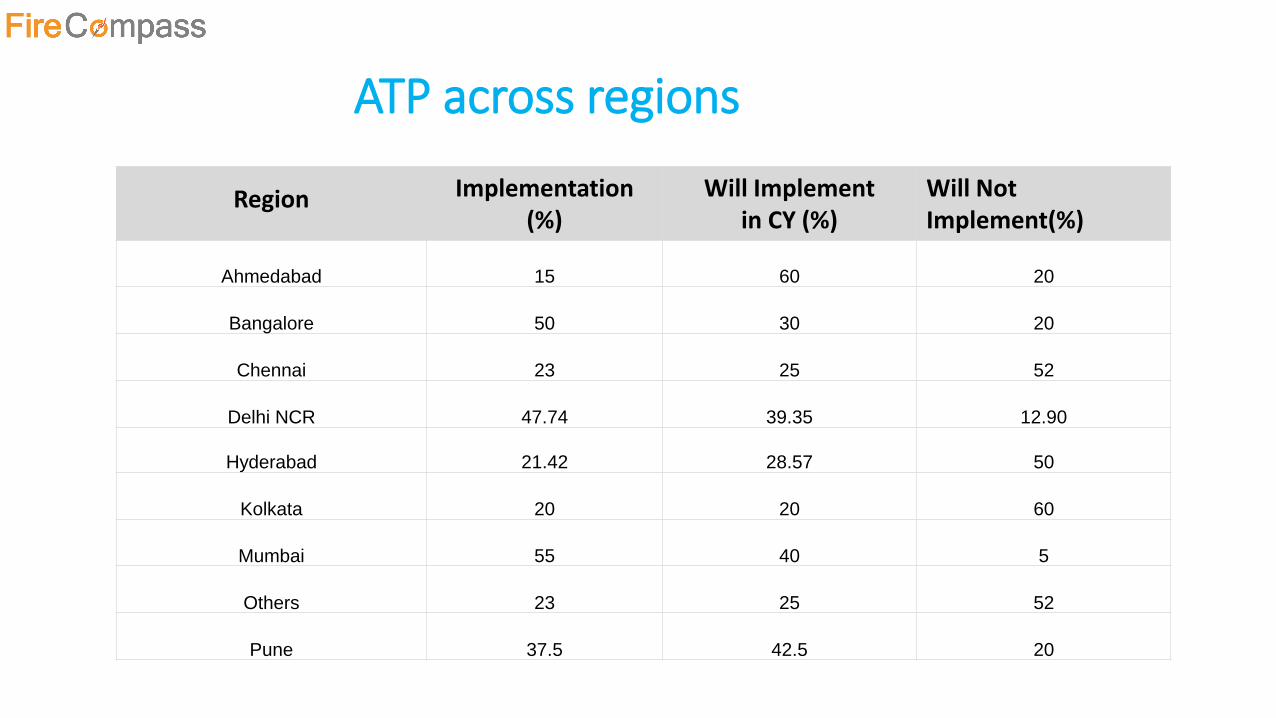
ATP across regions
Region Implementation (%)
Will Implement in CY (%)
Will Not Implement(%)
Ahmedabad 15 60 20
Bangalore 50 30 20
Chennai 23 25 52
Delhi NCR 47.74 39.35 12.90
Hyderabad 21.42 28.57 50
Kolkata 20 20 60
Mumbai 55 40 5
Others 23 25 52
Pune 37.5 42.5 20
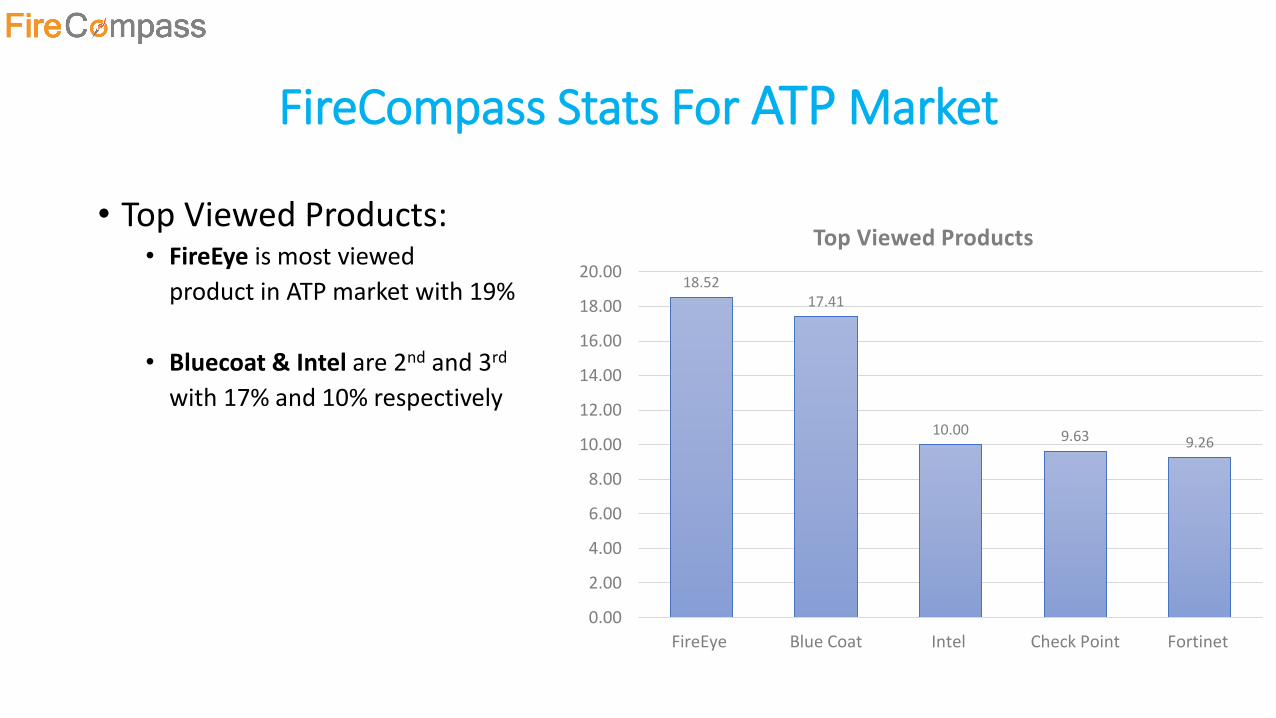
FireCompass Stats For ATP Market
• Top Viewed Products:• FireEye is most viewed
product in ATP market with 19%
• Bluecoat & Intel are 2nd and 3rd
with 17% and 10% respectively
18.5217.41
10.00 9.63 9.26
0.00
2.00
4.00
6.00
8.00
10.00
12.00
14.00
16.00
18.00
20.00
FireEye Blue Coat Intel Check Point Fortinet
Top Viewed Products
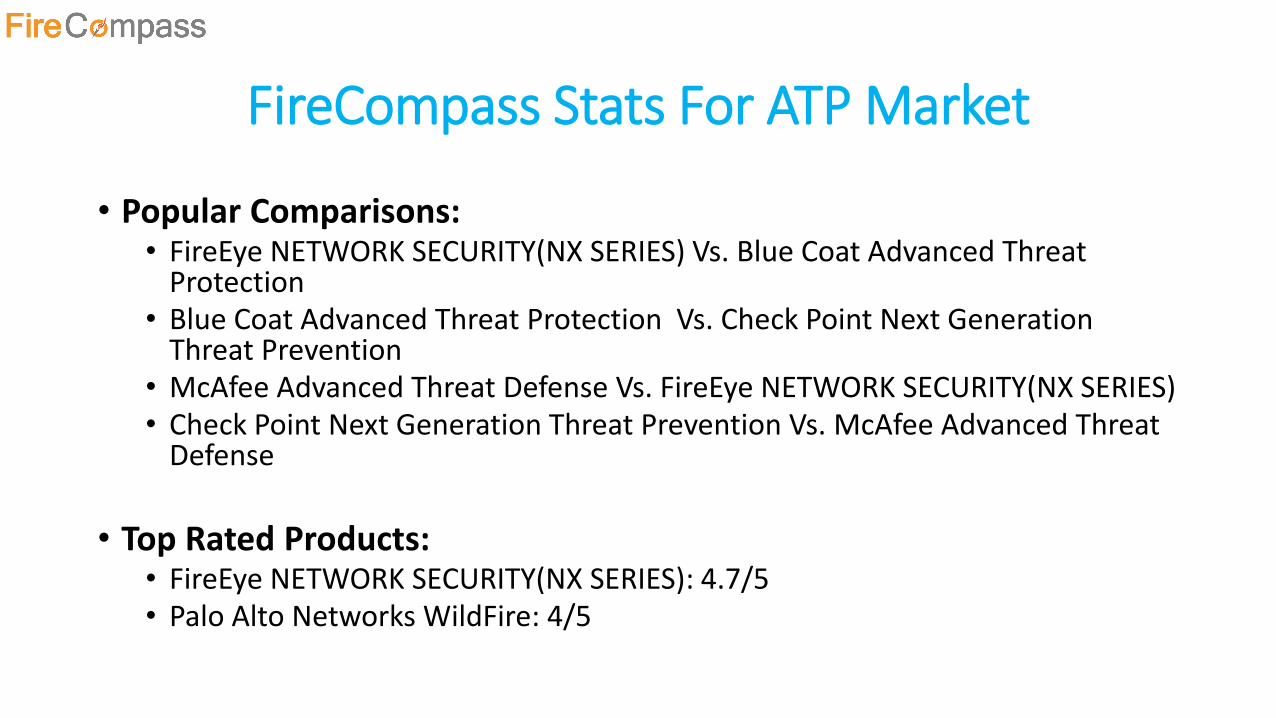
FireCompass Stats For ATP Market
• Popular Comparisons:• FireEye NETWORK SECURITY(NX SERIES) Vs. Blue Coat Advanced Threat
Protection• Blue Coat Advanced Threat Protection Vs. Check Point Next Generation
Threat Prevention• McAfee Advanced Threat Defense Vs. FireEye NETWORK SECURITY(NX SERIES) • Check Point Next Generation Threat Prevention Vs. McAfee Advanced Threat
Defense
• Top Rated Products:• FireEye NETWORK SECURITY(NX SERIES): 4.7/5• Palo Alto Networks WildFire: 4/5
Web Application Firewall
(WAF)
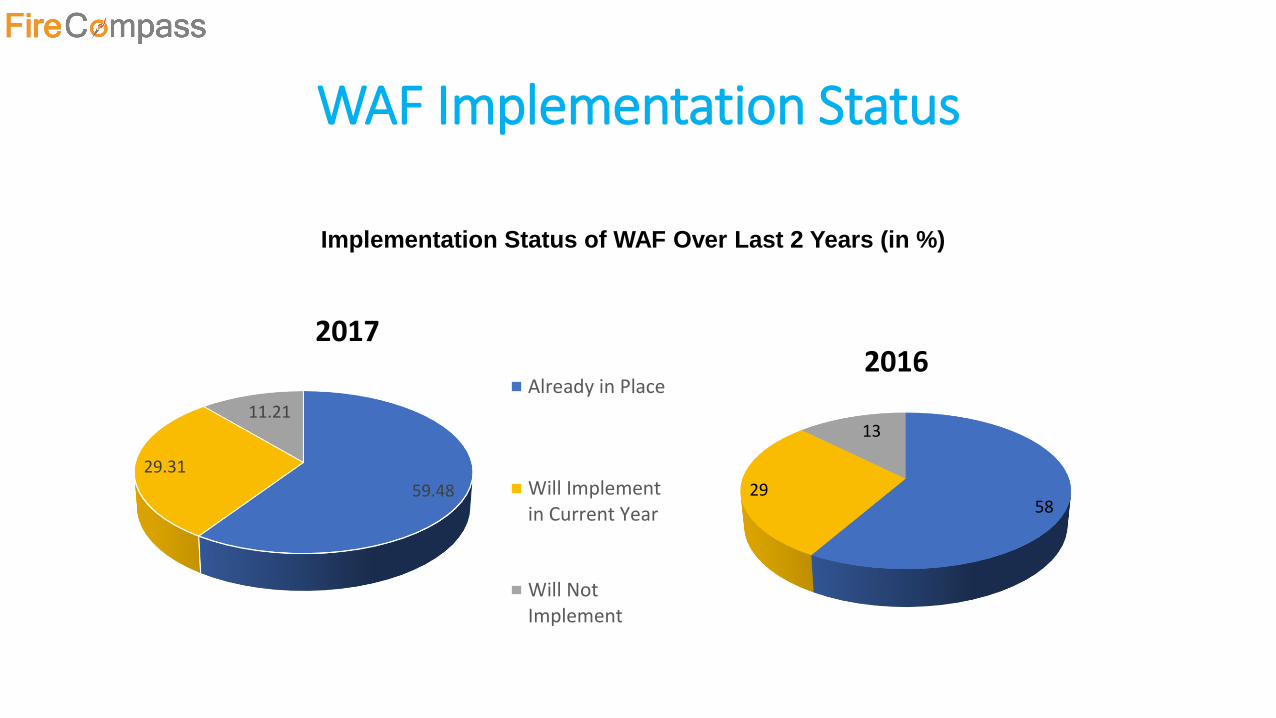
WAF Implementation Status
Implementation Status of WAF Over Last 2 Years (in %)
5829
13
2016
59.48
29.31
11.21
2017
Already in Place
Will Implementin Current Year
Will NotImplement
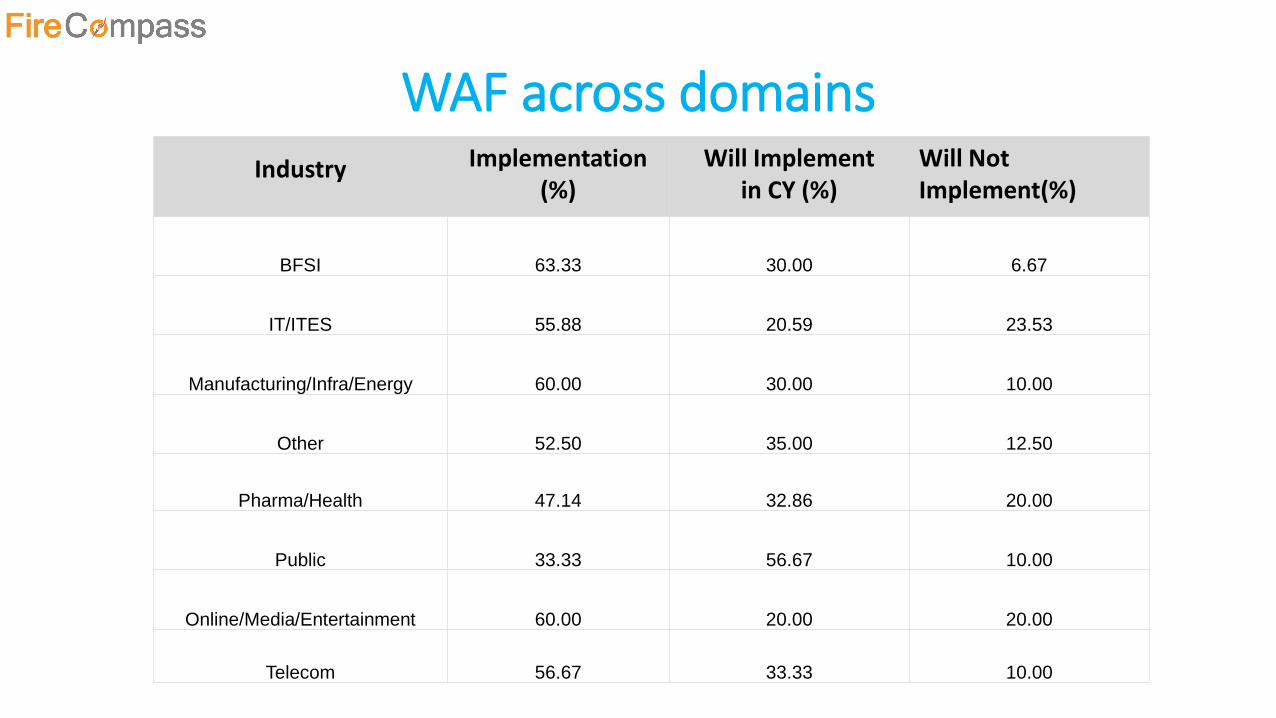
WAF across domainsIndustry Implementation
(%)Will Implement
in CY (%)Will Not Implement(%)
BFSI 63.33 30.00 6.67
IT/ITES 55.88 20.59 23.53
Manufacturing/Infra/Energy 60.00 30.00 10.00
Other 52.50 35.00 12.50
Pharma/Health 47.14 32.86 20.00
Public 33.33 56.67 10.00
Online/Media/Entertainment 60.00 20.00 20.00
Telecom 56.67 33.33 10.00
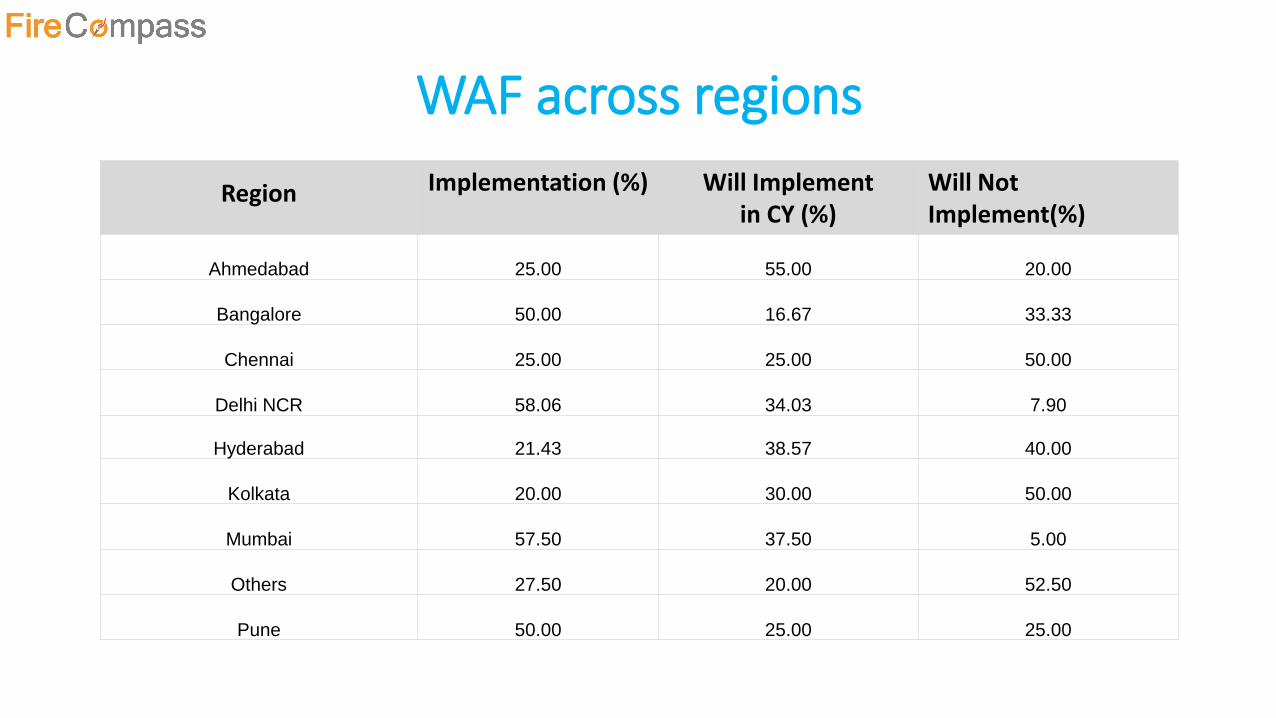
WAF across regions
Region Implementation (%) Will Implement in CY (%)
Will Not Implement(%)
Ahmedabad 25.00 55.00 20.00
Bangalore 50.00 16.67 33.33
Chennai 25.00 25.00 50.00
Delhi NCR 58.06 34.03 7.90
Hyderabad 21.43 38.57 40.00
Kolkata 20.00 30.00 50.00
Mumbai 57.50 37.50 5.00
Others 27.50 20.00 52.50
Pune 50.00 25.00 25.00
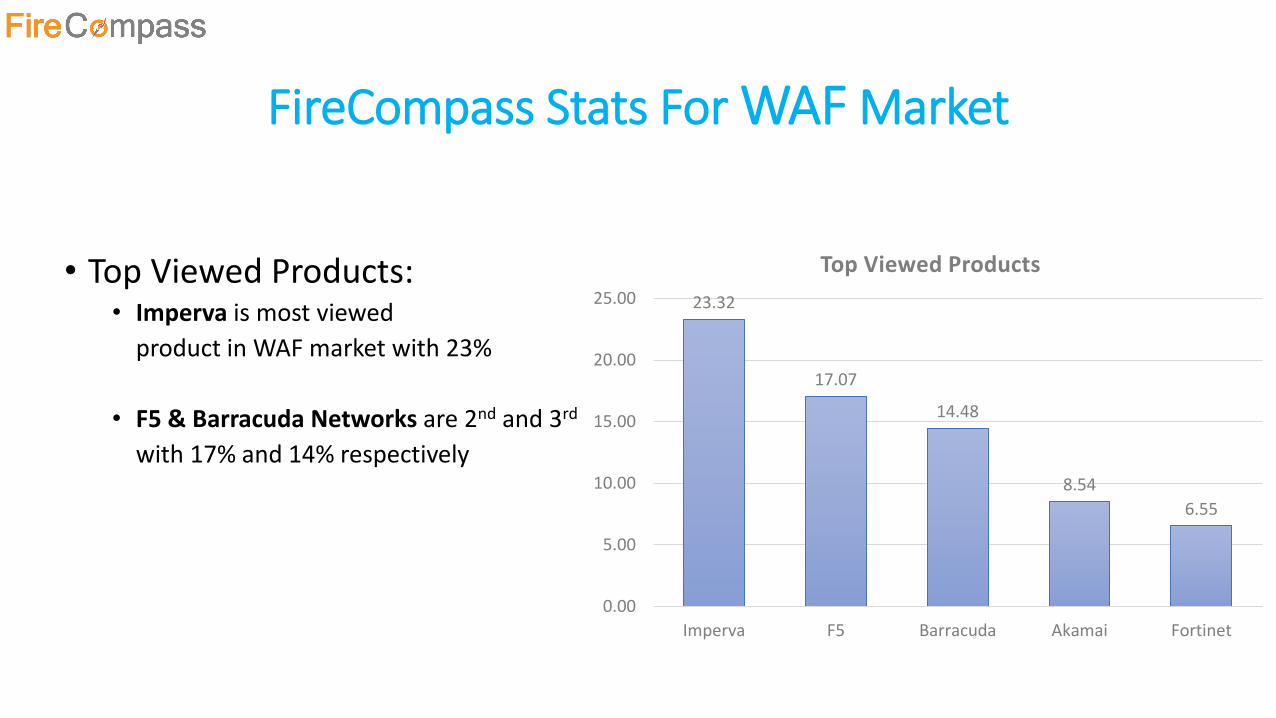
FireCompass Stats For WAF Market
• Top Viewed Products:• Imperva is most viewed
product in WAF market with 23%
• F5 & Barracuda Networks are 2nd and 3rd
with 17% and 14% respectively
23.32
17.07
14.48
8.54
6.55
0.00
5.00
10.00
15.00
20.00
25.00
Imperva F5 Barracuda Akamai Fortinet
Top Viewed Products

FireCompass Stats For WAF Market
• Popular Comparisons:• Imperva Secure Sphere Web Application Firewall Vs. Akamai Kona Site Defender WAF• Imperva Secure Sphere Web Application Firewall Vs. F5 Networks BIG-IP Application
Security Manager• F5 Networks BIG-IP Application Security Manager Vs. Barracuda Web Application
Firewall• Barracuda Web Application Firewall Vs. Akamai Kona Site Defender WAF
• Top Rated Products:• Imperva SecureSphere Web Application Firewall: 5/5• Trustwave WAF: 3.5/5 • Citrix NetScaler AppFirewall: 3.5/5• PT Application Firewall: 3.5/5

Cloud Access Security Broker
(CASB)
CASB Implementation Status
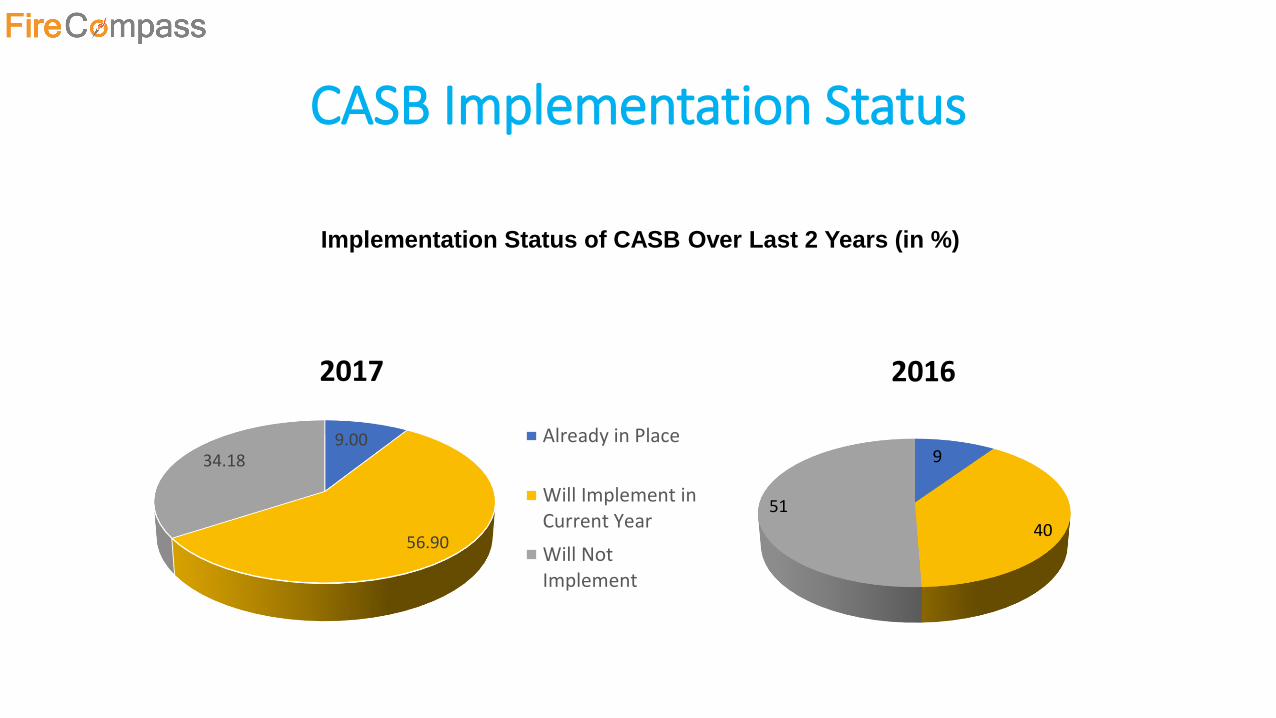
Implementation Status of CASB Over Last 2 Years (in %)
9
40
51
2016
9.00
56.90
34.18
2017
Already in Place
Will Implement inCurrent Year
Will NotImplement
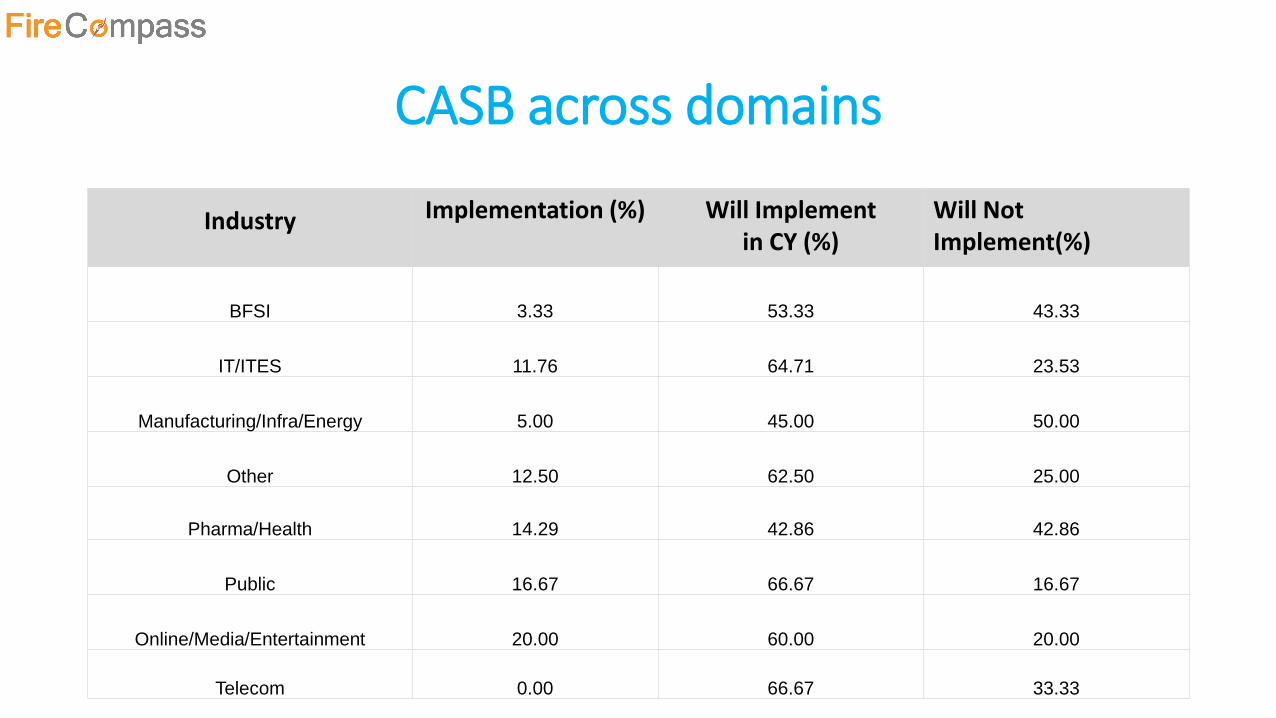
CASB across domains
Industry Implementation (%) Will Implement in CY (%)
Will Not Implement(%)
BFSI 3.33 53.33 43.33
IT/ITES 11.76 64.71 23.53
Manufacturing/Infra/Energy 5.00 45.00 50.00
Other 12.50 62.50 25.00
Pharma/Health 14.29 42.86 42.86
Public 16.67 66.67 16.67
Online/Media/Entertainment 20.00 60.00 20.00
Telecom 0.00 66.67 33.33
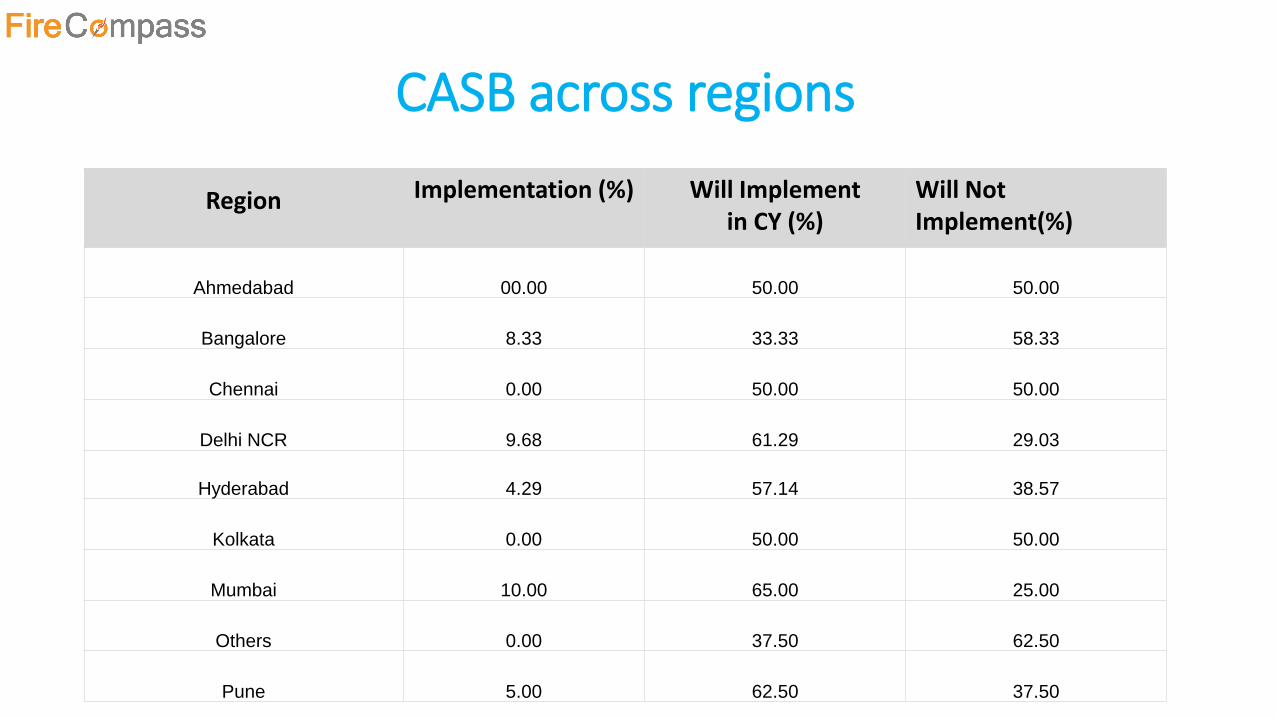
CASB across regions
Region Implementation (%) Will Implement in CY (%)
Will Not Implement(%)
Ahmedabad 00.00 50.00 50.00
Bangalore 8.33 33.33 58.33
Chennai 0.00 50.00 50.00
Delhi NCR 9.68 61.29 29.03
Hyderabad 4.29 57.14 38.57
Kolkata 0.00 50.00 50.00
Mumbai 10.00 65.00 25.00
Others 0.00 37.50 62.50
Pune 5.00 62.50 37.50
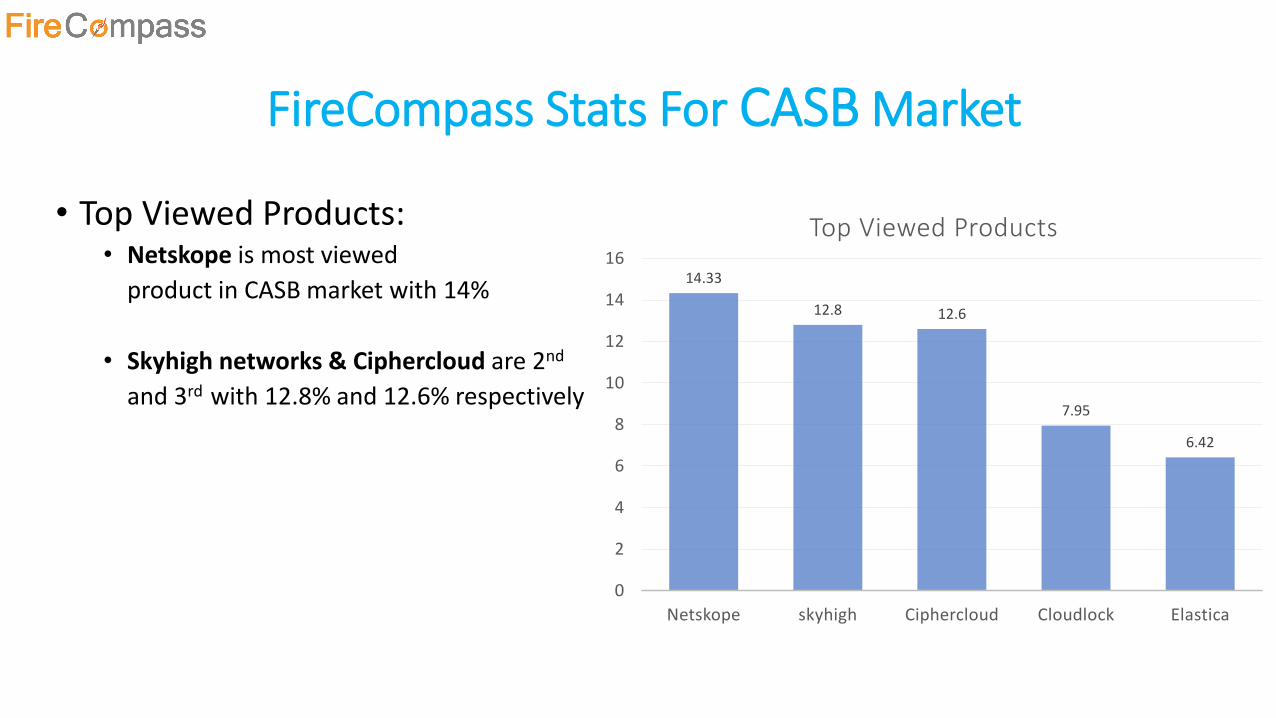
FireCompass Stats For CASB Market
• Top Viewed Products:• Netskope is most viewed
product in CASB market with 14%
• Skyhigh networks & Ciphercloud are 2nd
and 3rd with 12.8% and 12.6% respectively
14.33
12.8 12.6
7.95
6.42
0
2
4
6
8
10
12
14
16
Netskope skyhigh Ciphercloud Cloudlock Elastica
Top Viewed Products
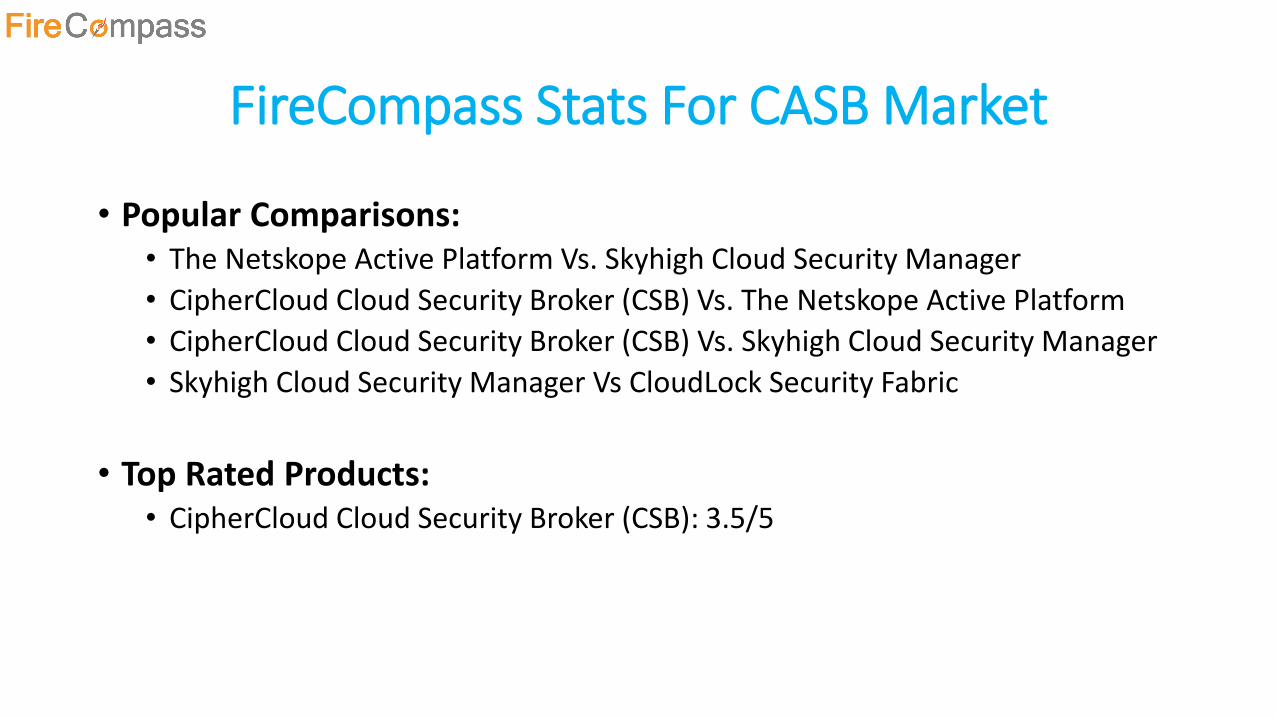
FireCompass Stats For CASB Market
• Popular Comparisons:• The Netskope Active Platform Vs. Skyhigh Cloud Security Manager
• CipherCloud Cloud Security Broker (CSB) Vs. The Netskope Active Platform
• CipherCloud Cloud Security Broker (CSB) Vs. Skyhigh Cloud Security Manager
• Skyhigh Cloud Security Manager Vs CloudLock Security Fabric
• Top Rated Products:• CipherCloud Cloud Security Broker (CSB): 3.5/5
Threat Intelligence
(TI)
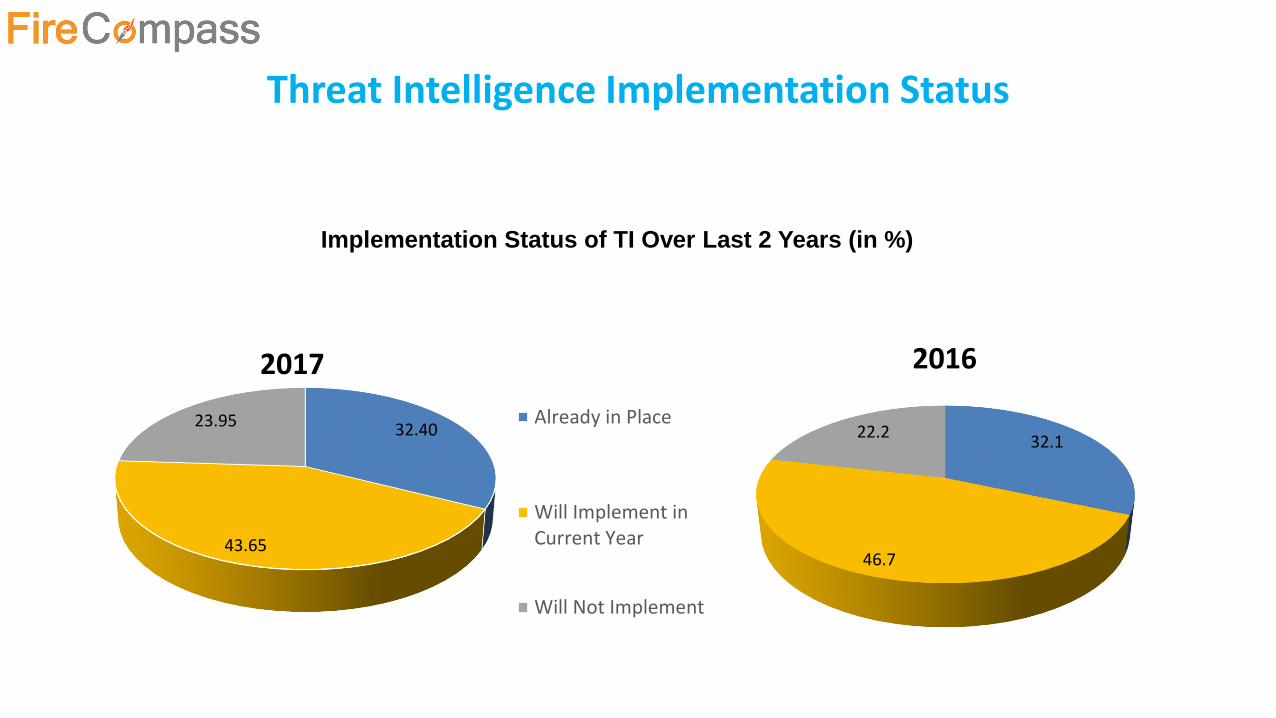
Threat Intelligence Implementation Status
Implementation Status of TI Over Last 2 Years (in %)
32.1
46.7
22.2
2016
32.40
43.65
23.95
2017
Already in Place
Will Implement inCurrent Year
Will Not Implement
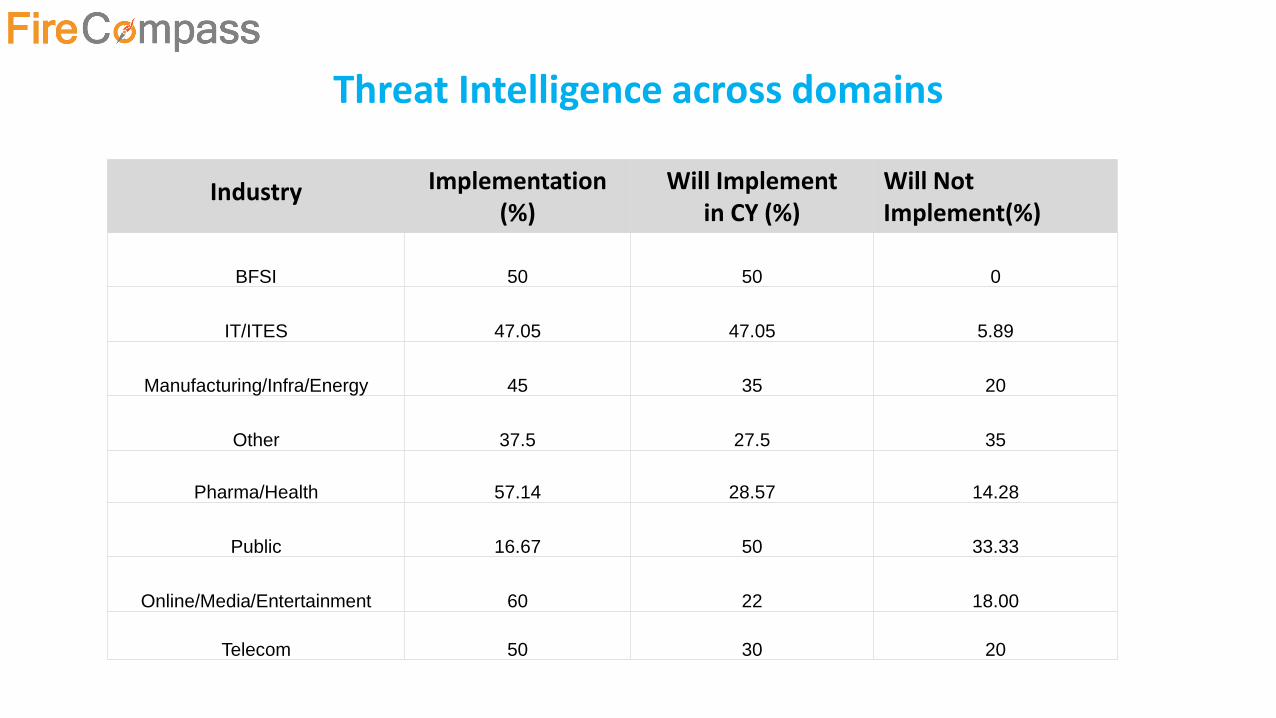
Threat Intelligence across domains
Industry Implementation (%)
Will Implement in CY (%)
Will Not Implement(%)
BFSI 50 50 0
IT/ITES 47.05 47.05 5.89
Manufacturing/Infra/Energy 45 35 20
Other 37.5 27.5 35
Pharma/Health 57.14 28.57 14.28
Public 16.67 50 33.33
Online/Media/Entertainment 60 22 18.00
Telecom 50 30 20
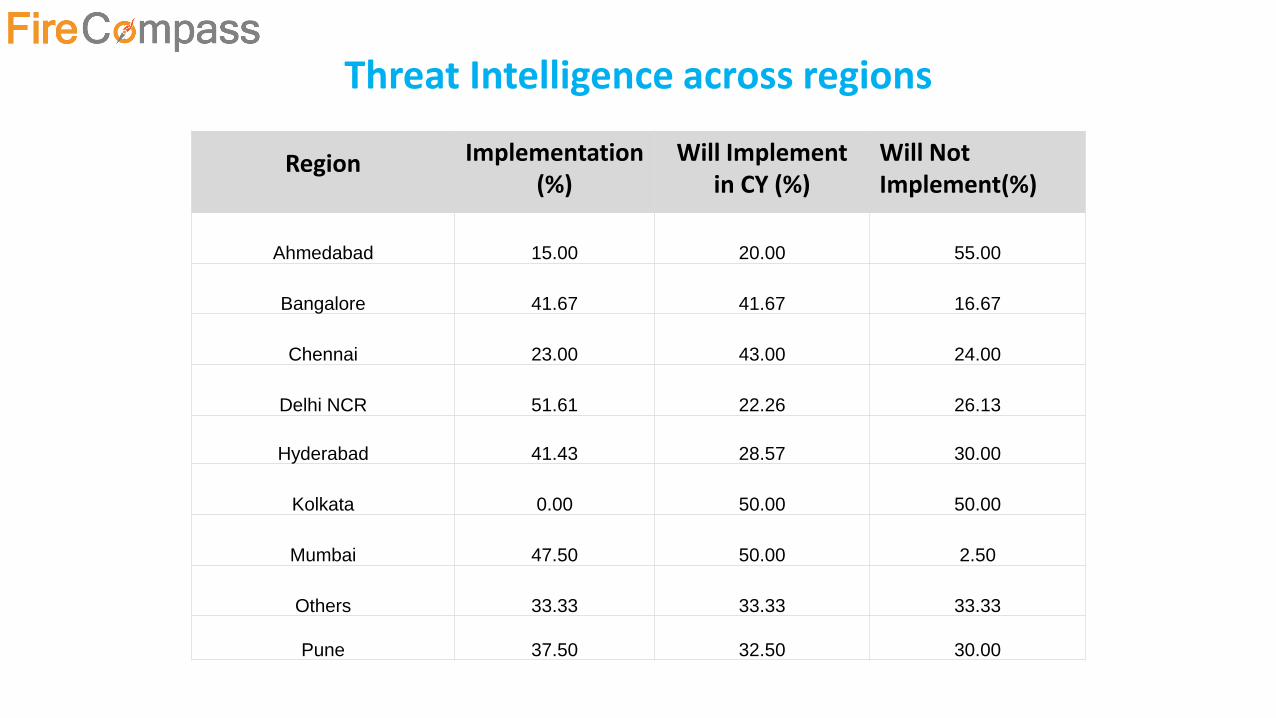
Threat Intelligence across regions
Region Implementation (%)
Will Implement in CY (%)
Will Not Implement(%)
Ahmedabad 15.00 20.00 55.00
Bangalore 41.67 41.67 16.67
Chennai 23.00 43.00 24.00
Delhi NCR 51.61 22.26 26.13
Hyderabad 41.43 28.57 30.00
Kolkata 0.00 50.00 50.00
Mumbai 47.50 50.00 2.50
Others 33.33 33.33 33.33
Pune 37.50 32.50 30.00
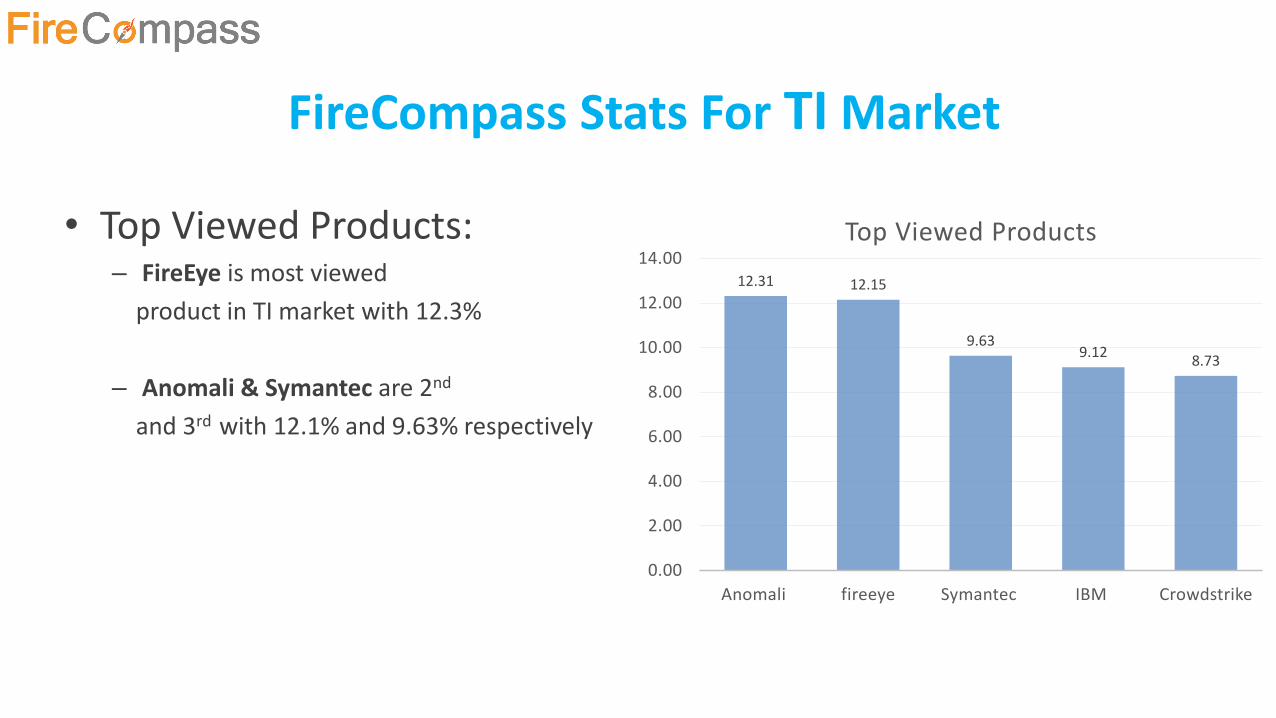
FireCompass Stats For TI Market
• Top Viewed Products:– FireEye is most viewed
product in TI market with 12.3%
– Anomali & Symantec are 2nd
and 3rd with 12.1% and 9.63% respectively
12.31 12.15
9.639.12
8.73
0.00
2.00
4.00
6.00
8.00
10.00
12.00
14.00
Anomali fireeye Symantec IBM Crowdstrike
Top Viewed Products

FireCompass Stats For TI Market
• Popular Comparisons:
– Anomali Enterprise Vs. FireEye isight Cyber Threat Intelligence
– FireEye isight Cyber Threat Intelligence Vs. Symantec DeepSight Intelligence
– Symantec DeepSight Intelligence Vs. IBM X-Force intelligence
– FireEye isight Cyber Threat Intelligence Vs. IBM X-Force intelligence
Deception
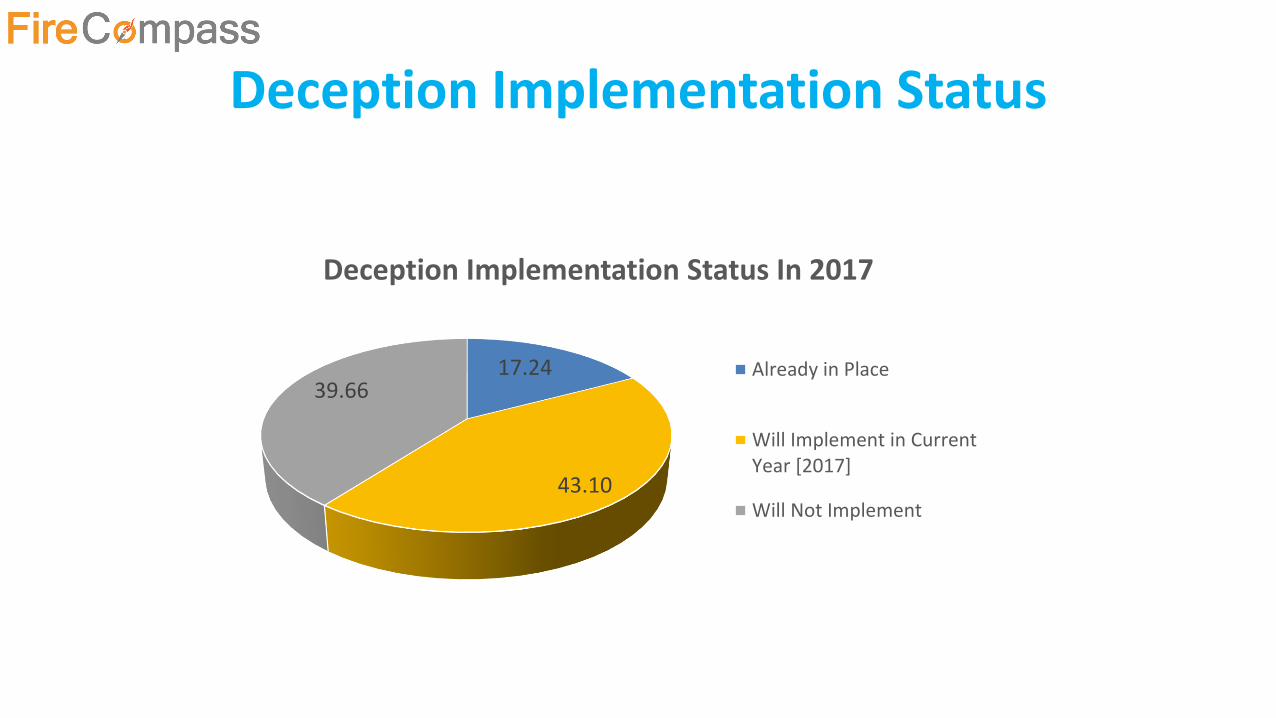
Deception Implementation Status
17.24
43.10
39.66
Deception Implementation Status In 2017
Already in Place
Will Implement in CurrentYear [2017]
Will Not Implement
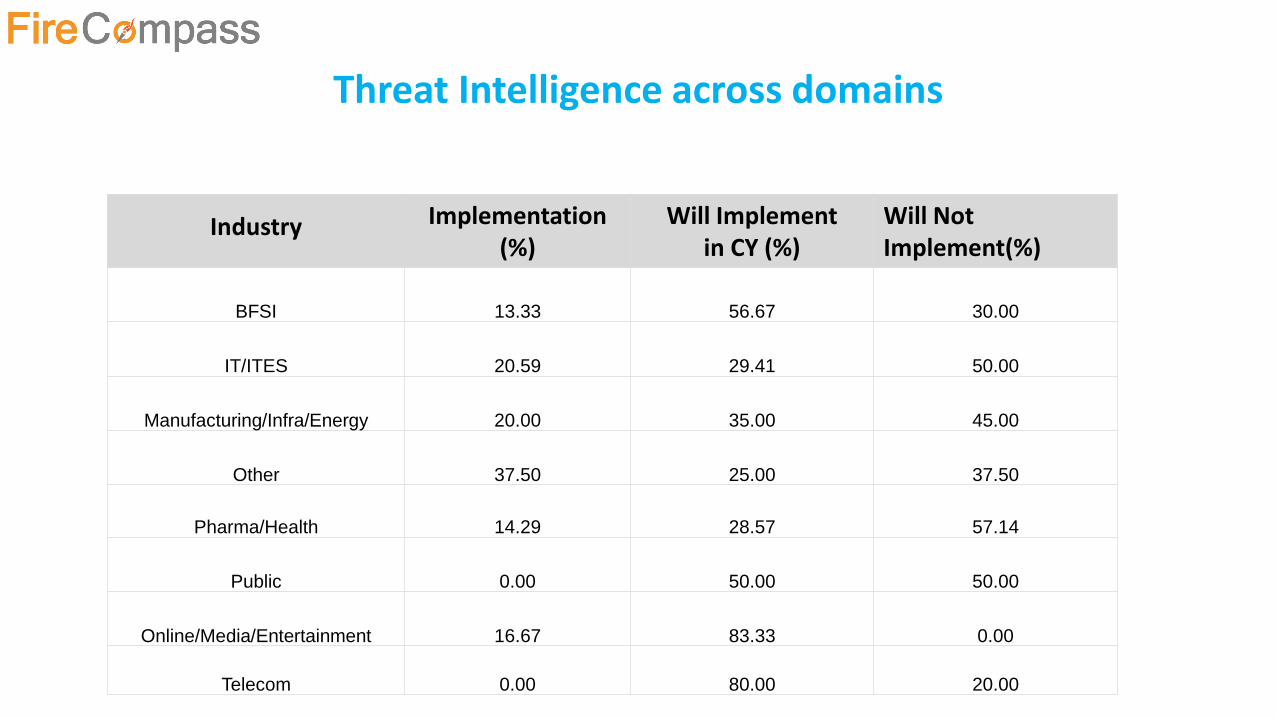
Threat Intelligence across domains
Industry Implementation (%)
Will Implement in CY (%)
Will Not Implement(%)
BFSI 13.33 56.67 30.00
IT/ITES 20.59 29.41 50.00
Manufacturing/Infra/Energy 20.00 35.00 45.00
Other 37.50 25.00 37.50
Pharma/Health 14.29 28.57 57.14
Public 0.00 50.00 50.00
Online/Media/Entertainment 16.67 83.33 0.00
Telecom 0.00 80.00 20.00
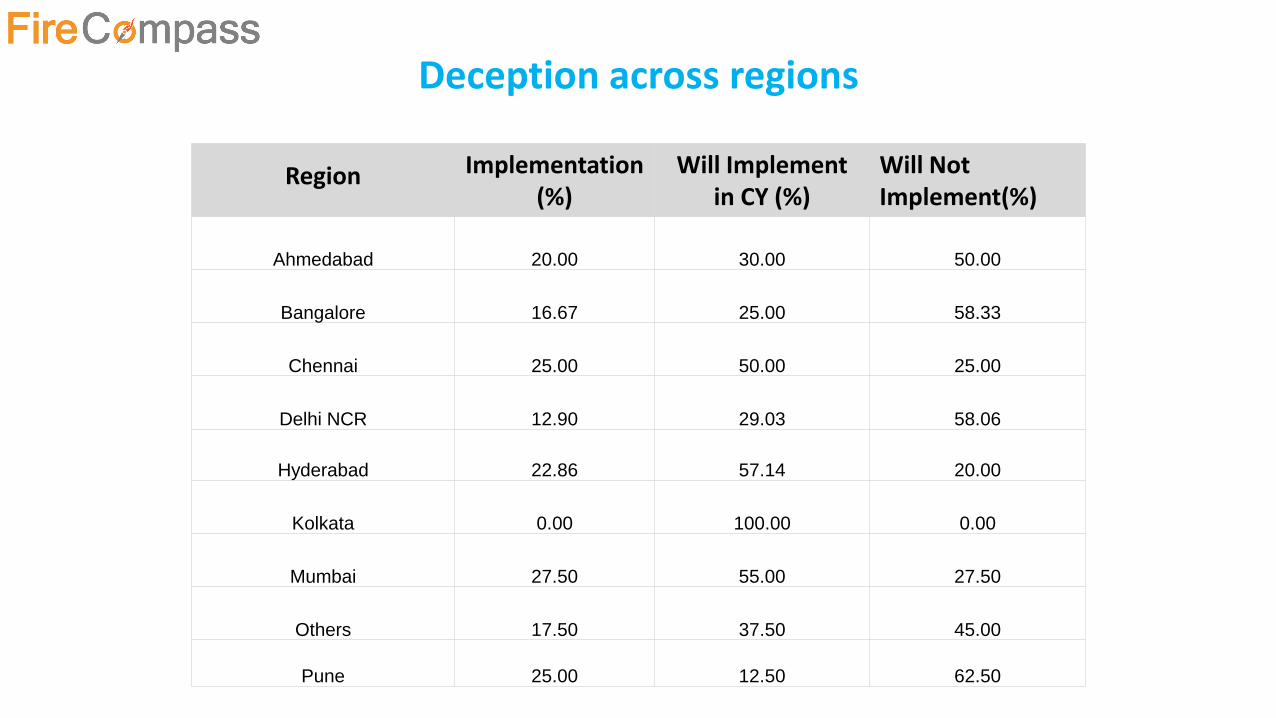
Deception across regions
Region Implementation (%)
Will Implement in CY (%)
Will Not Implement(%)
Ahmedabad 20.00 30.00 50.00
Bangalore 16.67 25.00 58.33
Chennai 25.00 50.00 25.00
Delhi NCR 12.90 29.03 58.06
Hyderabad 22.86 57.14 20.00
Kolkata 0.00 100.00 0.00
Mumbai 27.50 55.00 27.50
Others 17.50 37.50 45.00
Pune 25.00 12.50 62.50

FireCompass Stats For Deception Market
• Top Viewed Products:– Smokescreen is most viewed
product in Deception market with 24.5%
– Acalvio & TrapX are 2nd
and 3rd with 15.1% and 9.63% respectively
24.52
15.0513.33
9.037.95
0.00
5.00
10.00
15.00
20.00
25.00
30.00
Smokescreen Acalvio TrapX Ridgeback Illusive
Top Viewed Products

FireCompass Stats For TI Market
Popular Comparisons:
• Smokescreen Illusion Black Vs. Acalvio Deception2.0
• Smokescreen Illusion Black Vs. TrapX Deception Grid
• TrapX Deception Grid Vs. Acalvio Deception2.0
• Illusive networks Vs. Ridgeback Network Defense
End Point Detection & Response (EDR)
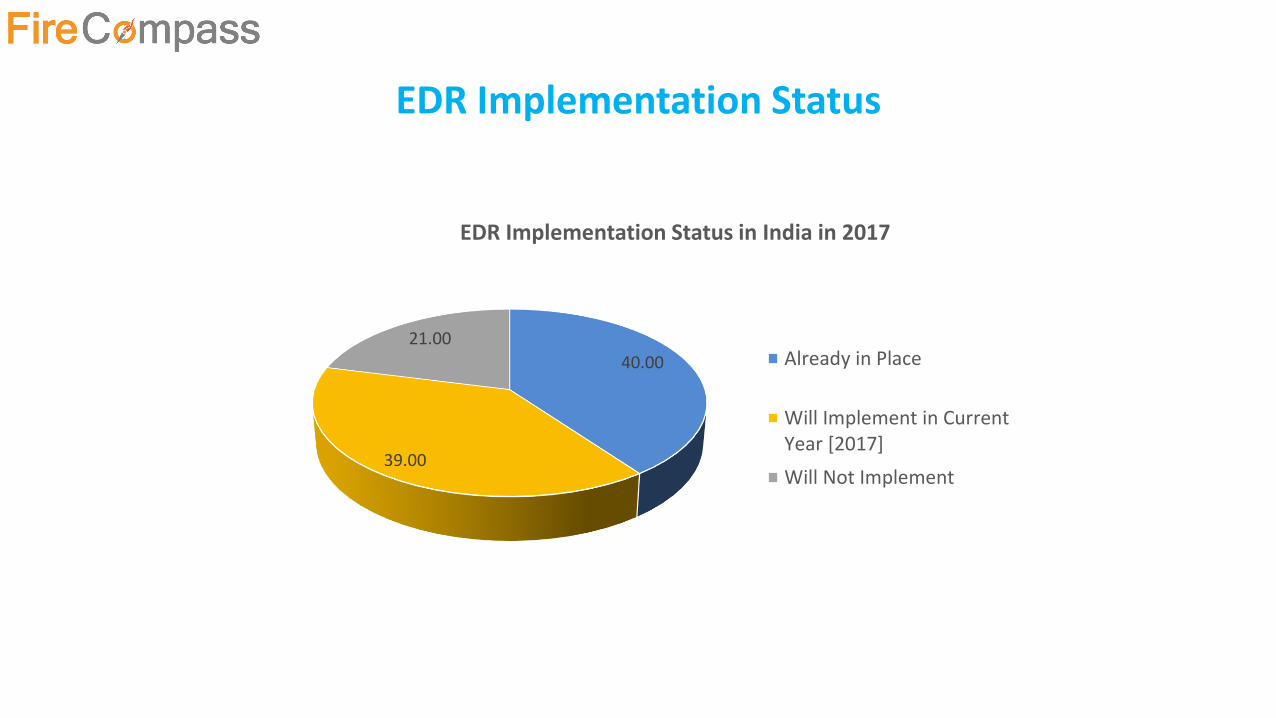
EDR Implementation Status
40.00
39.00
21.00
EDR Implementation Status in India in 2017
Already in Place
Will Implement in CurrentYear [2017]
Will Not Implement
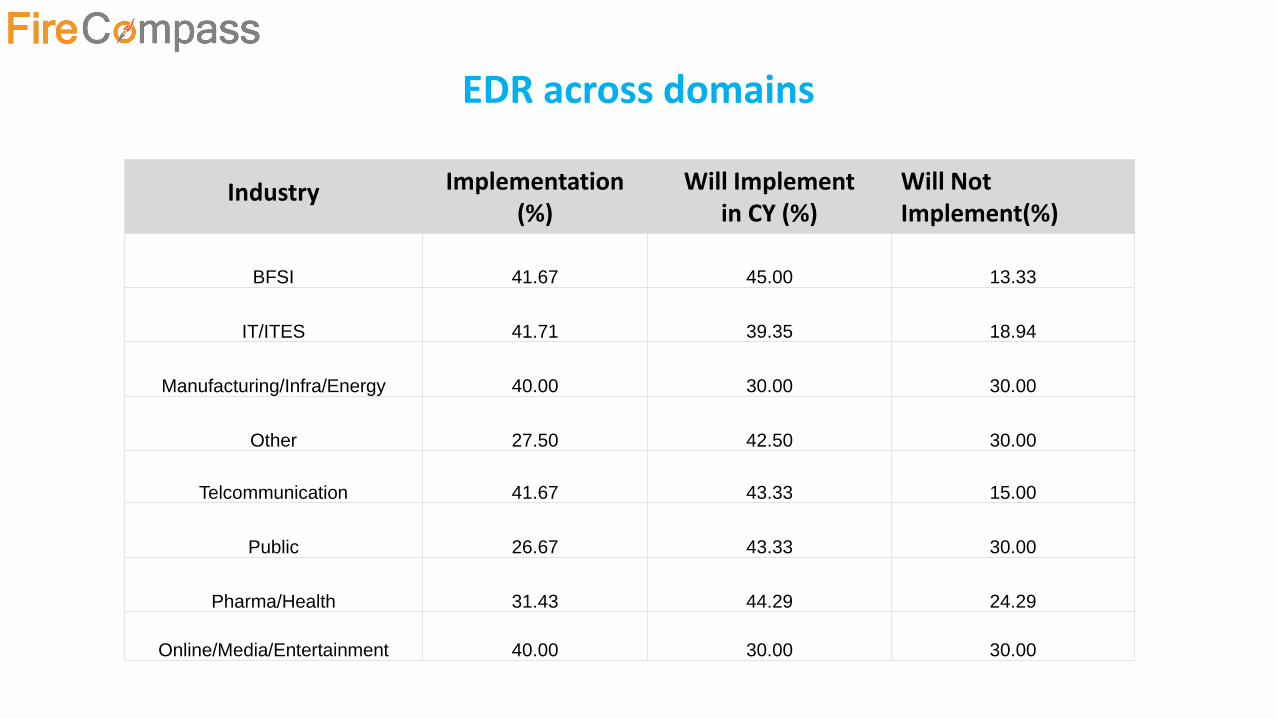
EDR across domains
Industry Implementation (%)
Will Implement in CY (%)
Will Not Implement(%)
BFSI 41.67 45.00 13.33
IT/ITES 41.71 39.35 18.94
Manufacturing/Infra/Energy 40.00 30.00 30.00
Other 27.50 42.50 30.00
Telcommunication 41.67 43.33 15.00
Public 26.67 43.33 30.00
Pharma/Health 31.43 44.29 24.29
Online/Media/Entertainment 40.00 30.00 30.00
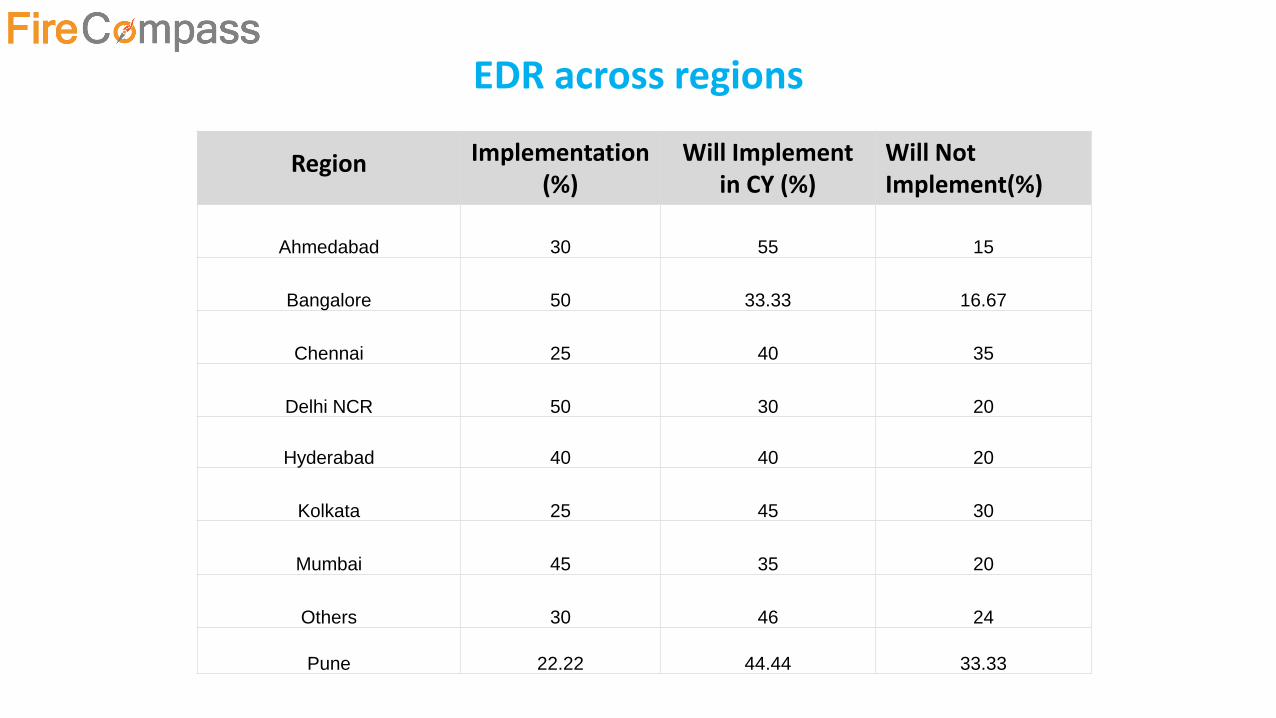
EDR across regions
Region Implementation (%)
Will Implement in CY (%)
Will Not Implement(%)
Ahmedabad 30 55 15
Bangalore 50 33.33 16.67
Chennai 25 40 35
Delhi NCR 50 30 20
Hyderabad 40 40 20
Kolkata 25 45 30
Mumbai 45 35 20
Others 30 46 24
Pune 22.22 44.44 33.33
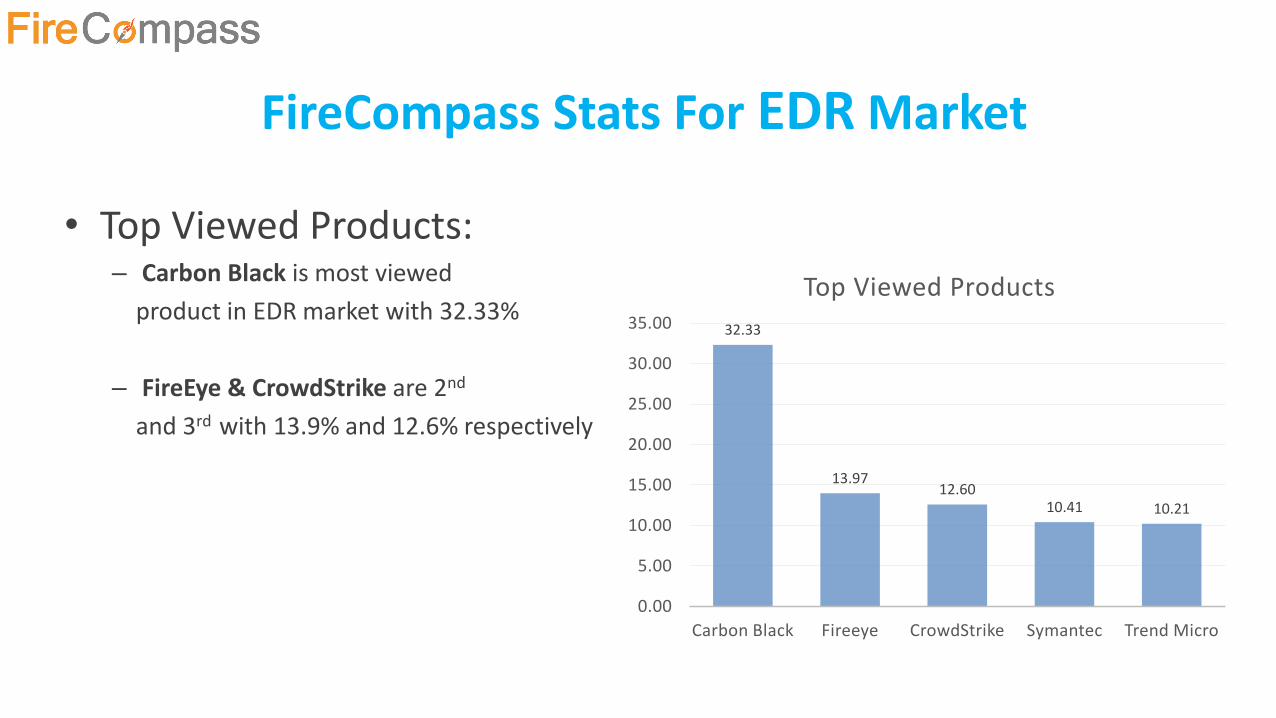
FireCompass Stats For EDR Market
• Top Viewed Products:– Carbon Black is most viewed
product in EDR market with 32.33%
– FireEye & CrowdStrike are 2nd
and 3rd with 13.9% and 12.6% respectively
32.33
13.9712.60
10.41 10.21
0.00
5.00
10.00
15.00
20.00
25.00
30.00
35.00
Carbon Black Fireeye CrowdStrike Symantec Trend Micro
Top Viewed Products
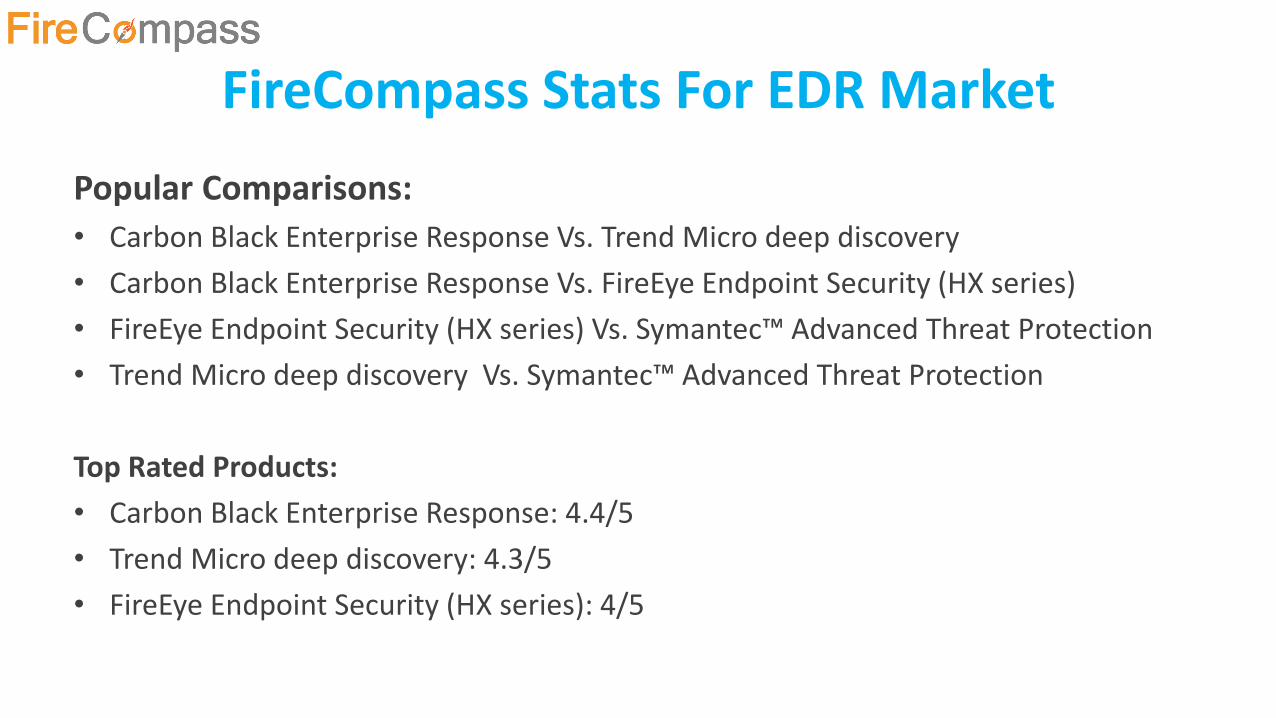
FireCompass Stats For EDR Market
Popular Comparisons:
• Carbon Black Enterprise Response Vs. Trend Micro deep discovery
• Carbon Black Enterprise Response Vs. FireEye Endpoint Security (HX series)
• FireEye Endpoint Security (HX series) Vs. Symantec™ Advanced Threat Protection
• Trend Micro deep discovery Vs. Symantec™ Advanced Threat Protection
Top Rated Products:
• Carbon Black Enterprise Response: 4.4/5
• Trend Micro deep discovery: 4.3/5
• FireEye Endpoint Security (HX series): 4/5
IT Governance, Risk and Compliance
(IT GRC)

IT GRC Implementation Status
Implementation Status of IT GRC Over Last 2 Years (in %)
27
42
31
2016
34.55
39.41
26.04
IT GRC in 2017
Already in Place
Will Implement inCurrent Year
Will Not Implement
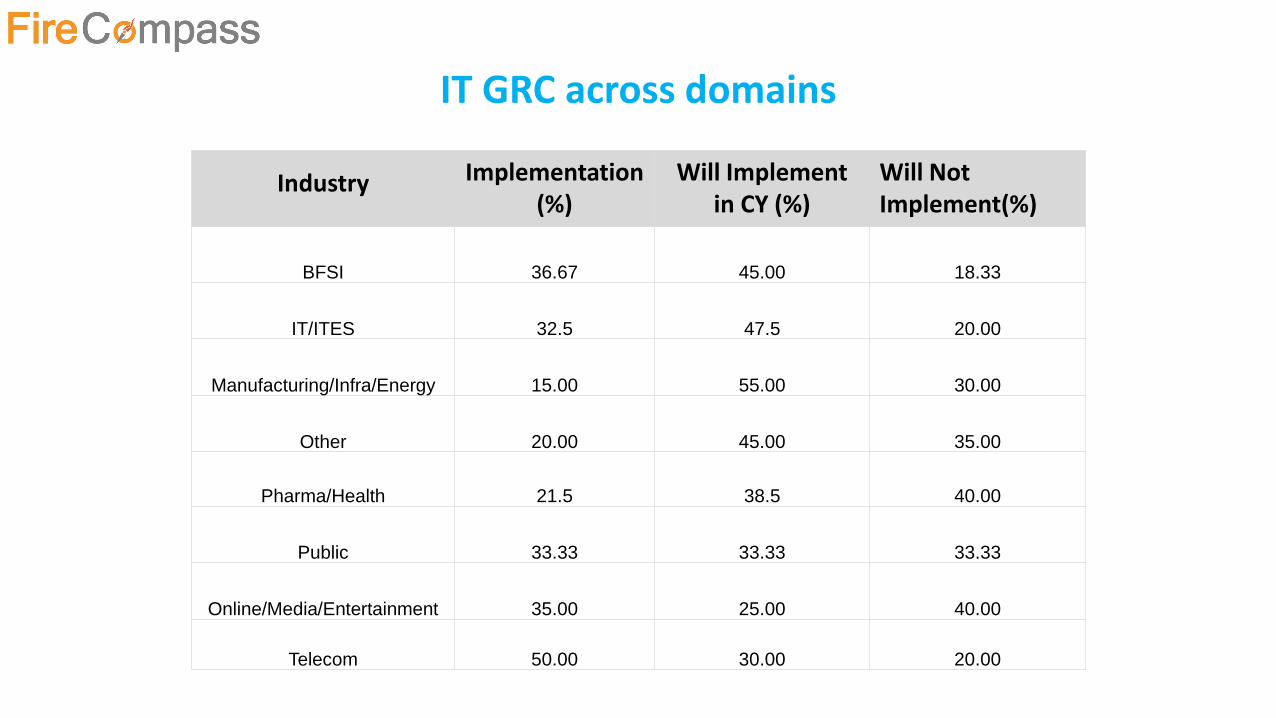
IT GRC across domains
Industry Implementation (%)
Will Implement in CY (%)
Will Not Implement(%)
BFSI 36.67 45.00 18.33
IT/ITES 32.5 47.5 20.00
Manufacturing/Infra/Energy 15.00 55.00 30.00
Other 20.00 45.00 35.00
Pharma/Health 21.5 38.5 40.00
Public 33.33 33.33 33.33
Online/Media/Entertainment 35.00 25.00 40.00
Telecom 50.00 30.00 20.00
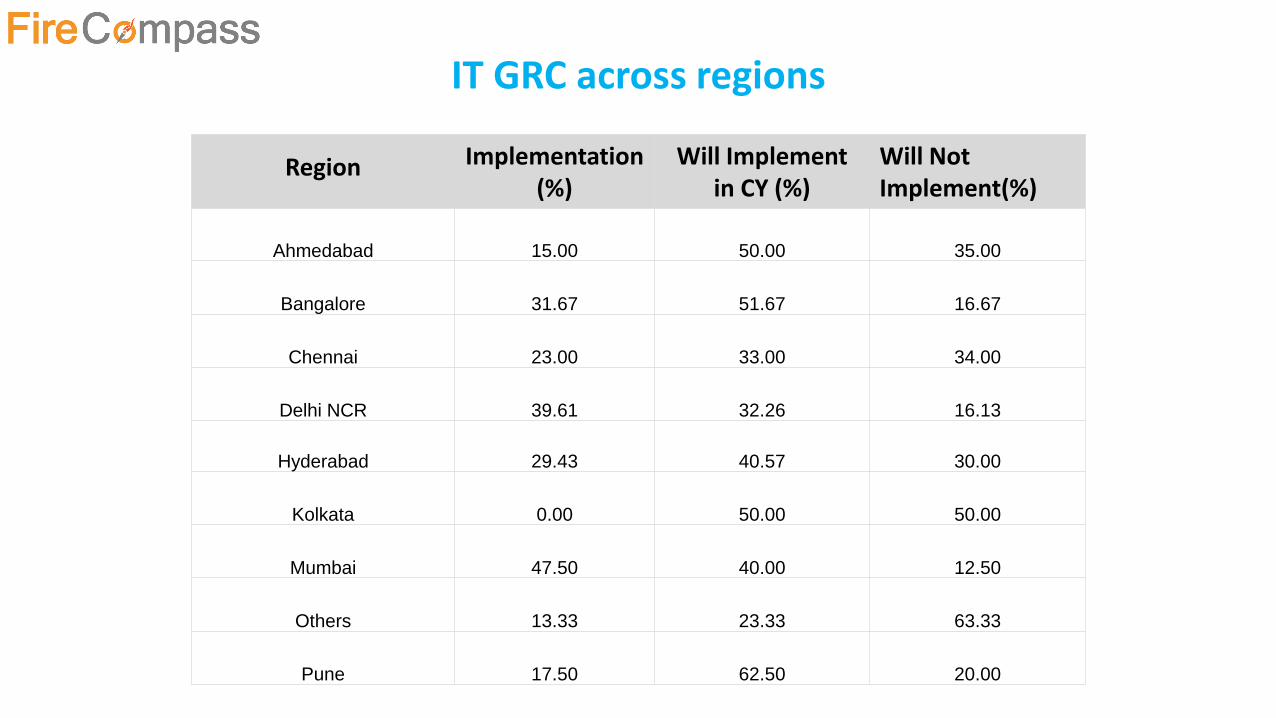
IT GRC across regions
Region Implementation (%)
Will Implement in CY (%)
Will Not Implement(%)
Ahmedabad 15.00 50.00 35.00
Bangalore 31.67 51.67 16.67
Chennai 23.00 33.00 34.00
Delhi NCR 39.61 32.26 16.13
Hyderabad 29.43 40.57 30.00
Kolkata 0.00 50.00 50.00
Mumbai 47.50 40.00 12.50
Others 13.33 23.33 63.33
Pune 17.50 62.50 20.00

FireCompass Stats For GRC Market
• Top Viewed Products:– MetricStream is most viewed
product in GRC market with 22.91%
– EMC Corporation & LockPath are 2nd
and 3rd with 14.1% and 10.13% respectively
22.91
14.10
10.138.37
5.29
0.00
5.00
10.00
15.00
20.00
25.00
MetricStream EMC Corporation
LockPath RSAM IBM
Top Viewed Products
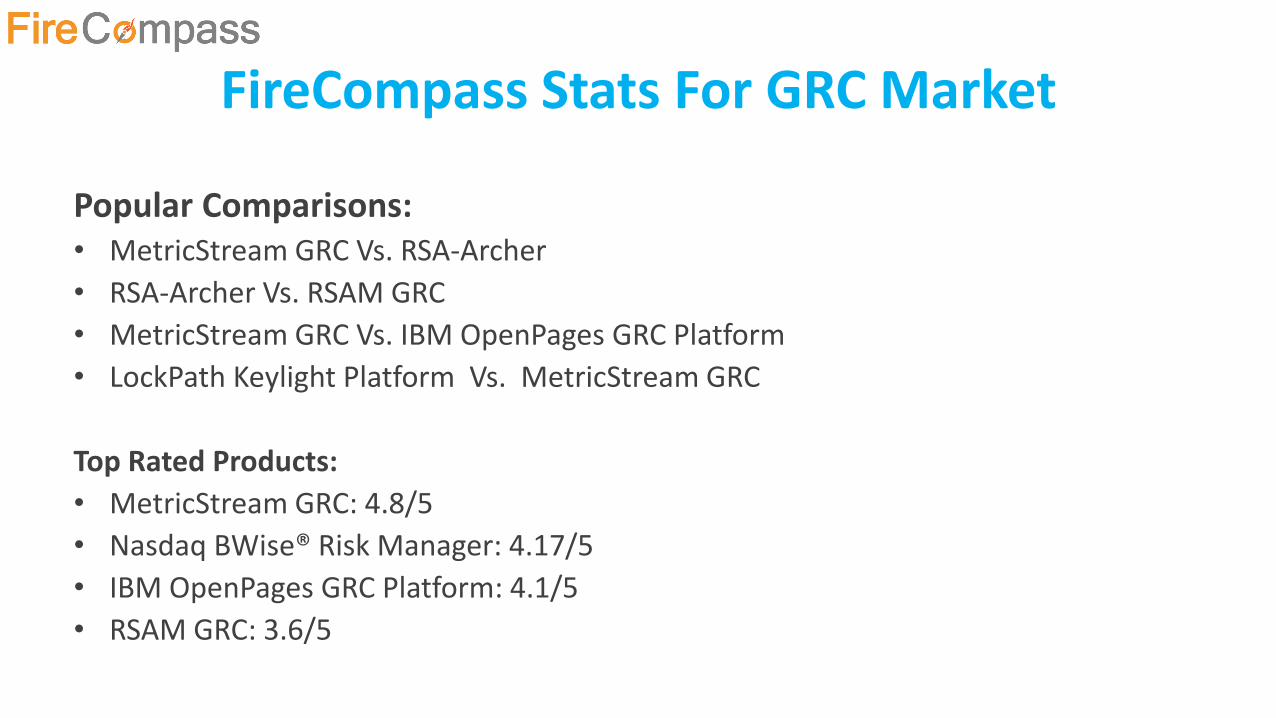
FireCompass Stats For GRC Market
Popular Comparisons:• MetricStream GRC Vs. RSA-Archer
• RSA-Archer Vs. RSAM GRC
• MetricStream GRC Vs. IBM OpenPages GRC Platform
• LockPath Keylight Platform Vs. MetricStream GRC
Top Rated Products:
• MetricStream GRC: 4.8/5
• Nasdaq BWise® Risk Manager: 4.17/5
• IBM OpenPages GRC Platform: 4.1/5
• RSAM GRC: 3.6/5
Privileged Access Management
(PAM)
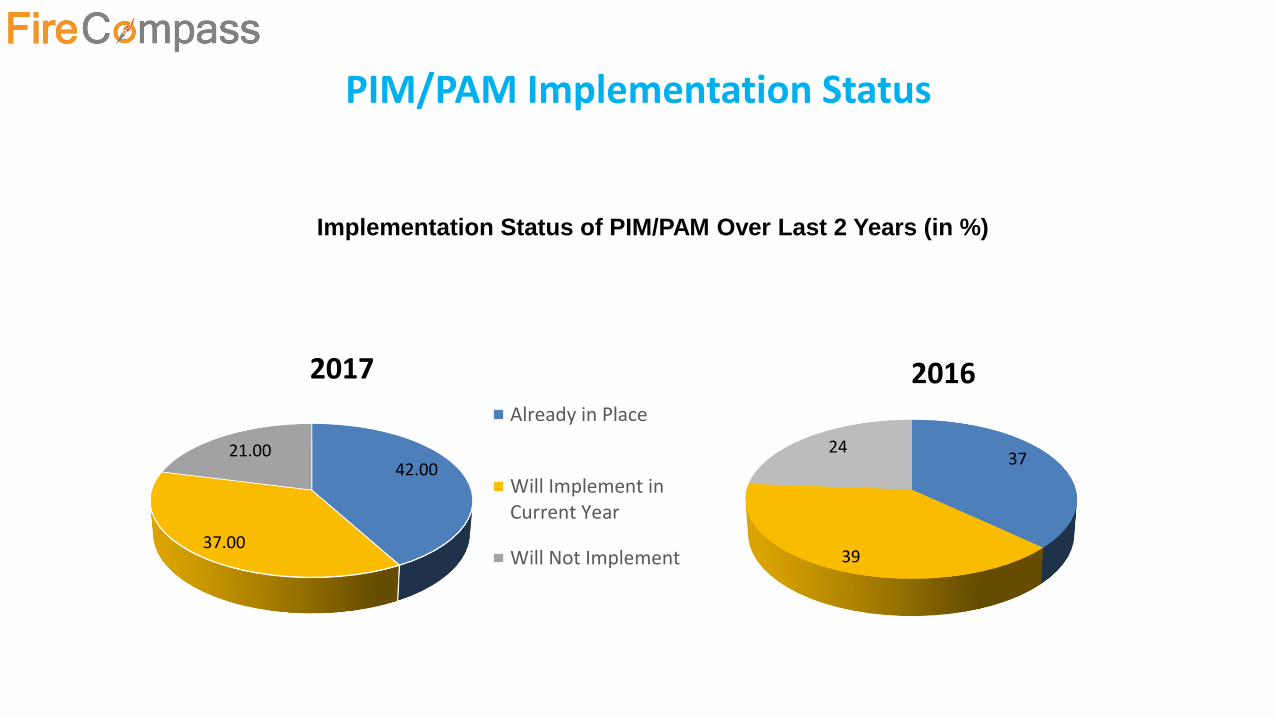
PIM/PAM Implementation Status
Implementation Status of PIM/PAM Over Last 2 Years (in %)
42.00
37.00
21.00
2017
Already in Place
Will Implement inCurrent Year
Will Not Implement
37
39
24
2016

PIM/PAM across domains
Industry Implementation (%)
Will Implement in CY (%)
Will Not Implement(%)
BFSI 50.00 26.67 23.33
IT/ITES 46.76 29.41 23.82
Manufacturing/Infra/Energy 25.00 35.00 40.00
Public 20.00 33.33 36.67
Telecom 60.00 20.00 20.00
Other 45.00 22.50 32.50
Online/Media/Entertainment 20.00 60.00 20.00
Pharma/Health 27.14 48.57 24.29
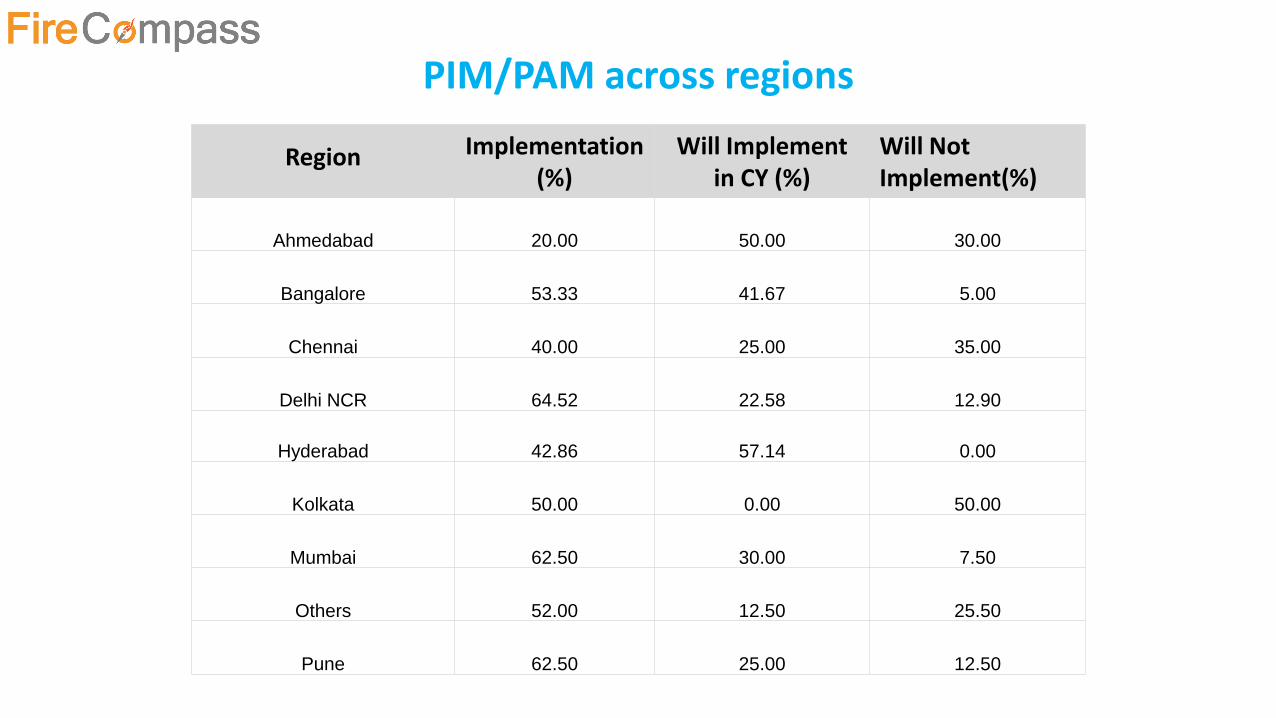
PIM/PAM across regions
Region Implementation (%)
Will Implement in CY (%)
Will Not Implement(%)
Ahmedabad 20.00 50.00 30.00
Bangalore 53.33 41.67 5.00
Chennai 40.00 25.00 35.00
Delhi NCR 64.52 22.58 12.90
Hyderabad 42.86 57.14 0.00
Kolkata 50.00 0.00 50.00
Mumbai 62.50 30.00 7.50
Others 52.00 12.50 25.50
Pune 62.50 25.00 12.50
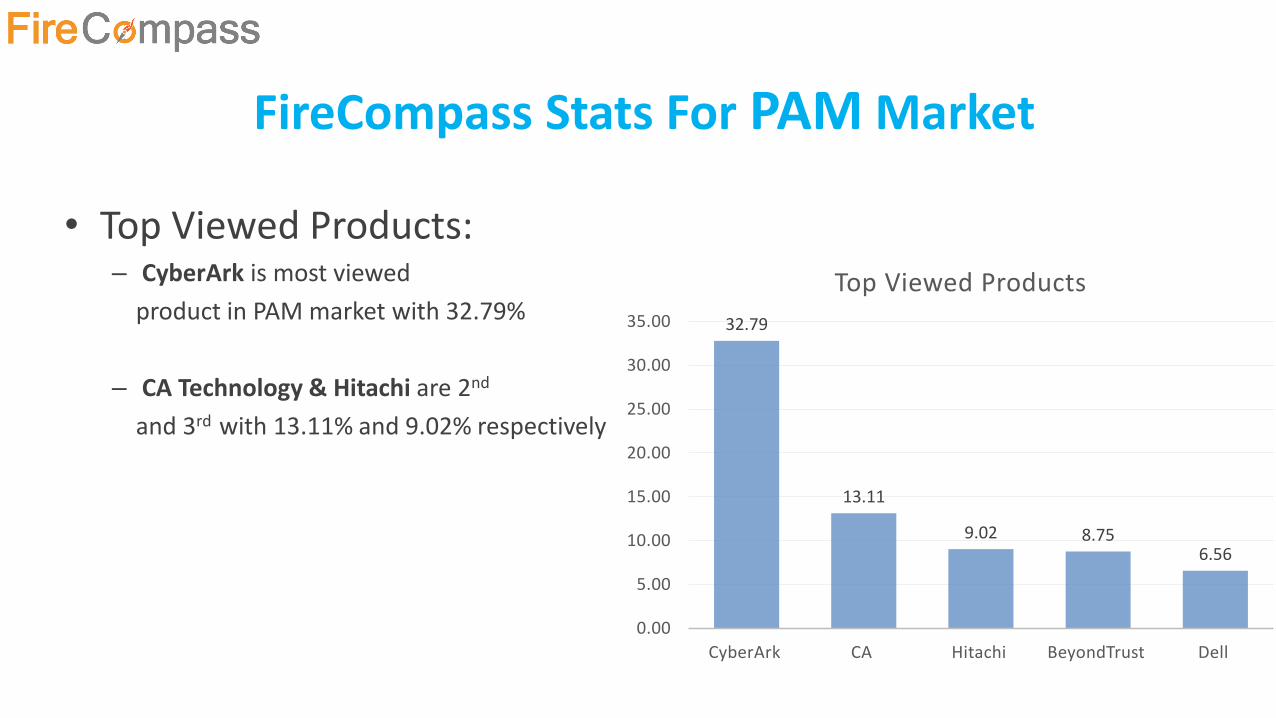
FireCompass Stats For PAM Market
• Top Viewed Products:– CyberArk is most viewed
product in PAM market with 32.79%
– CA Technology & Hitachi are 2nd
and 3rd with 13.11% and 9.02% respectively
32.79
13.11
9.02 8.756.56
0.00
5.00
10.00
15.00
20.00
25.00
30.00
35.00
CyberArk CA Hitachi BeyondTrust Dell
Top Viewed Products
FireCompass Stats For PAM Market
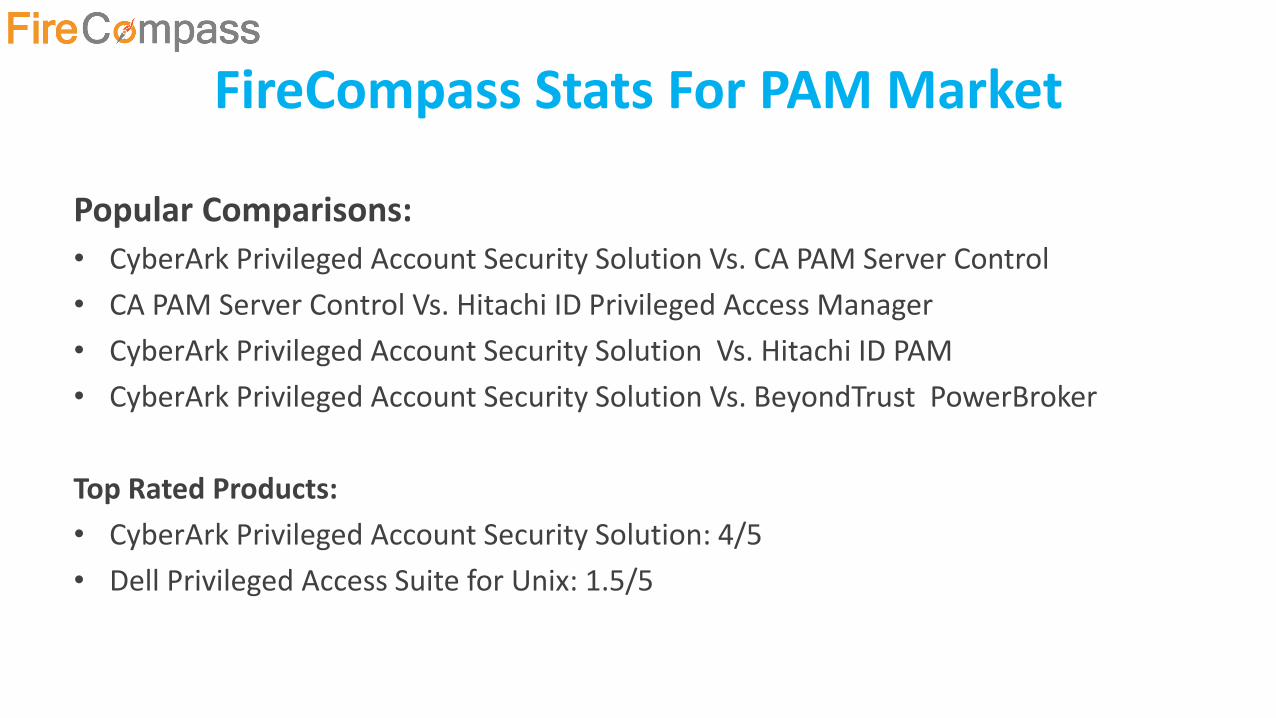
Popular Comparisons:
• CyberArk Privileged Account Security Solution Vs. CA PAM Server Control
• CA PAM Server Control Vs. Hitachi ID Privileged Access Manager
• CyberArk Privileged Account Security Solution Vs. Hitachi ID PAM
• CyberArk Privileged Account Security Solution Vs. BeyondTrust PowerBroker
Top Rated Products:
• CyberArk Privileged Account Security Solution: 4/5
• Dell Privileged Access Suite for Unix: 1.5/5
Encryption
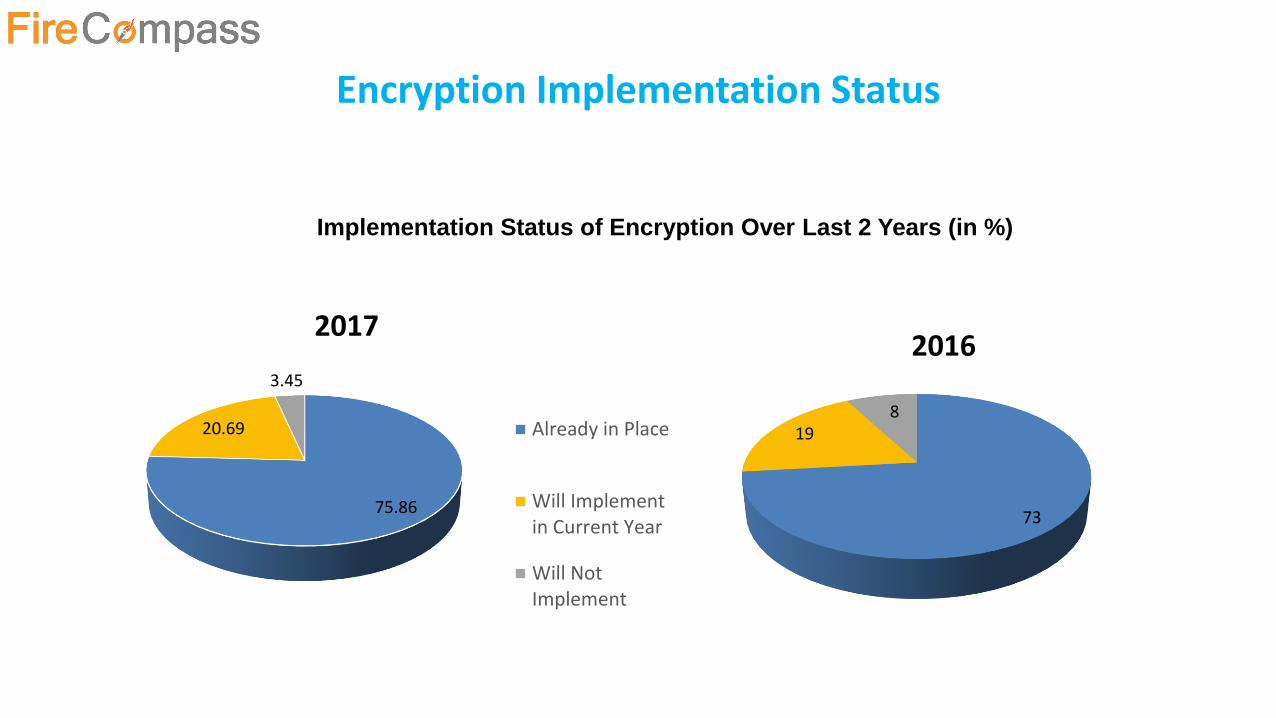
Encryption Implementation Status
Implementation Status of Encryption Over Last 2 Years (in %)
73
198
2016
75.86
20.69
3.45
2017
Already in Place
Will Implementin Current Year
Will NotImplement
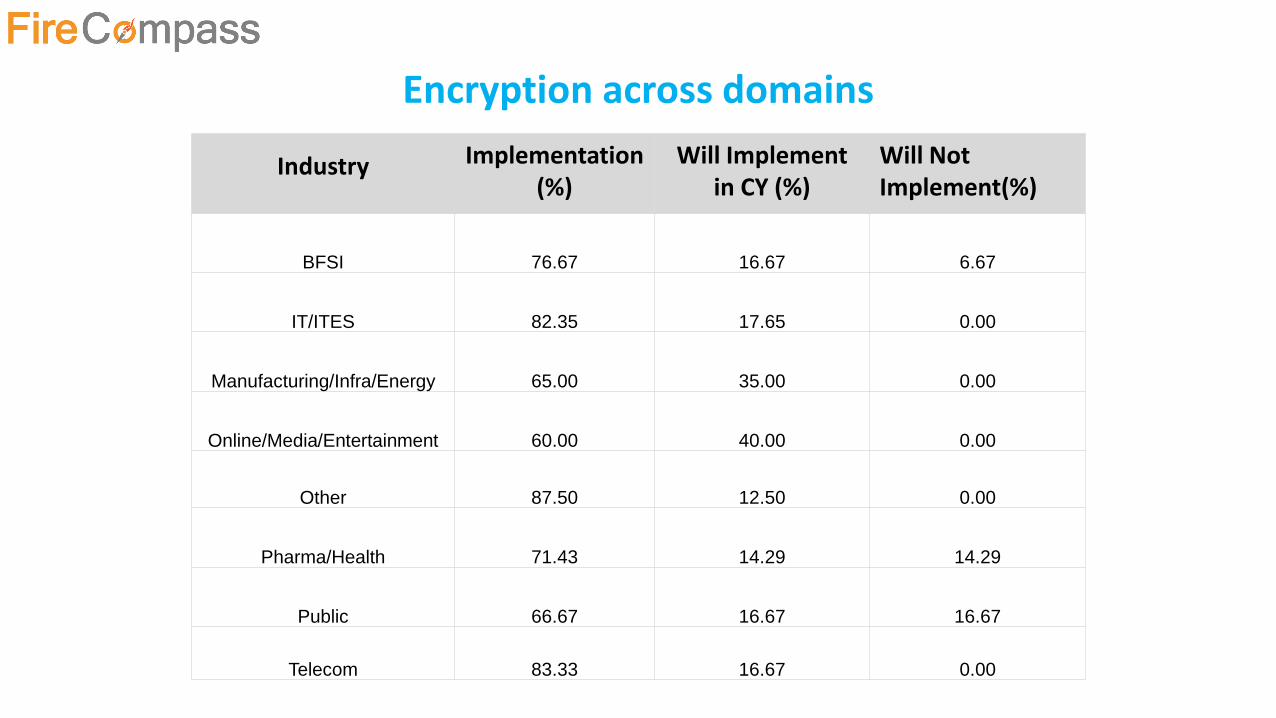
Encryption across domains
Industry Implementation (%)
Will Implement in CY (%)
Will Not Implement(%)
BFSI 76.67 16.67 6.67
IT/ITES 82.35 17.65 0.00
Manufacturing/Infra/Energy 65.00 35.00 0.00
Online/Media/Entertainment 60.00 40.00 0.00
Other 87.50 12.50 0.00
Pharma/Health 71.43 14.29 14.29
Public 66.67 16.67 16.67
Telecom 83.33 16.67 0.00

Encryption across regions
Region Implementation (%)
Will Implement in CY (%)
Will Not Implement(%)
Ahmedabad 50.00 50.00 0.00
Bangalore 75.00 25.00 0.00
Chennai 60.00 20.00 20.00
Delhi NCR 83.87 12.90 3.23
Hyderabad 57.14 42.86 0.00
Kolkata 50.00 50.00 0.00
Mumbai 70.00 22.50 7.50
Others 75.00 25.00 0.00
Pune 80.00 10.00 10.00
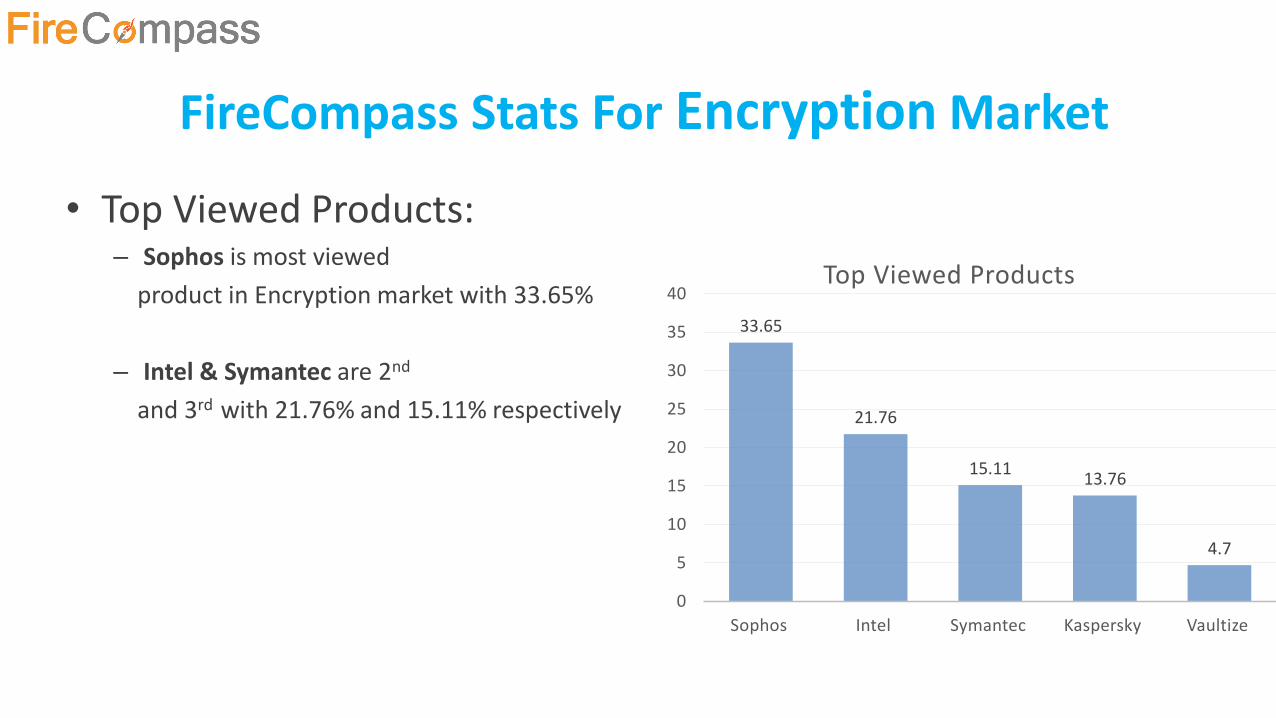
FireCompass Stats For Encryption Market
• Top Viewed Products:– Sophos is most viewed
product in Encryption market with 33.65%
– Intel & Symantec are 2nd
and 3rd with 21.76% and 15.11% respectively
33.65
21.76
15.1113.76
4.7
0
5
10
15
20
25
30
35
40
Sophos Intel Symantec Kaspersky Vaultize
Top Viewed Products
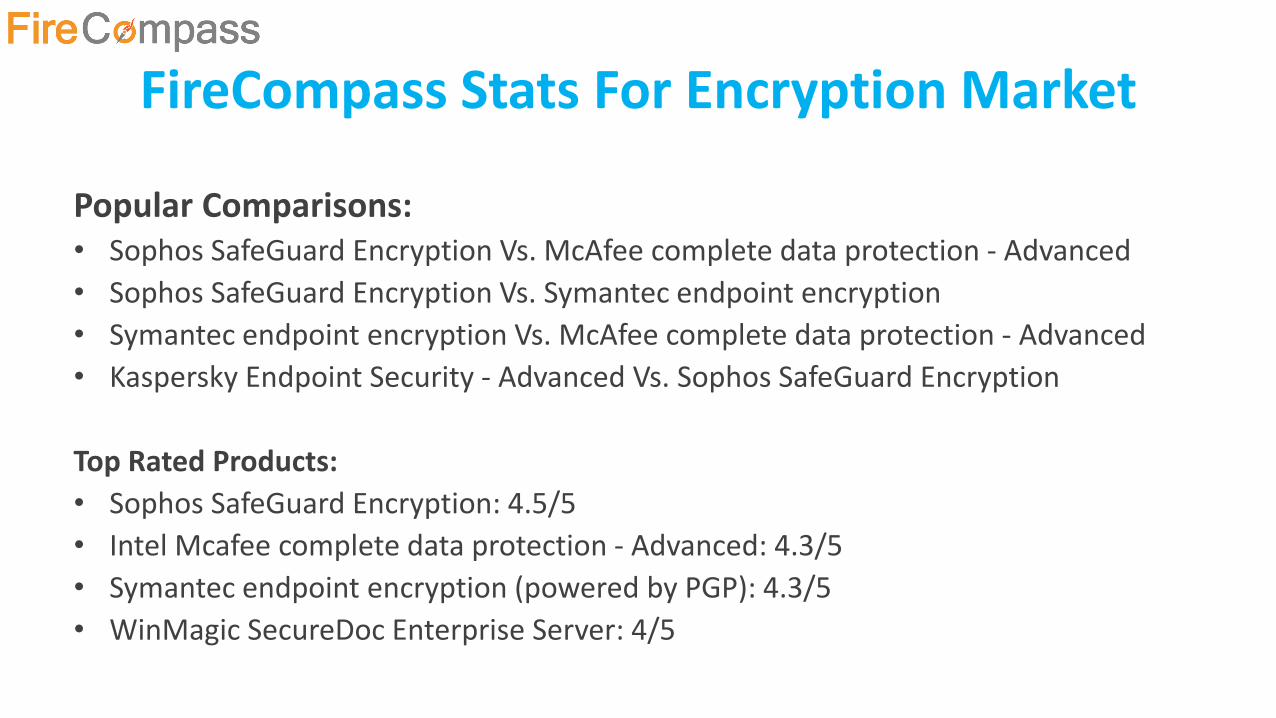
FireCompass Stats For Encryption Market
Popular Comparisons:• Sophos SafeGuard Encryption Vs. McAfee complete data protection - Advanced
• Sophos SafeGuard Encryption Vs. Symantec endpoint encryption
• Symantec endpoint encryption Vs. McAfee complete data protection - Advanced
• Kaspersky Endpoint Security - Advanced Vs. Sophos SafeGuard Encryption
Top Rated Products:
• Sophos SafeGuard Encryption: 4.5/5
• Intel Mcafee complete data protection - Advanced: 4.3/5
• Symantec endpoint encryption (powered by PGP): 4.3/5
• WinMagic SecureDoc Enterprise Server: 4/5
Unified Threat Management
(UTM)
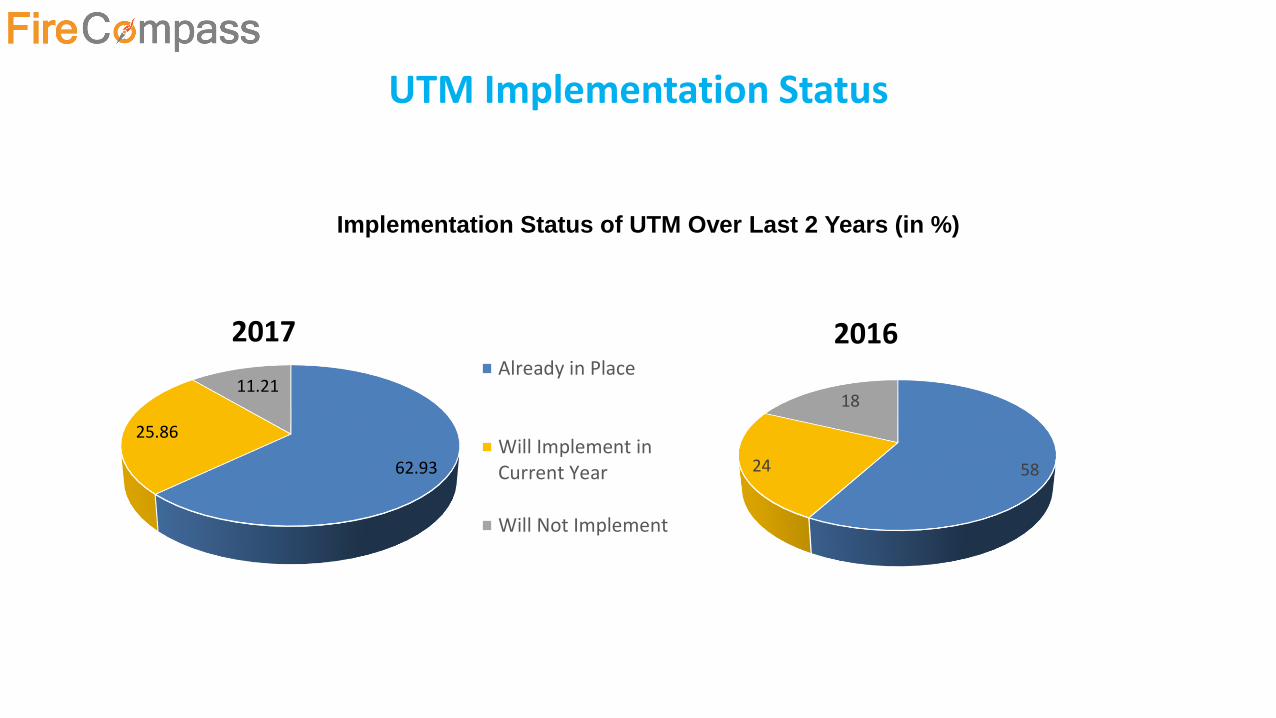
UTM Implementation Status
Implementation Status of UTM Over Last 2 Years (in %)
62.93
25.86
11.21
2017Already in Place
Will Implement inCurrent Year
Will Not Implement
5824
18
2016
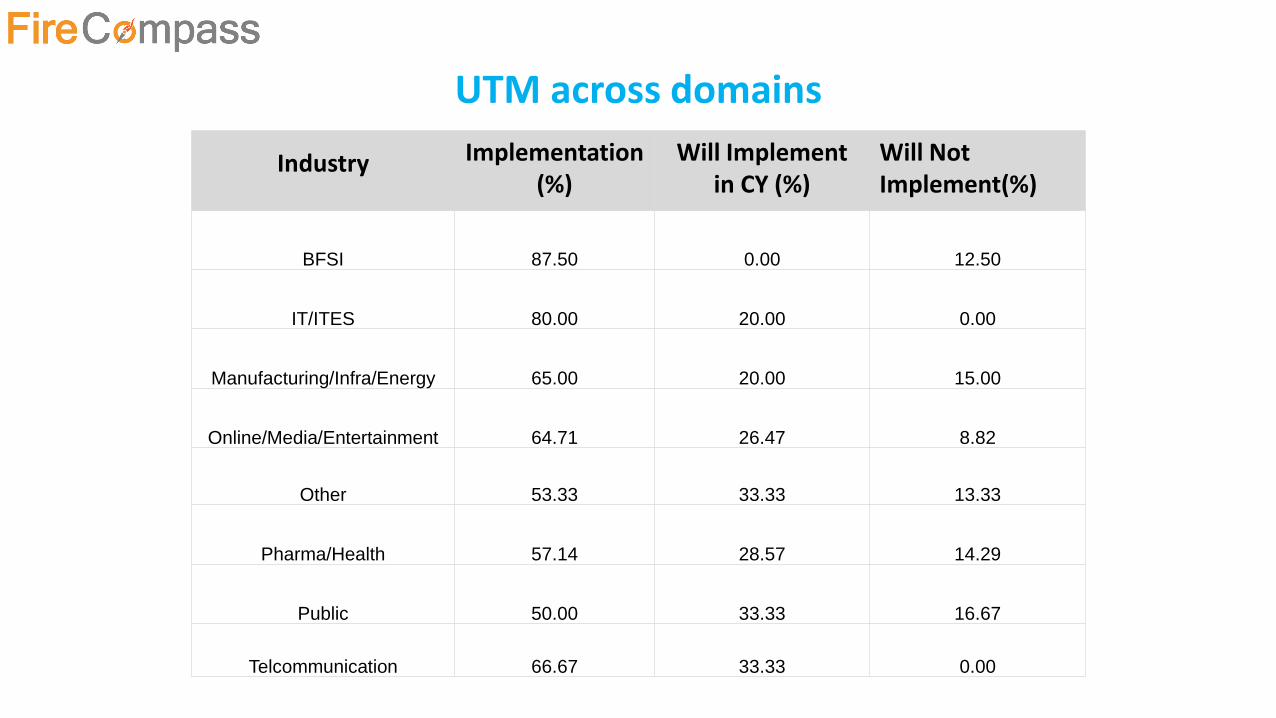
UTM across domains
Industry Implementation (%)
Will Implement in CY (%)
Will Not Implement(%)
BFSI 87.50 0.00 12.50
IT/ITES 80.00 20.00 0.00
Manufacturing/Infra/Energy 65.00 20.00 15.00
Online/Media/Entertainment 64.71 26.47 8.82
Other 53.33 33.33 13.33
Pharma/Health 57.14 28.57 14.29
Public 50.00 33.33 16.67
Telcommunication 66.67 33.33 0.00
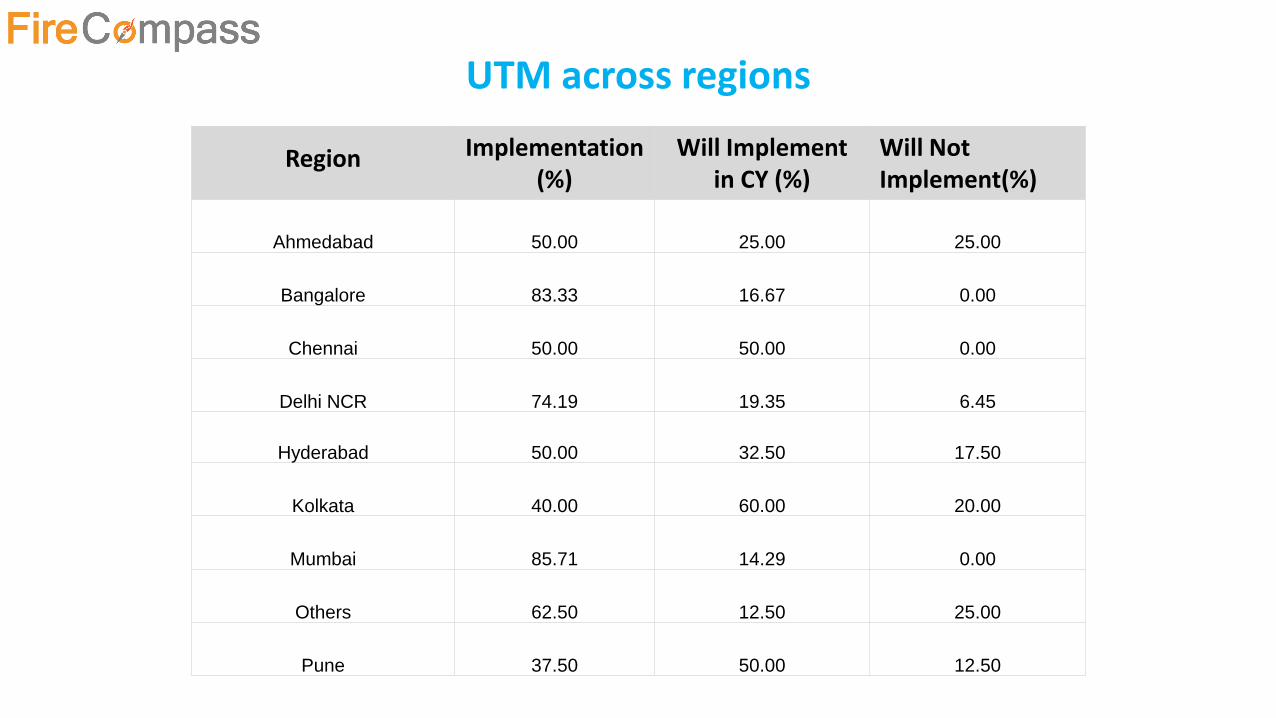
UTM across regions
Region Implementation (%)
Will Implement in CY (%)
Will Not Implement(%)
Ahmedabad 50.00 25.00 25.00
Bangalore 83.33 16.67 0.00
Chennai 50.00 50.00 0.00
Delhi NCR 74.19 19.35 6.45
Hyderabad 50.00 32.50 17.50
Kolkata 40.00 60.00 20.00
Mumbai 85.71 14.29 0.00
Others 62.50 12.50 25.00
Pune 37.50 50.00 12.50
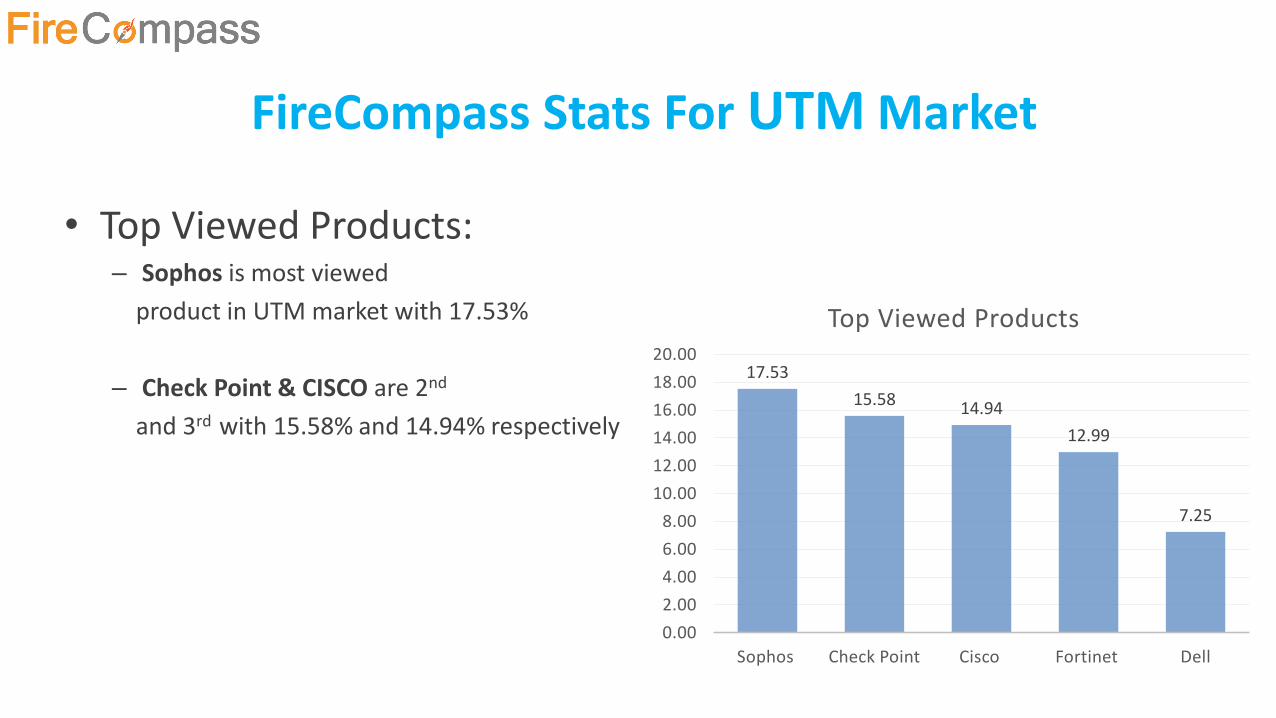
FireCompass Stats For UTM Market
• Top Viewed Products:– Sophos is most viewed
product in UTM market with 17.53%
– Check Point & CISCO are 2nd
and 3rd with 15.58% and 14.94% respectively
17.53
15.58 14.94
12.99
7.25
0.00
2.00
4.00
6.00
8.00
10.00
12.00
14.00
16.00
18.00
20.00
Sophos Check Point Cisco Fortinet Dell
Top Viewed Products
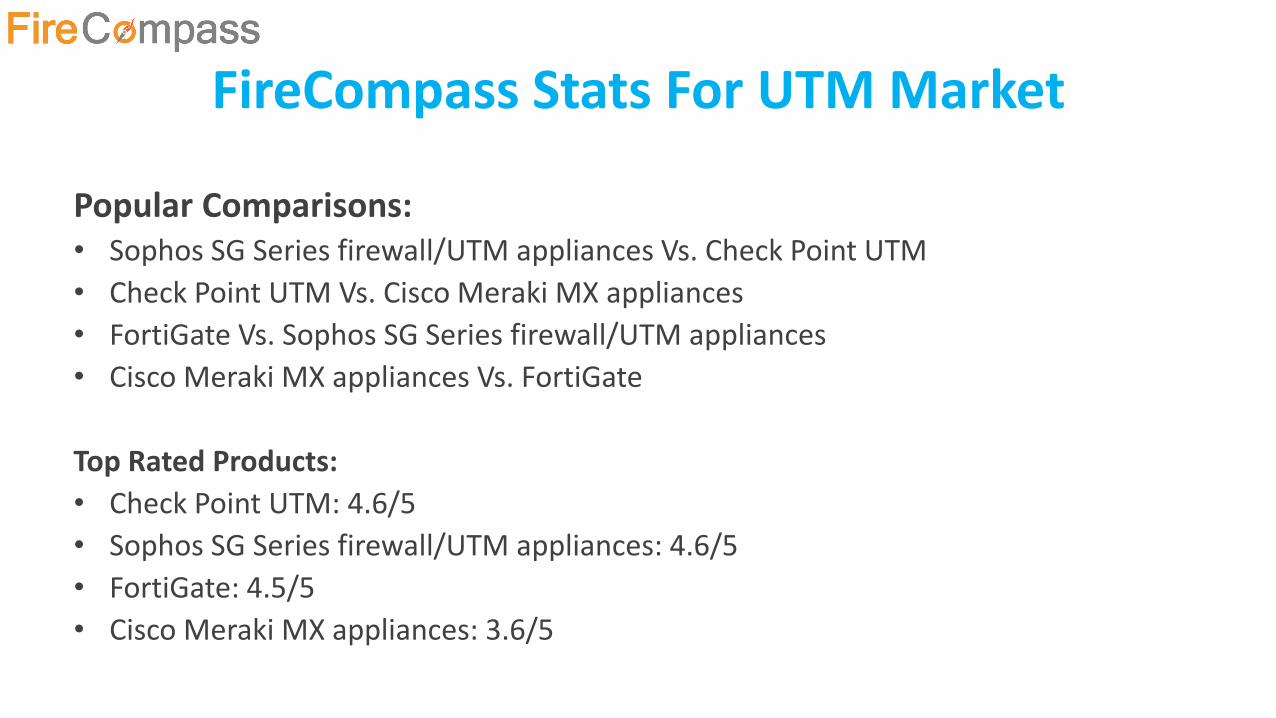
FireCompass Stats For UTM Market
Popular Comparisons:• Sophos SG Series firewall/UTM appliances Vs. Check Point UTM
• Check Point UTM Vs. Cisco Meraki MX appliances
• FortiGate Vs. Sophos SG Series firewall/UTM appliances
• Cisco Meraki MX appliances Vs. FortiGate
Top Rated Products:
• Check Point UTM: 4.6/5
• Sophos SG Series firewall/UTM appliances: 4.6/5
• FortiGate: 4.5/5
• Cisco Meraki MX appliances: 3.6/5
Managed Security Services
(MSS)
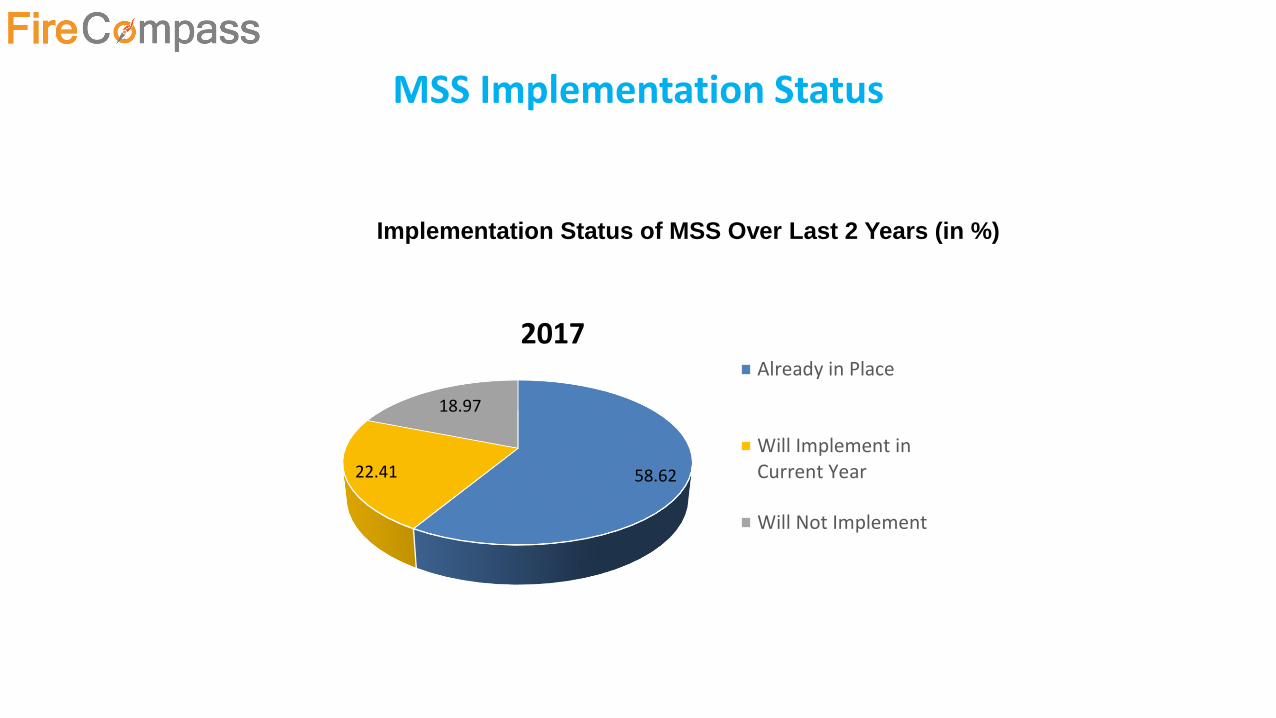
MSS Implementation Status
Implementation Status of MSS Over Last 2 Years (in %)
58.6222.41
18.97
2017Already in Place
Will Implement inCurrent Year
Will Not Implement
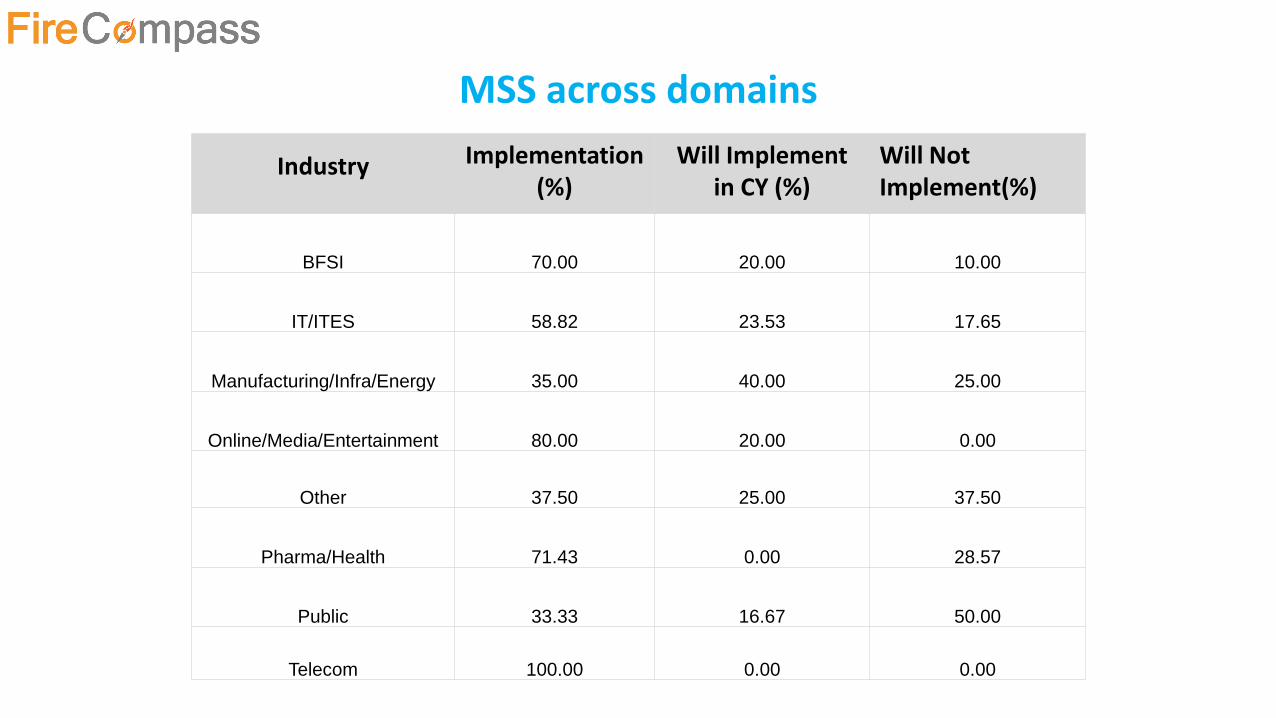
MSS across domains
Industry Implementation (%)
Will Implement in CY (%)
Will Not Implement(%)
BFSI 70.00 20.00 10.00
IT/ITES 58.82 23.53 17.65
Manufacturing/Infra/Energy 35.00 40.00 25.00
Online/Media/Entertainment 80.00 20.00 0.00
Other 37.50 25.00 37.50
Pharma/Health 71.43 0.00 28.57
Public 33.33 16.67 50.00
Telecom 100.00 0.00 0.00
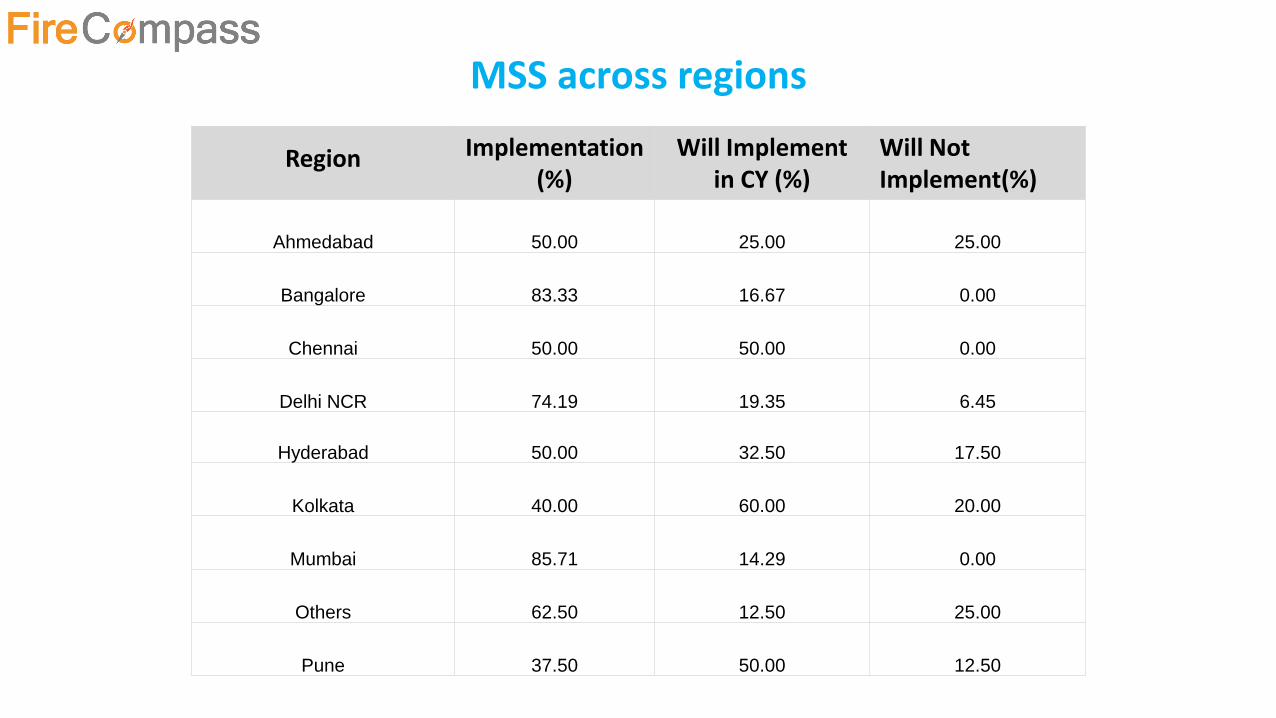
MSS across regions
Region Implementation (%)
Will Implement in CY (%)
Will Not Implement(%)
Ahmedabad 50.00 25.00 25.00
Bangalore 83.33 16.67 0.00
Chennai 50.00 50.00 0.00
Delhi NCR 74.19 19.35 6.45
Hyderabad 50.00 32.50 17.50
Kolkata 40.00 60.00 20.00
Mumbai 85.71 14.29 0.00
Others 62.50 12.50 25.00
Pune 37.50 50.00 12.50
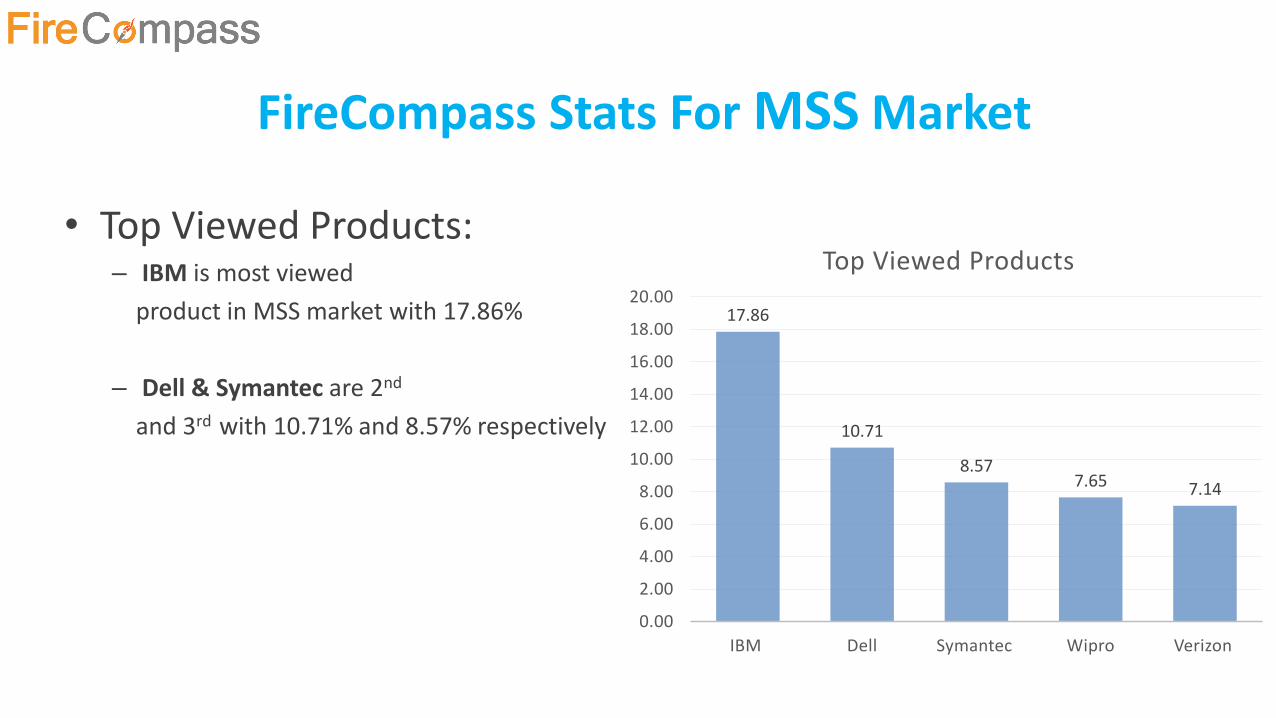
FireCompass Stats For MSS Market
• Top Viewed Products:– IBM is most viewed
product in MSS market with 17.86%
– Dell & Symantec are 2nd
and 3rd with 10.71% and 8.57% respectively
17.86
10.71
8.577.65 7.14
0.00
2.00
4.00
6.00
8.00
10.00
12.00
14.00
16.00
18.00
20.00
IBM Dell Symantec Wipro Verizon
Top Viewed Products
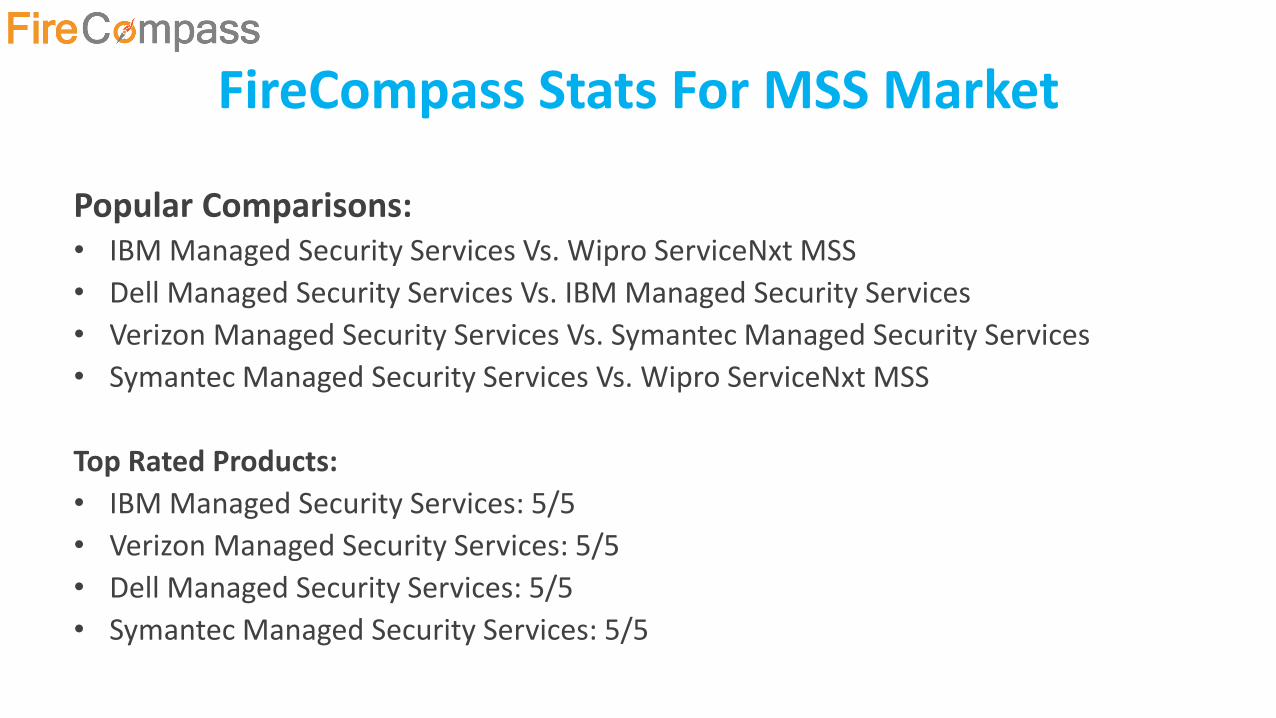
FireCompass Stats For MSS Market
Popular Comparisons:• IBM Managed Security Services Vs. Wipro ServiceNxt MSS
• Dell Managed Security Services Vs. IBM Managed Security Services
• Verizon Managed Security Services Vs. Symantec Managed Security Services
• Symantec Managed Security Services Vs. Wipro ServiceNxt MSS
Top Rated Products:
• IBM Managed Security Services: 5/5
• Verizon Managed Security Services: 5/5
• Dell Managed Security Services: 5/5
• Symantec Managed Security Services: 5/5
Email Security
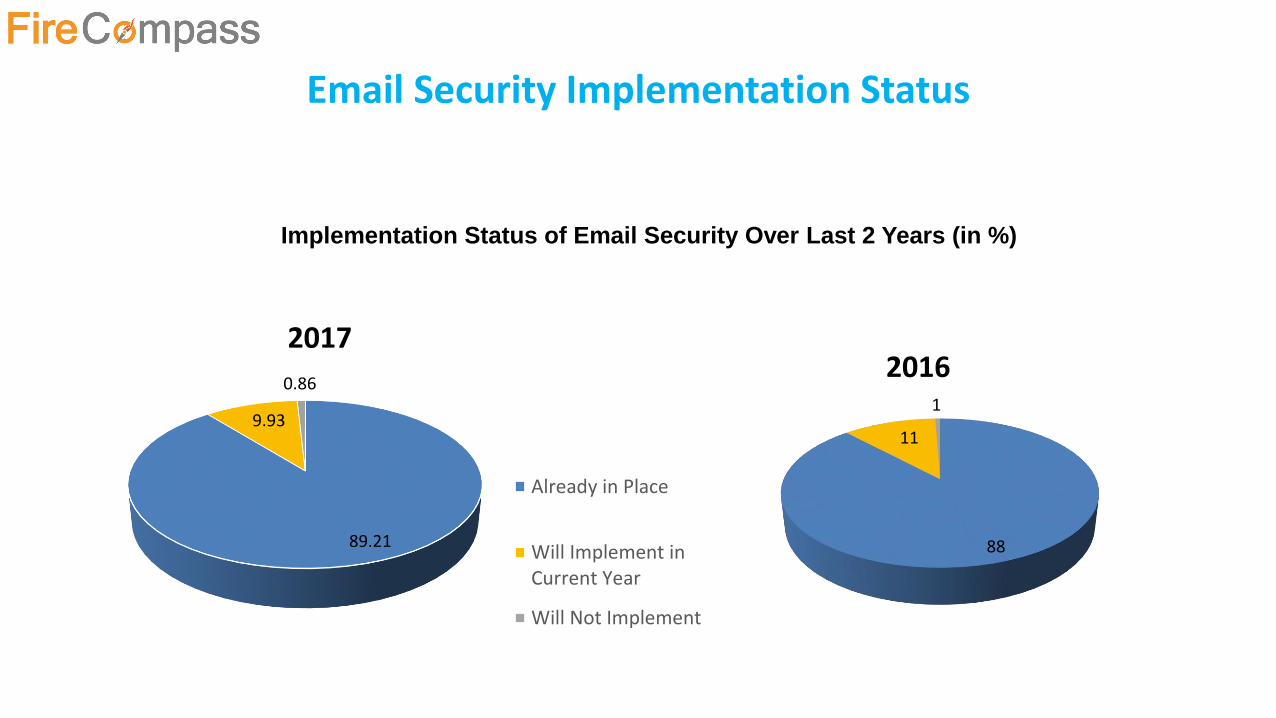
Email Security Implementation Status
Implementation Status of Email Security Over Last 2 Years (in %)
89.21
9.93
0.86
2017
Already in Place
Will Implement inCurrent Year
Will Not Implement
88
11
1
2016
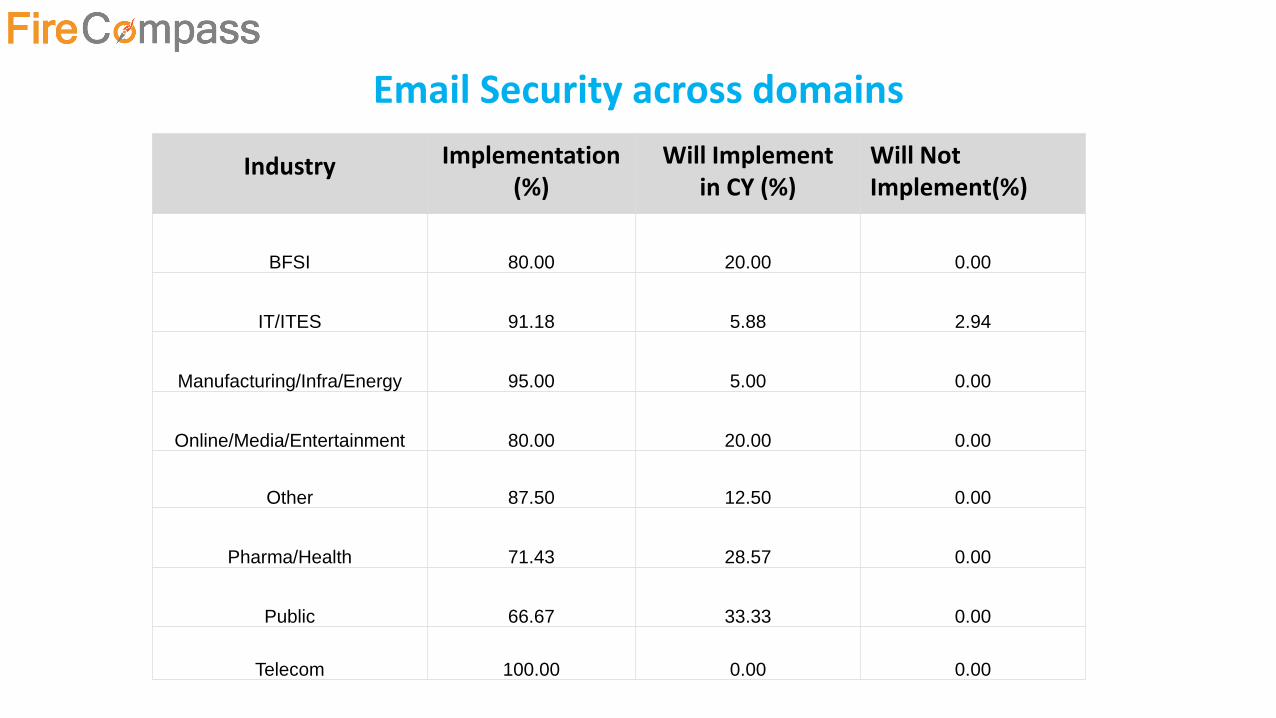
Email Security across domains
Industry Implementation (%)
Will Implement in CY (%)
Will Not Implement(%)
BFSI 80.00 20.00 0.00
IT/ITES 91.18 5.88 2.94
Manufacturing/Infra/Energy 95.00 5.00 0.00
Online/Media/Entertainment 80.00 20.00 0.00
Other 87.50 12.50 0.00
Pharma/Health 71.43 28.57 0.00
Public 66.67 33.33 0.00
Telecom 100.00 0.00 0.00
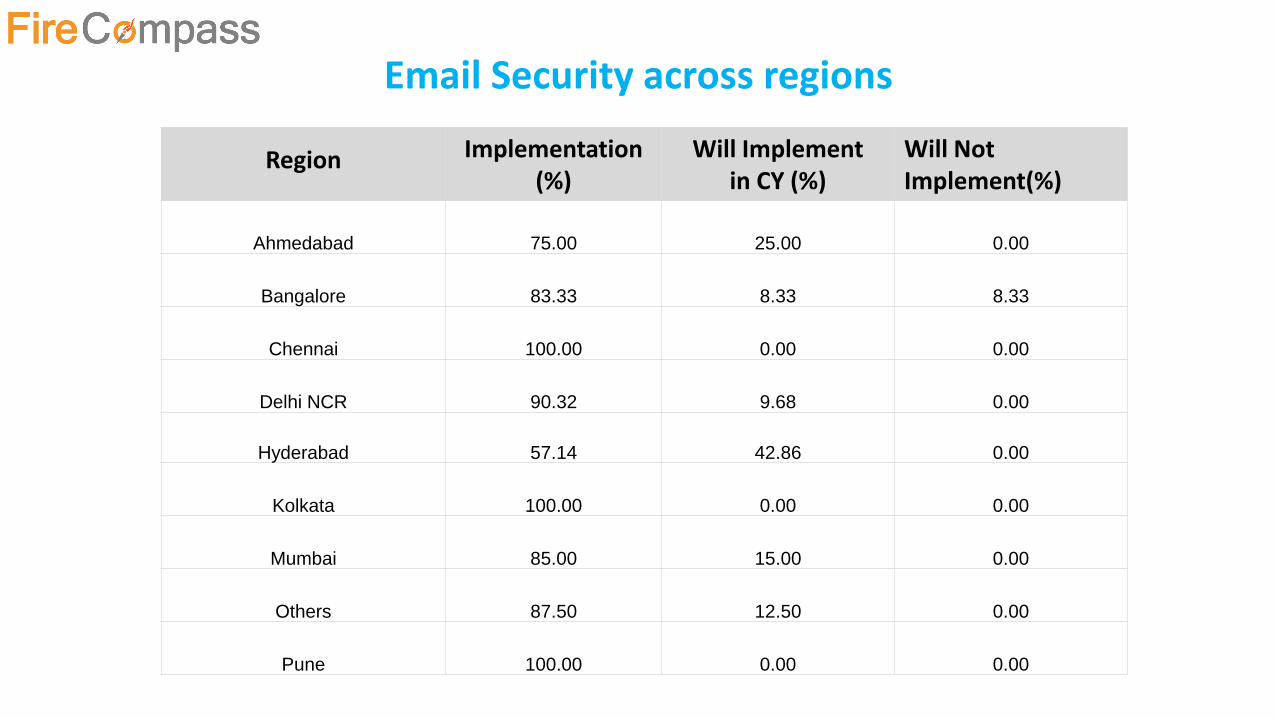
Email Security across regions
Region Implementation (%)
Will Implement in CY (%)
Will Not Implement(%)
Ahmedabad 75.00 25.00 0.00
Bangalore 83.33 8.33 8.33
Chennai 100.00 0.00 0.00
Delhi NCR 90.32 9.68 0.00
Hyderabad 57.14 42.86 0.00
Kolkata 100.00 0.00 0.00
Mumbai 85.00 15.00 0.00
Others 87.50 12.50 0.00
Pune 100.00 0.00 0.00
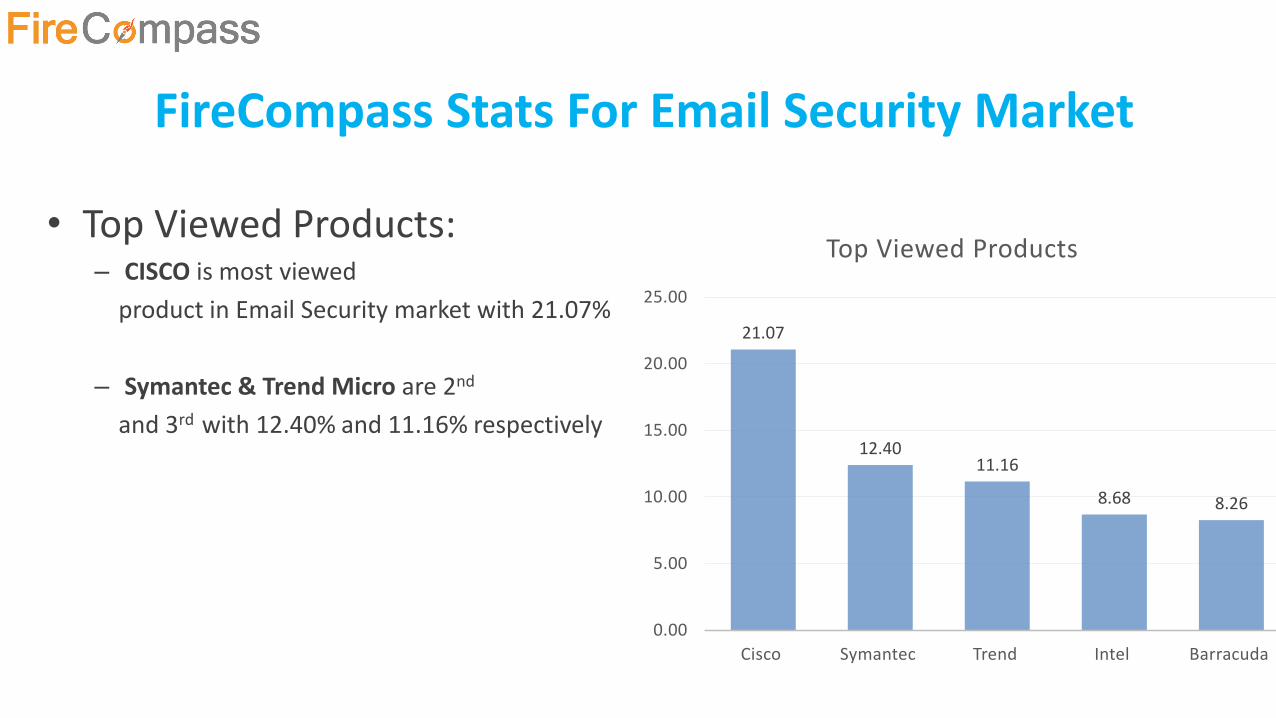
FireCompass Stats For Email Security Market
• Top Viewed Products:– CISCO is most viewed
product in Email Security market with 21.07%
– Symantec & Trend Micro are 2nd
and 3rd with 12.40% and 11.16% respectively
21.07
12.4011.16
8.68 8.26
0.00
5.00
10.00
15.00
20.00
25.00
Cisco Symantec Trend Intel Barracuda
Top Viewed Products
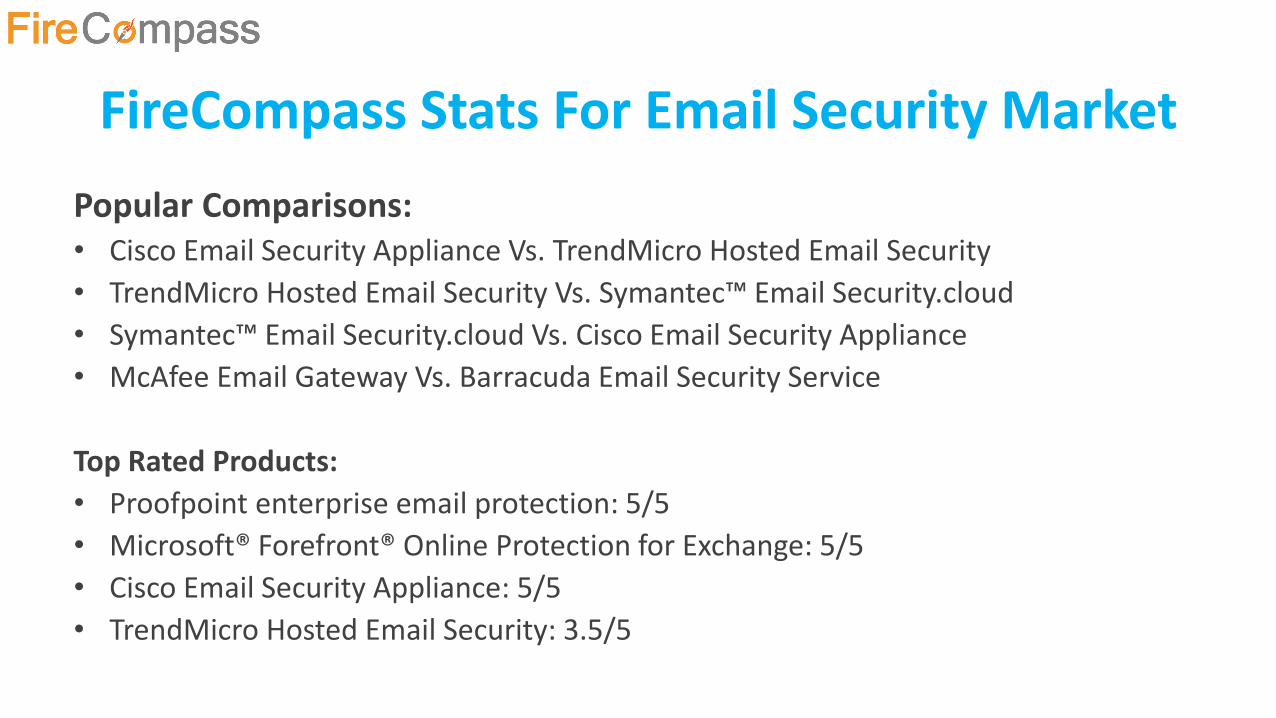
FireCompass Stats For Email Security Market
Popular Comparisons:• Cisco Email Security Appliance Vs. TrendMicro Hosted Email Security
• TrendMicro Hosted Email Security Vs. Symantec™ Email Security.cloud
• Symantec™ Email Security.cloud Vs. Cisco Email Security Appliance
• McAfee Email Gateway Vs. Barracuda Email Security Service
Top Rated Products:
• Proofpoint enterprise email protection: 5/5
• Microsoft® Forefront® Online Protection for Exchange: 5/5
• Cisco Email Security Appliance: 5/5
• TrendMicro Hosted Email Security: 3.5/5
Vulnerability Assessment
(VA)
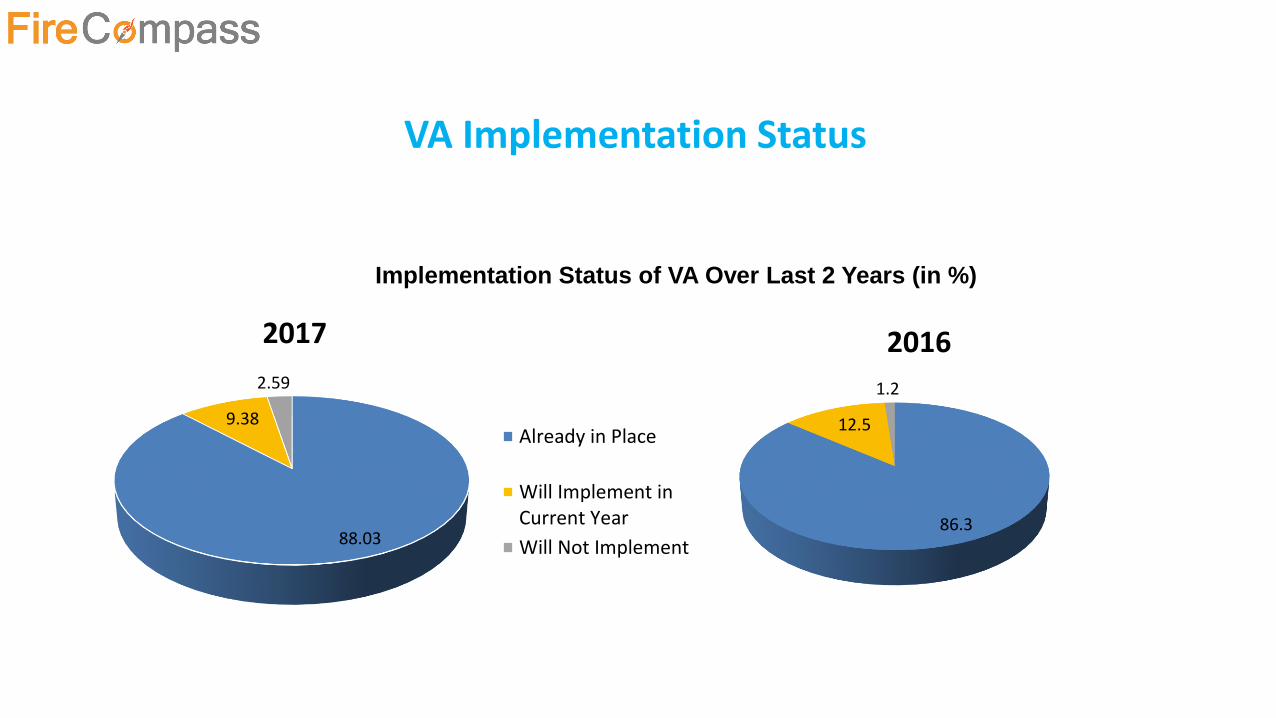
VA Implementation Status
Implementation Status of VA Over Last 2 Years (in %)
88.03
9.38
2.59
2017
Already in Place
Will Implement inCurrent Year
Will Not Implement86.3
12.5
1.2
2016
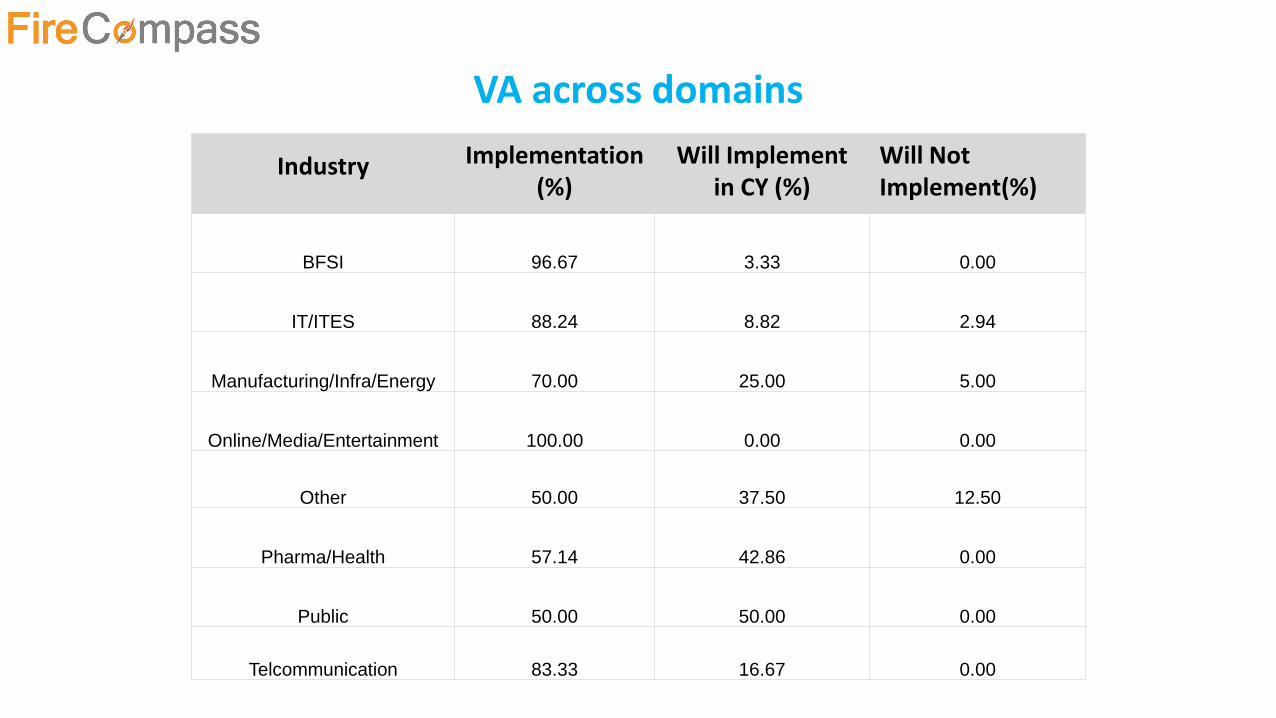
VA across domains
Industry Implementation (%)
Will Implement in CY (%)
Will Not Implement(%)
BFSI 96.67 3.33 0.00
IT/ITES 88.24 8.82 2.94
Manufacturing/Infra/Energy 70.00 25.00 5.00
Online/Media/Entertainment 100.00 0.00 0.00
Other 50.00 37.50 12.50
Pharma/Health 57.14 42.86 0.00
Public 50.00 50.00 0.00
Telcommunication 83.33 16.67 0.00
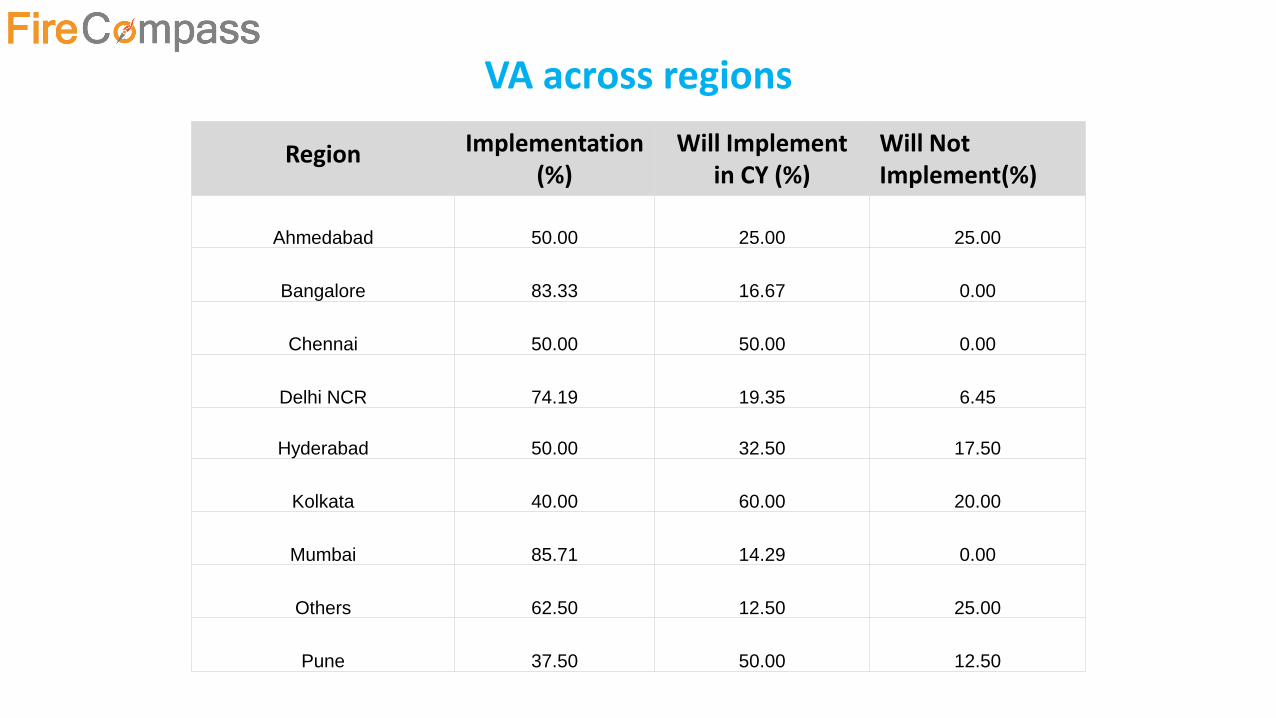
VA across regions
Region Implementation (%)
Will Implement in CY (%)
Will Not Implement(%)
Ahmedabad 50.00 25.00 25.00
Bangalore 83.33 16.67 0.00
Chennai 50.00 50.00 0.00
Delhi NCR 74.19 19.35 6.45
Hyderabad 50.00 32.50 17.50
Kolkata 40.00 60.00 20.00
Mumbai 85.71 14.29 0.00
Others 62.50 12.50 25.00
Pune 37.50 50.00 12.50
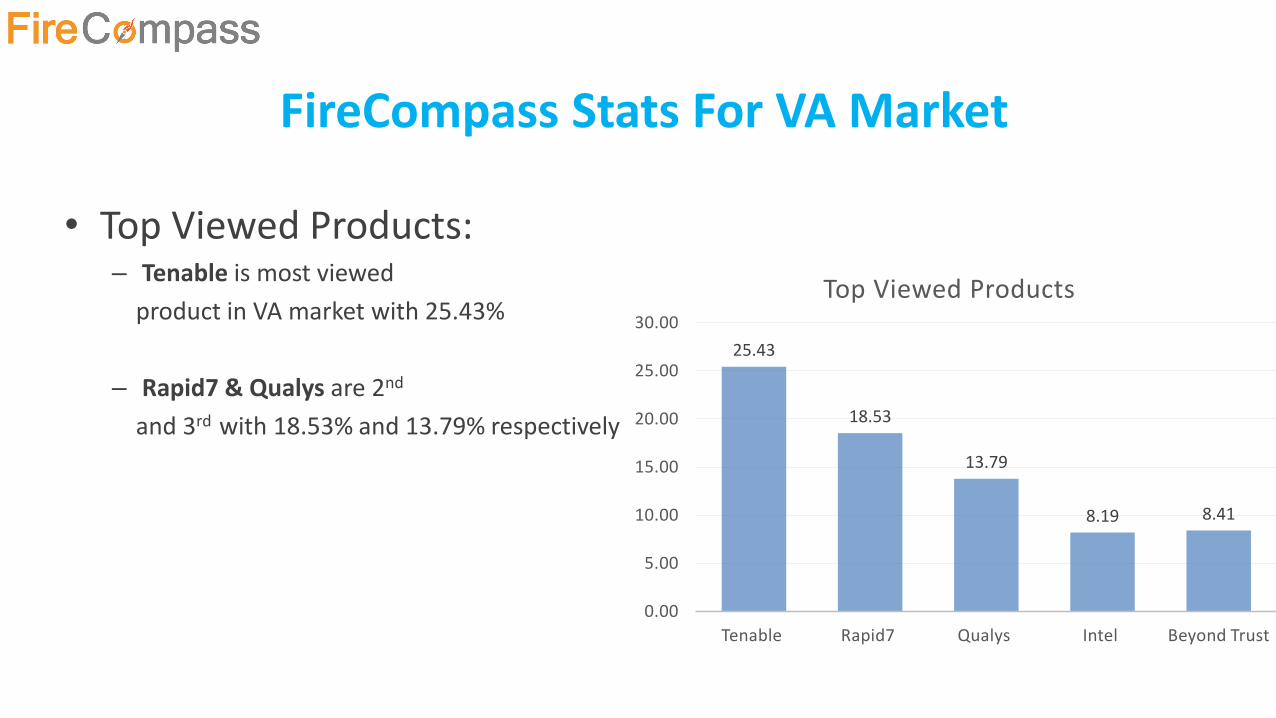
FireCompass Stats For VA Market
• Top Viewed Products:– Tenable is most viewed
product in VA market with 25.43%
– Rapid7 & Qualys are 2nd
and 3rd with 18.53% and 13.79% respectively
25.43
18.53
13.79
8.19 8.41
0.00
5.00
10.00
15.00
20.00
25.00
30.00
Tenable Rapid7 Qualys Intel Beyond Trust
Top Viewed Products
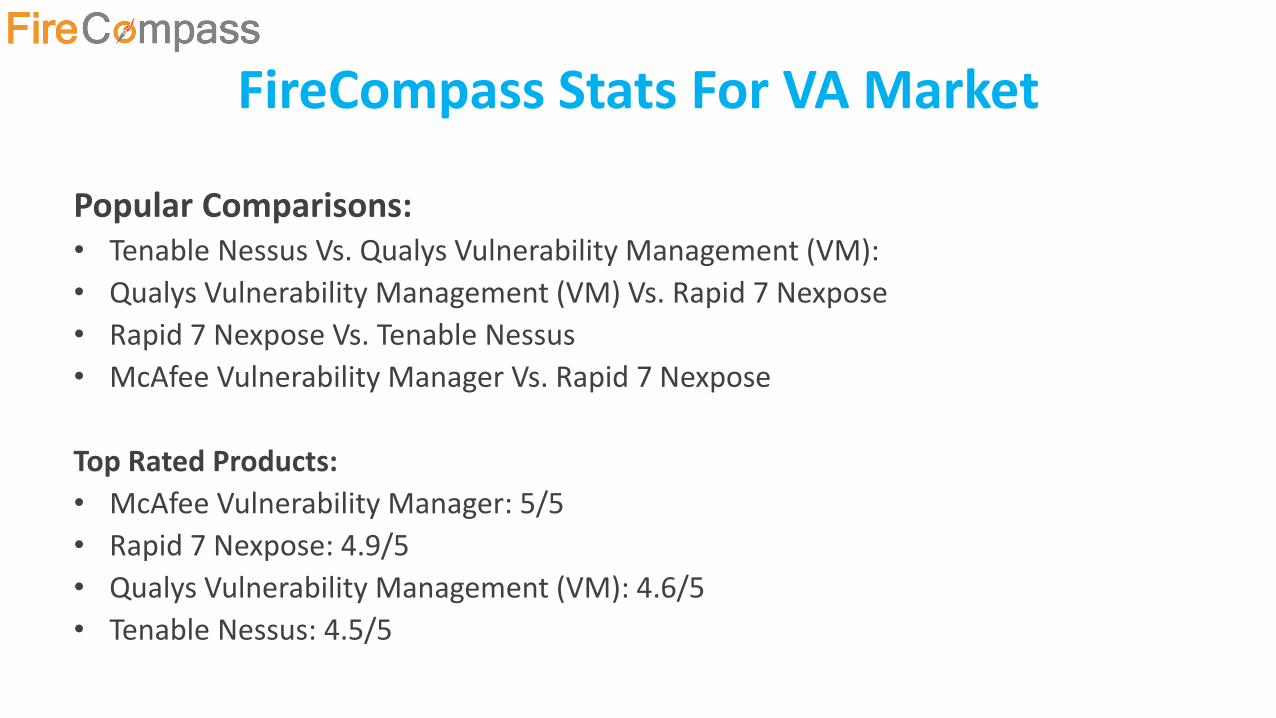
FireCompass Stats For VA Market
Popular Comparisons:• Tenable Nessus Vs. Qualys Vulnerability Management (VM):
• Qualys Vulnerability Management (VM) Vs. Rapid 7 Nexpose
• Rapid 7 Nexpose Vs. Tenable Nessus
• McAfee Vulnerability Manager Vs. Rapid 7 Nexpose
Top Rated Products:
• McAfee Vulnerability Manager: 5/5
• Rapid 7 Nexpose: 4.9/5
• Qualys Vulnerability Management (VM): 4.6/5
• Tenable Nessus: 4.5/5
Thank You