Embed Size (px)
Citation preview
r r
INDEPENDENT RESEARCH Nets 3rd January 2017 The Thor of payments not to be worshipped
TMT Fair Value DKK105 (price DKK123.60) SELL Coverage initiated
Bloomberg NETB SS Reuters NETS.CO 12-month High / Low (DKK) 148.0 / 111.6 Market capitalisation (DKKm) 24,771 Enterprise Value (BG estimates DKKm) 31,988 Avg. 6m daily volume ('000 shares) 1,222 Free Float 60.0% 3y EPS CAGR 9.8% Gearing (12/15) 246% Dividend yields (12/16e) NM
Nets benefits from its leadership status in Nordic countries, with a positioning in the entire payments chain. That said, its multiples are still high for a player mainly present physically (EV/EBITDA over 12 rolling months of 12.6x vs. 10.9x in our SOTP). Even if the group succeeds its development in Sweden and in online activities, this would not prevent its other key Nordic countries from gradually reaching maturity. Furthermore, we see the risk that its leadership in the region could start to be threatened by the arrival of European or global players. Finally, the fact that Nordea is choosing the mobile payment solution of rival Danske has undermined a potential growth driver for the group. We are initiating Nets with a Sell recommendation and FV of DKK105.
Nets is a Danish FinTech, namely a software company present in the payments field (by card and account-to-account). It floated on 23rd September 2016 at DKK150, or 2016e EV/EBITDA of >20x, a multiple we consider unreasonable given that it corresponds to that of pure online players whereas Nets is essentially a physical PSP.
Nets is the third-largest PSP in Europe thanks to its leadership in the main Nordic countries. Like Worldline, it is present in the entire payments value chain (transaction acquiring/processing for merchants, card issuing processing, clearing/settlement). And like Wirecard, which has the specific feature of owning its own bank, Nets has the original feature of operating the main local debit card schemes. Its model is highly integrated (in Denmark and Norway) and it is often a preferred partner of banks and companies thanks to its historical anchorage, its comprehensive profile and its size in the region.
We estimate that Nets' development in Sweden (<10% of sales) and the ramp-up in online services (~10% of sales) is set to take place at the same time as its key markets reach maturity (Denmark, Norway, Finland: 90% of sales). Finally, since payments are increasingly global, the main rivals are set to arrive in Nordic countries at some point. In all, the group's multiples do not yet seem to be in phase with its positioning (primarily a physical PSP) and its risk profile (dependence on one region, arrival of major rival PSPs).
YE December 12/15 12/16e 12/17e 12/18e Revenue (DKKm) 9,040 10,143 10,853 11,450 EBITA DKKm) 1,977 2,204 2,437 2,724 Op.Margin (%) 21.9 21.7 22.5 23.8 Diluted EPS (DKK) 6.64 6.24 7.52 8.80 EV/Sales 4.10x 3.15x 2.83x 2.62x EV/EBITDA 21.7x 16.2x 11.5x 9.9x EV/EBITA 18.7x 14.5x 12.6x 11.0x P/E 18.6x 19.8x 16.4x 14.0x ROCE 8.7 14.0 12.1 12.9
106.0
116.0
126.0
136.0
146.0
156.0
14/11/16
NETS SXX EUROPE 600
Analyst: Sector Analyst Team: Richard-Maxime Beaudoux Thomas Coudry 33(0) 1.56.68.75.61 Gregory Ramirez [email protected] Dorian Terral
Nets
2
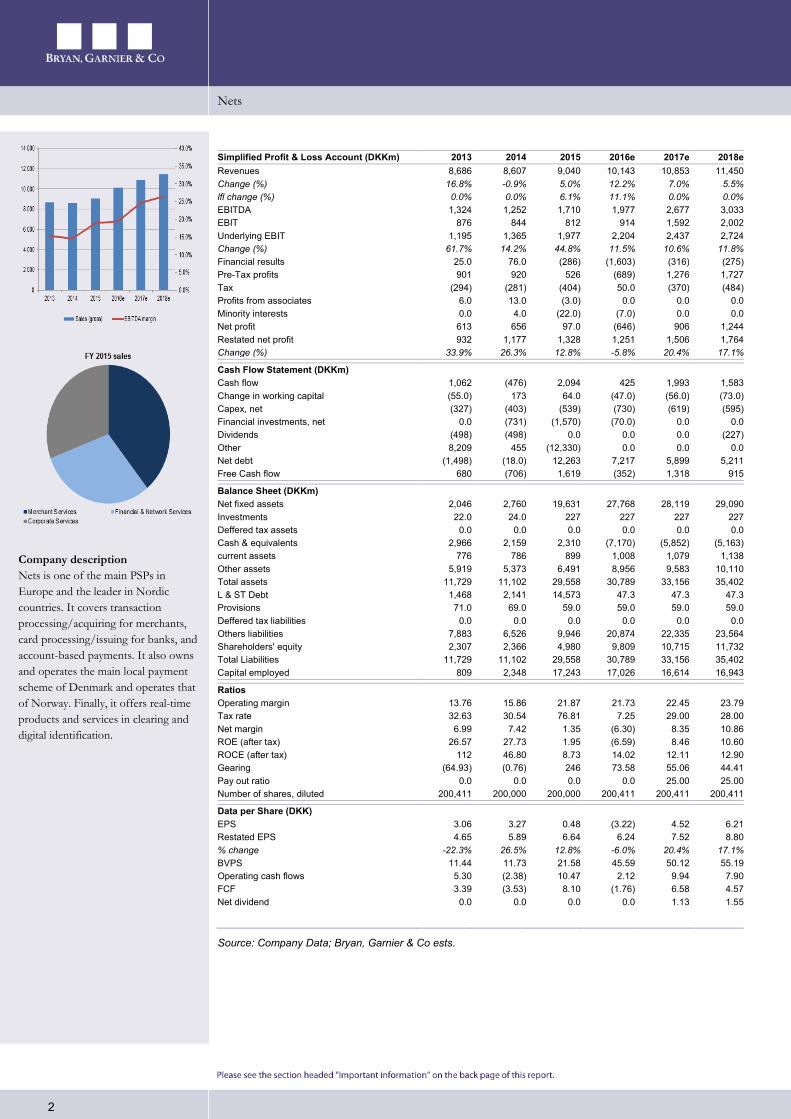
Simplified Profit & Loss Account (DKKm) 2013 2014 2015 2016e 2017e 2018e Revenues 8,686 8,607 9,040 10,143 10,853 11,450 Change (%) 16.8% -0.9% 5.0% 12.2% 7.0% 5.5% lfl change (%) 0.0% 0.0% 6.1% 11.1% 0.0% 0.0% EBITDA 1,324 1,252 1,710 1,977 2,677 3,033 EBIT 876 844 812 914 1,592 2,002 Underlying EBIT 1,195 1,365 1,977 2,204 2,437 2,724 Change (%) 61.7% 14.2% 44.8% 11.5% 10.6% 11.8% Financial results 25.0 76.0 (286) (1,603) (316) (275) Pre-Tax profits 901 920 526 (689) 1,276 1,727 Tax (294) (281) (404) 50.0 (370) (484) Profits from associates 6.0 13.0 (3.0) 0.0 0.0 0.0 Minority interests 0.0 4.0 (22.0) (7.0) 0.0 0.0 Net profit 613 656 97.0 (646) 906 1,244 Restated net profit 932 1,177 1,328 1,251 1,506 1,764 Change (%) 33.9% 26.3% 12.8% -5.8% 20.4% 17.1% Cash Flow Statement (DKKm) Cash flow 1,062 (476) 2,094 425 1,993 1,583 Change in working capital (55.0) 173 64.0 (47.0) (56.0) (73.0) Capex, net (327) (403) (539) (730) (619) (595) Financial investments, net 0.0 (731) (1,570) (70.0) 0.0 0.0 Dividends (498) (498) 0.0 0.0 0.0 (227) Other 8,209 455 (12,330) 0.0 0.0 0.0 Net debt (1,498) (18.0) 12,263 7,217 5,899 5,211 Free Cash flow 680 (706) 1,619 (352) 1,318 915 Balance Sheet (DKKm) Net fixed assets 2,046 2,760 19,631 27,768 28,119 29,090 Investments 22.0 24.0 227 227 227 227 Deffered tax assets 0.0 0.0 0.0 0.0 0.0 0.0 Cash & equivalents 2,966 2,159 2,310 (7,170) (5,852) (5,163) current assets 776 786 899 1,008 1,079 1,138 Other assets 5,919 5,373 6,491 8,956 9,583 10,110 Total assets 11,729 11,102 29,558 30,789 33,156 35,402 L & ST Debt 1,468 2,141 14,573 47.3 47.3 47.3 Provisions 71.0 69.0 59.0 59.0 59.0 59.0 Deffered tax liabilities 0.0 0.0 0.0 0.0 0.0 0.0 Others liabilities 7,883 6,526 9,946 20,874 22,335 23,564 Shareholders' equity 2,307 2,366 4,980 9,809 10,715 11,732 Total Liabilities 11,729 11,102 29,558 30,789 33,156 35,402 Capital employed 809 2,348 17,243 17,026 16,614 16,943 Ratios Operating margin 13.76 15.86 21.87 21.73 22.45 23.79 Tax rate 32.63 30.54 76.81 7.25 29.00 28.00 Net margin 6.99 7.42 1.35 (6.30) 8.35 10.86 ROE (after tax) 26.57 27.73 1.95 (6.59) 8.46 10.60 ROCE (after tax) 112 46.80 8.73 14.02 12.11 12.90 Gearing (64.93) (0.76) 246 73.58 55.06 44.41 Pay out ratio 0.0 0.0 0.0 0.0 25.00 25.00 Number of shares, diluted 200,411 200,000 200,000 200,411 200,411 200,411 Data per Share (DKK) EPS 3.06 3.27 0.48 (3.22) 4.52 6.21 Restated EPS 4.65 5.89 6.64 6.24 7.52 8.80 % change -22.3% 26.5% 12.8% -6.0% 20.4% 17.1% BVPS 11.44 11.73 21.58 45.59 50.12 55.19 Operating cash flows 5.30 (2.38) 10.47 2.12 9.94 7.90 FCF 3.39 (3.53) 8.10 (1.76) 6.58 4.57 Net dividend 0.0 0.0 0.0 0.0 1.13 1.55
Source: Company Data; Bryan, Garnier & Co ests.
Company description Nets is one of the main PSPs in Europe and the leader in Nordic countries. It covers transaction processing/acquiring for merchants, card processing/issuing for banks, and account-based payments. It also owns and operates the main local payment scheme of Denmark and operates that of Norway. Finally, it offers real-time products and services in clearing and digital identification.

Nets
3
Table of contents
1. Investment Case ........................................................................................................................................... 4
2. Investment summary ................................................................................................................................... 5
3. Valuation ....................................................................................................................................................... 7
3.1. DCF: DKK104 ..................................................................................................................... 7
3.2. SOTP by peer comparison: DKK106 .............................................................................. 9
3.3. Simulation in the event of a takeover: DKK119 ......................................................... 11
4. Nets: An unusual player........................................................................................................................... 13
4.1. From Nordic banks to Nets today ................................................................................. 13
4.2. Understanding Nets' businesses ..................................................................................... 16
4.3. A key player in the Nordics ............................................................................................. 19
5. Traps to avoid when looking at the figures ......................................................................................... 23
5.1. Gross sales and EBITDA (rather than net sales and underlying EBITDA) .......... 23
5.2. Takeover of Visa Europe booked in H1 2016 ............................................................. 24
5.3. What market multiples to look at? ................................................................................. 26
6. Profitable growth priced in ..................................................................................................................... 27
6.1. A look in the rear-view mirror: 2013 - 2015................................................................. 27
6.1.1. Fundamentals in line with those of a physical PSP ..................................................... 27 6.1.2. Top-line growth ................................................................................................................. 29 6.1.3. Profitability ......................................................................................................................... 30
6.2. Growth factors exist but should be seen in perspective ............................................ 31
6.2.1. Growth factors and sources of fresh growth ............................................................... 31 6.2.2. Risk factors ......................................................................................................................... 34
6.3. Our scenario for 2016e and beyond .............................................................................. 35
6.3.1. Top-line growth ................................................................................................................. 36 6.3.2. Profitability ......................................................................................................................... 37 6.3.3. Balance sheet ...................................................................................................................... 39
7. Things are changing for PSPs!................................................................................................................ 41
7.1. A fragmented market ........................................................................................................ 41
7.2. Operations destined to continue .................................................................................... 41
7.3. Forthcoming regulations: the PSD2 directive .............................................................. 43
Bryan Garnier stock rating system............................................................................................................... 47
Nets
4
1. Investment Case
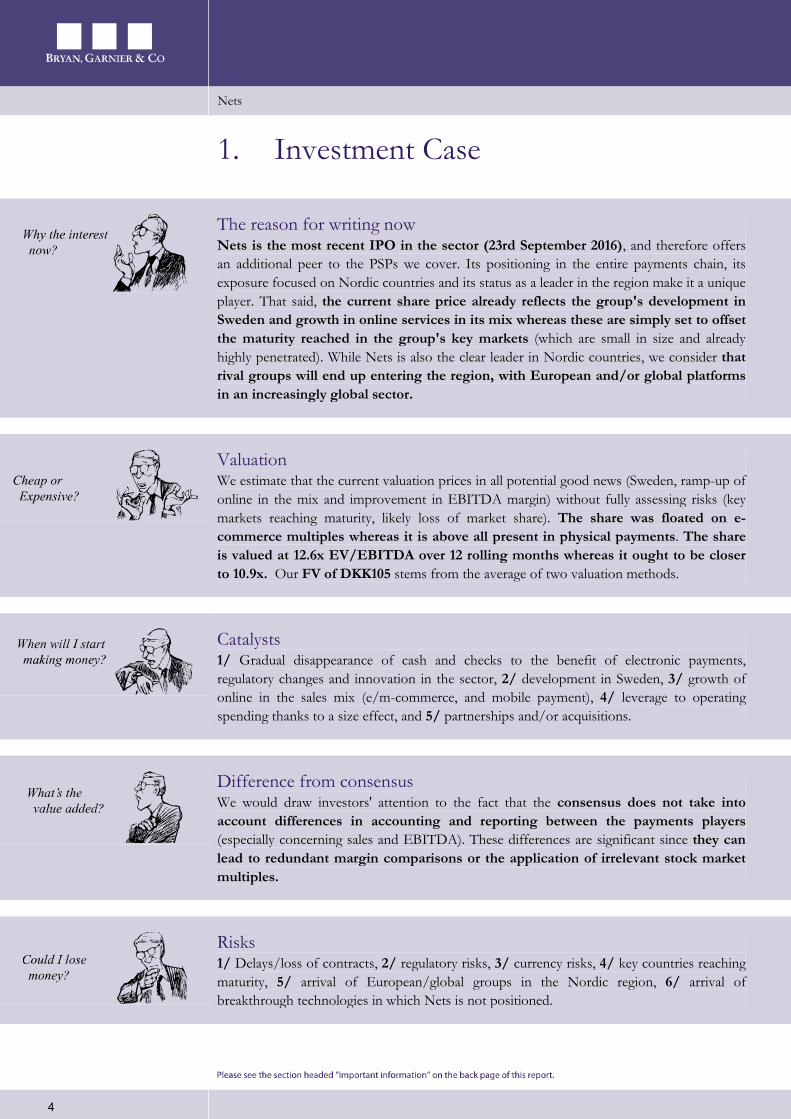
The reason for writing now Nets is the most recent IPO in the sector (23rd September 2016), and therefore offers an additional peer to the PSPs we cover. Its positioning in the entire payments chain, its exposure focused on Nordic countries and its status as a leader in the region make it a unique player. That said, the current share price already reflects the group's development in Sweden and growth in online services in its mix whereas these are simply set to offset the maturity reached in the group's key markets (which are small in size and already highly penetrated). While Nets is also the clear leader in Nordic countries, we consider that rival groups will end up entering the region, with European and/or global platforms in an increasingly global sector.
Valuation We estimate that the current valuation prices in all potential good news (Sweden, ramp-up of online in the mix and improvement in EBITDA margin) without fully assessing risks (key markets reaching maturity, likely loss of market share). The share was floated on e-commerce multiples whereas it is above all present in physical payments. The share is valued at 12.6x EV/EBITDA over 12 rolling months whereas it ought to be closer to 10.9x. Our FV of DKK105 stems from the average of two valuation methods.
Catalysts 1/ Gradual disappearance of cash and checks to the benefit of electronic payments, regulatory changes and innovation in the sector, 2/ development in Sweden, 3/ growth of online in the sales mix (e/m-commerce, and mobile payment), 4/ leverage to operating spending thanks to a size effect, and 5/ partnerships and/or acquisitions.
Difference from consensus We would draw investors' attention to the fact that the consensus does not take into account differences in accounting and reporting between the payments players (especially concerning sales and EBITDA). These differences are significant since they can lead to redundant margin comparisons or the application of irrelevant stock market multiples.
Risks 1/ Delays/loss of contracts, 2/ regulatory risks, 3/ currency risks, 4/ key countries reaching maturity, 5/ arrival of European/global groups in the Nordic region, 6/ arrival of breakthrough technologies in which Nets is not positioned.

Nets
5
2. Investment summary Nets is a Danish payment service provider (2,413 staff). It dates back to 1968, although the group has been known under its current name since 2010 (merger between Danish group PBS and Norwegian groups BBS and Teller). "Nets" stands for Northern European Transaction Services. The group wears its name particularly well since it is among the top physical PSPs in Europe in terms of both sales and transactions processed (no. 3 behind Worldline and First Data), solely thanks to its leadership position in the main Nordic countries (it processes 60% of cards and slightly more than 55% of transactions by card in the region). It is the leader in in-store and online payments in Denmark, Norway and Finland, and is no. 2 in-store in Sweden (behind Swedbank) but leader in the online segment.
Nets is present throughout the entire value chain of card transactions (transaction acquiring/processing, card issuing processing, clearing/settlement services, and even operates the main debit card schemes in Denmark and Norway). It has a strong position in account-to-account (A2A) payments in Denmark and Norway (credit transfers, direct debits etc.). Its client base is diversified via three business units (average contracts of two/five years, paid primarily via fees): 1) in Merchant Services, its customer base is above all made up of small and medium-sized local merchants, but it also covers major international groups that have activities in the Nordic region (it is generally paid a percentage of the transaction value), 2) in Financial & Network Services, its main clients are banks, including seven major accounts (fixed fee per transaction in the majority of cases) and 3) in Corporate Services, it handles local companies, governments and banks (fixed fee per transaction).
The group works with more than 300,000 merchants (including 10% via internet), more than 240 banks and more than 240,000 companies. In all, it has a unique positioning for a PSP (the only Nordic company to be present in the entire payments value chain) and very focused geographical coverage (a risk since it is dependent on the Nordic region, which has a very high penetration rate in absolute terms, far higher than the European average). While Nets has no direct peer, among the payments players in our coverage, we believe that Worldline is the most similar. They share a fairly identical business positioning and fundamentals (normal average sales growth of ~+5/6%, EBITDA margin of ~20%, and exposure focused on a handful of countries).
Note that Nets' fixed-cost base is far higher than other PSPs that we follow (67% vs. 50-60% for our sample). For this type of player, operating leverage is only set to materialise by growth in transaction volumes. We have set out below a few factors that could drive this: 1) the fundamental trend to favour electronic payments over cash and checks in the group's reference market (even if it is highly penetrated: 60-70% in the Nordic region vs. 40% in the rest of Europe), where growth in online is a component (via e-commerce and m-commerce, and to a lesser extent mobile payments), 2) the accumulation of roles with clients, enabling an increase in volumes and the amount of fees, 3) market share gains in countries already covered (which seems complicated given Nets' already-high market share), 4) the conquest of new Nordic countries (Sweden would be the largest source of leverage with ~40% of transactions in the region, with the market currently in the hands of local banks), 5) partnerships and/or acquisitions (given the net debt of Nets, we expect no significant M&A operation before 2018).
That said, we believe that the development of Nets in Sweden (<10% of sales) and the ramp-up of online in the group's mix (~10% of sales) will come at the same time as its key markets
Nets
6
reach maturity (Denmark, Norway, Finland: 90% of sales) and the arrival of European or global PSPs in a so-far protected Nordic market (an increasingly globalised sector).
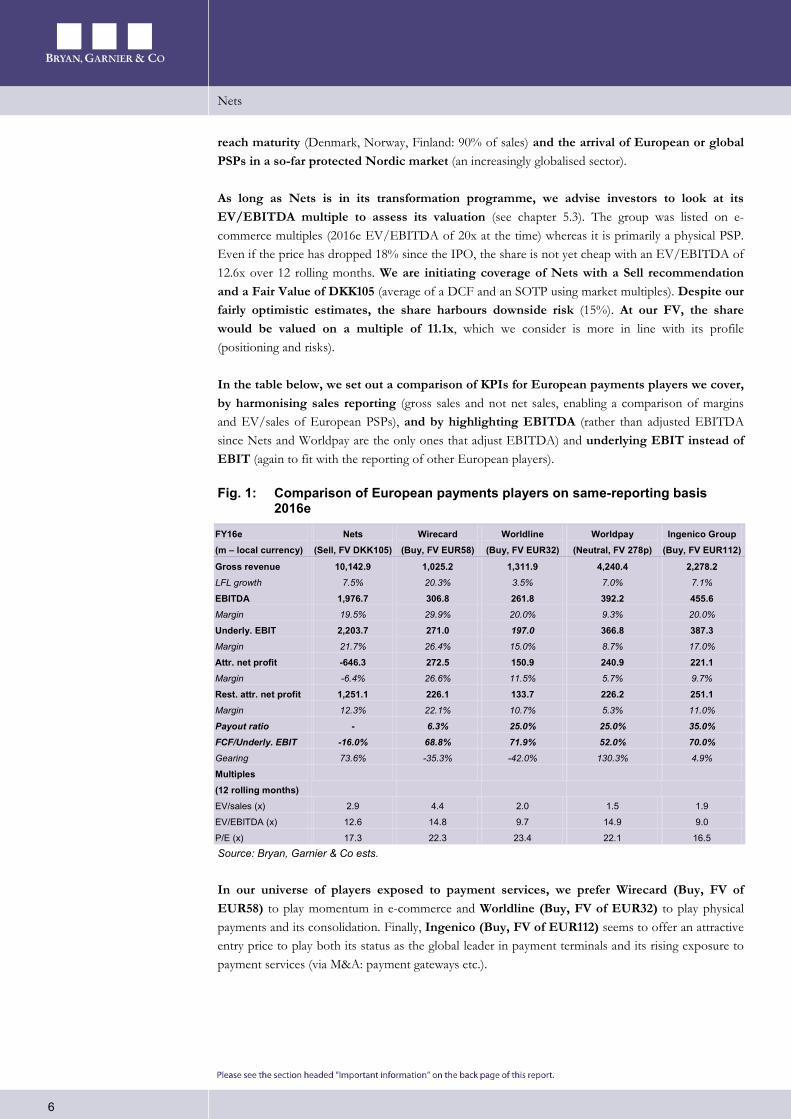
As long as Nets is in its transformation programme, we advise investors to look at its EV/EBITDA multiple to assess its valuation (see chapter 5.3). The group was listed on e-commerce multiples (2016e EV/EBITDA of 20x at the time) whereas it is primarily a physical PSP. Even if the price has dropped 18% since the IPO, the share is not yet cheap with an EV/EBITDA of 12.6x over 12 rolling months. We are initiating coverage of Nets with a Sell recommendation and a Fair Value of DKK105 (average of a DCF and an SOTP using market multiples). Despite our fairly optimistic estimates, the share harbours downside risk (15%). At our FV, the share would be valued on a multiple of 11.1x, which we consider is more in line with its profile (positioning and risks).
In the table below, we set out a comparison of KPIs for European payments players we cover, by harmonising sales reporting (gross sales and not net sales, enabling a comparison of margins and EV/sales of European PSPs), and by highlighting EBITDA (rather than adjusted EBITDA since Nets and Worldpay are the only ones that adjust EBITDA) and underlying EBIT instead of EBIT (again to fit with the reporting of other European players).
Fig. 1: Comparison of European payments players on same-reporting basis 2016e
FY16e (m – local currency)
Nets (Sell, FV DKK105)
Wirecard (Buy, FV EUR58)
Worldline (Buy, FV EUR32)
Worldpay (Neutral, FV 278p)
Ingenico Group (Buy, FV EUR112)
Gross revenue 10,142.9 1,025.2 1,311.9 4,240.4 2,278.2 LFL growth 7.5% 20.3% 3.5% 7.0% 7.1%
EBITDA 1,976.7 306.8 261.8 392.2 455.6 Margin 19.5% 29.9% 20.0% 9.3% 20.0%
Underly. EBIT 2,203.7 271.0 197.0 366.8 387.3 Margin 21.7% 26.4% 15.0% 8.7% 17.0%
Attr. net profit -646.3 272.5 150.9 240.9 221.1 Margin -6.4% 26.6% 11.5% 5.7% 9.7%
Rest. attr. net profit 1,251.1 226.1 133.7 226.2 251.1 Margin 12.3% 22.1% 10.7% 5.3% 11.0%
Payout ratio - 6.3% 25.0% 25.0% 35.0% FCF/Underly. EBIT -16.0% 68.8% 71.9% 52.0% 70.0% Gearing 73.6% -35.3% -42.0% 130.3% 4.9%
Multiples (12 rolling months)
EV/sales (x) 2.9 4.4 2.0 1.5 1.9
EV/EBITDA (x) 12.6 14.8 9.7 14.9 9.0
P/E (x) 17.3 22.3 23.4 22.1 16.5
Source: Bryan, Garnier & Co ests.
In our universe of players exposed to payment services, we prefer Wirecard (Buy, FV of EUR58) to play momentum in e-commerce and Worldline (Buy, FV of EUR32) to play physical payments and its consolidation. Finally, Ingenico (Buy, FV of EUR112) seems to offer an attractive entry price to play both its status as the global leader in payment terminals and its rising exposure to payment services (via M&A: payment gateways etc.).
Nets
7
3. Valuation Since its flotation on 23rd September, the share has dropped by 18% (-12% vs. the Nasdaq Copenhagen). We believe the share price still reflects a large share of potential catalysts (Sweden, growth in online) and does not fully assess risks inherent in the case (dependence on the Nordic region and highly likely arrival of rivals in the region given the globalisation of the sector), without taking into account the fact that we expect no upgrade to consensus EPS estimates in coming months. Finally, since the company has just been listed, it is still difficult to judge its management since it does not yet have a track record in terms of financial communication and the delivery of targets.
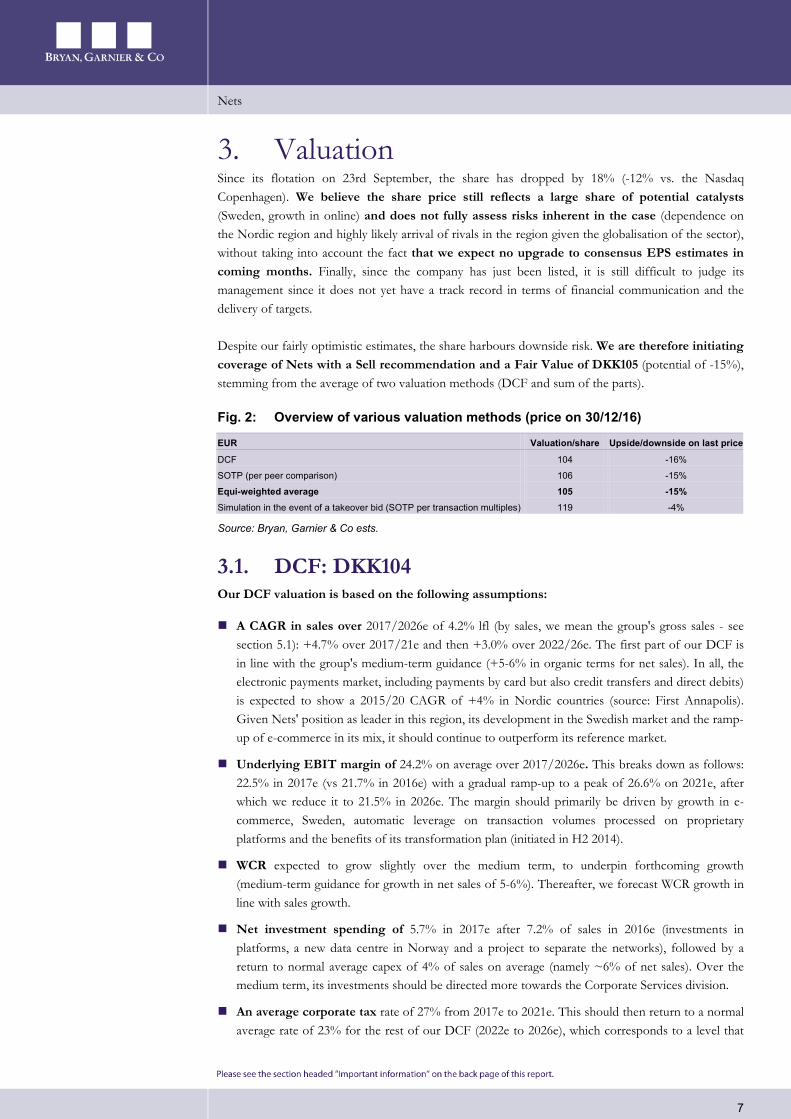
Despite our fairly optimistic estimates, the share harbours downside risk. We are therefore initiating coverage of Nets with a Sell recommendation and a Fair Value of DKK105 (potential of -15%), stemming from the average of two valuation methods (DCF and sum of the parts).
Fig. 2: Overview of various valuation methods (price on 30/12/16)
EUR Valuation/share Upside/downside on last price
DCF 104 -16%
SOTP (per peer comparison) 106 -15%
Equi-weighted average 105 -15% Simulation in the event of a takeover bid (SOTP per transaction multiples) 119 -4%
Source: Bryan, Garnier & Co ests.
3.1. DCF: DKK104 Our DCF valuation is based on the following assumptions:
A CAGR in sales over 2017/2026e of 4.2% lfl (by sales, we mean the group's gross sales - see section 5.1): +4.7% over 2017/21e and then +3.0% over 2022/26e. The first part of our DCF is in line with the group's medium-term guidance (+5-6% in organic terms for net sales). In all, the electronic payments market, including payments by card but also credit transfers and direct debits) is expected to show a 2015/20 CAGR of +4% in Nordic countries (source: First Annapolis). Given Nets' position as leader in this region, its development in the Swedish market and the ramp-up of e-commerce in its mix, it should continue to outperform its reference market.
Underlying EBIT margin of 24.2% on average over 2017/2026e. This breaks down as follows: 22.5% in 2017e (vs 21.7% in 2016e) with a gradual ramp-up to a peak of 26.6% on 2021e, after which we reduce it to 21.5% in 2026e. The margin should primarily be driven by growth in e-commerce, Sweden, automatic leverage on transaction volumes processed on proprietary platforms and the benefits of its transformation plan (initiated in H2 2014).
WCR expected to grow slightly over the medium term, to underpin forthcoming growth (medium-term guidance for growth in net sales of 5-6%). Thereafter, we forecast WCR growth in line with sales growth.
Net investment spending of 5.7% in 2017e after 7.2% of sales in 2016e (investments in platforms, a new data centre in Norway and a project to separate the networks), followed by a return to normal average capex of 4% of sales on average (namely ~6% of net sales). Over the medium term, its investments should be directed more towards the Corporate Services division.
An average corporate tax rate of 27% from 2017e to 2021e. This should then return to a normal average rate of 23% for the rest of our DCF (2022e to 2026e), which corresponds to a level that

Nets
8
we consider as normative, namely close to the corporate tax rate of 22% in Denmark (which is by far the group's leading country since it represents almost half of its sales).
A discount rate of 9.15%, with a beta of 1.3x (we use 1.00x for Ingenico, Worldline and Worldpay, and 1.13x for Wirecard), a risk-premium of 7.00% and a risk-free rate of 1.60%.
A growth rate to infinity of 2.5% vs 3% for other PSPs we cover. The payments market is growing steadily, with a recurrence of certain services based on a fixed fee per transaction (especially its Financial & Network Services and Corporate Services divisions), although penetration is already high in the Nordic market.
Fig. 3: Calculation of discount rate Inputs %
Risk free rate 1.60
Market risk premium 7.00
ß (x) 1.30
Return on capital 10.70
Cost of debt after tax 3.85
Market cap (DKKm) 22,771
Net debt 2015e (mDKK) 7,217
WACC 9.15 Source: Bryan, Garnier & Co ests.
Fig. 4: Discounted cash-flow model DKKm 2017e 2018e 2019e 2020e 2021e 2022e 2023e 2024e 2025e 2026e
Revenue (gross revenue) 10,853 11,450 12,057 12,659 13,229 13,626 14,035 14,456 14,890 15,336
Y/Y change 7.0% 5.5% 5.3% 5.0% 4.5% 3.0% 3.0% 3.0% 3.0% 3.0% Net revenue 7,766 8,193 8,627 9,059 9,448 9,732 10,024 10,324 10,634 10,953 Y/Y change 6.2% 5.5% 5.3% 5.0% 4.3% 3.0% 3.0% 3.0% 3.0% 3.0% Underlying EBIT 2,436.9 2,724.3 3,025.0 3,340.8 3,520.3 3,474.6 3,438.5 3,397.1 3,350.1 3,297.3 Margin 22.5% 23.8% 25.1% 26.4% 26.6% 25.5% 24.5% 23.5% 22.5% 21.5% EBIT 1,591.9 2,002.3 2,339.0 2,664.8 2,844.3 3,474.6 3,438.5 3,397.1 3,350.1 3,297.3 Margin 14.7% 17.5% 19.4% 21.1% 21.5% 25.5% 24.5% 23.5% 22.5% 21.5% Tax rate 29.0% 28.0% 27.0% 26.0% 25.0% 23.0% 23.0% 23.0% 23.0% 23.0% EBIT after tax 1,130.2 1,441.7 1,707.5 1,972.0 2,133.2 2,675.5 2,647.7 2,615.8 2,579.6 2,538.9
+ Depreciation & amortisation 1085.3 1030.5 964.5 886.2 661.5 545.0 561.4 578.2 595.6 613.4 Cash flow from operations 2,215.5 2,472.2 2,672.0 2,858.1 2,794.7 3,220.5 3,209.1 3,194.0 3,175.2 3,152.4
- Net financial & tangible investments -618.6 -595.4 -602.8 -633.0 -661.5 -545.0 -561.4 -578.2 -595.6 -613.4 - Change in WCR -56.0 -73.0 -98.0 -123.0 -148.0 -152.4 -157.0 -161.7 -166.6 -171.6
Free cash flow 1,540.9 1,803.8 1,971.2 2,102.2 1,985.2 2,523.0 2,490.7 2,454.1 2,413.0 2,367.3 Discounted free cash flows 1,411.7 1,513.9 1,515.6 1,480.8 1,281.1 1,491.7 1,349.0 1,217.7 1,097.0 985.9 Sum of discounted FCF 13,344.5 + Discounted terminal value 15,186.4 - Net debt 2016e 7,217.3
- Minority interests, 2016e 671.0 + Financial fixed assets 2016e 227.0
Valuation 20,869.6 Number of shares fully diluted (m) 200.4 Value per share (DKK) 104.1 Source: Bryan, Garnier & Co ests.
Nets
9
Fig. 5: Sensitivity of discount rate and growth rate to infinity DKK WACC
Growth rate to infinity 8.15% 8.65% 9.15% 9.65% 10.15%
1.50% 113.9 103.0 93.6 85.3 78.0
2.00% 121.0 108.9 98.5 89.4 81.5
2.50% 129.4 115.7 104.1 94.1 85.4
3.00% 139.4 123.8 110.7 99.5 90.0
3.50% 151.6 133.4 118.4 105.8 95.1
Source: Bryan, Garnier & Co ests.
By DCF, we value the share at DKK104 per share (potential of -16%).
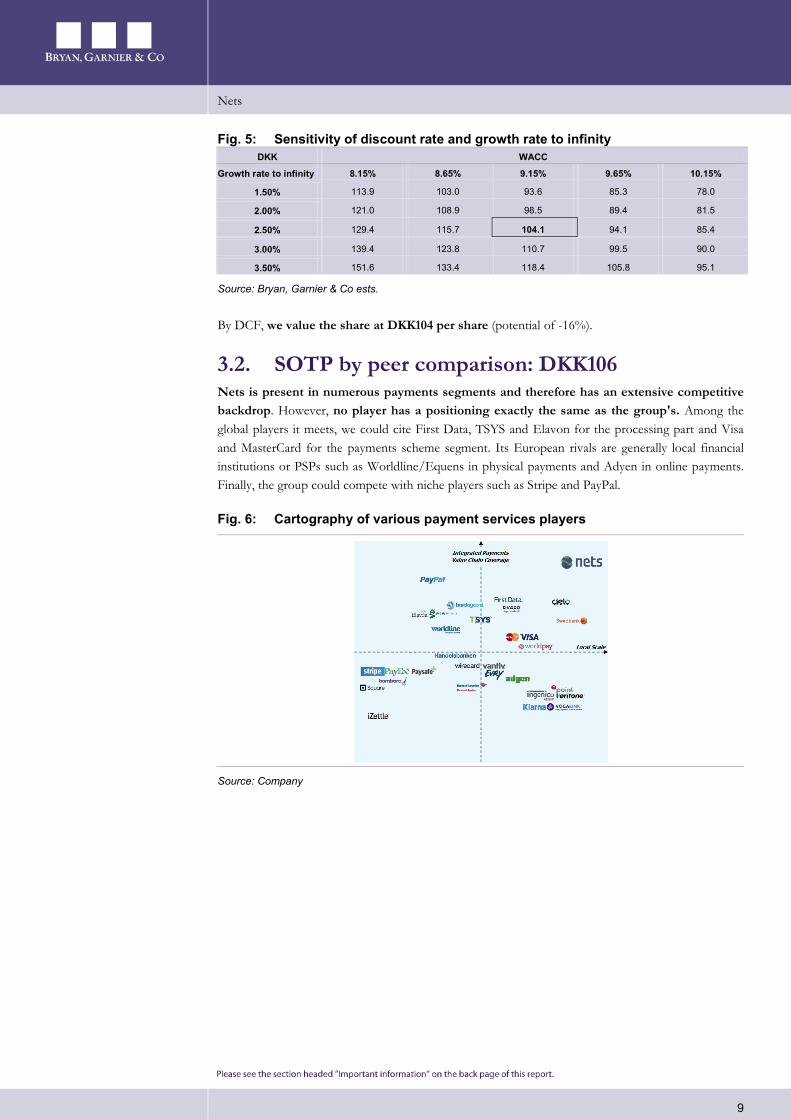
3.2. SOTP by peer comparison: DKK106 Nets is present in numerous payments segments and therefore has an extensive competitive backdrop. However, no player has a positioning exactly the same as the group's. Among the global players it meets, we could cite First Data, TSYS and Elavon for the processing part and Visa and MasterCard for the payments scheme segment. Its European rivals are generally local financial institutions or PSPs such as Worldline/Equens in physical payments and Adyen in online payments. Finally, the group could compete with niche players such as Stripe and PayPal.
Fig. 6: Cartography of various payment services players
Source: Company
Nets
10
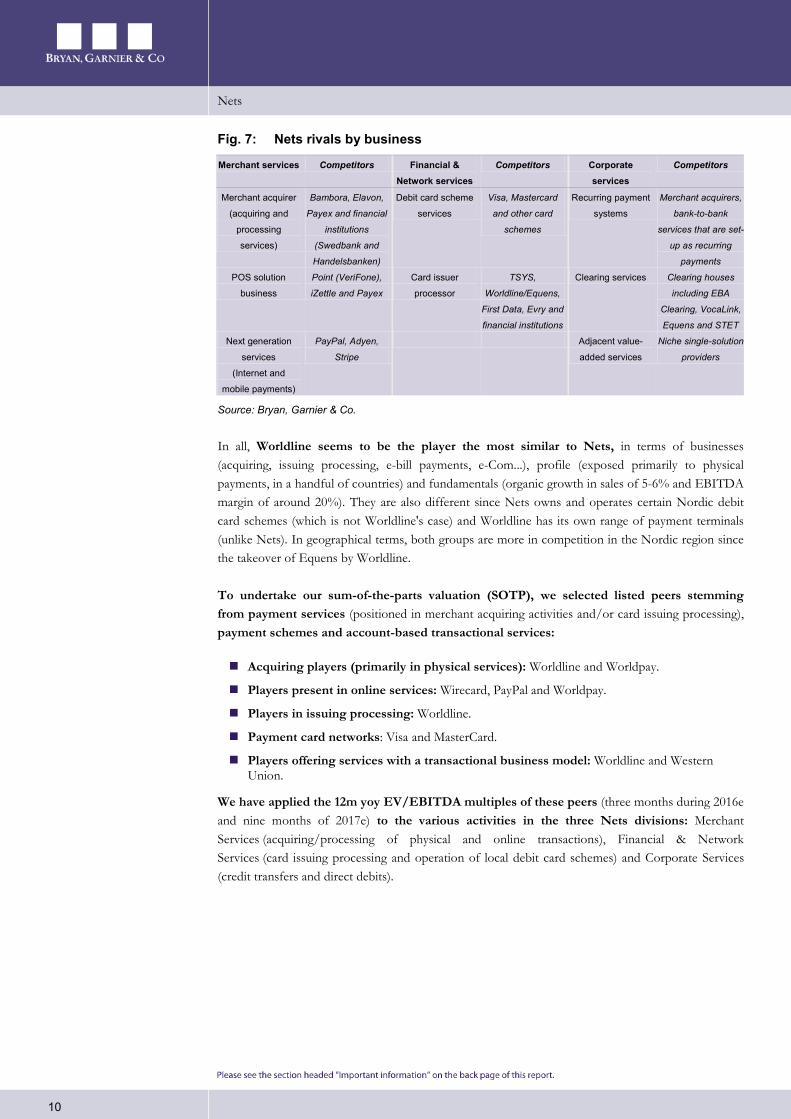
Fig. 7: Nets rivals by business
Merchant services Competitors Financial & Network services
Competitors Corporate services
Competitors
Merchant acquirer
(acquiring and
processing
services)
Bambora, Elavon,
Payex and financial
institutions
(Swedbank and
Handelsbanken)
Debit card scheme
services
Visa, Mastercard
and other card
schemes
Recurring payment
systems
Merchant acquirers,
bank-to-bank
services that are set-
up as recurring
payments
POS solution
business
Point (VeriFone),
iZettle and Payex
Card issuer
processor
TSYS,
Worldline/Equens,
First Data, Evry and
financial institutions
Clearing services Clearing houses
including EBA
Clearing, VocaLink,
Equens and STET
Next generation
services
(Internet and
mobile payments)
PayPal, Adyen,
Stripe
Adjacent value-
added services
Niche single-solution
providers
Source: Bryan, Garnier & Co.
In all, Worldline seems to be the player the most similar to Nets, in terms of businesses (acquiring, issuing processing, e-bill payments, e-Com...), profile (exposed primarily to physical payments, in a handful of countries) and fundamentals (organic growth in sales of 5-6% and EBITDA margin of around 20%). They are also different since Nets owns and operates certain Nordic debit card schemes (which is not Worldline's case) and Worldline has its own range of payment terminals (unlike Nets). In geographical terms, both groups are more in competition in the Nordic region since the takeover of Equens by Worldline.
To undertake our sum-of-the-parts valuation (SOTP), we selected listed peers stemming from payment services (positioned in merchant acquiring activities and/or card issuing processing), payment schemes and account-based transactional services:
Acquiring players (primarily in physical services): Worldline and Worldpay.
Players present in online services: Wirecard, PayPal and Worldpay.
Players in issuing processing: Worldline.
Payment card networks: Visa and MasterCard.
Players offering services with a transactional business model: Worldline and Western Union.
We have applied the 12m yoy EV/EBITDA multiples of these peers (three months during 2016e and nine months of 2017e) to the various activities in the three Nets divisions: Merchant Services (acquiring/processing of physical and online transactions), Financial & Network Services (card issuing processing and operation of local debit card schemes) and Corporate Services (credit transfers and direct debits).
Nets
11
Fig. 8: SOTP by peer comparison DKKm Over 12 rolling months
Nets’ EBITDA 2,502.1 EV/EBITDA for Physical Acquiring (13% of Nets’ EBITDA) 11.0
EV/EBITDA for Online (12% of Nets’ EBITDA) 13.1
EV/EBITDA for Issuing Processing (21% of Nets’ EBITDA) 9.7
EV/EBITDA for schemes (15% of Nets’ EBITDA) 14.1
EV/EBITDA for Corporate Services (39% of Nets’ EBITDA) 9.7
Weighted average (100%) 10.9 EV 27,375.8 - Net debt -6,228.7
Valuation 21,147.1 Number of shares fully diluted (m) 200.4
Per share (DKK) 105.5 Source: Bryan, Garnier & Co est. Our SOTP valuation using peer comparison points to an EV/EBITDA multiple of 11.2x for Nets over 12 rolling months, namely DKK106 per share (potential of -15%).
3.3. Simulation in the event of a takeover: DKK119 In our view, on paper, the types of group that could be interested in a technological company providing payment services like Nets are:
Direct rivals or banks aiming to extend/strengthen their geographical coverage with a strong position in Nordic countries.
Schemes or card issuers aiming to have strong positions in Nordic countries and round out/extend their range of businesses in payments.
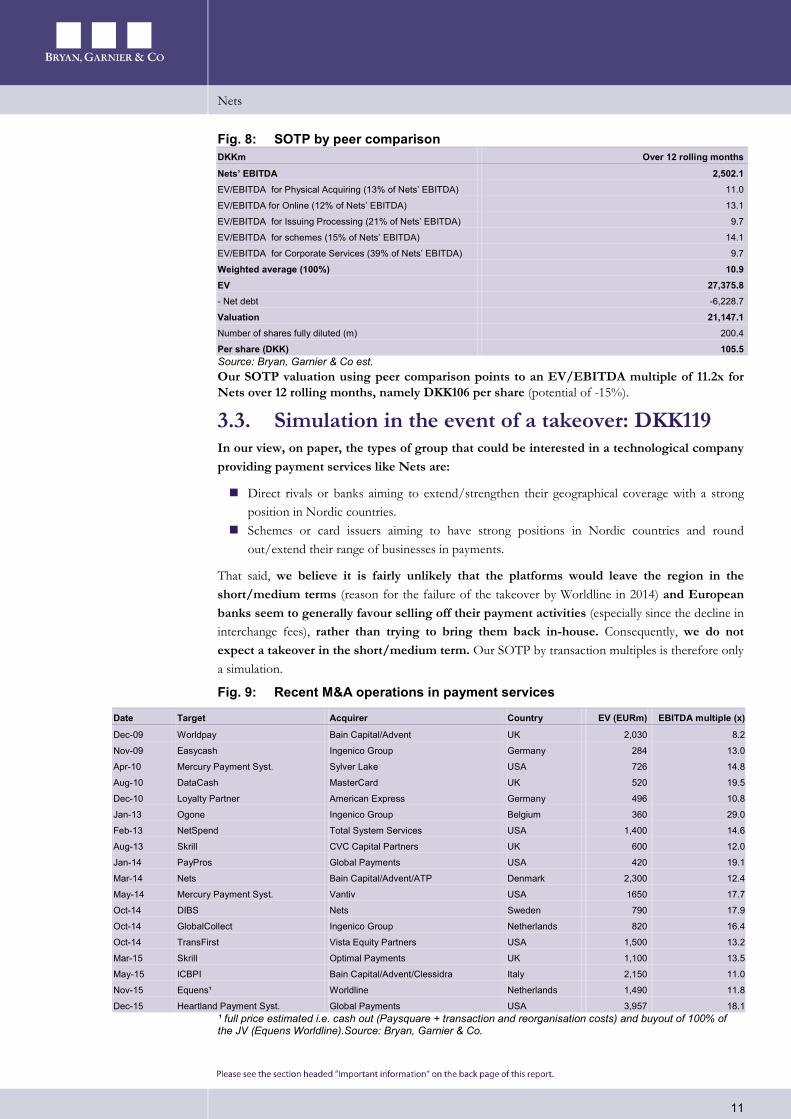
That said, we believe it is fairly unlikely that the platforms would leave the region in the short/medium terms (reason for the failure of the takeover by Worldline in 2014) and European banks seem to generally favour selling off their payment activities (especially since the decline in interchange fees), rather than trying to bring them back in-house. Consequently, we do not expect a takeover in the short/medium term. Our SOTP by transaction multiples is therefore only a simulation.
Fig. 9: Recent M&A operations in payment services
Date Target Acquirer Country EV (EURm) EBITDA multiple (x)
Dec-09 Worldpay Bain Capital/Advent UK 2,030 8.2
Nov-09 Easycash Ingenico Group Germany 284 13.0
Apr-10 Mercury Payment Syst. Sylver Lake USA 726 14.8
Aug-10 DataCash MasterCard UK 520 19.5
Dec-10 Loyalty Partner American Express Germany 496 10.8
Jan-13 Ogone Ingenico Group Belgium 360 29.0
Feb-13 NetSpend Total System Services USA 1,400 14.6
Aug-13 Skrill CVC Capital Partners UK 600 12.0
Jan-14 PayPros Global Payments USA 420 19.1
Mar-14 Nets Bain Capital/Advent/ATP Denmark 2,300 12.4
May-14 Mercury Payment Syst. Vantiv USA 1650 17.7
Oct-14 DIBS Nets Sweden 790 17.9
Oct-14 GlobalCollect Ingenico Group Netherlands 820 16.4
Oct-14 TransFirst Vista Equity Partners USA 1,500 13.2
Mar-15 Skrill Optimal Payments UK 1,100 13.5
May-15 ICBPI Bain Capital/Advent/Clessidra Italy 2,150 11.0
Nov-15 Equens¹ Worldline Netherlands 1,490 11.8
Dec-15 Heartland Payment Syst. Global Payments USA 3,957 18.1 ¹ full price estimated i.e. cash out (Paysquare + transaction and reorganisation costs) and buyout of 100% of the JV (Equens Worldline).Source: Bryan, Garnier & Co.
Nets
12
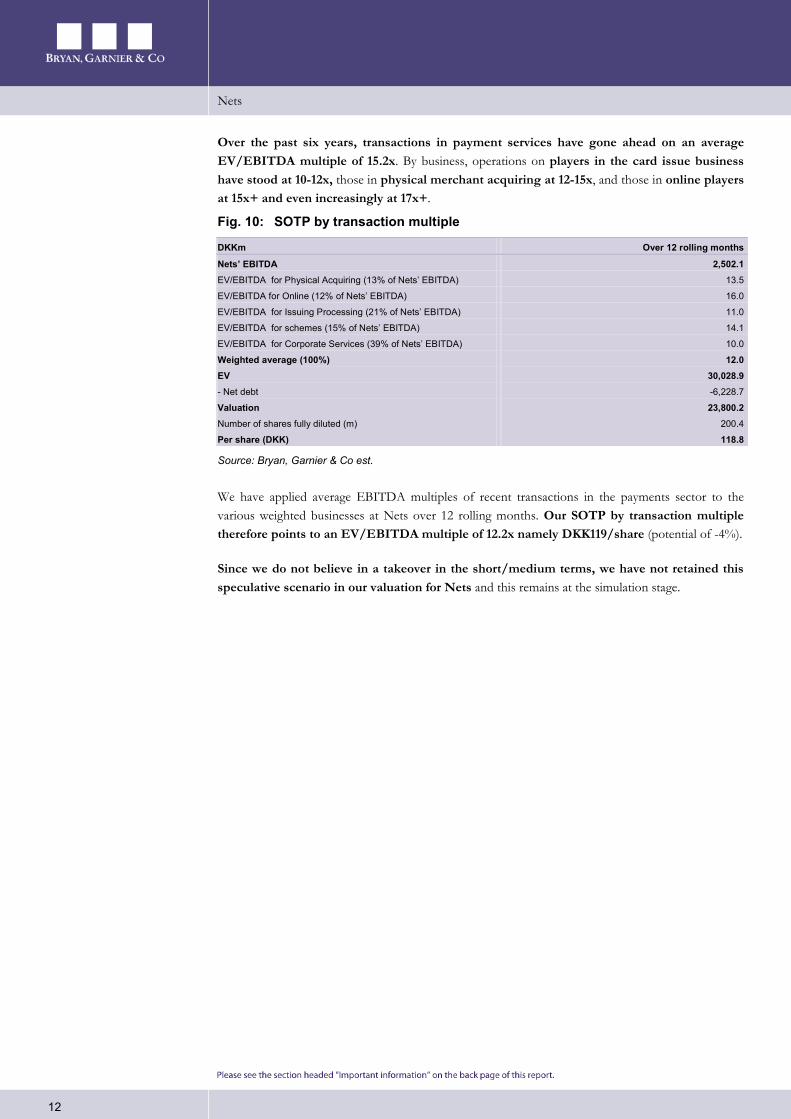
Over the past six years, transactions in payment services have gone ahead on an average EV/EBITDA multiple of 15.2x. By business, operations on players in the card issue business have stood at 10-12x, those in physical merchant acquiring at 12-15x, and those in online players at 15x+ and even increasingly at 17x+.
Fig. 10: SOTP by transaction multiple
DKKm Over 12 rolling months
Nets’ EBITDA 2,502.1 EV/EBITDA for Physical Acquiring (13% of Nets’ EBITDA) 13.5
EV/EBITDA for Online (12% of Nets’ EBITDA) 16.0
EV/EBITDA for Issuing Processing (21% of Nets’ EBITDA) 11.0
EV/EBITDA for schemes (15% of Nets’ EBITDA) 14.1
EV/EBITDA for Corporate Services (39% of Nets’ EBITDA) 10.0
Weighted average (100%) 12.0 EV 30,028.9 - Net debt -6,228.7
Valuation 23,800.2 Number of shares fully diluted (m) 200.4
Per share (DKK) 118.8
Source: Bryan, Garnier & Co est.
We have applied average EBITDA multiples of recent transactions in the payments sector to the various weighted businesses at Nets over 12 rolling months. Our SOTP by transaction multiple therefore points to an EV/EBITDA multiple of 12.2x namely DKK119/share (potential of -4%).
Since we do not believe in a takeover in the short/medium terms, we have not retained this speculative scenario in our valuation for Nets and this remains at the simulation stage.

Nets
13
4. Nets: An unusual player 4.1. From Nordic banks to Nets today The origin of Nets dates back to 1968. The group was created out of the merger of Nordic banks, which played a major role in the region's payments history. Indeed, these banks were among the first to develop and invest in electronic payment services, namely PBS in Denmark (created in 1968) and BBS in Norway (created in 1972). In the decades that followed their creation, they developed products and services that became standards in the region (e.g. the Betalingsservice recurring payments system in Denmark and AvtaleGiro in Norway, electronic billing services, clearing and settlement solutions, debit and credit cards both domestic and international). Local debit card schemes were then launched, namely Dankort in Denmark in 1983 by PBS and its Norwegian equivalent BankAxept in 1991 (owned by Norwegian banks). The group has been known under its current name Nets (Northern European Transaction Services) since 2010, the year during which Danish group PBS merged with Nordito (financial holding company operating via its Norwegian subsidiaries BBS and Teller). In 2012, Nets significantly strengthened its positions in the region with the acquisition of Luottokunta (now Nets Oy), which was the first major acquirer in Finland and which genuinely hoisted the group into the big league.
In 2014, French group Atos took a close look at Nets for its subsidiary Worldline (offering around EUR2bn on our information), although the 186 Danish and Norwegian banks owning the majority of the capital (Nets was owned by its clients including Nordea Bank AB, DNB Bank ASA, Danske Bank A/S and the Danish central bank) did not want its platforms to leave the region. In all, three potential suitors were rapidly ruled out (Atos, Permira/Canada Pension Plan and Nordic Capital) and the second round initially planned finally did not take place given that the choice was essentially political. As such, a consortium made up of private equity funds Bain Capital and Advent International and the Danish pension fund ATP Private Equity Partners got its hands on Nets for DKK17bn in July 2014 (~EUR2.3bn) or EV/EBITDA of 12.4x.
Fig. 11: In 2012, Nets was primarily owned by Nordic banks
Financial institution Nationality % of the capital
Nordea Bank Danmark Denmark 20%
DNB Bank ASA Norway 18%
Danske Bank Denmark 17%
Danmarks Nationalbank Denmark 10%
Total 65%
Source: Bryan, Garnier & Co.
Since its acquisition by the funds, the group has spent DKK3.9bn on a transformation programme initiated in September 2014 (DKK800m in investments for modernisation, IT systems etc.) also including a round of acquisitions (DKK3.1bn for seven acquisitions, including earn-out clauses). The group acquired three companies in 2014: Payzone (aimed at strengthening its installed base of payments acceptance in Sweden and to improve its payment acceptance capacity in the hotel and catering sectors), DIBS Payment Services (destined to improve and diversify its services in e-commerce and increase its online presence in Nordic countries) and Paytrail Oyj (which helped increase its e-commerce business in Finland and round-out its services for merchants). Then in December 2015, the group bought Nordea Bank's merchant acquiring business in Nordic

Nets
14
and Baltic countries (Kortaccept), enabling it to step up the volume of sales of its merchant services in the Nordic region in general and especially in Sweden (new base of consumers and new network of references). Finally, in January 2016, Nets acquired the majority of the capital in Storebox (a company offering merchants the possibility of receiving electronic payments and loyalty programmes). Finally, for its Corporate Services activity, Nets acquired majority stakes in EDIGard in 2014 and Signaturgruppen in 2015 (destined to provide it services and additional capacity).
Fig. 12: Overview of special items associated with the transformation plan underway
Special items Development over time (until H1 2016)
Reorganisation and restructuring costs Cost mainly reflecting employee termination costs in relation to establishing a
customer centric sales organisation and retention teams and optimising group
functions.
Transformation programme Costs related to optimisation of business, e.g.: commercialisation of Merchant
Services, transformation of procurement function and processes, improving
efficiency in Technology and Operations, transformation of stability and security.
Other costs and income Costs in 2014 were mainly related to transaction costs.
Total Special items should be considered as income / costs not attributed directly to
ordinary activities.
Separately disclosed to allow a more comparable view of underlying trending
performance.
Sources: Company; Bryan, Garnier & Co.
Fig. 13: Seven latest acquisitions made by Nets
Sources: Company; Bryan, Garnier & Co.
After the successful flotation of Worldplay on the LSE on 15th October 2015 at 240p per share, the same funds that own the group, Bain and Advent, decided to list Nets. The IPO went ahead on the Nasdaq Copenhagen on 23rd September 2016 at DKK150 (the range was tightened upwards from DKK130-160 to DKK145-160). Note that it came two and a half years after its takeover by the
Nets
15
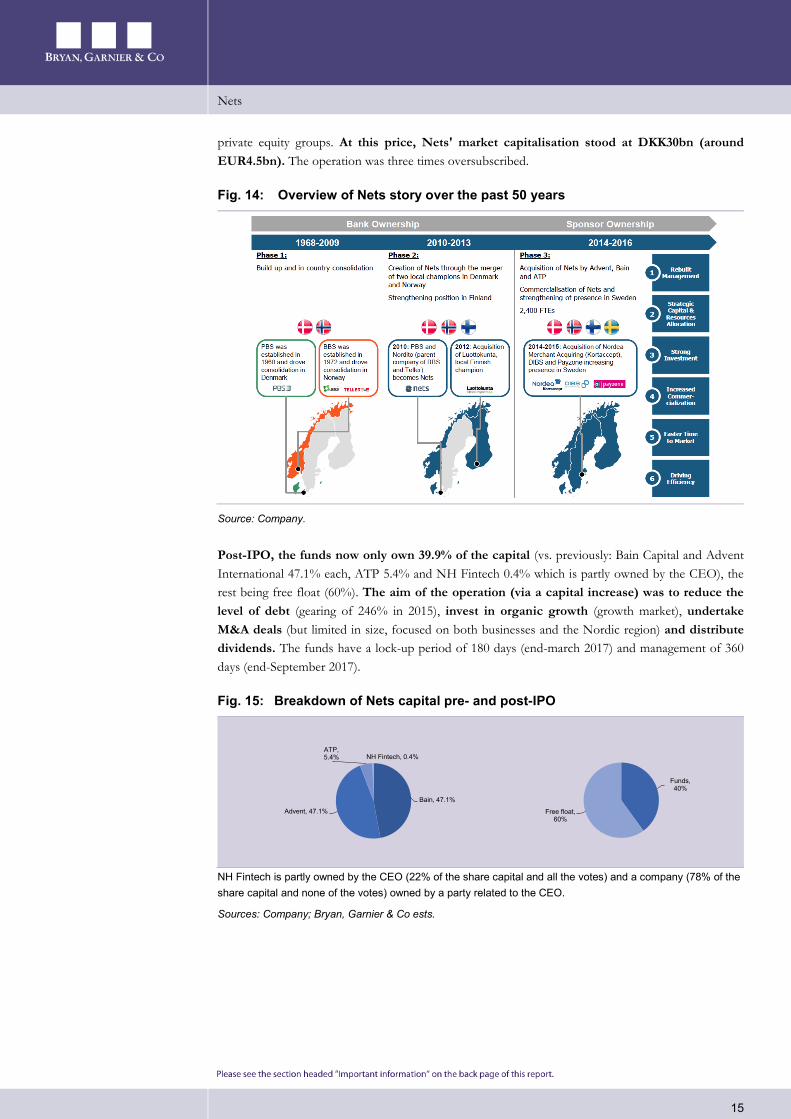
private equity groups. At this price, Nets' market capitalisation stood at DKK30bn (around EUR4.5bn). The operation was three times oversubscribed.
Fig. 14: Overview of Nets story over the past 50 years
Source: Company.
Post-IPO, the funds now only own 39.9% of the capital (vs. previously: Bain Capital and Advent International 47.1% each, ATP 5.4% and NH Fintech 0.4% which is partly owned by the CEO), the rest being free float (60%). The aim of the operation (via a capital increase) was to reduce the level of debt (gearing of 246% in 2015), invest in organic growth (growth market), undertake M&A deals (but limited in size, focused on both businesses and the Nordic region) and distribute dividends. The funds have a lock-up period of 180 days (end-march 2017) and management of 360 days (end-September 2017).
Fig. 15: Breakdown of Nets capital pre- and post-IPO
NH Fintech is partly owned by the CEO (22% of the share capital and all the votes) and a company (78% of the share capital and none of the votes) owned by a party related to the CEO.
Sources: Company; Bryan, Garnier & Co ests.
Bain, 47.1%
Advent, 47.1%
ATP, 5.4% NH Fintech, 0.4%
Funds, 40%
Free float, 60%

Nets
16
4.2. Understanding Nets' businesses Nets is a FinTech, namely a software company that operates in the field of payments (supplier of technologies and solutions). Given its history, the group focuses on Nordic countries where it has a clear leadership position (Denmark, Norway and Finland) with genuine potential in Sweden (no. 2 behind Swedbank, but no. 1 in online) and a small presence in Baltic countries. The group provides a very comprehensive range of payment services (in the entire payments value chain with integrated solutions), covering both the card payment segment, but also account-to-account payments (credit transfers and direct debits). Finally, it also offers real-time clearing and digital identification services. Most its sales are based on contracts of two/five-years on average with remuneration via fees.
The businesses have been organised into three main divisions, spread evenly between:
Merchant services (39% of 2015 sales 25% of underlying EBITDA): Nets supplies acceptance and payment processing solutions whether in stores, online or on mobile devices for merchants in the Nordic region (more than 300,000 including 30,000 online, ranging from micro-merchants to large retailers) stemming from different networks (local schemes Dankort and BankAxept, and international schemes Visa, MasterCard, American Express and China Union Pay). It has acquired DKK306bn in card transactions (constant currency). It also offers sales/rental of payment terminals that it buys exclusively from Ingenico (for the past 10 or so years) and value-added services. In this segment, Nets uses either its own salesforce for large retailers, or intermediaries such as banks or resellers for small/medium sized merchants. Note that small merchants account for two-thirds of its net sales (standardised solutions for multiple usage and with additional modules) and large merchants account for the remaining third (tailor-made solutions, omni-channel, with value-added services, loyalty programmes etc.). This division primarily covers Nordic countries but also Baltic countries. Nets is the leader in the Nordic region in acquiring and card transaction processing (no. 1 for stores and online in Denmark, Norway and Finland, no. 2 in stores and no. 1 in online in Sweden). It even boasts the 10th largest client base in Europe and is the no. 13 acquirer in the world, according to the latest Nilson Report.
Fig. 16: Nets is the leader in merchant services in Nordic countries
Source: Company.
Nets
17
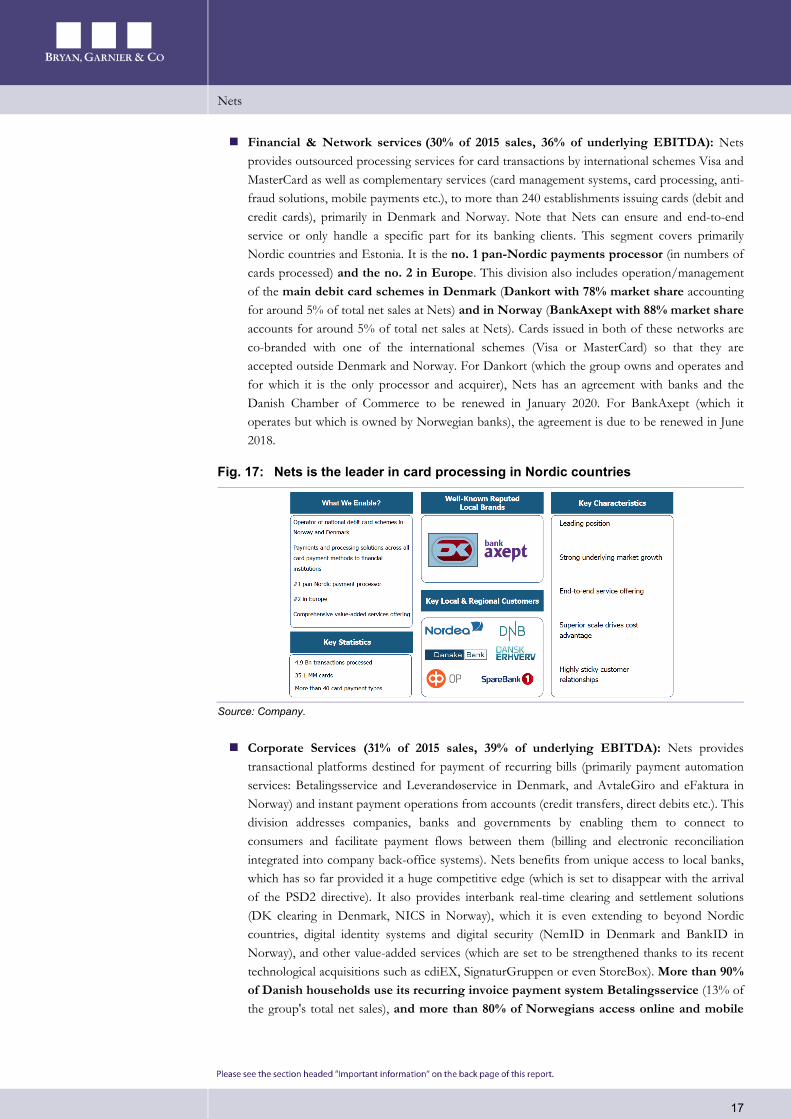
Financial & Network services (30% of 2015 sales, 36% of underlying EBITDA): Nets provides outsourced processing services for card transactions by international schemes Visa and MasterCard as well as complementary services (card management systems, card processing, anti-fraud solutions, mobile payments etc.), to more than 240 establishments issuing cards (debit and credit cards), primarily in Denmark and Norway. Note that Nets can ensure and end-to-end service or only handle a specific part for its banking clients. This segment covers primarily Nordic countries and Estonia. It is the no. 1 pan-Nordic payments processor (in numbers of cards processed) and the no. 2 in Europe. This division also includes operation/management of the main debit card schemes in Denmark (Dankort with 78% market share accounting for around 5% of total net sales at Nets) and in Norway (BankAxept with 88% market share accounts for around 5% of total net sales at Nets). Cards issued in both of these networks are co-branded with one of the international schemes (Visa or MasterCard) so that they are accepted outside Denmark and Norway. For Dankort (which the group owns and operates and for which it is the only processor and acquirer), Nets has an agreement with banks and the Danish Chamber of Commerce to be renewed in January 2020. For BankAxept (which it operates but which is owned by Norwegian banks), the agreement is due to be renewed in June 2018.
Fig. 17: Nets is the leader in card processing in Nordic countries
Source: Company.
Corporate Services (31% of 2015 sales, 39% of underlying EBITDA): Nets provides transactional platforms destined for payment of recurring bills (primarily payment automation services: Betalingsservice and Leverandøservice in Denmark, and AvtaleGiro and eFaktura in Norway) and instant payment operations from accounts (credit transfers, direct debits etc.). This division addresses companies, banks and governments by enabling them to connect to consumers and facilitate payment flows between them (billing and electronic reconciliation integrated into company back-office systems). Nets benefits from unique access to local banks, which has so far provided it a huge competitive edge (which is set to disappear with the arrival of the PSD2 directive). It also provides interbank real-time clearing and settlement solutions (DK clearing in Denmark, NICS in Norway), which it is even extending to beyond Nordic countries, digital identity systems and digital security (NemID in Denmark and BankID in Norway), and other value-added services (which are set to be strengthened thanks to its recent technological acquisitions such as ediEX, SignaturGruppen or even StoreBox). More than 90% of Danish households use its recurring invoice payment system Betalingsservice (13% of the group's total net sales), and more than 80% of Norwegians access online and mobile
Nets
18
banking services using its BankID platform. Finally, the group is the only provider of bank clearing services in Norway and Denmark.
Fig. 18: Ecosystem leader in e-billing payments and digital solutions
Source: Company.
Whether in card or bank account payments, Nets is present in the entire value chain: payment capture, validity (via authentication), and authorisation through to processing, clearing and settlement. In recent years, the group has improved its products and services in order to accompany changes in commerce in the region, with an accent placed on security, reliability, stability of its infrastructure, including real-time clearing instruments, fraud prevention tools, e-commerce offers, compatibility with contactless payments and mobile solutions.
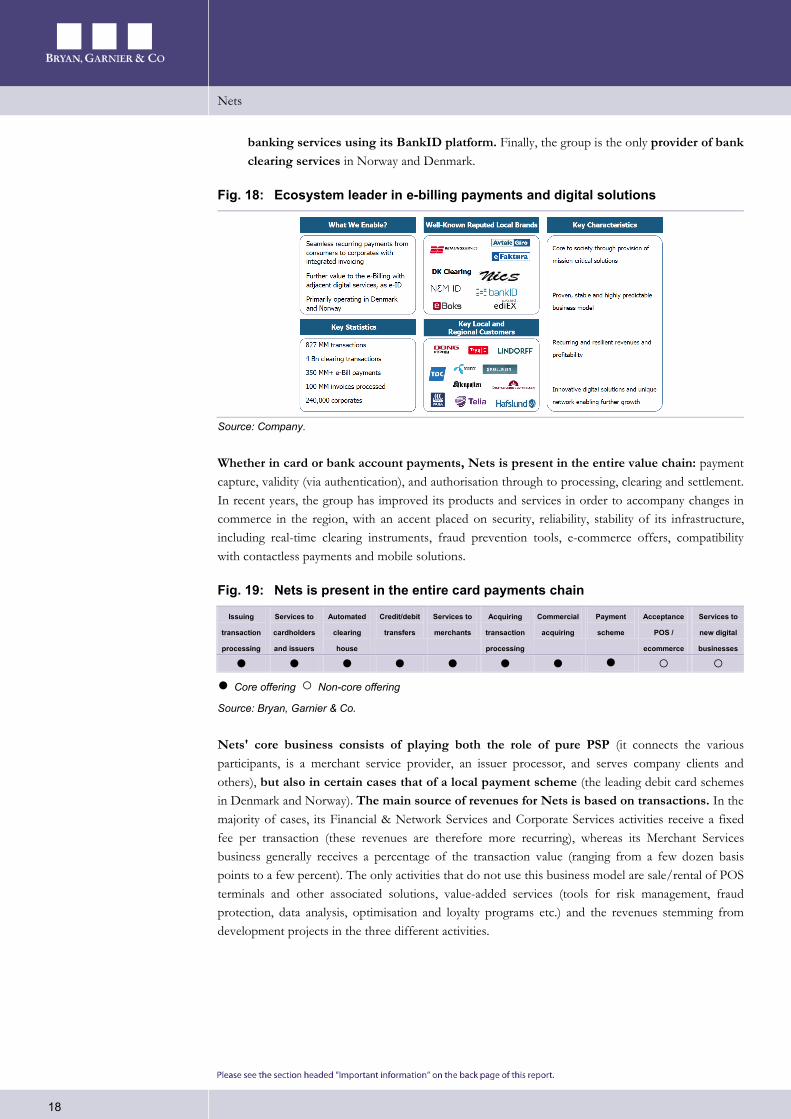
Fig. 19: Nets is present in the entire card payments chain
Issuing
transaction
processing
Services to
cardholders
and issuers
Automated
clearing
house
Credit/debit
transfers
Services to
merchants
Acquiring
transaction
processing
Commercial
acquiring
Payment
scheme
Acceptance
POS /
ecommerce
Services to
new digital
businesses
● ● ● ● ● ● ● ● ○ ○ ● Core offering ○ Non-core offering Source: Bryan, Garnier & Co.
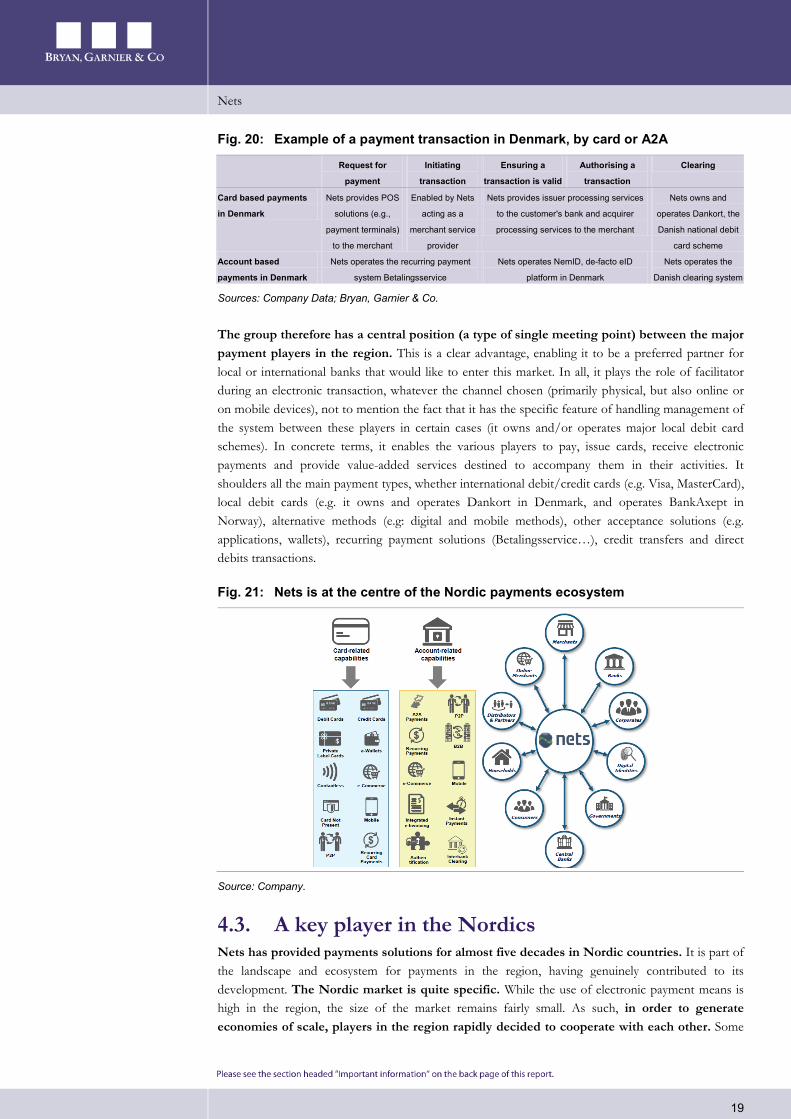
Nets' core business consists of playing both the role of pure PSP (it connects the various participants, is a merchant service provider, an issuer processor, and serves company clients and others), but also in certain cases that of a local payment scheme (the leading debit card schemes in Denmark and Norway). The main source of revenues for Nets is based on transactions. In the majority of cases, its Financial & Network Services and Corporate Services activities receive a fixed fee per transaction (these revenues are therefore more recurring), whereas its Merchant Services business generally receives a percentage of the transaction value (ranging from a few dozen basis points to a few percent). The only activities that do not use this business model are sale/rental of POS terminals and other associated solutions, value-added services (tools for risk management, fraud protection, data analysis, optimisation and loyalty programs etc.) and the revenues stemming from development projects in the three different activities.
Nets
19
Fig. 20: Example of a payment transaction in Denmark, by card or A2A
Request for
payment
Initiating
transaction
Ensuring a
transaction is valid
Authorising a
transaction
Clearing
Card based payments
in Denmark
Nets provides POS
solutions (e.g.,
payment terminals)
to the merchant
Enabled by Nets
acting as a
merchant service
provider
Nets provides issuer processing services
to the customer's bank and acquirer
processing services to the merchant
Nets owns and
operates Dankort, the
Danish national debit
card scheme
Account based
payments in Denmark
Nets operates the recurring payment
system Betalingsservice
Nets operates NemID, de-facto eID
platform in Denmark
Nets operates the
Danish clearing system
Sources: Company Data; Bryan, Garnier & Co.
The group therefore has a central position (a type of single meeting point) between the major payment players in the region. This is a clear advantage, enabling it to be a preferred partner for local or international banks that would like to enter this market. In all, it plays the role of facilitator during an electronic transaction, whatever the channel chosen (primarily physical, but also online or on mobile devices), not to mention the fact that it has the specific feature of handling management of the system between these players in certain cases (it owns and/or operates major local debit card schemes). In concrete terms, it enables the various players to pay, issue cards, receive electronic payments and provide value-added services destined to accompany them in their activities. It shoulders all the main payment types, whether international debit/credit cards (e.g. Visa, MasterCard), local debit cards (e.g. it owns and operates Dankort in Denmark, and operates BankAxept in Norway), alternative methods (e.g: digital and mobile methods), other acceptance solutions (e.g. applications, wallets), recurring payment solutions (Betalingsservice…), credit transfers and direct debits transactions.
Fig. 21: Nets is at the centre of the Nordic payments ecosystem
Source: Company.
4.3. A key player in the Nordics Nets has provided payments solutions for almost five decades in Nordic countries. It is part of the landscape and ecosystem for payments in the region, having genuinely contributed to its development. The Nordic market is quite specific. While the use of electronic payment means is high in the region, the size of the market remains fairly small. As such, in order to generate economies of scale, players in the region rapidly decided to cooperate with each other. Some
Nets
20
50 years ago, they chose to pool their resources and manage infrastructure together, push for the adoption of electronic payments and create PBS in Denmark, BBS in Norway and Luottokunta in Finland. Similarly, Finnish banks combined their strengths to create an ATM company. All of this accelerated the supply of basic services and the optimisation of processing for banks (common infrastructure and common standards), which were then able to focus on their basic activities. This wide-scale cooperation also allowed the industry to regulate itself. The Nordic model then stood out clearly from the rest of the payments industry in Europe. This joint work brought out a consensus which helped step up the adoption of new products. This was the case in Denmark where the public sector decided to cooperate with the banking sector and within a few years introduced the electronic ID card for all Danish citizens. The smooth functioning of this model throughout the years stems also and above all from the specific nature of the region (stable economies, high cost of work forcing players to be more innovative and efficient, and a relatively small sized market).
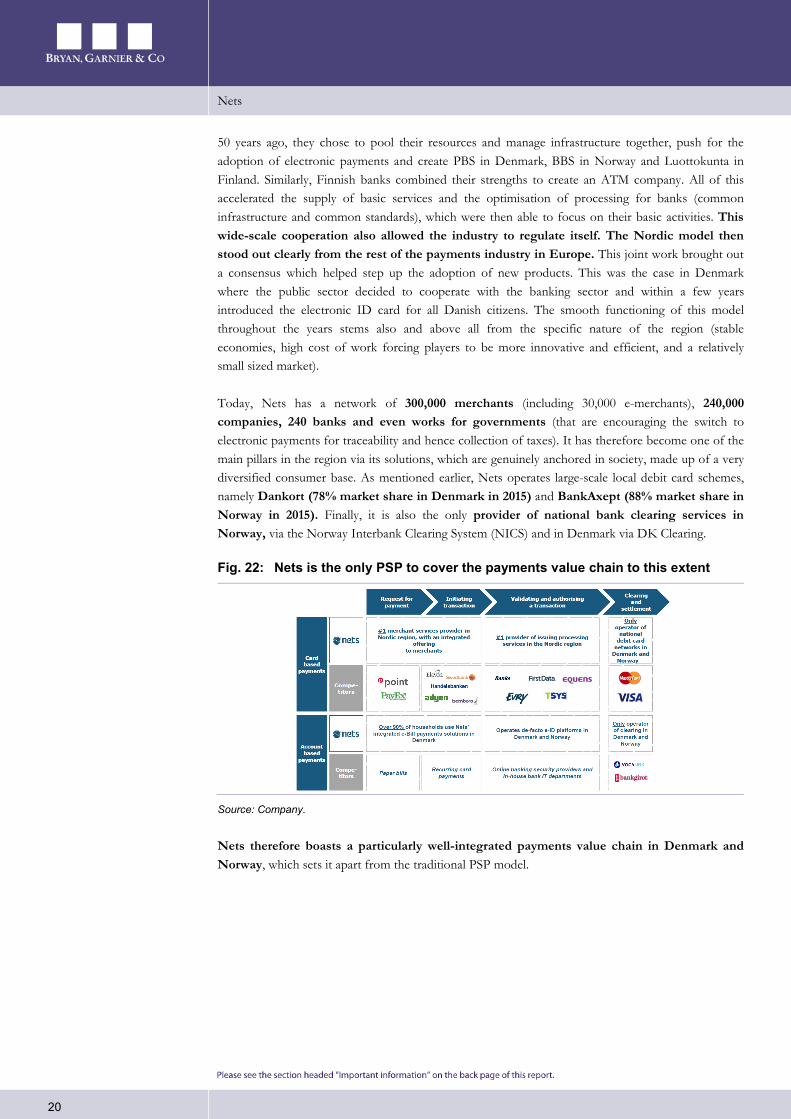
Today, Nets has a network of 300,000 merchants (including 30,000 e-merchants), 240,000 companies, 240 banks and even works for governments (that are encouraging the switch to electronic payments for traceability and hence collection of taxes). It has therefore become one of the main pillars in the region via its solutions, which are genuinely anchored in society, made up of a very diversified consumer base. As mentioned earlier, Nets operates large-scale local debit card schemes, namely Dankort (78% market share in Denmark in 2015) and BankAxept (88% market share in Norway in 2015). Finally, it is also the only provider of national bank clearing services in Norway, via the Norway Interbank Clearing System (NICS) and in Denmark via DK Clearing.
Fig. 22: Nets is the only PSP to cover the payments value chain to this extent
Source: Company.
Nets therefore boasts a particularly well-integrated payments value chain in Denmark and Norway, which sets it apart from the traditional PSP model.

Nets
21
Fig. 23: Nets has a highly integrated value chain in Denmark and Norway
Sources: Company; Bryan, Garnier & Co.
It belongs to the main PSPs in Europe, in terms of both sales and transaction volumes processed (with strong positions in Denmark, Norway and Finland and attractive prospects in Sweden). As such, it ranks no. 3 among the European PSPs, based on pro-forma 2015 sales (behind Worldline and First Data), bearing in mind that it is entirely exposed to Europe (Denmark, Norway, Finland, Sweden, Estonia, Latvia and Lithuania).
Fig. 24: Ranking of main European PSPs (pro-forma 2015 sales)
EURm Nationality % of group sales in payment services
% of payment services sales in Europe
Worldline (incl. Equens) France 78% 95% First Data US 60% 16%
Nets Denmark 86% 100% Worldpay UK 100% 67%
FIS US 61% 24%
Concardis Germany 100% 100%
Global Payments US 100% 23%
Wirecard Germany 100% 72%
SIA Italy 92% 100%
Ingenico Group France 32% 63%
B+S Germany 100% 100%
TSYS US 100% 12%
Source: Bryan, Garnier & Co ests.
Fig. 25: Ranking of largest acquirers in the world in 2015
Rank Acquirer Transactions (m) 1 Vantiv 17,667.1 2 JPMorgan Chase 17,058.8 3 Bank of America 14,439.3 4 First Data 11,660.8 5 Worldpay 10,581.6 6 Global Payments (incl. Heartland Payment Sys.) 10,030.0 7 Citi Merchant Services 7,550.4 8 Cielo 6,279.4 9 Elavon 5,540.7 10 Sberbank 5,329.6 11 Barclays 4,596.1 12 Nets 4,071.3
Source: Nilson report.
Nets processes 60% of cards and slightly more than 55% of card transactions in Nordic countries, making it the clear leader in the region. Indeed, it processed approximately 7.3bn total card

Nets
22
transactions and processed transactions initiated by 35.1m cards during 2015. The group estimates that at least one of its payments services was used by around 98% of Danish merchants, 88% in Norwegian national card transactions, in more than 60% of Norwegian e-commerce payments, and in more than 85% of transactions undertaken with cards issued in Finland in 2015. Finally, more than 90% of Danish households use its recurring payments system (Betalingsservice) to pay for public services and other recurring bills in Denmark and around 80% of Norwegian mobile/online banking services via its platform e-ID (BankID). Since it operates and integrates several tasks along the digital value chain itself, we estimate this enables it to offer more attractive prices than if the companies and banks used the traditional system with a number of operators.
Fig. 26: Nets has an integrated digital value chain (e.g.: Betalingsservice)
Source: Company
Given its very integrated model in Denmark and Norway, Nets currently faces little competition in its in-store transaction acquiring and debit card issuing processing activities in the networks it operates (Dankort and BankAxept) and in services in its Corporate Services division. In contrast, competition is stronger in less traditional payment methods or channels (e.g.: mobile payment, e-/m-commerce…) and in international third-party card networks (Visa and MasterCard).

Nets
23
5. Traps to avoid when looking at the figures
As for Worldpay, the consensus on Nets does not seem to take into account accounting and reporting differences that exist between the various payments players (especially concerning sales recognition and the calculation of profitability). However, these are important since with no adjustments, they can make comparison of profitability margins redundant or choices of stockmarket multiples irrelevant.
5.1. Gross sales and EBITDA (rather than net sales and underlying EBITDA)
Recognition of sales revenue at Nets is similar to the majority of European players we cover, namely they virtually all publish gross sales (what we call sales). Like its rivals in our universe, the group books under gross sales all of its fees (including the acquirer/processor fee, the interchange fee that goes to the consumer's bank, and the fee that goes to the payment network). In contrast, the group highlights its net sales (which only includes its own fees: for processing, acquiring and the local payment schemes) a figure that is not generally published by other European companies we cover. This indicator is therefore irrelevant for comparison as it is more similar to a gross margin. Only Worldpay has adopted a similar presentation, which is ultimately not very surprising since it was floated on the stockmarket by same funds as Nets (Bain Capital and Advent International).
Fig. 27: Difference between gross sales and net sales at Nets
Gross revenue Net revenue
Fee retained by the acquirer Merchant service fee
+ interchange fee (fee paid by the acquirer to the issuer) - Interchange fee
+ third-party card scheme fee - third-party card scheme fee
= Merchant service fee = Fee retained by Nets
Source: Bryan, Garnier & Co ests
It therefore seems essential to calculate Nets' profitability on the basis of its gross sales and not its net sales (which artificially bloats its margin rate and therefore makes comparison with other European players inappropriate). Indeed, this avoids the hazardous margin comparisons that we noted after Worldpay's IPO by the consensus, and the ensuing mistaken conclusions on valuation.
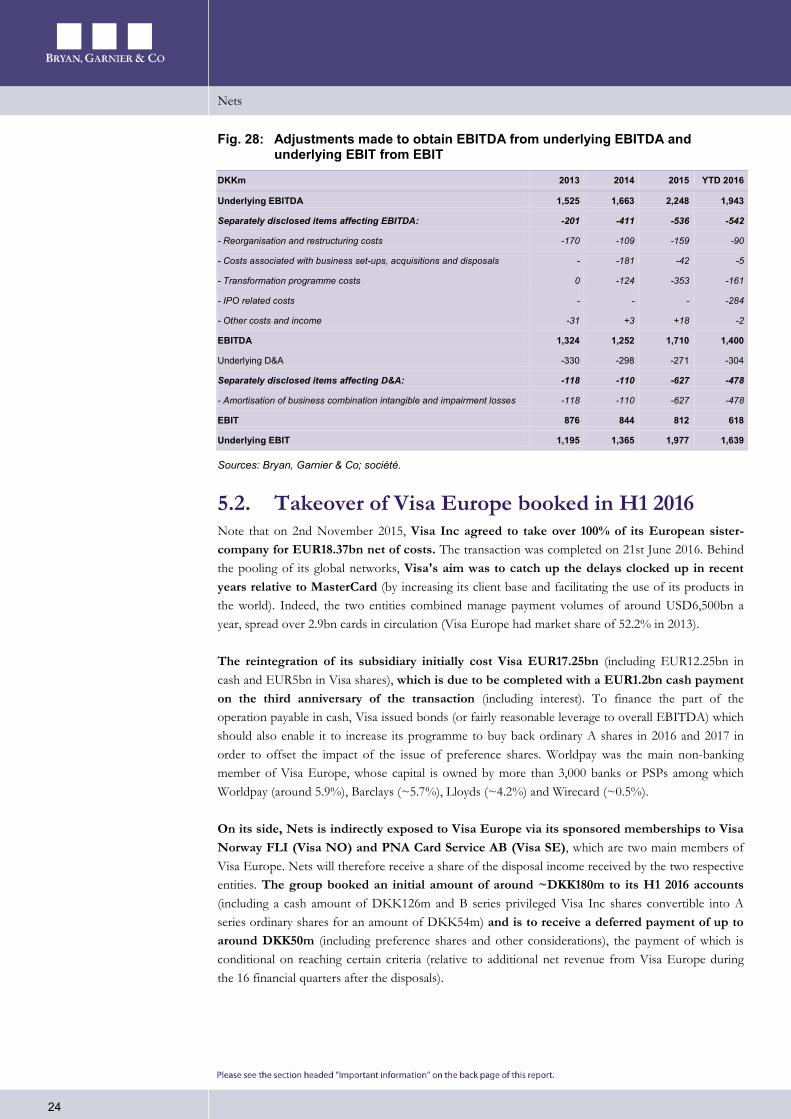
Finally, we prefer to look at the genuine EBITDA published by the group rather than underlying EBITDA. Here again, Nets like Worldpay, likes to place the accent on this line item, but, in our view, the numerous negative items that it excludes (reorganisation/restructuring costs, acquisition/disposal costs, cost of transformation programme and other costs and results: 13% of underlying EBITDA in 2014, 25% in 2014, 24% in 2015 and 28% over the first nine months following the IPO costs booked in Q3) should be adjusted for solely at the EBIT level to give an underlying EBIT figure. This is how the group's European rivals proceed and how we are used to analysing the accounts of PSPs.
Nets
24
Fig. 28: Adjustments made to obtain EBITDA from underlying EBITDA and underlying EBIT from EBIT
DKKm 2013 2014 2015 YTD 2016
Underlying EBITDA 1,525 1,663 2,248 1,943
Separately disclosed items affecting EBITDA: -201 -411 -536 -542
- Reorganisation and restructuring costs -170 -109 -159 -90
- Costs associated with business set-ups, acquisitions and disposals - -181 -42 -5
- Transformation programme costs 0 -124 -353 -161
- IPO related costs - - - -284
- Other costs and income -31 +3 +18 -2
EBITDA 1,324 1,252 1,710 1,400
Underlying D&A -330 -298 -271 -304
Separately disclosed items affecting D&A: -118 -110 -627 -478
- Amortisation of business combination intangible and impairment losses -118 -110 -627 -478
EBIT 876 844 812 618
Underlying EBIT 1,195 1,365 1,977 1,639
Sources: Bryan, Garnier & Co; société.
5.2. Takeover of Visa Europe booked in H1 2016 Note that on 2nd November 2015, Visa Inc agreed to take over 100% of its European sister-company for EUR18.37bn net of costs. The transaction was completed on 21st June 2016. Behind the pooling of its global networks, Visa's aim was to catch up the delays clocked up in recent years relative to MasterCard (by increasing its client base and facilitating the use of its products in the world). Indeed, the two entities combined manage payment volumes of around USD6,500bn a year, spread over 2.9bn cards in circulation (Visa Europe had market share of 52.2% in 2013).
The reintegration of its subsidiary initially cost Visa EUR17.25bn (including EUR12.25bn in cash and EUR5bn in Visa shares), which is due to be completed with a EUR1.2bn cash payment on the third anniversary of the transaction (including interest). To finance the part of the operation payable in cash, Visa issued bonds (or fairly reasonable leverage to overall EBITDA) which should also enable it to increase its programme to buy back ordinary A shares in 2016 and 2017 in order to offset the impact of the issue of preference shares. Worldpay was the main non-banking member of Visa Europe, whose capital is owned by more than 3,000 banks or PSPs among which Worldpay (around 5.9%), Barclays (~5.7%), Lloyds (~4.2%) and Wirecard (~0.5%).
On its side, Nets is indirectly exposed to Visa Europe via its sponsored memberships to Visa Norway FLI (Visa NO) and PNA Card Service AB (Visa SE), which are two main members of Visa Europe. Nets will therefore receive a share of the disposal income received by the two respective entities. The group booked an initial amount of around ~DKK180m to its H1 2016 accounts (including a cash amount of DKK126m and B series privileged Visa Inc shares convertible into A series ordinary shares for an amount of DKK54m) and is to receive a deferred payment of up to around DKK50m (including preference shares and other considerations), the payment of which is conditional on reaching certain criteria (relative to additional net revenue from Visa Europe during the 16 financial quarters after the disposals).
Nets
25
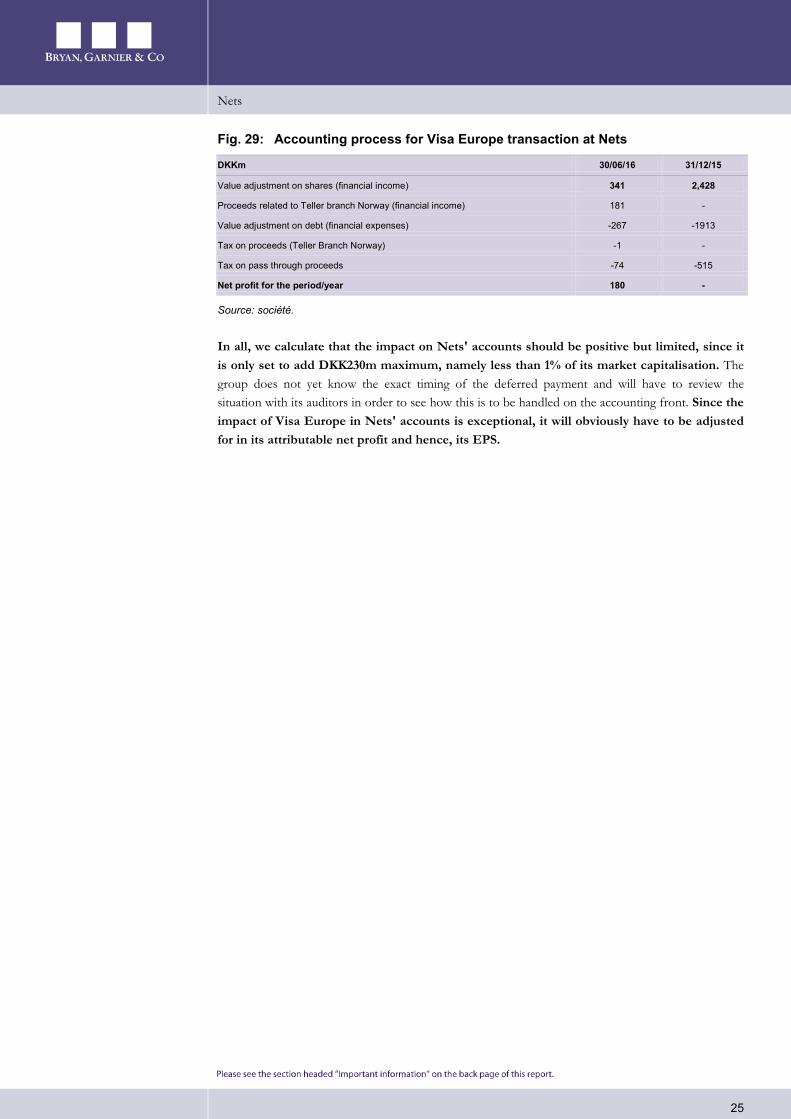
Fig. 29: Accounting process for Visa Europe transaction at Nets
DKKm 30/06/16 31/12/15
Value adjustment on shares (financial income) 341 2,428
Proceeds related to Teller branch Norway (financial income) 181 -
Value adjustment on debt (financial expenses) -267 -1913
Tax on proceeds (Teller Branch Norway) -1 -
Tax on pass through proceeds -74 -515
Net profit for the period/year 180 -
Source: société.
In all, we calculate that the impact on Nets' accounts should be positive but limited, since it is only set to add DKK230m maximum, namely less than 1% of its market capitalisation. The group does not yet know the exact timing of the deferred payment and will have to review the situation with its auditors in order to see how this is to be handled on the accounting front. Since the impact of Visa Europe in Nets' accounts is exceptional, it will obviously have to be adjusted for in its attributable net profit and hence, its EPS.
Nets
26
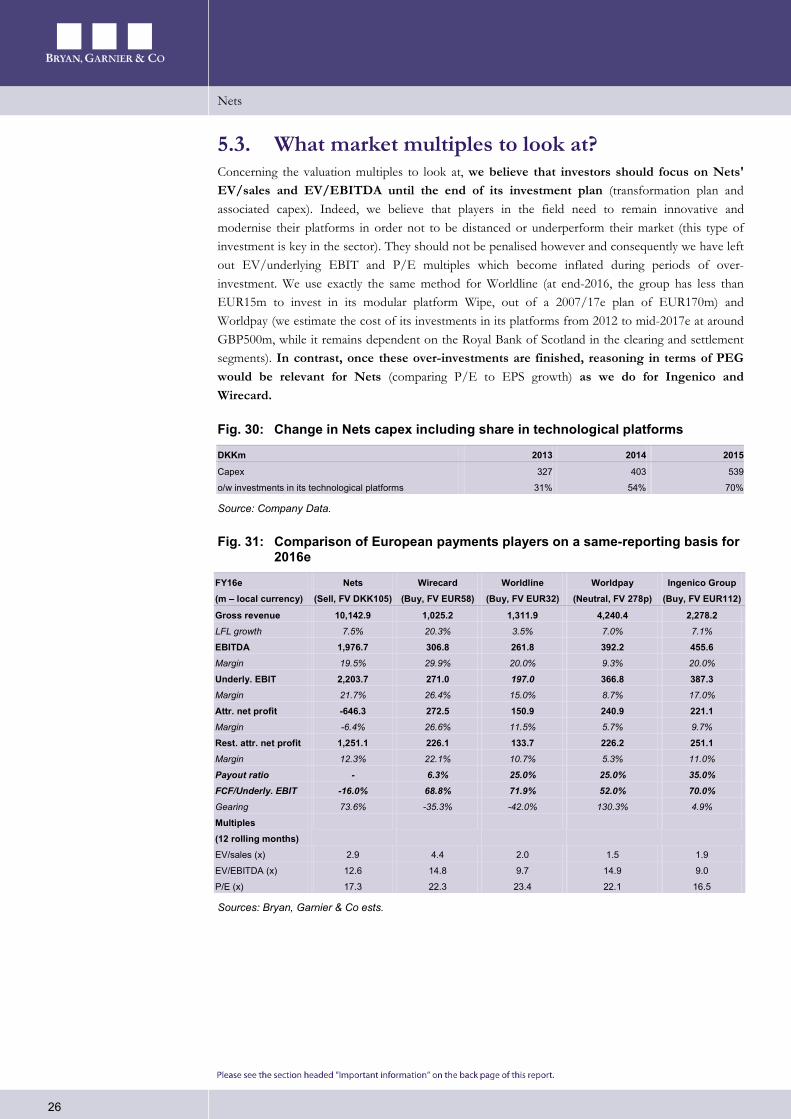
5.3. What market multiples to look at? Concerning the valuation multiples to look at, we believe that investors should focus on Nets' EV/sales and EV/EBITDA until the end of its investment plan (transformation plan and associated capex). Indeed, we believe that players in the field need to remain innovative and modernise their platforms in order not to be distanced or underperform their market (this type of investment is key in the sector). They should not be penalised however and consequently we have left out EV/underlying EBIT and P/E multiples which become inflated during periods of over-investment. We use exactly the same method for Worldline (at end-2016, the group has less than EUR15m to invest in its modular platform Wipe, out of a 2007/17e plan of EUR170m) and Worldpay (we estimate the cost of its investments in its platforms from 2012 to mid-2017e at around GBP500m, while it remains dependent on the Royal Bank of Scotland in the clearing and settlement segments). In contrast, once these over-investments are finished, reasoning in terms of PEG would be relevant for Nets (comparing P/E to EPS growth) as we do for Ingenico and Wirecard.
Fig. 30: Change in Nets capex including share in technological platforms
DKKm 2013 2014 2015
Capex 327 403 539
o/w investments in its technological platforms 31% 54% 70%
Source: Company Data.
Fig. 31: Comparison of European payments players on a same-reporting basis for 2016e
FY16e (m – local currency)
Nets (Sell, FV DKK105)
Wirecard (Buy, FV EUR58)
Worldline (Buy, FV EUR32)
Worldpay (Neutral, FV 278p)
Ingenico Group (Buy, FV EUR112)
Gross revenue 10,142.9 1,025.2 1,311.9 4,240.4 2,278.2 LFL growth 7.5% 20.3% 3.5% 7.0% 7.1%
EBITDA 1,976.7 306.8 261.8 392.2 455.6 Margin 19.5% 29.9% 20.0% 9.3% 20.0%
Underly. EBIT 2,203.7 271.0 197.0 366.8 387.3 Margin 21.7% 26.4% 15.0% 8.7% 17.0%
Attr. net profit -646.3 272.5 150.9 240.9 221.1 Margin -6.4% 26.6% 11.5% 5.7% 9.7%
Rest. attr. net profit 1,251.1 226.1 133.7 226.2 251.1 Margin 12.3% 22.1% 10.7% 5.3% 11.0%
Payout ratio - 6.3% 25.0% 25.0% 35.0% FCF/Underly. EBIT -16.0% 68.8% 71.9% 52.0% 70.0% Gearing 73.6% -35.3% -42.0% 130.3% 4.9%
Multiples (12 rolling months)
EV/sales (x) 2.9 4.4 2.0 1.5 1.9
EV/EBITDA (x) 12.6 14.8 9.7 14.9 9.0
P/E (x) 17.3 22.3 23.4 22.1 16.5
Sources: Bryan, Garnier & Co ests.
Nets
27
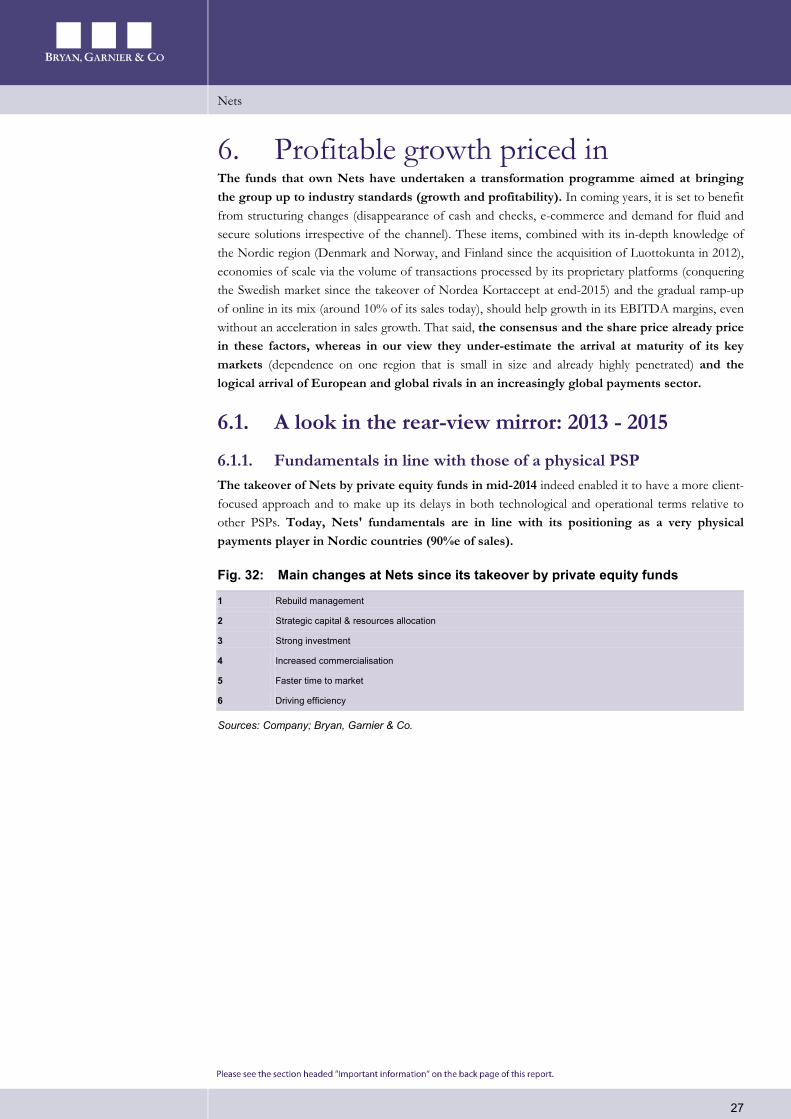
6. Profitable growth priced in The funds that own Nets have undertaken a transformation programme aimed at bringing the group up to industry standards (growth and profitability). In coming years, it is set to benefit from structuring changes (disappearance of cash and checks, e-commerce and demand for fluid and secure solutions irrespective of the channel). These items, combined with its in-depth knowledge of the Nordic region (Denmark and Norway, and Finland since the acquisition of Luottokunta in 2012), economies of scale via the volume of transactions processed by its proprietary platforms (conquering the Swedish market since the takeover of Nordea Kortaccept at end-2015) and the gradual ramp-up of online in its mix (around 10% of its sales today), should help growth in its EBITDA margins, even without an acceleration in sales growth. That said, the consensus and the share price already price in these factors, whereas in our view they under-estimate the arrival at maturity of its key markets (dependence on one region that is small in size and already highly penetrated) and the logical arrival of European and global rivals in an increasingly global payments sector.
6.1. A look in the rear-view mirror: 2013 - 2015
6.1.1. Fundamentals in line with those of a physical PSP The takeover of Nets by private equity funds in mid-2014 indeed enabled it to have a more client-focused approach and to make up its delays in both technological and operational terms relative to other PSPs. Today, Nets' fundamentals are in line with its positioning as a very physical payments player in Nordic countries (90%e of sales).
Fig. 32: Main changes at Nets since its takeover by private equity funds
1 Rebuild management
2 Strategic capital & resources allocation
3 Strong investment
4 Increased commercialisation
5 Faster time to market
6 Driving efficiency
Sources: Company; Bryan, Garnier & Co.
Nets
28
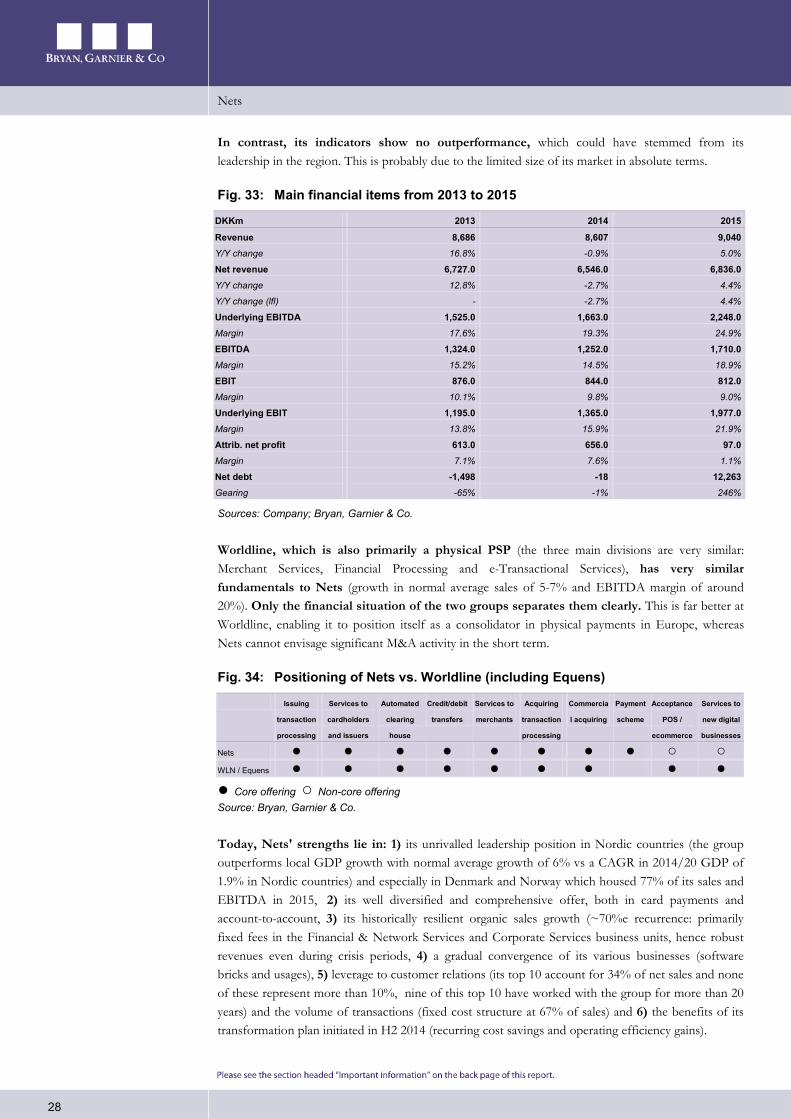
In contrast, its indicators show no outperformance, which could have stemmed from its leadership in the region. This is probably due to the limited size of its market in absolute terms.
Fig. 33: Main financial items from 2013 to 2015
DKKm 2013 2014 2015
Revenue 8,686 8,607 9,040 Y/Y change 16.8% -0.9% 5.0%
Net revenue 6,727.0 6,546.0 6,836.0 Y/Y change 12.8% -2.7% 4.4%
Y/Y change (lfl) - -2.7% 4.4%
Underlying EBITDA 1,525.0 1,663.0 2,248.0 Margin 17.6% 19.3% 24.9%
EBITDA 1,324.0 1,252.0 1,710.0 Margin 15.2% 14.5% 18.9%
EBIT 876.0 844.0 812.0 Margin 10.1% 9.8% 9.0%
Underlying EBIT 1,195.0 1,365.0 1,977.0 Margin 13.8% 15.9% 21.9%
Attrib. net profit 613.0 656.0 97.0 Margin 7.1% 7.6% 1.1%
Net debt -1,498 -18 12,263 Gearing -65% -1% 246%
Sources: Company; Bryan, Garnier & Co.
Worldline, which is also primarily a physical PSP (the three main divisions are very similar: Merchant Services, Financial Processing and e-Transactional Services), has very similar fundamentals to Nets (growth in normal average sales of 5-7% and EBITDA margin of around 20%). Only the financial situation of the two groups separates them clearly. This is far better at Worldline, enabling it to position itself as a consolidator in physical payments in Europe, whereas Nets cannot envisage significant M&A activity in the short term.
Fig. 34: Positioning of Nets vs. Worldline (including Equens)
Issuing
transaction
processing
Services to
cardholders
and issuers
Automated
clearing
house
Credit/debit
transfers
Services to
merchants
Acquiring
transaction
processing
Commercia
l acquiring
Payment
scheme
Acceptance
POS /
ecommerce
Services to
new digital
businesses
Nets ● ● ● ● ● ● ● ● ○ ○ WLN / Equens ● ● ● ● ● ● ● ● ● ● Core offering ○ Non-core offering Source: Bryan, Garnier & Co.
Today, Nets' strengths lie in: 1) its unrivalled leadership position in Nordic countries (the group outperforms local GDP growth with normal average growth of 6% vs a CAGR in 2014/20 GDP of 1.9% in Nordic countries) and especially in Denmark and Norway which housed 77% of its sales and EBITDA in 2015, 2) its well diversified and comprehensive offer, both in card payments and account-to-account, 3) its historically resilient organic sales growth (~70%e recurrence: primarily fixed fees in the Financial & Network Services and Corporate Services business units, hence robust revenues even during crisis periods, 4) a gradual convergence of its various businesses (software bricks and usages), 5) leverage to customer relations (its top 10 account for 34% of net sales and none of these represent more than 10%, nine of this top 10 have worked with the group for more than 20 years) and the volume of transactions (fixed cost structure at 67% of sales) and 6) the benefits of its transformation plan initiated in H2 2014 (recurring cost savings and operating efficiency gains).

Nets
29
6.1.2. Top-line growth The group's organic growth has gained momentum since it was taken over by private equity funds:
1) Merchant Services (39% of sales on average from 2013 to 2015): In the past three years, the division has reported an organic CAGR slightly below the group average (+3.0% vs +3.6%). Indeed, the Danish and Norwegian banks that owned the majority of the capital until mid-2014 did not consider this division as a priority. In contrast, the takeover by private equity funds ratified the roll-out of a transformation plan that has been particularly beneficial to this segment over the past two years (product development, improvement in sales offer, initiatives in e-commerce, focus on client retention…). These actions were necessary, in our view, since they concerned the segment with the highest growth potential and hence margin growth. They enabled a real jump in organic net sales growth from -0.8% in 2014 to 6.9% in 2015 and 11% over nine months in 2016. Finally, Nets made numerous acquisitions in the division over the same period, hence an acceleration in sales volumes and the distribution network (the takeover of Nordea Kortaccept offers potential in Sweden).
Fig. 35: Forthcoming growth drivers in Merchant Services
eCommerce volumes and enhanced product offering
Higher retention rates
Cross-selling and up-selling to existing customer base
Stronger position to expand customer base in Sweden
Sources: Company; Bryan, Garnier & Co.
2) Financial & Network Services (29% of sales on average): In the past three years, this division has generated an organic CAGR in sales far ahead of the group average (+6.1% vs. +3.6%). In 2015, the group not only benefited from advantageous comparison (2014 sales were affected by the price renegotiations operated by Nordic banks during the five-year extension to their processing contracts), but also managed to win new clients in the card issuing processing segment (Swedish and Baltic banks) and increase sales in new services to the existing customer base. Finally, it benefited from growth in the volume of transactions in its card schemes (10% of total net sales, high-margin business) and the roll-out of contactless cards by regional banks (the set-up fee is obviously not recurring).
Fig. 36: Forthcoming growth drivers in Financial & Network Services
Domestic card schemes and issuer processing volumes
Card management services and outsourcing
Contactless and mobile wallet solutions
Fraud and dispute services
Additional opportunities from Dankort network ownership
Sources: Company; Bryan, Garnier & Co.
3) Corporate Services (32% of average sales): In the past three years, this division has seen the lowest organic CAGR in sales of the three Nets' divisions (+2.1% vs. +3.6%). This low growth is due to the level of penetration of Nets' services in the varimanque à gagnerous countries where it is historically located, namely Denmark and Norway (only Sweden could offer potential). In contrast, since the segment is based on contracts for which the fee is fixed per transaction, it is particularly resilient during crisis periods (the PSD2 regulation could offer potential, as could the export of real-time clearing/settlement services outside Nordic countries).

Nets
30
Fig. 37: Forthcoming growth drivers in Corporate Services
Long-term household expenditure growth
Increasing recurrent payments transactions frequency
Continued penetration of e-billing
e-Invoicing expansion across the Nordics
Sources: Company; Bryan, Garnier & Co.
Fig. 38: Breakdown of revenue by business over 2013 and 2014
Revenue (DKKm) – % of total revenue 2013 2014 2015
1) Merchant Services 3,473 – 40% 3,302 – 38% 3,539 – 39%
2) Financial & Network Services 2,462 – 28% 2,537 – 29% 2,730 – 30%
3) Corporate Services 2,751 – 32% 2,768 – 32% 2,771 – 31%
Total revenue 8,686 – 100% 8,607 – 100% 9,040 – 100%
Organic net revenue growth 2013 2014 2015 CAGR 13-15
1) Merchant Services - -0.8% 6.9% 3.0%
2) Financial & Network Services - 1.0% 11.4% 6.1%
3) Corporate Services - 2.7% 1.4% 2.1%
Total organic net revenue growth - 1.3% 5.9% 3.6%
Sources: Company data; Bryan, Garnier & Co.
6.1.3. Profitability The return to normative sales growth, in both organic terms and acquisitions, has helped considerably improve the group's profitability. As such, from 2013 to 2015, its EBITDA margin improved by 370bp from 15.2% to 18.9% (we reason in terms of EBITDA/gross sales) and its underlying EBIT margin by 810bp from 13.8% to 21.9%.
Fig. 39: Breakdown of profitability by business over 2013 and 2014
DKKm 2013 2014 2015
Underlying EBITDA¹
1) Merchant Services 427 427 559.5
2) Financial & Network Services 469 518 810.5
3) Corporate Services 629 719 880
Total underlying EBITDA 1,525 1,663 2,250
Underlying EBITDA¹ margin Change 13-15
1) Merchant Services 12.3% 12.9% 15.8% +350bp
2) Financial & Network Services 19.0% 20.4% 29.7% +1,070bp
3) Corporate Services 22.9% 26.0% 31.8% +890bp
Total 17.6% 19.3% 24.9% +730bp
¹: We have presented underlying EBITDA here since Nets des not communicate the breakdown of its EBITDA by business
Sources: Company data; Bryan, Garnier & Co.
This sharp growth has been driven by several factors:
1) Mechanical operating leverage (accounting for 30% of growth): The payment services business has high fixed costs (67% at Nets vs. 50-60% for other PSPs we cover). Any outperformance

Nets
31
in sales growth generates operating leverage (leverage from transaction volumes processed by the proprietary technological platforms). Indeed, in payments, size does count, whether in terms of organic growth or acquisitions. PSPs are assessed on their EBITDA margin and all other factors remaining equal, the bigger they are, the more profitable they are (marginal cost of a new transaction virtually zero and greater flexibility in the absorption of business peaks).
2) Restructuring of the cost base (accounting for 50% of growth): The measures taken by management are quite classic but were never implemented by the previous owners. We would above all note the greater flexibility (via the outsourcing of functions such as IT: 6% decline between 2013 and 2014), better discipline in terms of supply (renegotiation of supplier prices etc.), cuts in headcount (staff costs reduced by 10% over the period vs. 4% growth in sales) and an overhaul of operating processes.
3) The increase in project capitalisation (accounting for the remaining 20%): Note that Nets owns and uses technological solutions, the majority of which are developed internally (86% of its applications). The increase in project capitalisation as well as the longer average duration of projects has resulted in an increase in capitalised R&D. That said, this is common practice in the sector since the same has been seen at other listed peers. The amortisation duration stands at three/seven years at Nets, three/eight years at Worldpay, is no more than five/seven years at Worldline (three/five in practice), three/five at Ingenico Group, and 10 years at Wirecard.
Fig. 40: Group margin growth drivers
The ongoing implementation of the transformation programme
The traditional operating leverage in payment services (linked to the increasing transaction volume processed)
The final cost base optimisation (everything essential has already been made)
Sources: Company; Bryan, Garnier & Co.
6.2. Growth factors exist but should be seen in perspective
6.2.1. Growth factors and sources of fresh growth Progress in electronic payments in Nordic countries: Electronic payments in Nordic
countries (by card, credit transfers, direct debits etc.) are expected to show a CAGR over 2015/20 of 4% against a backdrop of: 1) the gradual disappearance of cash/checks (penetration rate of bank cards of 79% at merchants in 2015 vs. 77% in 2014, with Nordic countries accounting for four out of the Top 5 in the ranking of the highest number of card transactions in the EU), 2) development of e-commerce and m-commerce (2015-20 CAGR of 14% according to First Annapolis, m-commerce is likely to account for 30% of overall online commerce at end-2016 in the region), 3) an acceleration in instant payments (direct transfers via the PSD2 directive in early 2018), and 4) the rising outsourcing of payment activities by banks to specialists (in both the merchant acquiring segment and card issue processing). This 4% growth breaks down between card payments with a CAGR of 5% and payments from bank accounts with a CAGR of 2%. In historical terms, growth in transaction volumes is the most dynamic in Denmark, followed by Norway, Sweden and Finland. The Nordic payments market is solid and is backed by a stable macro-economic environment (2014/2020 CAGR in GDP set to stand at +1.9% on World Bank estimates). That said, we expect no ramp-up in the market in the years to come, whether for Nets or its market.

Nets
32
Fig. 41: The electronic payments market in Nordic countries
In bn 2020 CAGR 2015-2020
Number of card transactions in the Nordic region 10 5%
Number of account-based payments in the Nordic region 4 2%
Total 14 4%
Source: Company Data; Bryan, Garnier & Co ests.
Mobile payments: The mobile payments market is interesting and promising in Nordic countries since the 2015/20 CAGR in its total annual value is expected to reach 33% (from EUR16m to EUR55-80bn, namely between +28% and +38%). As leader in card acquiring and processing in the region, Nets seemed to be the most inclined to benefit from the mobile payments market, especially as a white brand for banks. The aim of this type of application is to offer a regional alternative to applications by giants such as Google, Apple and Samsung. That said, the fact that Nordea chose the MobilePay mobile payment service by Danske Bank in mid-October (leader in Denmark, popular for its P2P transfers and instore or online purchases) to the detriment of Swipp by Nets (application developed as a JV with local banks) has undermined the potential of this source of fresh growth. Indeed, Nordea will be able to offer this service to its clients in Denmark, Norway and Finland and these transactions will therefore not pass via Nets. Furthermore, we believe this agreement between Nordea and Danske could prompt other Danish, Norwegian and Finnish banks to do the same. Not to mention the fact that MobilePay could then be launched in Sweden in coming months or years. In all, the financial impact for Nets is immaterial, but the concern is above all a shortfall in the future. Note that the Dankort Mobile product (contactless payment and mobile solution) is currently being tested and is due to be launched in Q1 2017. Finally, note that the PSD2 directive could step up the development of mobile payments and P2P payments.
Fig. 42: In Denmark, mobile payments are above all P2P/little used in stores
Source: Company
PSP >75%
Merchants<25%
Dankort ~73%
International cards~25%
Mobile wallets ~2%

Nets
33
The Swedish market: In payments, sales growth is what improves margins since the business involves high fixed costs (67% at Nets). Since Sweden is the largest Nordic market in the region accounting for ~40% of total transaction volumes in the region, has almost 10m inhabitants vs. slightly over half of this amount each for the three other Nordic markets, and is one of the rare countries where Nets is only the no. 2 player (behind Swedbank), we consider it is the main source of fresh growth for Nets in coming years. Sweden represents the majority of the 11% of sales generated in countries other than Denmark, Norway and Finland. The recent acquisition of Nordea's merchant acquiring business (Kortaccept: net sales of around DKK200m in 2015) should help penetrate this country. While the group has already acquired 32,000 merchants via this operation, potential is far from exhausted since Kortaccept only works with 16% of Nordea's in-store merchant base (the other 84% works with other acquirers than Nets). As such, it is possible that Nets could succeed in winning others thanks to the cross-selling agreement that it signed with the group. Note that thanks to two acquisitions made in the region (Payzone in August 2014 and Kortaccept in Decmeber 2015), Nets has hoisted itself to no. 2 position among acquirers in Sweden and is even the leader in the online segment (the takeover of DIBS should help continue its development in e-commerce). In the country, Nets is in direct competition with banks such as Swedbank (no. 1) and Handelsbanken (no. 3). We estimate that its position could evolve favourably in the region if it managed to either set up a partnership with them (in the short/medium terms), or undertake another acquisition (no major M&A since the group is highly in debt). As usual in payments, the interest of this type of operation lies in the client portfolio, namely the merchant connections to place on the platforms, where the leverage effect is automatic. Finally, note that there is no place to full in the payments scheme segment in Sweden since only international networks are present there (as in Finland for the past eight/10 years).
Fig. 43: Characteristics of the four main Nordic countries
Sources: CIA World Factbook 2015; eMarketer 2015
Nets
34
6.2.2. Risk factors Key markets reaching maturity: Nets is highly dependent on its three Nordic countries,
namely Denmark, Norway and Finland (around 90% of Nets overall sales). Since the card penetration rate is very high in absolute terms in these countries and even far higher than the European average (60-70% in the Nordic region vs. 40% in the rest of Europe), the risk is that growth will slow down in these countries as they reach maturity. The region would therefore become more of a maintenance market rather than a region to be genuinely conquered by electronic payments in favour of cash and checks. The same goes for the account-to-account segment since Nets services are already very well established in Denmark and Norway (more than 90% of Danish households use its recurring bill paying system Betalingsservice, and more than 80% of Norwegians access online and mobile banking services using its BankID platform).
The PSD2 directive: the implementation of the PSD2 directive early next year could lead to: 1) the arrival of competitors in the Corporate Services division since banks will have to provide third-party services providers direct access to their clients' accounts (so far Nets was one of the rare groups to have this privilege), 2) a gradual substitution of payments by card in favour of instant transfers (negative impact on sales in the Financial & Network Services division) which would be partly or wholly offset by account-to-account payment services (Corporate Services).
Heightened competition in payments services: The main risk for the case is the possibility of seeing PSPs with European and/or global platforms arrive in the Nordic market. This would make sense in an increasingly standardised payments market in Europe (SEPA zone, PSD2 directive etc.) and throughout the world (e-commerce, virtually-global EMV standard etc.). This could jeopardise Nets' unrivalled leadership position in the region (a position that could almost be described as monopolistic since it processes 60% of cards and slightly more than 55% of card transactions in the region) and prompt pressure on prices.
Local schemes thrown into question: For the moment, Dankort in Denmark (owned and operated by Nets, where it is the only processor and acquirer) and BankAxept in Norway (operated by Nets) are among the most competitive card schemes in the world. That said, the risk still exists of seeing international card networks (Visa and MasterCard) make more aggressive entries into Nets' two main countries (they only have 22% of the market in Denmark and 12% in Norway), especially since Visa Europe has been reintegrated at Visa Inc. As such, Dankort and BankAxept could no longer be the leading local networks. We estimate that international schemes are gaining ground each year. That said, since Nets also processes Visa and Mastercard payments in the Nordic region, it does not lose all sales when the two groups win market shares.
Note that these risk factors are not fully factored into our model. If they were to materialise, they would add further downside risk to our valuation.
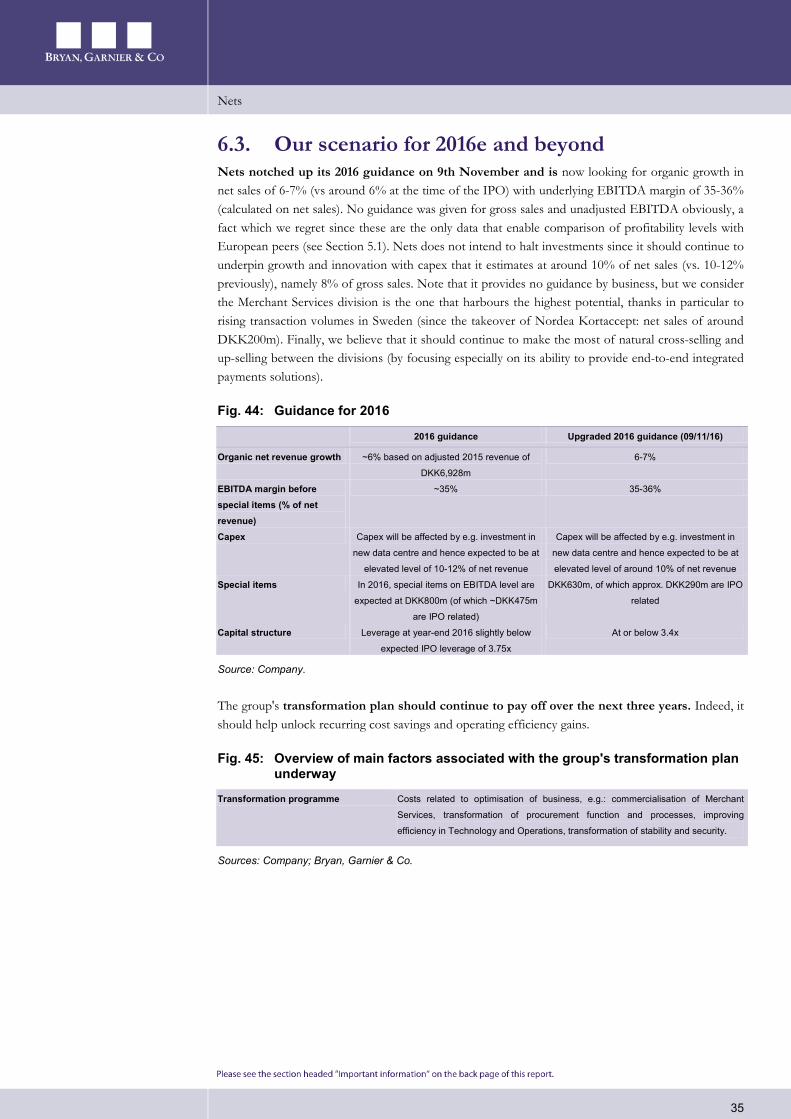
Nets
35
6.3. Our scenario for 2016e and beyond Nets notched up its 2016 guidance on 9th November and is now looking for organic growth in net sales of 6-7% (vs around 6% at the time of the IPO) with underlying EBITDA margin of 35-36% (calculated on net sales). No guidance was given for gross sales and unadjusted EBITDA obviously, a fact which we regret since these are the only data that enable comparison of profitability levels with European peers (see Section 5.1). Nets does not intend to halt investments since it should continue to underpin growth and innovation with capex that it estimates at around 10% of net sales (vs. 10-12% previously), namely 8% of gross sales. Note that it provides no guidance by business, but we consider the Merchant Services division is the one that harbours the highest potential, thanks in particular to rising transaction volumes in Sweden (since the takeover of Nordea Kortaccept: net sales of around DKK200m). Finally, we believe that it should continue to make the most of natural cross-selling and up-selling between the divisions (by focusing especially on its ability to provide end-to-end integrated payments solutions).
Fig. 44: Guidance for 2016
2016 guidance Upgraded 2016 guidance (09/11/16)
Organic net revenue growth ~6% based on adjusted 2015 revenue of
DKK6,928m
6-7%
EBITDA margin before special items (% of net revenue)
~35% 35-36%
Capex Capex will be affected by e.g. investment in
new data centre and hence expected to be at
elevated level of 10-12% of net revenue
Capex will be affected by e.g. investment in
new data centre and hence expected to be at
elevated level of around 10% of net revenue
Special items In 2016, special items on EBITDA level are
expected at DKK800m (of which ~DKK475m
are IPO related)
DKK630m, of which approx. DKK290m are IPO
related
Capital structure Leverage at year-end 2016 slightly below
expected IPO leverage of 3.75x
At or below 3.4x
Source: Company.
The group's transformation plan should continue to pay off over the next three years. Indeed, it should help unlock recurring cost savings and operating efficiency gains.
Fig. 45: Overview of main factors associated with the group's transformation plan underway
Transformation programme Costs related to optimisation of business, e.g.: commercialisation of Merchant
Services, transformation of procurement function and processes, improving
efficiency in Technology and Operations, transformation of stability and security.
Sources: Company; Bryan, Garnier & Co.

Nets
36
6.3.1. Top-line growth In our model, we are forecasting sales of DKK10,142.9m for 2016e (+12.2% over one year, thanks to Kortaccept, organic growth not communicated but probably close to 7-8%), DKK10,852.9m in 2017e (+7%) and DKK11,449.8m in 2018 (+5.5%). These figures point to a CAGR in net sales of 6% in organic terms over 2015/18e, namely in line with management's general vision (guidance for 6-7% in 2016 and 5-6% over the medium term).
Fig. 46: Our estimate of Nets gross and net sales from 2014 to 2018e
DKK 2014 2015 2016e 2017e 2018e
Revenue (m) 8,607.0 9,040 10,142.9 10,852.9 11,449.8
Y/Y growth -0.9% 5.0% 12.2% 7.0% 5.5%
Net revenue (m) 6,546.0 6,836.0 7,310.7 7,765.8 8,193.0
Y/Y growth -2.7% 4.4% 6.9% 6.2% 5.5%
Y/Y organic growth 1.3% 5.9% 6.3% 6.2% 5.5%
Source: Bryan, Garnier & Co ests.
We expect fees received by Nets to bear up well on a group level since the decline in the average value of transactions (via mobile payments, connected watches etc.) should be offset by the ramp-up in the volume of transactions that we expect (especially in Sweden, which is the largest payments market in the Nordic region: transaction acquiring and processing for merchants and card issuing processing for banks) and its value-added services which are earnings enhancing (data analysis, risk management, fight against fraud etc.). Whether in the short or medium-terms, the Merchant Services division should be the main engine behind organic growth in sales and growth in the EBITDA margin, followed by Financial & Network Services (hope in Sweden in the card issuing processing segment but not in payment schemes since, like in Finland, the country does not have a local payment network) and finally Corporate Services (low-growth segment since penetration is high, but which should benefit from the PSD2 directive and the sale of value-added services).
Fig. 47: Organic growth in net sales by division
CAGR 2013-15 2016e Normative
Merchant Services 3% 11% 10%
Financial & Network Services 6% 9% 7%
Corporate Services 2% 1% 2%
Total group 3.6% 6.3% 6%
Sources: Bryan, Garnier & Co ests.

Nets
37
6.3.2. Profitability In terms of EBITDA, we are targeting a margin of 19.5% in 2016, 24.7% in 2017 and 26.5% in 2018e. After D&A of around 10% of sales, which should then end up moving into line with capex (as of 2020), we expect underlying EBIT margin of 21.7% in 2016e (-20bp), 22.5% in 2017e (+80bp) and 23.8% in 2018 (+130bp), but only 9.0%, 14.7% and 17.5% including non-recurring costs. Margin growth should unsurprisingly be highest in the Merchant Services business, followed by Financial Network & Services and finally Corporate Services. This logic stems above all from the mechanical operating leverage effect in this fixed-cost business (margin improvement is all the higher if sales growth is strong), together with the benefits in Sweden of the takeover of Nordea's merchant acquiring division and the opportunities created with banks in card issuing processing.
Fig. 48: Leverage effect in Merchant Acquiring business
Source: Company.
Fig. 49: Underlying EBITDA margin (in gross sales) by division Average of 2013-15 2016e Normative
Merchant Services 13.7% 18.3% 20%
Financial & Network Services 23.0% 30.5% 32%
Corporate Services 26.9% 32.2% 33%
Total group 20.6% 25.7% 27%
¹: We have presented underlying EBITDA here since Nets does not communicate the breakdown of its EBITDA by business. Sources: Bryan, Garnier & Co ests. Fig. 50: Underlying EBITDA margin¹ (on net sales) by division Average of 2013-15 2016e Normative Mid-term guidance
Merchant Services 26.1% 35.0% 39%
Financial & Network Services 27.8% 39.4% 41%
Corporate Services 27.0% 33.2% 34%
Total group 27.0% 35.7% 37% High 30s (%)
¹: We have presented underlying EBITDA here since Nets does not communicate the breakdown of its EBITDA by business Sources: Bryan, Garnier & Co ests. Fig. 51: Change in sales (DKKm) and EBTIDA margin from 2013 to 2018e (%)
Source: Bryan, Garnier & Co ests.
0.0%
5.0%
10.0%
15.0%
20.0%
25.0%
30.0%
35.0%
40.0%
0
2,000
4,000
6,000
8,000
10,000
12,000
14,000
2013 2014 2015 2016e 2017e 2018e
Sales (gross) EBITDA margin
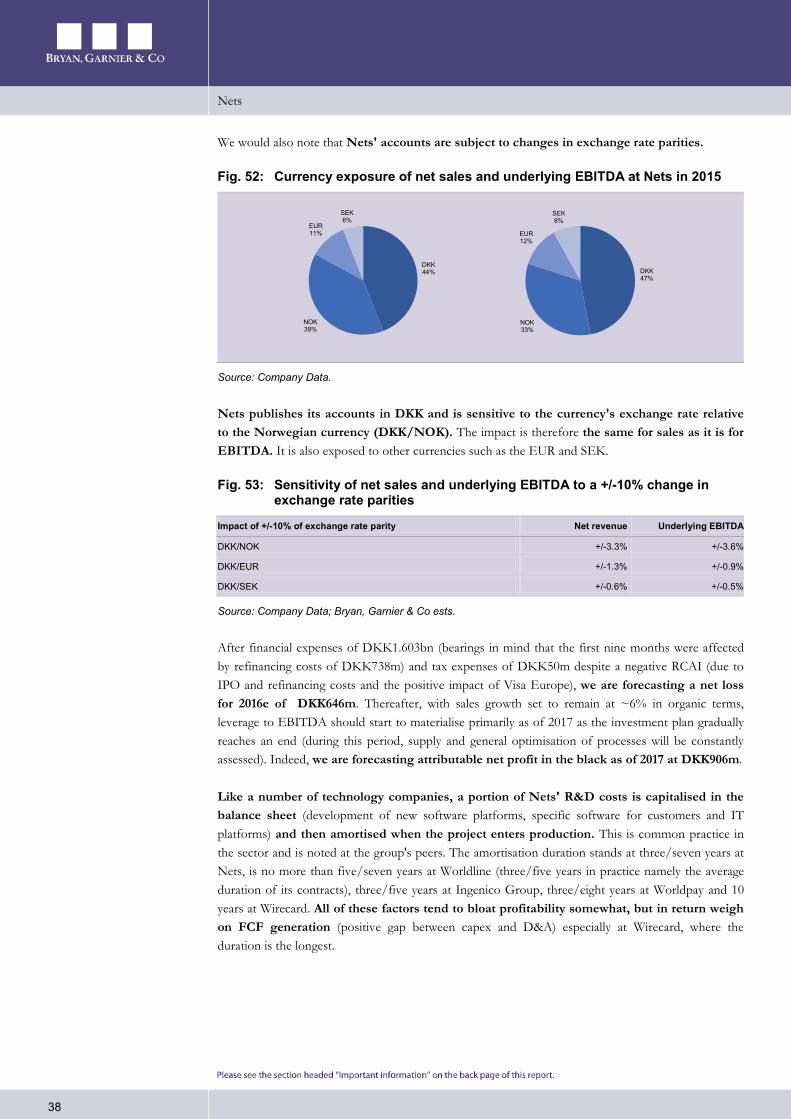
Nets
38
We would also note that Nets' accounts are subject to changes in exchange rate parities.
Fig. 52: Currency exposure of net sales and underlying EBITDA at Nets in 2015
Source: Company Data.
Nets publishes its accounts in DKK and is sensitive to the currency's exchange rate relative to the Norwegian currency (DKK/NOK). The impact is therefore the same for sales as it is for EBITDA. It is also exposed to other currencies such as the EUR and SEK.
Fig. 53: Sensitivity of net sales and underlying EBITDA to a +/-10% change in exchange rate parities
Impact of +/-10% of exchange rate parity Net revenue Underlying EBITDA
DKK/NOK +/-3.3% +/-3.6%
DKK/EUR +/-1.3% +/-0.9%
DKK/SEK +/-0.6% +/-0.5%
Source: Company Data; Bryan, Garnier & Co ests.
After financial expenses of DKK1.603bn (bearings in mind that the first nine months were affected by refinancing costs of DKK738m) and tax expenses of DKK50m despite a negative RCAI (due to IPO and refinancing costs and the positive impact of Visa Europe), we are forecasting a net loss for 2016e of DKK646m. Thereafter, with sales growth set to remain at ~6% in organic terms, leverage to EBITDA should start to materialise primarily as of 2017 as the investment plan gradually reaches an end (during this period, supply and general optimisation of processes will be constantly assessed). Indeed, we are forecasting attributable net profit in the black as of 2017 at DKK906m.
Like a number of technology companies, a portion of Nets' R&D costs is capitalised in the balance sheet (development of new software platforms, specific software for customers and IT platforms) and then amortised when the project enters production. This is common practice in the sector and is noted at the group's peers. The amortisation duration stands at three/seven years at Nets, is no more than five/seven years at Worldline (three/five years in practice namely the average duration of its contracts), three/five years at Ingenico Group, three/eight years at Worldpay and 10 years at Wirecard. All of these factors tend to bloat profitability somewhat, but in return weigh on FCF generation (positive gap between capex and D&A) especially at Wirecard, where the duration is the longest.
DKK44%
NOK39%
EUR11%
SEK6%
DKK47%
NOK33%
EUR12%
SEK8%
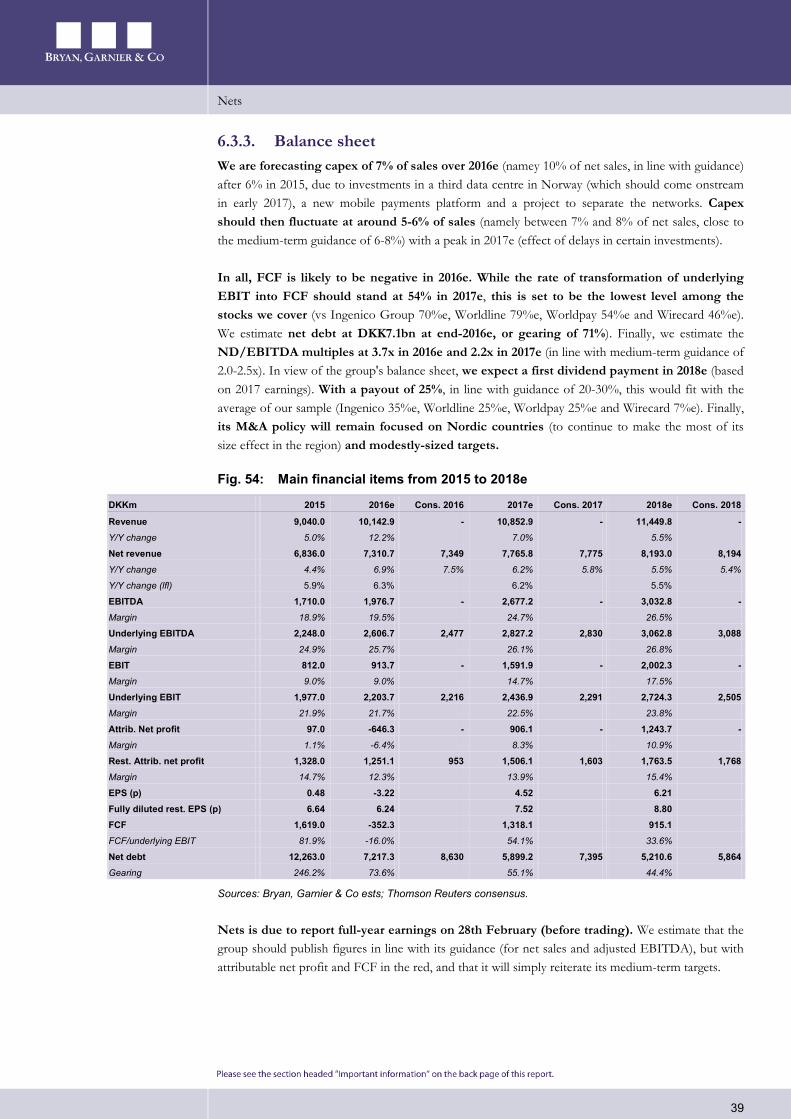
Nets
39
6.3.3. Balance sheet We are forecasting capex of 7% of sales over 2016e (namey 10% of net sales, in line with guidance) after 6% in 2015, due to investments in a third data centre in Norway (which should come onstream in early 2017), a new mobile payments platform and a project to separate the networks. Capex should then fluctuate at around 5-6% of sales (namely between 7% and 8% of net sales, close to the medium-term guidance of 6-8%) with a peak in 2017e (effect of delays in certain investments).
In all, FCF is likely to be negative in 2016e. While the rate of transformation of underlying EBIT into FCF should stand at 54% in 2017e, this is set to be the lowest level among the stocks we cover (vs Ingenico Group 70%e, Worldline 79%e, Worldpay 54%e and Wirecard 46%e). We estimate net debt at DKK7.1bn at end-2016e, or gearing of 71%). Finally, we estimate the ND/EBITDA multiples at 3.7x in 2016e and 2.2x in 2017e (in line with medium-term guidance of 2.0-2.5x). In view of the group's balance sheet, we expect a first dividend payment in 2018e (based on 2017 earnings). With a payout of 25%, in line with guidance of 20-30%, this would fit with the average of our sample (Ingenico 35%e, Worldline 25%e, Worldpay 25%e and Wirecard 7%e). Finally, its M&A policy will remain focused on Nordic countries (to continue to make the most of its size effect in the region) and modestly-sized targets.
Fig. 54: Main financial items from 2015 to 2018e
DKKm 2015 2016e Cons. 2016 2017e Cons. 2017 2018e Cons. 2018
Revenue 9,040.0 10,142.9 - 10,852.9 - 11,449.8 - Y/Y change 5.0% 12.2% 7.0% 5.5%
Net revenue 6,836.0 7,310.7 7,349 7,765.8 7,775 8,193.0 8,194 Y/Y change 4.4% 6.9% 7.5% 6.2% 5.8% 5.5% 5.4%
Y/Y change (lfl) 5.9% 6.3% 6.2% 5.5%
EBITDA 1,710.0 1,976.7 - 2,677.2 - 3,032.8 - Margin 18.9% 19.5% 24.7% 26.5%
Underlying EBITDA 2,248.0 2,606.7 2,477 2,827.2 2,830 3,062.8 3,088 Margin 24.9% 25.7% 26.1% 26.8%
EBIT 812.0 913.7 - 1,591.9 - 2,002.3 - Margin 9.0% 9.0% 14.7% 17.5%
Underlying EBIT 1,977.0 2,203.7 2,216 2,436.9 2,291 2,724.3 2,505 Margin 21.9% 21.7% 22.5% 23.8%
Attrib. Net profit 97.0 -646.3 - 906.1 - 1,243.7 - Margin 1.1% -6.4% 8.3% 10.9%
Rest. Attrib. net profit 1,328.0 1,251.1 953 1,506.1 1,603 1,763.5 1,768 Margin 14.7% 12.3% 13.9% 15.4%
EPS (p) 0.48 -3.22 4.52 6.21 Fully diluted rest. EPS (p) 6.64 6.24 7.52 8.80 FCF 1,619.0 -352.3 1,318.1 915.1 FCF/underlying EBIT 81.9% -16.0% 54.1% 33.6%
Net debt 12,263.0 7,217.3 8,630 5,899.2 7,395 5,210.6 5,864 Gearing 246.2% 73.6% 55.1% 44.4%
Sources: Bryan, Garnier & Co ests; Thomson Reuters consensus.
Nets is due to report full-year earnings on 28th February (before trading). We estimate that the group should publish figures in line with its guidance (for net sales and adjusted EBITDA), but with attributable net profit and FCF in the red, and that it will simply reiterate its medium-term targets.
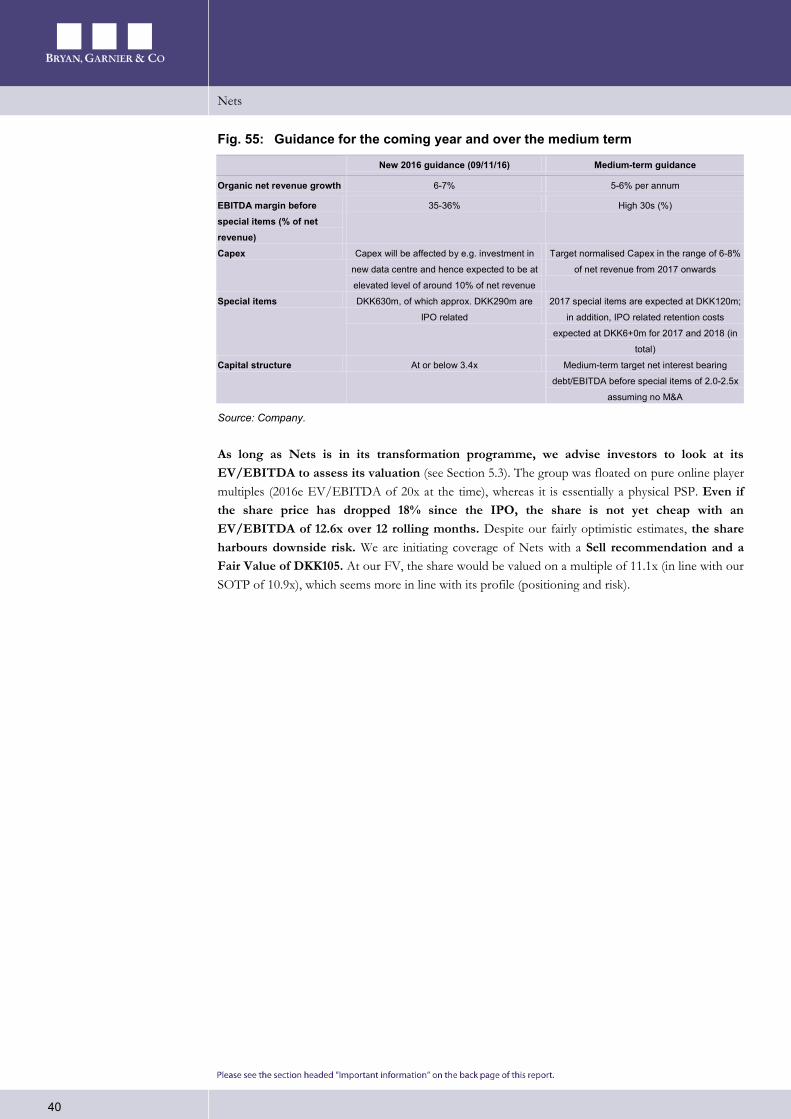
Nets
40
Fig. 55: Guidance for the coming year and over the medium term
New 2016 guidance (09/11/16) Medium-term guidance
Organic net revenue growth 6-7% 5-6% per annum
EBITDA margin before special items (% of net revenue)
35-36% High 30s (%)
Capex Capex will be affected by e.g. investment in
new data centre and hence expected to be at
elevated level of around 10% of net revenue
Target normalised Capex in the range of 6-8%
of net revenue from 2017 onwards
Special items DKK630m, of which approx. DKK290m are
IPO related
2017 special items are expected at DKK120m;
in addition, IPO related retention costs
expected at DKK6+0m for 2017 and 2018 (in
total)
Capital structure At or below 3.4x Medium-term target net interest bearing
debt/EBITDA before special items of 2.0-2.5x
assuming no M&A
Source: Company.
As long as Nets is in its transformation programme, we advise investors to look at its EV/EBITDA to assess its valuation (see Section 5.3). The group was floated on pure online player multiples (2016e EV/EBITDA of 20x at the time), whereas it is essentially a physical PSP. Even if the share price has dropped 18% since the IPO, the share is not yet cheap with an EV/EBITDA of 12.6x over 12 rolling months. Despite our fairly optimistic estimates, the share harbours downside risk. We are initiating coverage of Nets with a Sell recommendation and a Fair Value of DKK105. At our FV, the share would be valued on a multiple of 11.1x (in line with our SOTP of 10.9x), which seems more in line with its profile (positioning and risk).
Nets
41
7. Things are changing for PSPs! 7.1. A fragmented market The payment services market is very fragmented, with a handful of global payments groups, small local players or client types and specialists in a specific niche (whether in terms of expertise or coverage framed by a partnership). We believe the most prosperous companies in the industry will be those that succeed in supplying merchants access and connections to global payment networks, offering extensive payment capacity and value added adapted to the markets service. All this while amortising their platforms over increasingly large transaction volumes since the business is a mainly fixed-cost one.
As the market changes, we estimate that the key factors for success in payment services lie in the ability of PSPs to:
• Maximise acceptance of transactions while minimising the risk of fraud (players that offer end-to-end coverage and a state-of-the-art technology will be able to face the threats that arise).
• Have a genuine omni-channel offer (PSPs need to supply a wide range of integrated payment channels in order to maximise sales opportunities and ensure the reconciliation in a single place).
• Follow and accompany clients abroad (service providers need to set up a global network to provide access to a global market by offering local and alternative payment methods, currency conversion and settlement services).
• Generate operating leverage on the volume of transactions processed by their platforms (PSPs capable of capturing significant volumes via their technological architecture should benefit from economies of scale, and greater data to exploit, which should enable them to invest in new products and services destined for merchants).
Since the widespread adoption of payment services (especially since the 1970s with smartcards, which have become a global standard) and government incentives in this respect (traceability for tax collection), we have witnessed the gradual disappearance of cash and checks to the benefit of electronic payments. This segment includes credit, debit and prepaid cards and numerous other payment forms whether international, local or alternative. The large number of payment means are increasingly complex and accepted in a wide range of channels, whether on a payment terminal in-store, over the internet or on a mobile device. In this context, we estimate that merchants now need their PSPs more than ever, especially to process their transactions in a secure and reliable way but also to give them the possibility of generating sales over more channels, to open up to new markets, interpret the data collected during the transactions and maximise the payment acceptance rate while minimising fraud.
7.2. Operations destined to continue We estimate that the development of card payments (gradual disappearance of cash and checks, decline in interchange fees in Europe, 50% of the payment market is still internalised by banks in Europe vs. 20-30% in the US), e-commerce (6% of retail commerce in the world is e-commerce, according to McKinsey) and rising demand for digital security (>60% of the value of global fraud is on internet and around 50% in Europe) should cross a genuine threshold in coming years.
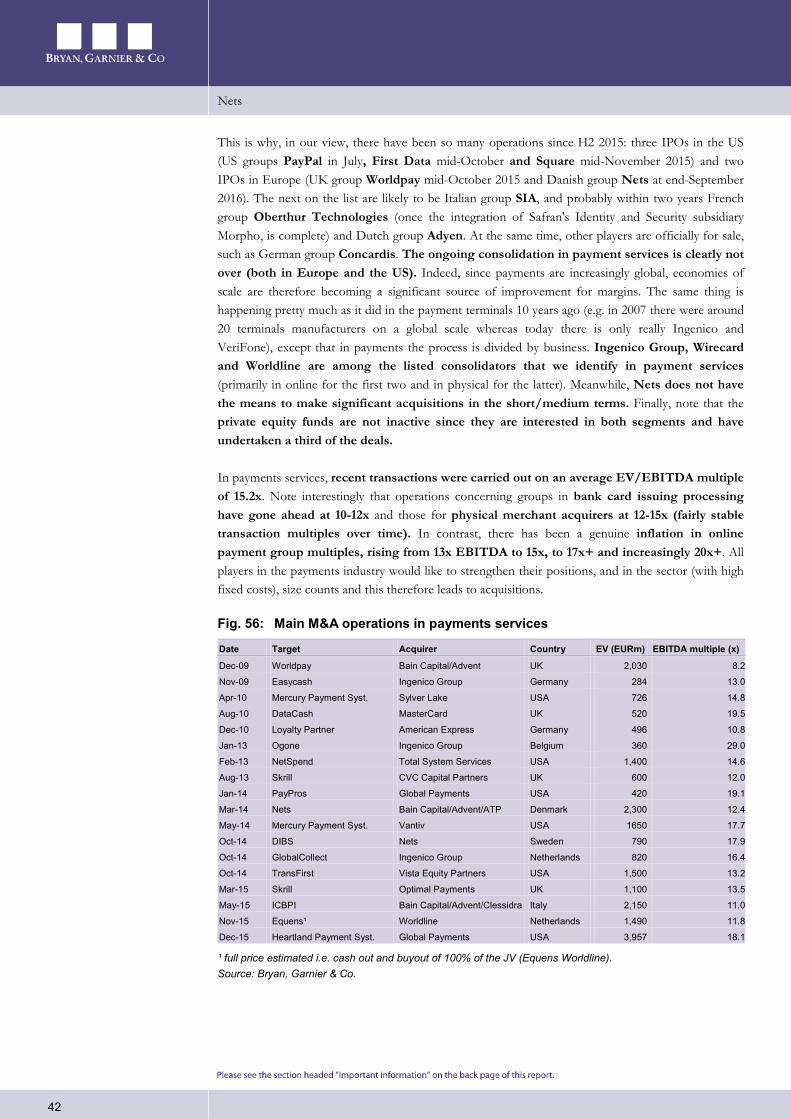
Nets
42
This is why, in our view, there have been so many operations since H2 2015: three IPOs in the US (US groups PayPal in July, First Data mid-October and Square mid-November 2015) and two IPOs in Europe (UK group Worldpay mid-October 2015 and Danish group Nets at end-September 2016). The next on the list are likely to be Italian group SIA, and probably within two years French group Oberthur Technologies (once the integration of Safran's Identity and Security subsidiary Morpho, is complete) and Dutch group Adyen. At the same time, other players are officially for sale, such as German group Concardis. The ongoing consolidation in payment services is clearly not over (both in Europe and the US). Indeed, since payments are increasingly global, economies of scale are therefore becoming a significant source of improvement for margins. The same thing is happening pretty much as it did in the payment terminals 10 years ago (e.g. in 2007 there were around 20 terminals manufacturers on a global scale whereas today there is only really Ingenico and VeriFone), except that in payments the process is divided by business. Ingenico Group, Wirecard and Worldline are among the listed consolidators that we identify in payment services (primarily in online for the first two and in physical for the latter). Meanwhile, Nets does not have the means to make significant acquisitions in the short/medium terms. Finally, note that the private equity funds are not inactive since they are interested in both segments and have undertaken a third of the deals.
In payments services, recent transactions were carried out on an average EV/EBITDA multiple of 15.2x. Note interestingly that operations concerning groups in bank card issuing processing have gone ahead at 10-12x and those for physical merchant acquirers at 12-15x (fairly stable transaction multiples over time). In contrast, there has been a genuine inflation in online payment group multiples, rising from 13x EBITDA to 15x, to 17x+ and increasingly 20x+. All players in the payments industry would like to strengthen their positions, and in the sector (with high fixed costs), size counts and this therefore leads to acquisitions.
Fig. 56: Main M&A operations in payments services
Date Target Acquirer Country EV (EURm) EBITDA multiple (x)
Dec-09 Worldpay Bain Capital/Advent UK 2,030 8.2
Nov-09 Easycash Ingenico Group Germany 284 13.0
Apr-10 Mercury Payment Syst. Sylver Lake USA 726 14.8
Aug-10 DataCash MasterCard UK 520 19.5
Dec-10 Loyalty Partner American Express Germany 496 10.8
Jan-13 Ogone Ingenico Group Belgium 360 29.0
Feb-13 NetSpend Total System Services USA 1,400 14.6
Aug-13 Skrill CVC Capital Partners UK 600 12.0
Jan-14 PayPros Global Payments USA 420 19.1
Mar-14 Nets Bain Capital/Advent/ATP Denmark 2,300 12.4
May-14 Mercury Payment Syst. Vantiv USA 1650 17.7
Oct-14 DIBS Nets Sweden 790 17.9
Oct-14 GlobalCollect Ingenico Group Netherlands 820 16.4
Oct-14 TransFirst Vista Equity Partners USA 1,500 13.2
Mar-15 Skrill Optimal Payments UK 1,100 13.5
May-15 ICBPI Bain Capital/Advent/Clessidra Italy 2,150 11.0
Nov-15 Equens¹ Worldline Netherlands 1,490 11.8
Dec-15 Heartland Payment Syst. Global Payments USA 3,957 18.1
¹ full price estimated i.e. cash out and buyout of 100% of the JV (Equens Worldline). Source: Bryan, Garnier & Co.
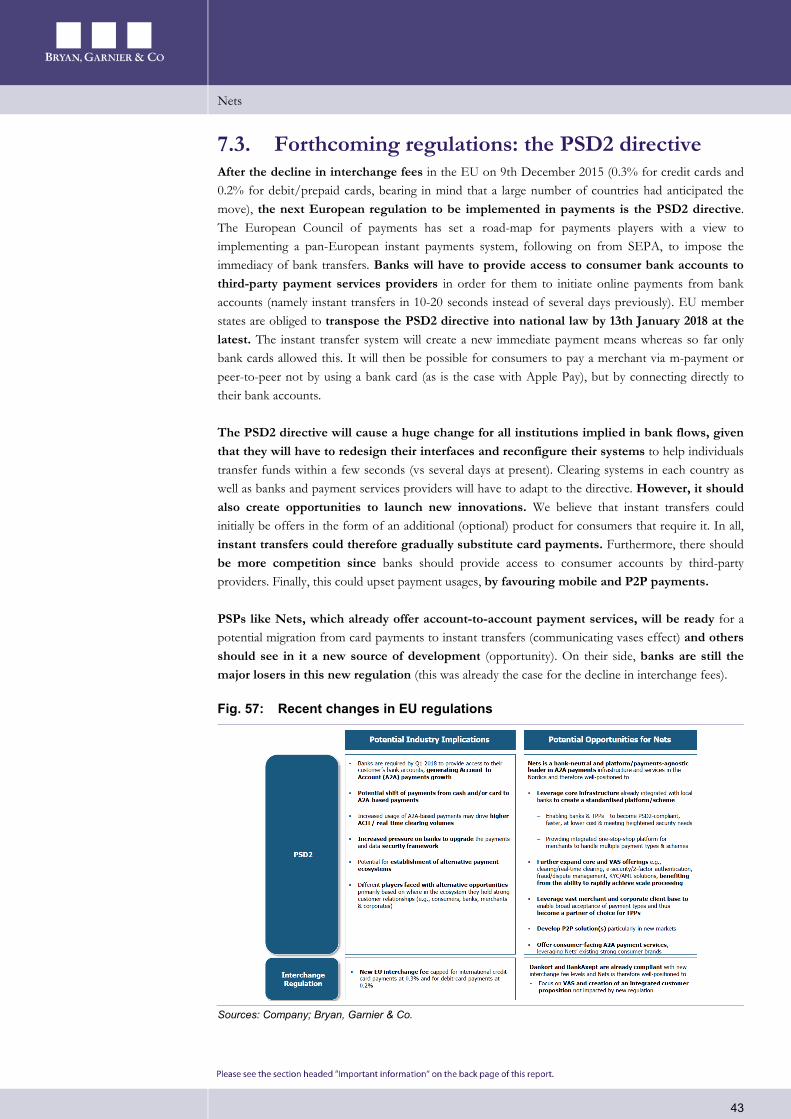
Nets
43
7.3. Forthcoming regulations: the PSD2 directive After the decline in interchange fees in the EU on 9th December 2015 (0.3% for credit cards and 0.2% for debit/prepaid cards, bearing in mind that a large number of countries had anticipated the move), the next European regulation to be implemented in payments is the PSD2 directive. The European Council of payments has set a road-map for payments players with a view to implementing a pan-European instant payments system, following on from SEPA, to impose the immediacy of bank transfers. Banks will have to provide access to consumer bank accounts to third-party payment services providers in order for them to initiate online payments from bank accounts (namely instant transfers in 10-20 seconds instead of several days previously). EU member states are obliged to transpose the PSD2 directive into national law by 13th January 2018 at the latest. The instant transfer system will create a new immediate payment means whereas so far only bank cards allowed this. It will then be possible for consumers to pay a merchant via m-payment or peer-to-peer not by using a bank card (as is the case with Apple Pay), but by connecting directly to their bank accounts.
The PSD2 directive will cause a huge change for all institutions implied in bank flows, given that they will have to redesign their interfaces and reconfigure their systems to help individuals transfer funds within a few seconds (vs several days at present). Clearing systems in each country as well as banks and payment services providers will have to adapt to the directive. However, it should also create opportunities to launch new innovations. We believe that instant transfers could initially be offers in the form of an additional (optional) product for consumers that require it. In all, instant transfers could therefore gradually substitute card payments. Furthermore, there should be more competition since banks should provide access to consumer accounts by third-party providers. Finally, this could upset payment usages, by favouring mobile and P2P payments.
PSPs like Nets, which already offer account-to-account payment services, will be ready for a potential migration from card payments to instant transfers (communicating vases effect) and others should see in it a new source of development (opportunity). On their side, banks are still the major losers in this new regulation (this was already the case for the decline in interchange fees).
Fig. 57: Recent changes in EU regulations
Sources: Company; Bryan, Garnier & Co.

Nets
44
Page left blank intentionally

Nets
45
Page left blank intentionally

Nets
46
Page left blank intentionally
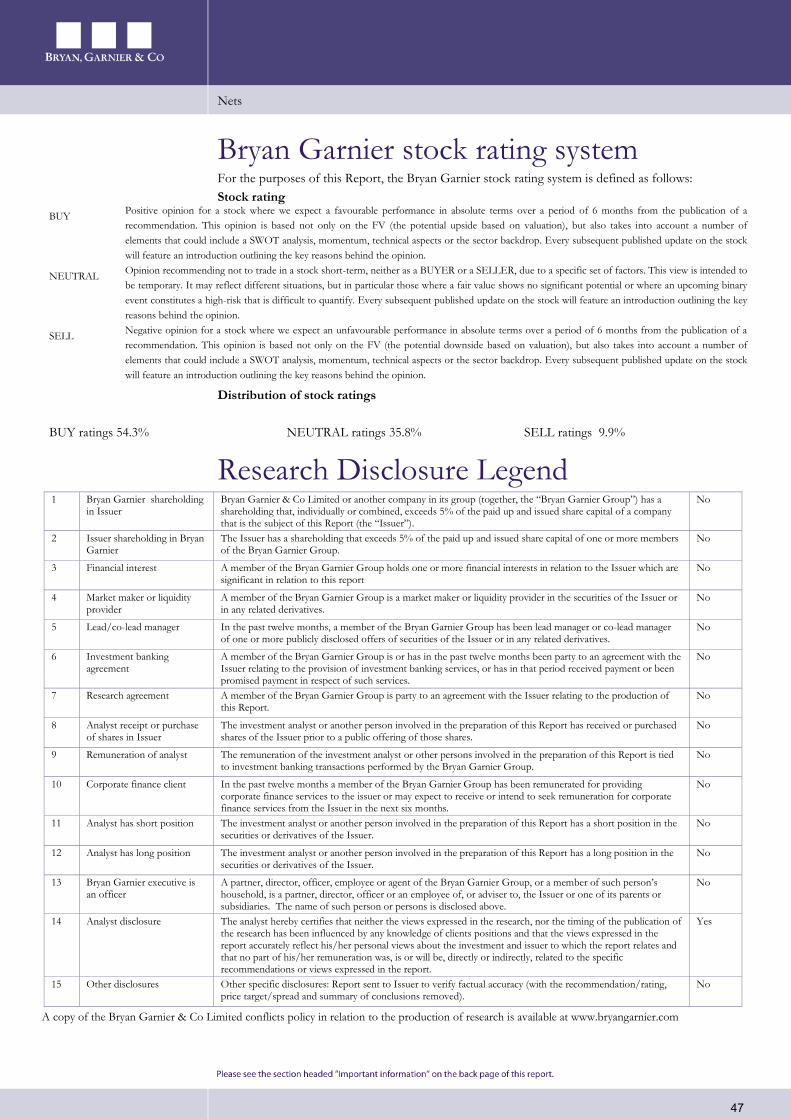
Nets
47
Bryan Garnier stock rating system For the purposes of this Report, the Bryan Garnier stock rating system is defined as follows: Stock rating
BUY Positive opinion for a stock where we expect a favourable performance in absolute terms over a period of 6 months from the publication of a recommendation. This opinion is based not only on the FV (the potential upside based on valuation), but also takes into account a number of elements that could include a SWOT analysis, momentum, technical aspects or the sector backdrop. Every subsequent published update on the stock will feature an introduction outlining the key reasons behind the opinion.
NEUTRAL Opinion recommending not to trade in a stock short-term, neither as a BUYER or a SELLER, due to a specific set of factors. This view is intended to be temporary. It may reflect different situations, but in particular those where a fair value shows no significant potential or where an upcoming binary event constitutes a high-risk that is difficult to quantify. Every subsequent published update on the stock will feature an introduction outlining the key reasons behind the opinion.
SELL Negative opinion for a stock where we expect an unfavourable performance in absolute terms over a period of 6 months from the publication of a recommendation. This opinion is based not only on the FV (the potential downside based on valuation), but also takes into account a number of elements that could include a SWOT analysis, momentum, technical aspects or the sector backdrop. Every subsequent published update on the stock will feature an introduction outlining the key reasons behind the opinion.
Distribution of stock ratings
BUY ratings 54.3% NEUTRAL ratings 35.8% SELL ratings 9.9%
Research Disclosure Legend
1 Bryan Garnier shareholding in Issuer
Bryan Garnier & Co Limited or another company in its group (together, the “Bryan Garnier Group”) has a shareholding that, individually or combined, exceeds 5% of the paid up and issued share capital of a company that is the subject of this Report (the “Issuer”).
No
2 Issuer shareholding in Bryan Garnier
The Issuer has a shareholding that exceeds 5% of the paid up and issued share capital of one or more members of the Bryan Garnier Group.
No
3 Financial interest A member of the Bryan Garnier Group holds one or more financial interests in relation to the Issuer which are significant in relation to this report
No
4 Market maker or liquidity provider
A member of the Bryan Garnier Group is a market maker or liquidity provider in the securities of the Issuer or in any related derivatives.
No
5 Lead/co-lead manager In the past twelve months, a member of the Bryan Garnier Group has been lead manager or co-lead manager of one or more publicly disclosed offers of securities of the Issuer or in any related derivatives.
No
6 Investment banking agreement
A member of the Bryan Garnier Group is or has in the past twelve months been party to an agreement with the Issuer relating to the provision of investment banking services, or has in that period received payment or been promised payment in respect of such services.
No
7 Research agreement A member of the Bryan Garnier Group is party to an agreement with the Issuer relating to the production of this Report.
No
8 Analyst receipt or purchase of shares in Issuer
The investment analyst or another person involved in the preparation of this Report has received or purchased shares of the Issuer prior to a public offering of those shares.
No
9 Remuneration of analyst The remuneration of the investment analyst or other persons involved in the preparation of this Report is tied to investment banking transactions performed by the Bryan Garnier Group.
No
10 Corporate finance client In the past twelve months a member of the Bryan Garnier Group has been remunerated for providing corporate finance services to the issuer or may expect to receive or intend to seek remuneration for corporate finance services from the Issuer in the next six months.
No
11 Analyst has short position The investment analyst or another person involved in the preparation of this Report has a short position in the securities or derivatives of the Issuer.
No
12 Analyst has long position The investment analyst or another person involved in the preparation of this Report has a long position in the securities or derivatives of the Issuer.
No
13 Bryan Garnier executive is an officer
A partner, director, officer, employee or agent of the Bryan Garnier Group, or a member of such person’s household, is a partner, director, officer or an employee of, or adviser to, the Issuer or one of its parents or subsidiaries. The name of such person or persons is disclosed above.
No
14 Analyst disclosure The analyst hereby certifies that neither the views expressed in the research, nor the timing of the publication of the research has been influenced by any knowledge of clients positions and that the views expressed in the report accurately reflect his/her personal views about the investment and issuer to which the report relates and that no part of his/her remuneration was, is or will be, directly or indirectly, related to the specific recommendations or views expressed in the report.
Yes
15 Other disclosures Other specific disclosures: Report sent to Issuer to verify factual accuracy (with the recommendation/rating, price target/spread and summary of conclusions removed).
No
A copy of the Bryan Garnier & Co Limited conflicts policy in relation to the production of research is available at www.bryangarnier.com
London
Beaufort House
15 St. Botolph Street
London EC3A 7BB
Tel: +44 (0) 207 332 2500
Fax: +44 (0) 207 332 2559
Authorised and regulated by the Financial
Conduct Authority (FCA)
Paris
26 Avenue des Champs Elysées
75008 Paris
Tel: +33 (0) 1 56 68 75 00
Fax: +33 (0) 1 56 68 75 01
Regulated by the
Financial Conduct Authority (FCA) and
the Autorité de Contrôle prudential et de
resolution (ACPR)
New York
750 Lexington Avenue
New York, NY 10022
Tel: +1 (0) 212 337 7000
Fax: +1 (0) 212 337 7002
FINRA and SIPC member
Munich
Widenmayerstrasse 29
80538 Munich
Germany +49 89 2422 62 11
Important information This document is classified under the FCA Handbook as being investment research (independent research). Bryan Garnier & Co Limited has in place the measures and arrangements required for investment research as set out in the FCA’s Conduct of Business Sourcebook. This report is prepared by Bryan Garnier & Co Limited, registered in England Number 03034095 and its MIFID branch registered in France Number 452 605 512. Bryan Garnier & Co Limited is authorised and regulated by the Financial Conduct Authority (Firm Reference Number 178733) and is a member of the London Stock Exchange. Registered address: Beaufort House 15 St. Botolph Street, London EC3A 7BB, United Kingdom This Report is provided for information purposes only and does not constitute an offer, or a solicitation of an offer, to buy or sell relevant securities, including securities mentioned in this Report and options, warrants or rights to or interests in any such securities. This Report is for general circulation to clients of the Firm and as such is not, and should not be construed as, investment advice or a personal recommendation. No account is taken of the investment objectives, financial situation or particular needs of any person. The information and opinions contained in this Report have been compiled from and are based upon generally available information which the Firm believes to be reliable but the accuracy of which cannot be guaranteed. All components and estimates given are statements of the Firm, or an associated company’s, opinion only and no express representation or warranty is given or should be implied from such statements. All opinions expressed in this Report are subject to change without notice. To the fullest extent permitted by law neither the Firm nor any associated company accept any liability whatsoever for any direct or consequential loss arising from the use of this Report. Information may be available to the Firm and/or associated companies which are not reflected in this Report. The Firm or an associated company may have a consulting relationship with a company which is the subject of this Report. This Report may not be reproduced, distributed or published by you for any purpose except with the Firm’s prior written permission. The Firm reserves all rights in relation to this Report. Past performance information contained in this Report is not an indication of future performance. The information in this report has not been audited or verified by an independent party and should not be seen as an indication of returns which might be received by investors. Similarly, where projections, forecasts, targeted or illustrative returns or related statements or expressions of opinion are given (“Forward Looking Information”) they should not be regarded as a guarantee, prediction or definitive statement of fact or probability. Actual events and circumstances are difficult or impossible to predict and will differ from assumptions. A number of factors, in addition to the risk factors stated in this Report, could cause actual results to differ materially from those in any Forward Looking Information. Disclosures specific to clients in the United Kingdom This Report has not been approved by Bryan Garnier & Co Limited for the purposes of section 21 of the Financial Services and Markets Act 2000 because it is being distributed in the United Kingdom only to persons who have been classified by Bryan Garnier & Co Limited as professional clients or eligible counterparties. Any recipient who is not such a person should return the Report to Bryan Garnier & Co Limited immediately and should not rely on it for any purposes whatsoever. Notice to US investors This research report (the “Report”) was prepared by Bryan Garnier & Co Limited for information purposes only. The Report is intended for distribution in the United States to “Major US Institutional Investors” as defined in SEC Rule 15a-6 and may not be furnished to any other person in the United States. Each Major US Institutional Investor which receives a copy of this Report by its acceptance hereof represents and agrees that it shall not distribute or provide this Report to any other person. Any US person that desires to effect transactions in any security discussed in this Report should call or write to our US affiliated broker, Bryan Garnier Securities, LLC. 750 Lexington Avenue, New York NY 10022. Telephone: 1-212-337-7000. This Report is based on information obtained from sources that Bryan Garnier & Co Limited believes to be reliable and, to the best of its knowledge, contains no misleading, untrue or false statements but which it has not independently verified. Neither Bryan Garnier & Co Limited and/or Bryan Garnier Securities LLC make no guarantee, representation or warranty as to its accuracy or completeness. Expressions of opinion herein are subject to change without notice. This Report is not an offer to buy or sell any security. Bryan Garnier Securities, LLC and/or its affiliate, Bryan Garnier & Co Limited may own more than 1% of the securities of the company(ies) which is (are) the subject matter of this Report, may act as a market maker in the securities of the company(ies) discussed herein, may manage or co-manage a public offering of securities for the subject company(ies), may sell such securities to or buy them from customers on a principal basis and may also perform or seek to perform investment banking services for the company(ies). Bryan Garnier Securities, LLC and/or Bryan Garnier & Co Limited are unaware of any actual, material conflict of interest of the research analyst who prepared this Report and are also not aware that the research analyst knew or had reason to know of any actual, material conflict of interest at the time this Report is distributed or made available..